 Min Yang1,2*
 Zhongqin Li1*Muhammad Naveed Anjum3
 Rakesh Kayastha4
 Rijan Bhakta Kayastha4
 Mukesh Rai1,2Xin Zhang1,2Chunhai Xu1,2
- 1State Key Laboratory of Cryospheric Science, Northwest Institute of Eco-Environment and Resources, Chinese Academy of Sciences, Lanzhou, China
- 2University of Chinese Academy of Sciences, Beijing, China
- 3Faculty of Agricultural Engineering and Technology, PMAS-Arid Agriculture University, Rawalpindi, Pakistan
- 4Himalayan Cryosphere, Climate and Disaster Research Center (HiCCDRC) Department of Environmental Science and Engineering, School of Science, Kathmandu University, Dhulikhel, Nepal
Analyzing climate change impacts on hydrology and future water supply projections is essential for effective water resource management and planning in the large river basins of Asia. In these regions, streamflow and glacier melt remain subject to significant uncertainties due to the lack of confidence in climate change projections and modeling methods. In this study, a glacier dynamics model (the Open Global Glacier Model was coupled with a glacio-hydrological model [the Glacio-hydrological Degree-day Model (GDM)] to predict possible hydrological changes in the head watershed of the Urumqi River under three shared socioeconomic pathways SSP2-4.5, SSP3-7.0, and SSP5-8.5. The GDM was calibrated and validated against in situ observed discharge data for the 2007–2011 and 2012–2018 periods. The resulting Nash–Sutcliffe efficiency (NSE) values were 0.82 and 0.81, respectively. The GDM was driven with an ensemble of five downscaled CMIP6 datasets to examine the potential impacts of climate change on hydrologic processes in the basin. Four runoff components were simulated with the GDM: base flow, rainfall, ice melt, and snow melt. It was determined that rainfall constituted the predominant source of runoff, followed by baseflow and ice melt. During the calibration and validation periods, snow and ice melt contributed 25.14 and 25.62%, respectively, to the total runoff. Under all SSP scenarios, the projected runoff decline indicated that the peak runoff time had passed. It was revealed that a 2°C increase in the monthly average temperature could result in a 37.7% increase in the total discharge of the basin. Moreover, the GDM was more responsive to changes in air temperature than to changes in glacier extent.
Introduction
Glaciers are magnificent natural landscape features that take decades to hundreds of years to form. In mountainous regions, glaciers are not only essential contributors to streamflow and water budgets but are also important from the perspective of the natural ecological environment (Brun et al., 2017; Gentili et al., 2020; Pelto et al., 2020). The pace at which glaciers respond to climate change is dependent on their size; the smaller a glacier is, the faster its response speed to climate change is (Huss and Fischer, 2016). According to climate projections, future increasing temperatures and variations in precipitation may impact the majority of glaciated regions and, eventually, the world’s rivers and streams (Didovets et al., 2021; Mengistu et al., 2021). Runoff records in glacierized basins can be used to determine how climatic and glacial factors interact with one another (Li et al., 2010). In general, rivers that receive substantial amounts of glacier melt are less vulnerable to droughts and floods than rivers that receive smaller amounts of glacier melt; this is due to the regulating influence of glaciers on runoff (Rai et al., 2019; Kneib et al., 2020; Wang et al., 2021). On the one hand, climate change may result in increased annual precipitation and surface runoff; on the other hand, as a result of increasing global temperatures, glaciers are experiencing accelerated retreat (Guido et al., 2016).
The effects of climate change on runoff variation are complex, especially in glacierized watersheds (Shrestha et al., 2020). Several studies have noted that the annual runoff in glacierized watersheds could increase to reach a certain maximum level and then decline with glacier retreat (Sunde et al., 2017; Laurent et al., 2020). The peak runoff timing depends on watershed location, climatic conditions, etc. (Farinotti et al., 2012). As suggested by Gaudard et al. (2014) the timing or magnitude of peak discharge should be considered individually. Changing climatic conditions and glacier evolution may distinctly affect water outflow from various watersheds due to the complexity of hydrological climatic regimes (Bhatta et al., 2019; Muñoz et al., 2021). Hydrological models are considered a modern technique to better understand long or short-term runoff changes under different climate conditions (Bolch et al., 2012). As a result, it is critical to integrate hydrological models with climate forecasts to determine the extent of runoff changes in watersheds of various sizes (Kling et al., 2014; Yang et al., 2020; Mengistu et al., 2021).
To estimate future climate change, regional climate models (RCMs) or general circulation models (GCMs) are generally used; however, the spatial resolutions of RCMs and GCMs are quite coarse. Despite the fact that many downscaling approaches have been employed, the ability of these models to capture complex spatial precipitation in Central Asian mountains remains limited, posing additional hurdles predicting runoff variations in such regions (Huang et al., 2014; Yu et al., 2018). It is particularly crucial to examine hydrological process changes in basins that are adjacent to residential areas because these runoff changes directly impact human health and well-being (Anand et al., 2018; Santos et al., 2021). Possible changes in the seasonal distribution may affect the water availability even when the changes in the total runoff are not notable (Etter et al., 2017). The water contained in the Urumqi River basin supplies water resources supporting the livelihoods of over four million people in the downstream capital city of Urumqi, as well as for agricultural irrigation in the surrounding countryside. Rapid population growth has resulted in an increase in water consumption and is exacerbating the difficulties caused by global warming.
Due to the geopolitical and socioeconomic importance of the basin, various studies have been conducted to assess potential climate change and its impacts on the hydrology of the Urumqi Basin. Previous studies in this region have mostly been based on historical runoff data; some studies have examined interannual variations, while others have investigated diurnal flow variations and their links with temperature and precipitation (Sun et al., 2015; Jia et al., 2020). In this study, we employed an ensemble of five downscaled Coupled Model Intercomparison Project 6 (CMIP6) GCM datasets and coupled two models to assess the impacts of projected climate change on water resources in the headwaters of the Urumqi River. The Open Global Glacier Model (OGGM) has been successfully applied to estimate past and future glacier evolution trends (Pelto et al., 2020; Dixit et al., 2021). The Glacio-hydrological Degree-day Model (GDM) is a gridded distributed model and has been implemented in certain basins with a satisfactory performance (Khadka et al., 2020). This model only requires a few inputs [daily precipitation and temperature, digital elevation model (DEM), and land use] and can estimate the contribution of hydrological components to discharge (ice melt, snowmelt, rain, and baseflow). Here, we aimed to 1) assess present and future runoff changes and 2) evaluation of the sensitivity of runoff to temperature, precipitation, and glacier area changes in the study basin.
Study Area and Field Measurements
Study Area
The Urumqi River originates from the eastern Tianshan Mountains, which contained more than 15,000 glaciers in the 1970s (Wang et al., 2020). Our study basin comprises the head watershed of the Urumqi River; this watershed is surrounded by high mountains and is far from the sea, with a catchment area of nearly 30 km2 and seven glaciers within the basin, as shown in Figure 1 [in the Randolph Glacier Inventory (RGI), these glaciers are considered 12 glaciers]. To maintain consistency with past research (Li et al., 2010), we consider them as seven glaciers (as marked in Figure 1). This basin is approximately 120 km away from the capital city Urumqi; the length of the stream inside the basin is approximately 12 km, and the percentage of glacierized area is approximately 18.5%. Among the seven glaciers, Urumqi Glacier No. 1 (UGN1) is the largest. In 1993, UGN1 was split into two parts, the west and east branches. Surrounded by high mountains and far from the sea, the basin has a typical continental climate. Winters are dry and cold, and summers are rainy and cool. The annual precipitation is low and concentrated and is mainly sourced from Atlantic water vapor carried by the westerly circulation system to this region. According to meteorological data retrieved from the Daxigou meteorological station for the period from 1959 to 2018, the annual average temperature is −4.9°C, with seven to eight negative-temperature months. The average temperature in the coldest month (January) reaches −15°C, while that in the hottest month (July) is 5°C. The annual average precipitation reaches 466 mm. Precipitation mainly occurs from May to August, accounting for 77% of the total annual precipitation. The precipitation type mainly includes wet snow, hail, and graupel. The glaciers in this region are of the summer accumulation type. The land use predominantly includes alpine meadows and barren land, and the elevation ranges from 3,391 to 4,459 m a.s.l.
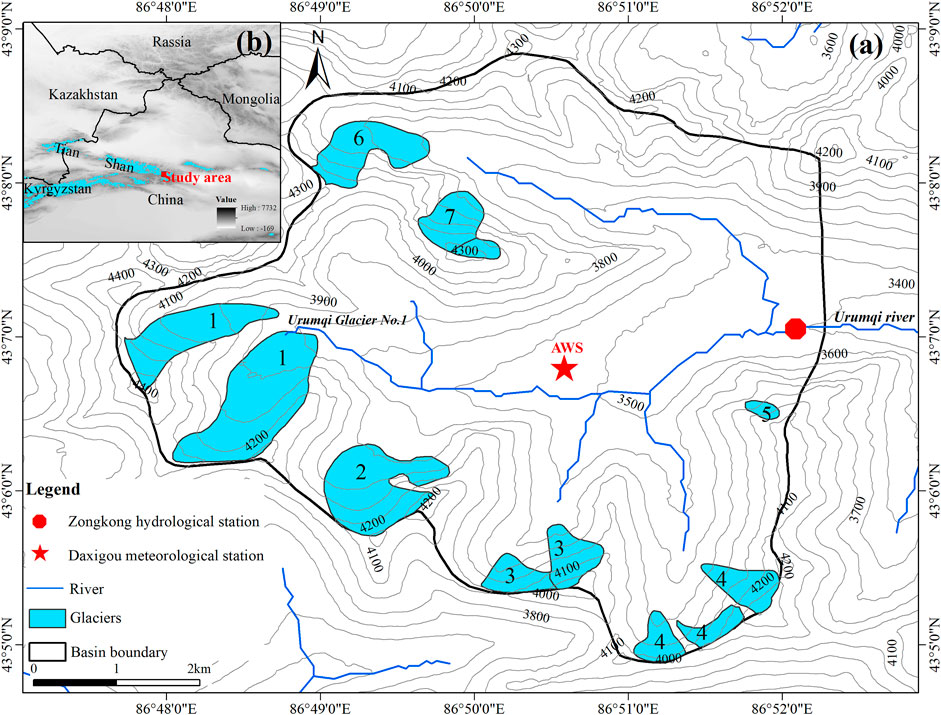
FIGURE 1. Study area description: (A) the map showing the basin (solid black line), Daxigou meteorological station (red star), and Zongkong hydrological station (red dot); (B) the geographical location of the study area.
Model Input Data
Climate Data
Monthly time series of the temperature and precipitation were obtained from the regional-scale ERA5 reanalysis dataset and employed to calibrate the temperature index model in the OGGM. These series cover the period from 1979 to 2018 (Maussion et al., 2019; Hersbach et al., 2020). Five CMIP6 datasets were selected to run the OGGM and GDM. These five CMIP6 datasets include CESM2, CESM2-WACCM, CanESM5, BCC-CSM2-MR, and NorESM2-LM. These models were chosen for their optimal performance in the Tianshan mountain region of Central Asia (Guo et al., 2021).
Spatial Data
A DEM was obtained from Shuttle Radar Topography Mission (SRTM) data with a 30-m resolution (Farr et al., 2007). The SRTM data are available on the website of the United States Geological Survey (USGS) (https://earthexplorer.usgs.gov/). The land use data were obtained from the Xinjiang and Central Asia Data Center, National Earth System Science Data Sharing Infrastructure, National Science and Technology Infrastructure of China (http://midasia.geodata.cn/).
There are six primary land use classes (forestland, grassland, wetland, cultivated land, artificial surface, and others) and thirty-eight secondary classes. We merged the datapoints indicating similar topography into six land classes to meet the requirements for the GDM to run (Khadka et al., 2020). The six land classes included agricultural lands and grasslands (class 1), forests and shrublands (class 2), barren lands (class 3), artificial surfaces and water bodies (class 4), clean-ice glaciers (class 5), and debris-covered glaciers (class 6).
Gauged Hydrometeorological Data
The daily discharge data recorded at the Zongkong hydrological station at an elevation of 3,404 m a.s.l were used to calibrate and validate the GDM. Daily temperature and precipitation data were obtained from the Daxigou meteorological station, which is at an elevation of 3,539 m a.s.l.
Methods
The OGGM and GDM were integrated in this study to analyze future runoff change in the study basin. The OGGM is a glacier dynamics model that comprises several modules. The OGGM used in this study is primarily applied to predict future glacier evolution processes. Specifically, the simulated glacier area changes obtained from the OGGM were used as inputs for the hydrological simulations conducted with the GDM. In the GDM, the land cover data and DEM were used to generate grids for further calculation. The GDM is a gridded distributed glacier hydrological model with a temperature index module that calculates snowmelt using the degree-day factor, followed by an exposed ice melt module. The total discharge is calculated from the sum of runoff from all grids, including the contributions from snow melt, ice melt, rainfall and base flow. With the future glacier area changes estimated by OGGM and downscaled future climate data (daily temperature and precipitation), the GDM can provide us with future discharge simulations. The detailed workflow of how these two models are integrated is shown in this study and is the same as that applied in (Khadka et al., 2020).
Open Global Glacier Model
The OGGM is an open-source numerical model written in Python applied and can explicitly simulate glacier dynamic evolution worldwide (Maussion et al., 2019; Pelto et al., 2020; Dixit et al., 2021). There are seven glaciers in our study area. We adopted UGN1 as an example to demonstrate the process by which the OGGM simulates glacier dynamic evolution changes.
Following specification of the glacier RGI number, the model automatically retrieved glacier outlines and projected them onto a local gridded map (Figure 2A). Simultaneously, the necessary topographical data were automatically downloaded, and the spatial resolution of these data were depended on the glacier size. Flow lines were computed with the method established by Kienholz et al. (2014), as shown in Figure 2B. The geometrical width was acquired by normally intersecting each grid point containing glacier outlines, and the catchment width was derived by normally intersecting each grid point containing flow lines (Figure 2C). To determine the ice thickness, it was necessary to first calculate the mass balance of each glacier. The mass balance model applied in the OGGM is a temperature index model (Marzeion et al., 2012). Here, monthly climate data, extracted from the nearest ERA5 dataset, were considered to calculate the mass balance. The ice thickness was then computed through mass conservation with estimated ice velocity and ice flux values (Figure 2D).
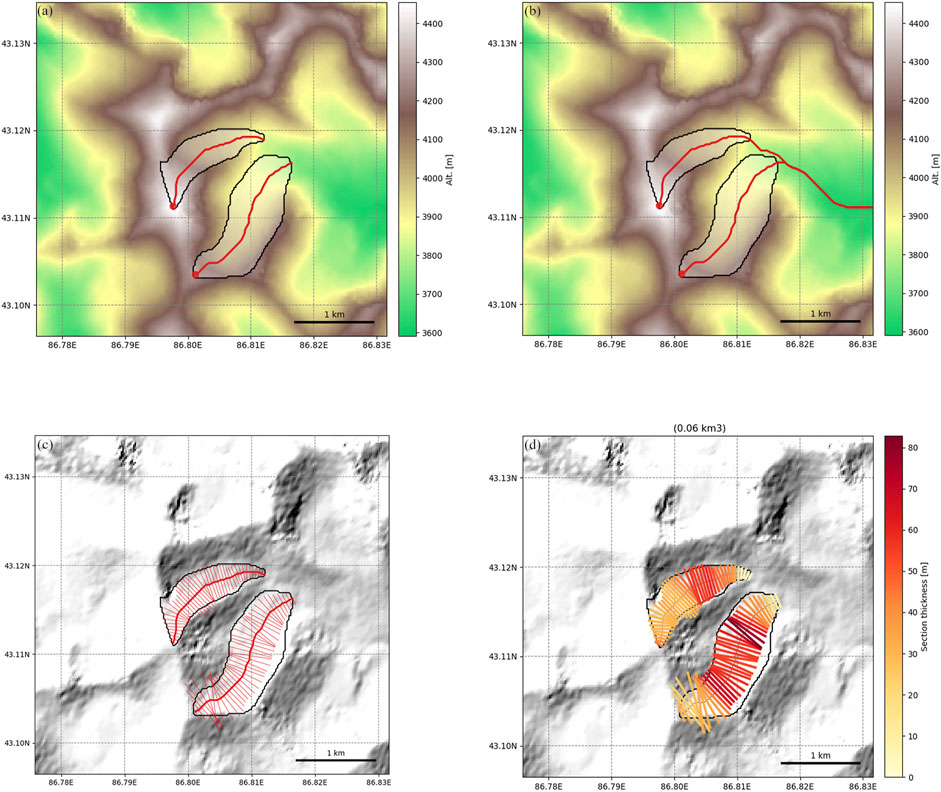
FIGURE 2. Location of Urumqi Glacier No. 1 (UGN1), which is considered an illustration; the OGGM derived outline (A), flowline (B), catchment width (C), and ice thickness (D).
Moreover, future glacier changes were simulated under preselected climate time series (from the CMIP6 GCM datasets) with a dynamical flowline model. The future evolution of glaciers in the basin was simulated based on individual glacier calculations.
Glacio-Hydrological Degree-Day Model
The GDM is a gridded distributed glacio-hydrological model that can simulate the daily river discharge and contributions of hydrological components (snowmelt, ice melt, rain, and baseflow) to river discharge (Kayastha et al., 2020; Khadka et al., 2020). A DEM and land cover data are required to initialize the model. The daily temperature and precipitation datasets are preliminary inputs. Initially, the study area is divided into multiple grids (300 m × 300 m). There are two modules in the GDM: the melt module and the baseflow module. The melt module is the main algorithm in the GDM platform for simulating glacio-hydrological processes. The module uses a temperature index model to estimate snow melt and clean-ice melt separately using the degree-day factors approach (Braithwaite and Olesen, 1989; Hock, 2005; Kayastha et al., 2006). In each grid, the melt estimates are calculated as follows:
where
where
The total surface discharge is the sum of the runoff values calculated from each grid and is calculated as follows:
In each grid, snow melt, ice melt, and precipitation are contributors to runoff:
where
The total surface discharge,
where
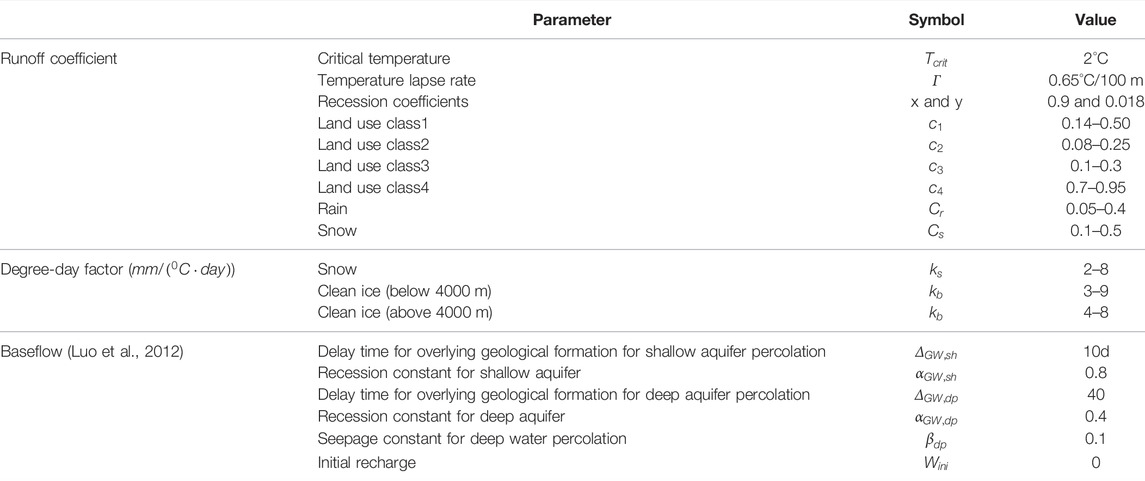
TABLE 1. Calibration parameters employed in the GDM and respective values.
A flowchart of the model coupling process and future discharge prediction is shown in Figure 3.
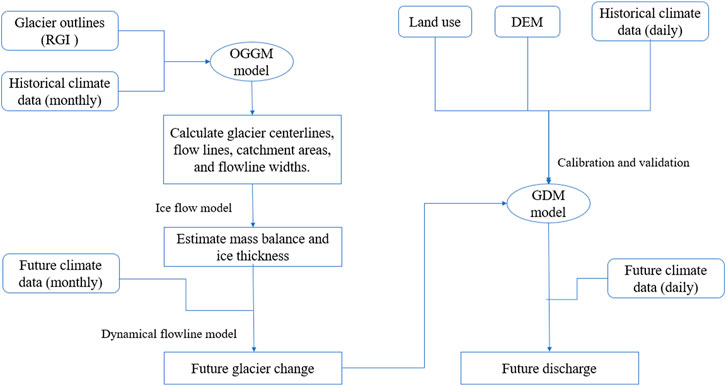
FIGURE 3. Flowchart of the models applied in this paper.
Results
Glacier Area and Volume Changes
The glacier area and volume changes simulated with the OGGM under SSP5-8.5 declined the fastest, whereas a small difference was obtained under the other two scenarios (SSP2-4.5 and SSP3-7.0) (Figure 4). All seven glaciers are expected to disappear by approximately 2070 except UGN1. The simulation started in 2007, since the glacier outlines used in this study (RGI v6.0) were generated in 2007. On average, from 2007 to 2021 (15 years), the glacier area decreased by 11%. The glacier area decreased by 55.8% by 2040 and by 89.6% by 2060 compared to their corresponding areas in 2007. The volume changes during the corresponding periods were −28.9%, −73.3%, and −91.3%. By 2080, the estimated area had decreased by 98%, and the average glacier volume had decreased by 99%. To obtain future discharge predictions, the analysis was performed from 2021 to 2100.
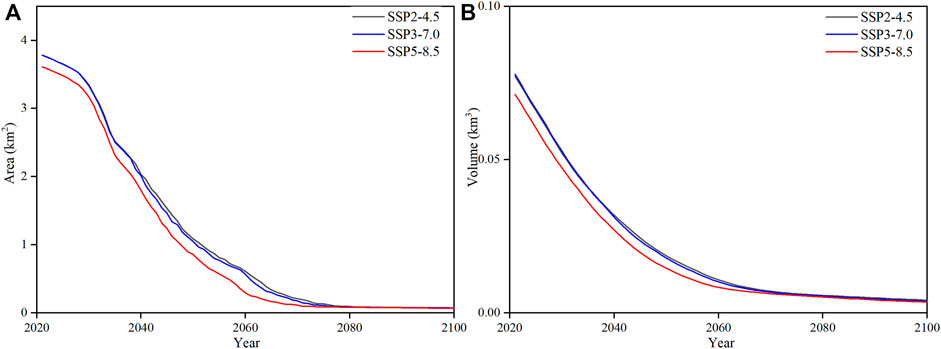
FIGURE 4. The time series plot for the glacier area (A) and volume change (B) from 2021 to 2100 under SSP2-4.5, SSP3-7.0, and SSP5-8.5 scenarios.
GDM Calibration
The calibration and validation steps conducted for the study basin are shown in Figure 5. Five years of data (2007–2011) were used for the model calibration, and 7 years of data (2012–2018) were used for the model validation. The Nash-Sutcliffe efficiency (NSE), volume difference (VD), and Pearson correlation coefficient (CC) were used to evaluate the model performance during the calibration and validation periods. We assume that if the NSE is greater than 0.7 and the VD varies within 10%, the model is accurate and reliable (Khadka et al., 2020). The detailed results of the performance scores are shown in Table 2.
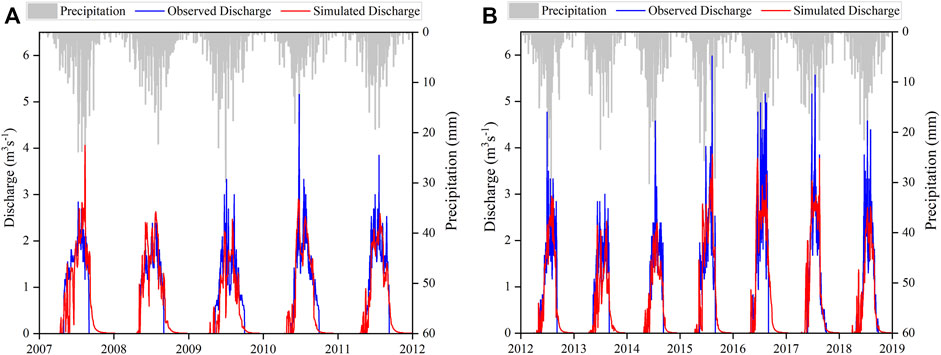
FIGURE 5. Observed and simulated total discharge represents by blue and red line respectively for the calibration period (2007–2011) (A) and validation period (2012–2018) (B).
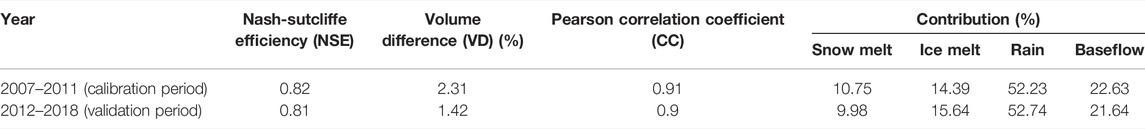
TABLE 2. Nash–Sutcliffe efficiency (NSE), volume difference (VD), and Pearson correlation coefficient (CC) values, and mean annual contributions of snow melt, ice melt, rainfall, and baseflow to river discharge during the calibration and validation periods.
When a high precipitation event occurs, the model fails to effectively represent runoff, as shown in Figure 5. In general, we can say that the GDM effectively explains the hydrological process of the head watershed of the Urumqi River basin. Moreover, the GDM estimated the contributions of snowmelt, ice melt, rain, and baseflow to river discharge during the simulation periods. The rainfall was the largest contribution to runoff, followed by baseflow and ice melt in the basin, as indicated in Table 2.
Changes in Projected Climate
Climate change projections are available from general circulation model (GCM) outputs at coarse scales (with grids usually larger than 100 × 100 km2). In general, products with this resolution cannot be used in research directly (Wilby et al., 2004). Thus, different downscaling techniques have been developed to obtain finer-resolution products, and these techniques can be divided into two general categories: statistical and dynamical downscaling. Both methods have advantages and disadvantages. Compared to dynamical downscaling, statistical downscaling models are simple and effective and have fewer computational costs (Gebrechorkos et al., 2019; Salehnia et al., 2019). In addition, statistical downscaling can produce site-specific climate projections that cannot be achieved by dynamical downscaling methods. In this study, we utilized the bias correct delta change method (Salehnia et al., 2019) among statistical downscaling approaches. The GCM outputs and observed daily temperature and precipitation data were used for the statistical downscaling training and predictions. Here, we employed an ensemble of five CMIP6 GCM datasets due to their optimal performance in the Tianshan region of Central Asia (Guo et al., 2021). These five CMIP6 datasets include CESM2, CESM2-WACCM, CanESM5, BCC-CSM2-MR, and NorESM2-LM, and observation data were obtained from the Daxigou meteorological station (AWS in Figure 1), which is located approximately 3 km from UGN1. The data recorded at the Daxigou meteorological station show an increase in the annual average temperature, especially after 1996. We chose two periods, before and after 1996 (1976–1995 and 1997–2016) to compare climate conditions. In terms of these two periods, the average temperature increased by 1.03°C (from −5.27°C to −4.24°C), and the precipitation increased by 17.8%.
The future period, 2021–2100, was divided into four periods (2021–2040, 2041–2060, 2061–2080, and 2081–2100). In each of these periods, the annual average temperature and precipitation values under three scenarios (SSP2-4.5, SSP3-7.0, and SSP5-8.5) were simulated; these values (after ensembled) are shown in Table 3 along with the baseline period (1997–2016) values for comparison.
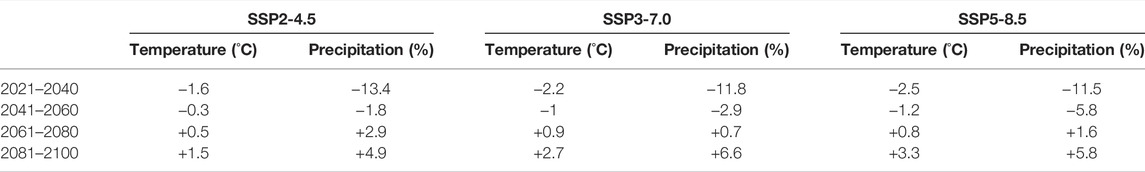
TABLE 3. Comparison of the changes in temperature and precipitation simulated with the GCM for the four future periods to the baseline period (1997–2016).
Compared to the baseline, during the first period (2021–2040), the temperature under all three scenarios (SSP2-4.5, SSP3-7.0, and SSP5-8.5) indicated a declining trend, while the temperature decreased the least under SSP2-4.5 and exhibited similar magnitudes between SSP3-7.0 and SSP5-8.5. After the first period, the temperature under all three scenarios began to slowly rise and exceeded the baseline temperature after 2060. The precipitation trend was similar to that of the temperature, and all scenarios exhibited decreasing trends to different degrees during the first period (2021–2040). The precipitation decreased the most under SSP2-4.5 and exhibited similar magnitudes under the other two SSP scenarios (SSP3-7.0 and SSP5-8.5). After the first period, the predicted precipitation exhibited an increasing trend under all SSP scenarios and exceeded the baseline precipitation after 2060.
Comparisons of the monthly average temperature and precipitation distributions simulated under three SSPs with the baseline period (1997–2016) are shown in Figure 6.
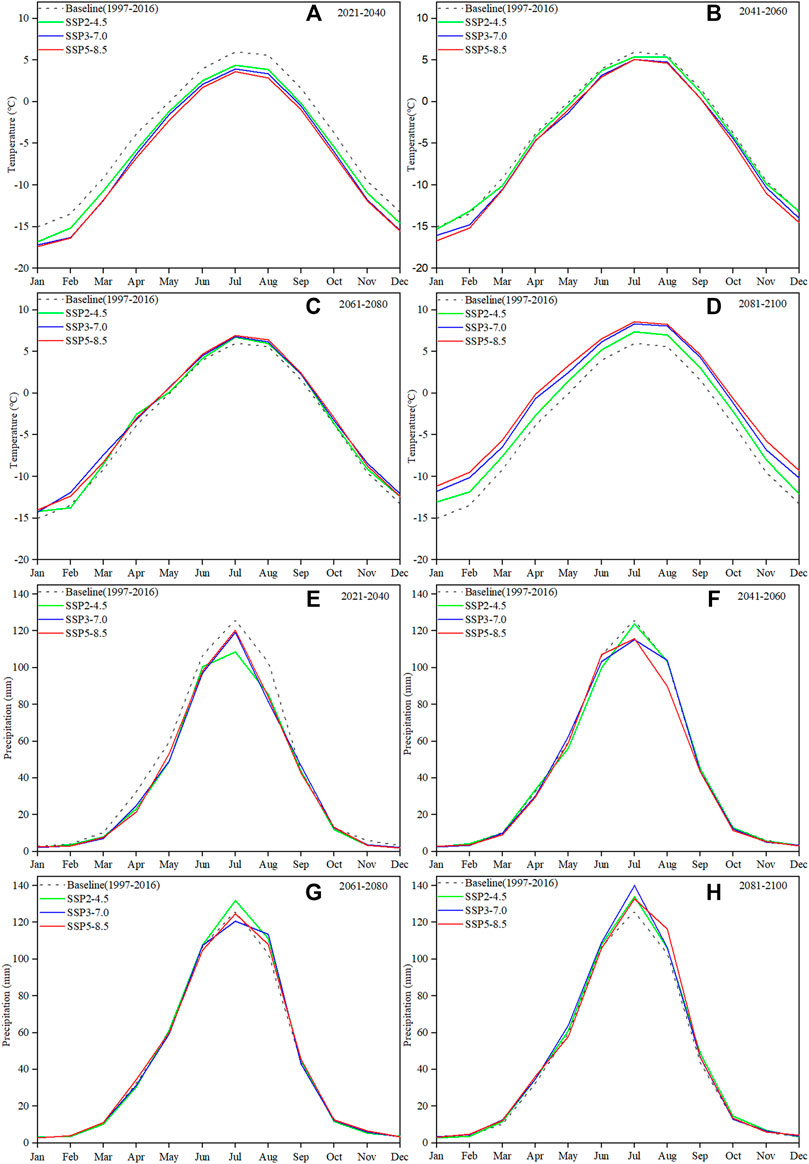
FIGURE 6. Comparison of the average monthly temperature (A–D) and precipitation (E–H) with baseline period (dashed black) and SSPs (green–SSP2-4.5, blue–SSP3-7.0, red–SSP5-8.5).
All SSP scenarios predicted a in future temperature decline followed by a continuous increase. The precipitation trend was consistent with the temperature trend. Notably, the temperature changes in all months were almost the same, while precipitation changes mainly occurred during the ablation season.
Future Discharge
To simulate future runoff, the GDM was applied. The GDM was forced through the use of downscaled climate and land cover data. To analyze the simulated runoff, the future period was separated into four periods: 2021–2040, 2041–2060, 2061–2080, and 2081–2100. In contrast to the observed meteorological dataset, our runoff observation data (observed at the Zongkong hydrology station) do not contain more than 40 years of data. There was an abrupt change in temperature after 1996, and runoff data for 1996 were missing due to floods. Hence, we choose 1997–2016 as our baseline period for comparison with the simulated future runoff. The monthly average simulated discharge totals during the four future periods (2021–2040, 2041–2060, 2061–2080, 2081–2100) under three SSPs relative to the baseline discharge are shown in Figure 7.
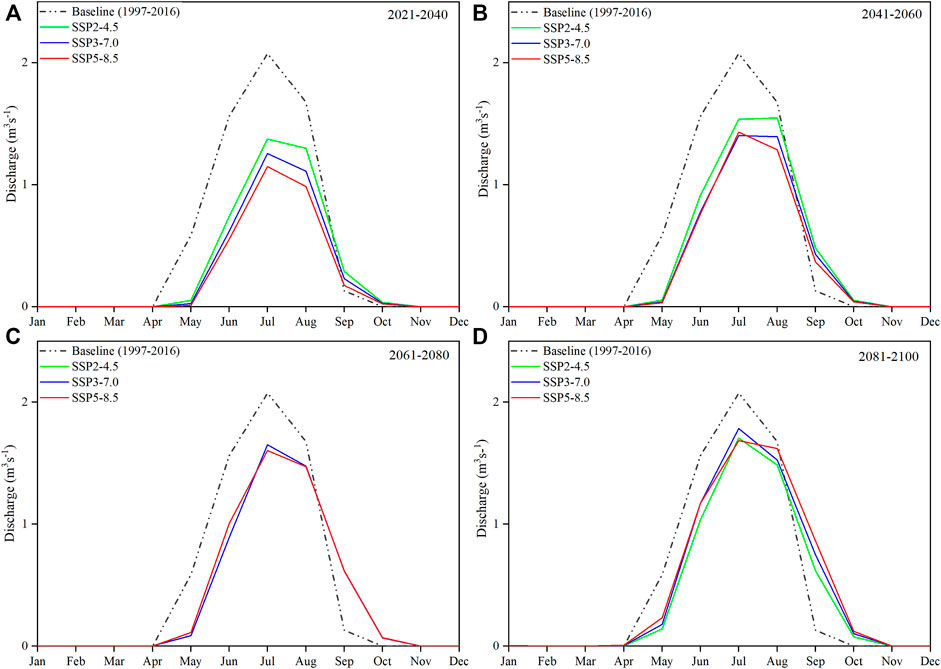
FIGURE 7. Monthly average simulated total discharge trend for 2021–2040 (A), 2041–2060 (B), 2061–2080 (C), and 2081–2100 (D) periods. The baseline period is indicated by the black dashed line, whereas solid green, blue, and red line represents SSP2-4.5, SSP3-7.0, and SSP5-8.5 scenario, respectively.
Under all SSP scenarios, the runoff exhibited an initial decreasing trend and s subsequent increasing trend, and the decrease extent during the first period was the greatest. Combined with the changes in temperature and precipitation during this period, the temperature indicated a decreasing trend under all three scenarios, while the precipitation exhibited a declining trend. Overall, temperature and precipitation reduction, in addition to glacier retreat, led to a reduced runoff during this period. This further demonstrated that the turning point of runoff in the basin had passed (Table 4). Thereafter, the runoff increased during the next three periods, mainly concentrated in the ablation season, accompanied by a rising temperature and increasing precipitation. However, the runoff never again exceeded the baseline period level, even after 2060, but both the temperature and precipitation exceeded the baseline period levels. After 2070, all glaciers in the basin, with the exception of UGN1, are expected to disappear, with ice melt no longer constituting the primary runoff component.
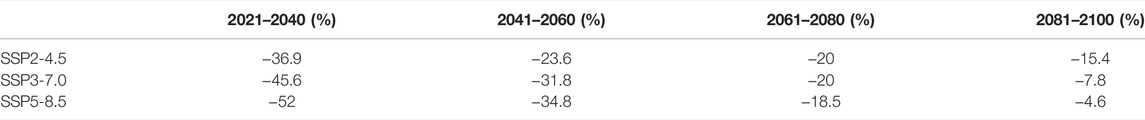
TABLE 4. Changes in the discharge compared to the baseline period (1997–2016) for the four future periods under the three SSP scenarios.
Components of Future Discharge
We simulated the future discharge under three SSP scenarios (Figure 8). For the contributions of the discharge components, we considered only SSP3-7.0 as an example to examine the changes in the components as the glacier area decreased with time (Figure 8).
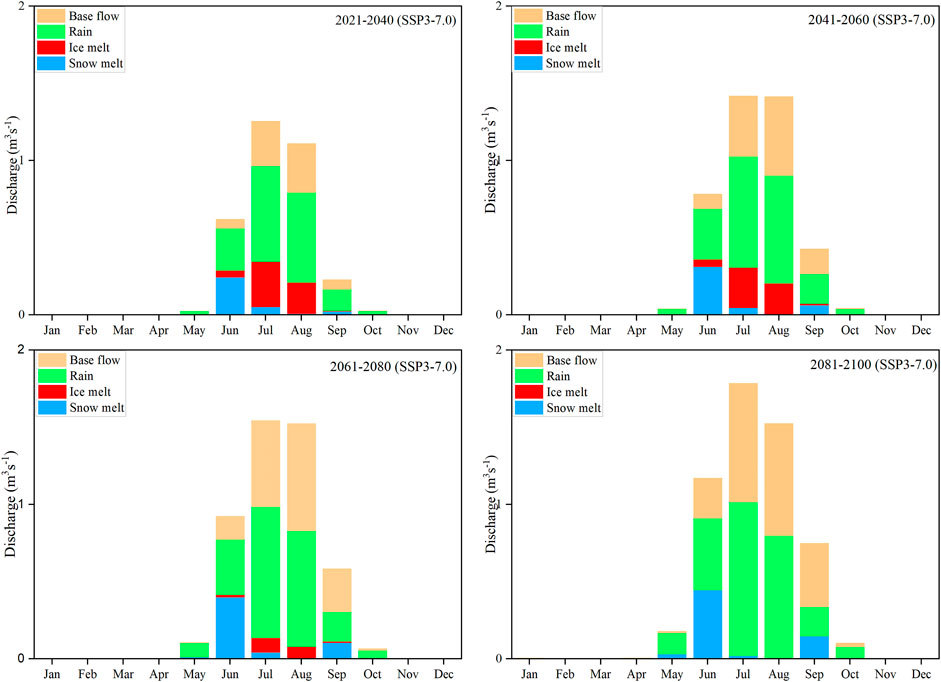
FIGURE 8. Monthly diagram illustrates the contribution from the baseflow, rain, ice melt, and snow melt during the different periods under the SSP3-7.0.
In the basin, runoff was mainly concentrated from May to August. The largest contribution to runoff was rainfall. Small but consistent declines in the contribution of rainfall were observed. Upon glacier retreat, the contribution of ice melt had small increase in the first period then showed a decline in the contribution. The contribution of ice melt decreased significantly decreased after 2060. The contribution of snowmelt showed no significant change. Moreover, the proportion of baseflow constantly increased. The contribution rate is provided in Table 5.
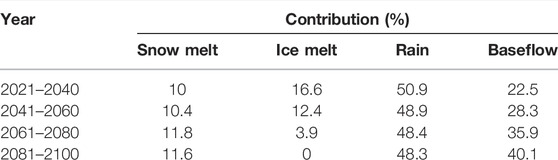
TABLE 5. Contributions of the runoff components to the future discharge under the SSP3-7.0 scenario.
Discussion
Peak Water
Previous studies have noted that dramatic warming has occurred after 1996 (Li et al., 2010). We compared 20 years of temperature and precipitation data before and after 1996. It was determined that, the average temperature increased by 1.03°C (from −5.27°C to −4.24°C), and the precipitation increased by 17.8%. In this study, we employed the latest CMIP6 data to project future runoff changes.
Ice melt and rainfall are both important elements in the maintenance of river flows in the studied catchment region. The study area will experience rapid glacier retreat (Figure 4). With temperature and precipitation reduction, runoff in this basin was predicted to go decline. The data indicated that the annual peak runoff time had passed, shown in Figure 7. This result is consistent with a previous study on the Tianshan Mountains (Xenarios et al., 2019).
Uncertainty and Sensitivity Analysis
The assessment of the future glacier area changes anticipated by the OGGM reveals the first source of uncertainty. Using monthly temperature and precipitation data, the model creates global-scale model simulations and is free to use. Our main purpose in this study was to predict future changes in water resources. The most important parameter that the OGGM can provide is future glacier area changes. Therefore, we changed the glacier area value (RGI) between 2007 and 2018 by decreasing the area by 20% and by 40%, respectively, to see what specific changes would occur in discharge after the glacier area changes (Figure 9A). Moreover, two parameters, temperature and precipitation, were chosen for the sensitivity analysis. We chose different combinations of temperature and precipitation (temperature fluctuations of 2°C and precipitation increases or decreases of 20%) to test the sensitivity of the model. Figures 9B–D shows the results of the sensitivity analysis. The changes in percentage discharge obtained through different sensitivity tests are shown in Table 6.
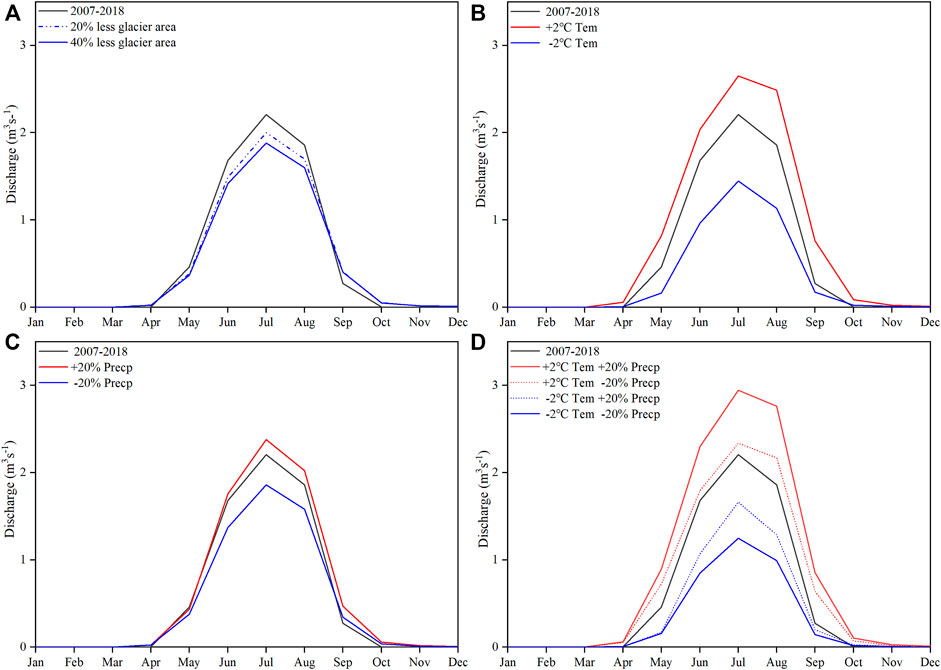
FIGURE 9. Sensitivity test of the GDM for glacier area change (A), temperature change (B), precipitation change (C), and combination of temperature and precipitation change (D) during 2017–2018.
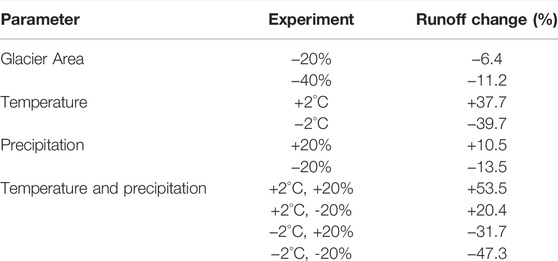
TABLE 6. Percentage of the runoff changes in the different sensitivity tests.
The analysis revealed that among the three parameters, the simulated runoff changes were most sensitive to temperature, followed by precipitation and glacier area. Temperature and precipitation are both positively correlated with runoff, and temperature plays a leading role in influencing runoff changes. When the temperature increases (+2°C), even if the precipitation decreases (−20%), the runoff increases (+20.4%). When the temperature decreases (−2°C), even if the precipitation increases (+20%), the runoff decreases (−31.7%). Moreover, the combination of increased temperature and precipitation (+2°C, + 20%) caused runoff to increase the most (+53.5%), and the combination of decreased temperature and precipitation (−2°C, −20%) caused runoff to decrease the most (−47.3%). Therefore, when using this model, the quality of the temperature dataset can affect the uncertainty of the watershed runoff simulations to the greatest extent.
Conclusion
This paper integrated glacier dynamics and glacio-hydrological models to estimate potential hydrological changes driven by downscaled future climate projections obtained with an ensemble of five CMIP6 GCMs under three SSPs in the head watershed of the Urumqi River. Both models have been successfully applied in different study areas (Kayastha et al., 2020; Pelto et al., 2020; Eis et al., 2021). The OGGM is a global-scale glacier dynamics model that can simulate contemporary and future glacier changes. The main purpose of this study was to assess the future water resources in this area, and the OGGM was implemented herein to provide future glacier changes. We performed an uncertainty (sensitivity) analysis of the GDM to temperature, precipitation, and glacier area changes and concluded that compared to the temperature and precipitation, the runoff in this basin was less dependent on changes in the glacier area.
We employed an ensemble of five CMIP6 GCM datasets (Eyring et al., 2016) to predict future glacier changes. These datasets were adopted due to the optimal performance in the Tianshan mountain region of Central Asia (Guo et al., 2021). The bias-correcting statistical downscaling method was applied in this study to obtain future climate conditions in this study area. Our main findings are summarized below.
• As simulated with the OGGM, glacier area and volume changes exhibited some differences between the different climate scenarios (SSP2-4.5, SSP3-7.0, and SSP5-8.5). The glaciers in the study basin are experiencing intense retreat, and this retreat is expected to become especially intense over the next 20 years. The OGGM estimated that the glacier area and volume could decrease by 55.8 and 73.3% by 2040, respectively, compared to the corresponding values in 2007. All glaciers in this basin will disappear completely by approximately 2070 except UGN1.
• The GDM, when calibrated, provided satisfactory discharge simulations. The NSE, VD, and CC values were 0.82, 2.31%, and 0.91, respectively, during the calibration period (2007–2011), and the values were 0.81, 1.43%, and 0.9, respectively, during the validation period (2012–2018).
• Climate change scenarios were considered to examine future temperature and precipitation changes. The results indicated that the temperature will first decrease and then rise under the different scenarios at varying rates. Compared to the most recent baseline period, precipitation indicated decreasing trends under all scenarios.
• Discharges will begin to decline, indicating the runoff peak has passed.
• The contributions of discharge components were investigated. Snowmelt maintained a rather consistent value, and baseflow yielded a gradually increasing contribution to runoff.
Data Availability Statement
The original contributions presented in the study are included in the article/Supplementary Material, further inquiries can be directed to the corresponding authors.
Author Contributions
Conceptualization: MY, ZL Data curation: ZL, CX, MY Formal analysis: MY Methodology: RBK, MY, Resources: RK, MR Software: RK, MY Visualization: MY, XZ Writing original draft: MY, RK, MA Writing review and editor: MY, RK, MA, MR.
Funding
This work was supported by the Innovative Research Groups of the National Natural Science Foundation (41721091), the National Natural Science Foundation of China (Grant Nos. 41761134093, 41471058, and 42001067), the Second Tibetan Plateau Scientific Expedition and Research (Grant No. 2019QZKK0201), the State Key Laboratory of Cryospheric Science funding (SKLCS-ZZ-2020), the Strategic Priority Research Program of Chinese Academy of Sciences (Class A, Grant Nos. XDA20060201 and XDA20020102), Natural Science Foundation of Gansu Province (21JR7RA059), National Cryosphere Desert Data Center, and Northwest Institute of Eco- Environment and Resources, Chinese Academy of Sciences. Xinjiang and Central Asia Data Center, National Earth System Science Data Sharing Infrastructure, National Science and Technology Infrastructure of China. (http://midasia.geodata.cn/). The National Key R&D Program of China (2020YFF0304400); National Science and Technology Basic Resources Survey Program of China (2019FY100202).
Conflict of Interest
The authors declare that the research was conducted in the absence of any commercial or financial relationships that could be construed as a potential conflict of interest.
Publisher’s Note
All claims expressed in this article are solely those of the authors and do not necessarily represent those of their affiliated organizations, or those of the publisher, the editors and the reviewers. Any product that may be evaluated in this article, or claim that may be made by its manufacturer, is not guaranteed or endorsed by the publisher.
Acknowledgments
We would like to thank the OGGM and GDM development team. In particular, we would like to thank RBK, RK, MR, and MA for their kind advice and valuable comments that improved the manuscript.
References
Anand, J., Gosain, A. K., Khosa, R., and Srinivasan, R. (2018). Regional Scale Hydrologic Modeling for Prediction of Water Balance, Analysis of Trends in Streamflow and Variations in Streamflow: The Case Study of the Ganga River basin. J. Hydrol. Reg. Stud. 16, 32–53. doi:10.1016/j.ejrh.2018.02.007
Bhatta, B., Shrestha, S., Shrestha, P. K., and Talchabhadel, R. (2019). Evaluation and Application of a SWAT Model to Assess the Climate Change Impact on the Hydrology of the Himalayan River Basin. Catena 181, 104082. doi:10.1016/j.catena.2019.104082
Bolch, T., Kulkarni, A., Kääb, A., Huggel, C., Paul, F., Cogley, J. G., et al. (2012). The State and Fate of Himalayan Glaciers. Science 336, 310–314. doi:10.1126/science.1215828
Braithwaite, R. J., and Olesen, O. B., 1989. Calculation of Glacier Ablation from Air Temperature, West Greenland, 219, 233. doi:10.1007/978-94-015-7823-3_15
Brun, F., Berthier, E., Wagnon, P., Kääb, A., and Geoscience, D. T.-N. (2017). A Spatially Resolved Estimate of High Mountain Asia Glacier Mass Balances from 2000 to 2016. 2017, U.nature.com.
Didovets, I., Lobanova, A., Krysanova, V., Menz, C., Babagalieva, Z., Nurbatsina, A., et al. (2021). Central Asian Rivers under Climate Change: Impacts Assessment in Eight Representative Catchments. J. Hydrol. Reg. Stud. 34, 100779. doi:10.1016/j.ejrh.2021.100779
Dixit, A., Sahany, S., and Kulkarni, A. V. (2021). Glacial Changes over the Himalayan Beas basin under Global Warming. J. Environ. Manage. 295, 113101. doi:10.1016/j.jenvman.2021.113101
Eis, J., van der Laan, L., Maussion, F., and Marzeion, B. (2021). Reconstruction of Past Glacier Changes with an Ice-Flow Glacier Model: Proof of Concept and Validation. Front. Earth Sci. 9. doi:10.3389/feart.2021.595755
Etter, S., Addor, N., Huss, M., and Finger, D. (2017). Climate Change Impacts on Future Snow, Ice and Rain Runoff in a Swiss Mountain Catchment Using Multi-Dataset Calibration. J. Hydrol. Reg. Stud. 13, 222–239. doi:10.1016/j.ejrh.2017.08.005
Eyring, V., Bony, S., Meehl, G. A., Senior, C. A., Stevens, B., Stouffer, R. J., et al. (2016). Overview of the Coupled Model Intercomparison Project Phase 6 (CMIP6) Experimental Design and Organization. Geosci. Model. Dev. 9, 1937–1958. doi:10.5194/gmd-9-1937-2016
Farinotti, D., Usselmann, S., Huss, M., Bauder, A., and Funk, M. (2012). Runoff Evolution in the Swiss Alps: Projections for Selected High-alpine Catchments Based on ENSEMBLES Scenarios. Hydrol. Process. 26, 1909–1924. doi:10.1002/hyp.8276
Farr, T. G., Rosen, P. A., Caro, E., Crippen, R., Duren, R., Hensley, S., et al. (2007). The Shuttle Radar Topography Mission. Rev. Geophys. 45. 2007. Wiley Online Libr2004. doi:10.1029/2005RG000183
Gaudard, L., Romerio, F., Dalla Valle, F., Gorret, R., Maran, S., Ravazzani, G., et al. (2014). Climate Change Impacts on Hydropower in the Swiss and Italian Alps. Sci. Total Environ. 493, 1211–1221. doi:10.1016/j.scitotenv.2013.10.012
Gebrechorkos, S. H., Hülsmann, S., and Bernhofer, C. (2019). Statistically Downscaled Climate Dataset for East Africa. Sci. Data 6. doi:10.1038/s41597-019-0038-1
Gentili, R., Baroni, C., Panigada, C., Rossini, M., Tagliabue, G., Armiraglio, S., et al. (2020). Glacier Shrinkage and Slope Processes Create Habitat at High Elevation and Microrefugia across Treeline for alpine Plants during Warm Stages. Catena 193, 104626. doi:10.1016/j.catena.2020.104626
Guido, Z., McIntosh, J. C., Papuga, S. A., and Meixner, T. (2016). Seasonal Glacial Meltwater Contributions to Surface Water in the Bolivian Andes: A Case Study Using Environmental Tracers. J. Hydrol. Reg. Stud. 8, 260–273. doi:10.1016/j.ejrh.2016.10.002
Guo, H., Bao, A., Chen, T., Zheng, G., Wang, Y., Jiang, L., et al. (2021). Assessment of CMIP6 in Simulating Precipitation over Arid Central Asia. Atmos. Res. 252, 105451. doi:10.1016/j.atmosres.2021.105451
Hersbach, H., Bell, B., Berrisford, P., Hirahara, S., Horányi, A., Muñoz‐Sabater, J., et al. (2020). The ERA5 Global Reanalysis. Q.J.R. Meteorol. Soc. 146, 1999–2049. doi:10.1002/qj.3803
Hock, R. (2005). Glacier Melt: a Review of Processes and Their Modelling. Prog. Phys. Geogr. Earth Environ. 29, 362–391. doi:10.1191/0309133305pp453ra
Huss, M., and Fischer, M. (2016). Sensitivity of Very Small Glaciers in the Swiss Alps to Future Climate Change. Front. Earth Sci. 4, 34. doi:10.3389/FEART.2016.00034
Jia, Y., Li, Z., Jin, S., Xu, C., Deng, H., and Water, M. Z.- (2020). Runoff Changes from Urumqi Glacier No. 1 over the Past 60 years, Eastern Tianshan, Central Asia. mdpi.com. 2020, U.
Kayastha, R. B., Ageta, Y., and Fujita, K. (2006). “Use of Positive Degree-Day Methods for Calculating Snow and Ice Melting and Discharge in Glacierized Basins in the Langtang Valley, Central Nepal,” in Climate and Hydrology in Mountain Areas, 5–14. doi:10.1002/0470858249.ch2
Kayastha, R. B., Steiner, N., Kayastha, R., Mishra, S. K., and McDonald, K. (2020). Comparative Study of Hydrology and Icemelt in Three Nepal River Basins Using the Glacio-Hydrological Degree-Day Model (GDM) and Observations from the Advanced Scatterometer (ASCAT). Front. Earth Sci. 7. doi:10.3389/FEART.2019.00354/FULL
Khadka, M., Kayastha, R. B., and Kayastha, R. (20202020). Future Projection of Cryospheric and Hydrologic Regimes in Koshi River basin, Central Himalaya, Using Coupled Glacier Dynamics and Glacio-Hydrological Models. J. Glaciol. 66, 831–845. cambridge.org 66. doi:10.1017/jog.2020.51
Kienholz, C., Rich, J. L., Arendt, A. A., and Hock, R. (2014). A New Method for Deriving Glacier Centerlines Applied to Glaciers in Alaska and Northwest Canada. The Cryosphere 8, 503–519. doi:10.5194/tc-8-503-2014
Kling, H., Stanzel, P., and Preishuber, M. (2014). Impact Modelling of Water Resources Development and Climate Scenarios on Zambezi River Discharge. J. Hydrol. Reg. Stud. 1, 17–43. doi:10.1016/j.ejrh.2014.05.002
Kneib, M., Cauvy-Fraunié, S., Escoffier, N., Boix Canadell, M., Horgby, Å., and Battin, T. J. (2020). Glacier Retreat Changes Diurnal Variation Intensity and Frequency of Hydrologic Variables in Alpine and Andean Streams. J. Hydrol. 583, 124578. doi:10.1016/J.JHYDROL.2020.124578
Laurent, L., Buoncristiani, J.-F., Pohl, B., Zekollari, H., Farinotti, D., Huss, M., et al. (20202020). The Impact of Climate Change and Glacier Mass Loss on the Hydrology in the Mont-Blanc Massif. Sci. Rep. 10, 1–11. doi:10.1038/s41598-020-67379-7
Li, Z., Wang, W., Zhang, M., Wang, F., and Li, H. (2009). Observed Changes in Streamflow at the Headwaters of the Urumqi River, Eastern Tianshan, central Asia. Hydrol. Process. 24, a–n. doi:10.1002/hyp.7431
Luo, Y., Arnold, J., Allen, P., and Chen, X. (2012). Baseflow Simulation Using SWAT Model in an Inland River basin in Tianshan Mountains, Northwest China. Hydrol. Earth Syst. Sci. 16, 1259–1267. doi:10.5194/hess-16-1259-2012
Marzeion, B., Jarosch, A. H., and Hofer, M. (2012). Past and Future Sea-Level Change from the Surface Mass Balance of Glaciers. The Cryosphere 6, 1295–1322. doi:10.5194/tc-6-1295-2012
Maussion, F., and Butenko, A. (2019). The Open Global Glacier Model (OGGM) V1. 1. gmd.copernicus.Org. 2019, U.
Mengistu, D., Bewket, W., Dosio, A., and Panitz, H.-J. (2021). Climate Change Impacts on Water Resources in the Upper Blue Nile (Abay) River Basin, Ethiopia. J. Hydrol. 592, 125614. doi:10.1016/j.jhydrol.2020.125614
Muñoz, R., Huggel, C., Drenkhan, F., Vis, M., and Viviroli, D. (2021). Comparing Model Complexity for Glacio-Hydrological Simulation in the Data-Scarce Peruvian Andes. J. Hydrol. Reg. Stud. 37, 100932. doi:10.1016/j.ejrh.2021.100932
Pelto, B. M., Maussion, F., Menounos, B., Radić, V., and Zeuner, M. (2020). Bias-corrected Estimates of Glacier Thickness in the Columbia River Basin, Canada. J. Glaciol. 66, 1051–1063. doi:10.1017/jog.2020.75
Rai, S. P., Singh, D., Jacob, N., Rawat, Y. S., Arora, M., and BhishmKumar, (2019). Identifying Contribution of Snowmelt and Glacier Melt to the Bhagirathi River (Upper Ganga) Near Snout of the Gangotri Glacier Using Environmental Isotopes. Catena 173, 339–351. doi:10.1016/j.catena.2018.10.031
Salehnia, N., Hosseini, F., Farid, A., Kolsoumi, S., Zarrin, A., and Hasheminia, M. (2019). Comparing the Performance of Dynamical and Statistical Downscaling on Historical Run Precipitation Data over a Semi-arid Region. Asia-pacific J. Atmos. Sci. 55, 737–749. doi:10.1007/s13143-019-00112-1
Santos, J. Y. G. d., dos Montenegro, S. M. G. L., Silva, R. M. d., da, Santos, C. A. G., Santos, N. W., Dantas, A. P. X., et al. (2021). Modeling the Impacts of Future LULC and Climate Change on Runoff and Sediment Yield in a Strategic basin in the Caatinga/Atlantic forest Ecotone of Brazil. Catena 203, 105308. doi:10.1016/j.catena.2021.105308
Shrestha, S., Imbulana, N., Piman, T., Chonwattana, S., Ninsawat, S., and Babur, M. (2020). Multimodelling Approach to the Assessment of Climate Change Impacts on Hydrology and River Morphology in the Chindwin River Basin, Myanmar. Catena 188, 104464. doi:10.1016/j.catena.2020.104464
Sun, M., Yao, X., Li, Z., and Zhang, M. (2015). Hydrological Processes of Glacier and Snow Melting and Runoff in the Urumqi River Source Region, Eastern Tianshan Mountains, China. J. Geogr. Sci. 25, 149–164. doi:10.1007/s11442-015-1159-x
Sunde, M. G., He, H. S., Hubbart, J. A., and Urban, M. A. (2017). Integrating Downscaled CMIP5 Data with a Physically Based Hydrologic Model to Estimate Potential Climate Change Impacts on Streamflow Processes in a Mixed-Use Watershed. Hydrol. Process. 31, 1790–1803. doi:10.1002/hyp.11150
Wang, S., Zhao, Q., and Pu, T. (2021). Assessment of Water Stress Level about Global Glacier-Covered Arid Areas: A Case Study in the Shule River Basin, Northwestern China. J. Hydrol. Reg. Stud. 37, 100895. doi:10.1016/j.ejrh.2021.100895
Wang, X., Yang, T., Xu, C.-Y., Xiong, L., Shi, P., and Li, Z. (2020). The Response of Runoff Components and Glacier Mass Balance to Climate Change for a Glaciated High-Mountainous Catchment in the Tianshan Mountains. Nat. Hazards 104, 1239–1258. doi:10.1007/S11069-020-04212-4
Wilby, R., Charles, S., and Zorita, E. Material of, 2004, U., 2004. Guidelines for Use of Climate Scenarios Developed from Statistical Downscaling Methods. edu: academia.
Xenarios, S., Gafurov, A., Schmidt-Vogt, D., Sehring, J., Manandhar, S., Hergarten, C., et al. (2019). Climate Change and Adaptation of Mountain Societies in Central Asia: Uncertainties, Knowledge Gaps, and Data Constraints. Reg. Environ. Change 19, 1339–1352. Springer. doi:10.1007/s10113-018-1384-9
Keywords: climate change, glacier dynamics modeling, CMIP6, glacio-hydrological modeling, Urumqi River
Citation: Yang M, Li Z, Anjum MN, Kayastha R, Kayastha RB, Rai M, Zhang X and Xu C (2022) Projection of Streamflow Changes Under CMIP6 Scenarios in the Urumqi River Head Watershed, Tianshan Mountain, China. Front. Earth Sci. 10:857854. doi: 10.3389/feart.2022.857854
Received: 19 January 2022; Accepted: 28 March 2022;
Published: 13 April 2022.
Edited by:
Minghu Ding, Chinese Academy of Meteorological Sciences, ChinaReviewed by:
Babak Mohammadi, Lund University, SwedenTing Wei, China Meteorological Administration, China
Copyright © 2022 Yang, Li, Anjum, Kayastha, Kayastha, Rai, Zhang and Xu. This is an open-access article distributed under the terms of the Creative Commons Attribution License (CC BY). The use, distribution or reproduction in other forums is permitted, provided the original author(s) and the copyright owner(s) are credited and that the original publication in this journal is cited, in accordance with accepted academic practice. No use, distribution or reproduction is permitted which does not comply with these terms.
*Correspondence: Min Yang, eWFuZ21pbkBsemIuYWMuY24=; Zhongqin Li, bGl6cUBsemIuYWMuY24=