 Ruichao Guo
 Guanlong Zhang
94% of researchers rate our articles as excellent or good
Learn more about the work of our research integrity team to safeguard the quality of each article we publish.
Find out more
ORIGINAL RESEARCH article
Front. Earth Sci., 08 April 2022
Sec. Economic Geology
Volume 10 - 2022 | https://doi.org/10.3389/feart.2022.856984
This article is part of the Research TopicAdvances in the Exploration and Development of Unconventional Oil and Gas: From the Integration of Geology and EngineeringView all 32 articles
The thermal evolution of source rocks and the generation of oil and gas were not isolated reactions of kerogen pyrolysis but were comprehensively controlled by many influencing factors. In this study, using Permian source rock samples from Junggar Basin, a large number of high-temperature thermal simulation experiments were carried out to study the characteristics of kerogen, for example, thermal evolution degree and hydrocarbon yield, and their influences under the open system, closed system, and different temperature–pressure conditions. The results show that the hydrocarbon yield under the low heating rate is higher than that under the high heating rate, and the hydrocarbon generation reaction can be fully carried out under the low heating rate, which is more favorable for hydrocarbon generation; with the increase in pressure in the reaction system, the dominant frequency of activation energy of hydrocarbon generation gradually decreases. In terms of the hydrocarbon yield, the oil yield is higher in a high-pressure environment, especially the yield of C6-14 component in hydrocarbons is obviously increased, while there is a relatively small difference between the C14+ components. The result of this research provides a scientific evidence for evaluating the evolution process, hydrocarbon generation kinetics, and hydrocarbon resource potential of source rocks under different temperature–pressure conditions.
After deposition, organic matter was transformed into a series of products such as oil and natural gas under changing temperature and pressure conditions with the basin settlement and stratigraphic burial. The transformation rates depend on the organic matter type and the time–temperature history (Petzoukha and Selivanov, 1991). Most researchers tried to study the influence of heating rate on hydrocarbon generation evolution by means of thermal simulation, especially the high-temperature thermal simulation experiment, which was considered as the simulation method of oil and gas generation closest to the actual underground situation (Hunt, 1979; Burnham et al., 1981; Behar et al., 1992; Price and Wenger, 1992; Liu et al., 1996, 1998; Burnham and McConaghy, 2014; Ji et al., 2016; Bao et al., 2017; Wang et al., 2018; Ma et al., 2020).
Khorasani and Michelson (1991) studied suberinite through thermal simulation, the results of which showed that suberinite could generate oil at an early stage under certain conditions. Mukhopad-hyay (1985) conducted a thermal simulation on type I kerogen, the results of which indicated that algae could be constantly decomposed into microsomes with an increase in temperature. Tissot and Welt (1978) and Durand and Monin (1980) simulated the mixture of type I and III kerogen, concluding that the hydrocarbon generation characteristics of the mixture were different from those of type I and III kerogen. However, Lewan et al. (1979) believed that the closed autoclave environment was unable to fully simulate the underground hydrocarbon generation environment of source rocks, and adding media such as water made the simulation condition closer to the natural environment. By simulating the biochemical hydrocarbon generation of some algae in different sedimentary environments and complex biochemical conditions as well as conducting hydrous and pressurized thermal simulation on hydrocarbon generation of sludge at the bottom of algae-rich lakes, Guo and Yang (2002) established hydrocarbon generation models of algal organic matters in different sedimentary environments. The transfer of hydrogen had been investigated extensively by Hoering (1984) and Lewan (1997); the addition of hydrogen provided the additional mass that enables the mass of bitumen, specifically to increase as the reactor conditions change from non-hydrous into hydrous conditions according to the Arrhenius equation. The temperature was the most important geological condition to determine the thermal evolution of organic matter and hydrocarbon generation (Gao et al., 2004; Liu et al., 2000). The reaction needs to attain the threshold temperature, and the reaction rate had an exponential positive correlation with geological temperature. Similar to many chemical reactions, the product composition of hydrocarbon generation reaction and its relationship with temperature and time can be quantitatively described by using chemical kinetic equations. Many research studies had been carried out at home and abroad on hydrocarbon generation kinetics of organic matters and its application (Tissot, 1969; Ungerer, 1988; Braun and Burnham, 1990; Sweeney and Burnham, 1990; Liao et al., 2018; Zhao, 1984; Lu et al., 2000). Tissot (1969) was the first one to propose the mathematical model, which was gradually improved and expanded in the later stage, and a series of reaction rate models such as overall reaction, cascade reaction, and parallel first-order reaction were put forward. Braun and Burnham (1989) presented a mathematical model for simulating oil generation, degradation, and other chemical reactions occurring during pyrolysis of petroleum source rocks over a specified history of temperature and hydrostatic pressure.
The classical theory of oil and gas generation was based on a normal-pressure environment, without taking abnormal pressure into consideration. Previous research studies on the influence of pressure on hydrocarbon generation can be roughly summarized as follows: first, pressure has no obvious influence on the thermal evolution and hydrocarbon generation of organic matters (Hunt, 1979; Tissot and Welt, 1978; He et al., 2002); second, the increase in pressure can promote the thermal evolution of organic matters, especially the thermal cracking of hydrocarbons (Petzoukha and Selivanov, 1991; Yang and Wang 1987; Braun and Burnham, 1990); third, the increased pressure can inhibit the thermal evolution and hydrocarbon generation of organic matters (Connan et al., 1992; Price and Wenger, 1992; Price, 1993; Hao et al., 1995; Zou and Peng, 2001). According to the experiment conducted by Petzoukha and Selivanov (1991), the increase in effective stress can facilitate the hydrocarbon generation of organic matters by enhancing the catalytic activity of clay minerals. By analyzing the causes of the influence of effective stress on the evolution of organic matters, it was found that the increase in effective stress can stimulate the evolution of organic matters. The primary reason is that the increase in effective stress acting directly on rock particles can crush the solid organic matters to some extent, which enlarges the surface area of organic matters involved in the reaction, thereby promoting the hydrocarbon generation of organic matters. Some researchers tried to adjust the chemical reaction frequency factor (Dalla et al., 1997; Carr et al., 2009) or activation energy (Burnham, 2019; Xiao et al., 2005) in currently available vitrinite reflectance models to reveal the role played by pressure or overpressure in the thermal evolution of organic matters, so as to predict the evolution history of the Ro value when overpressure inhibited the thermal evolution of organic matters. Although the actual situation observed in the basin shows that overpressure can inhibit the thermal evolution and hydrocarbon generation of organic matters (Hao et al., 2004; Bao et al., 2017), the degree to which thermal evolution and hydrocarbon generation of organic matters are inhibited in overpressure environment remains unknown.
In this study, a large number of high-temperature thermal simulation experiments were carried out to explore the characteristics of kerogen, for example, thermal evolution degree and hydrocarbon yield, and their influences under different temperature–pressure conditions such as the open system, closed system, atmospheric pressure, and high pressure, in order to clarify the difference of hydrocarbon generation products under different heating rates and pressure conditions and provide reference for oil and gas exploration in overpressure basins.
The materials used in this study included 14 outcrop samples, all of which were collected from the Middle Permian Lucaogou Formation (P2l, 10 samples) and Hongyanchi Formation (P2h, 4 samples) in the outcrop profile of Dongdalongkou section and Hongyanchi section, southeast margin of the Junggar Basin. All samples were unweathered shales located more than 5 m above the ground (Figure 1). Based on burial history and apatite fission track, the samples experienced a maximum geological temperature of 90–100°C.
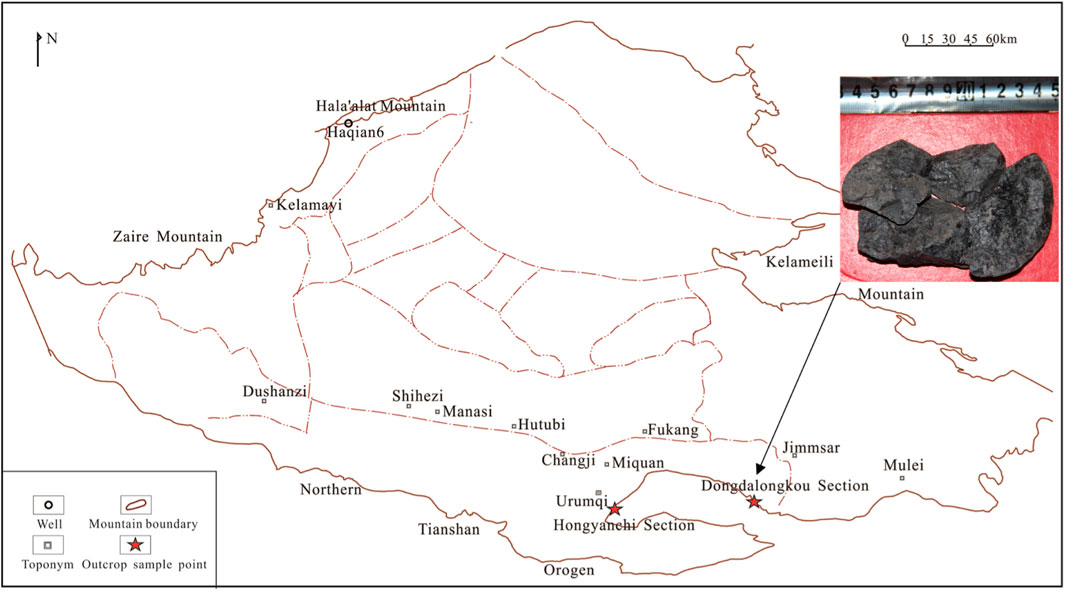
FIGURE 1. Regional geological map of the Junggar Basin and the sample locations.
TOC measurements and programmed pyrolysis (Rock-Eval) were conducted to measure the free hydrocarbons (S1 peak), potentially generative hydrocarbons (S2 peak), and temperature of the S2 peak maximum (Tmax). The hydrogen index (HI) was calculated by 100×S2/TOC.
The vitrinite reflectance (Ro) of the kerogen was assessed by reflectance measurements of the aceral vitrinite. The sample preparation was as follows: the whole rock samples were crushed to less than 2 mm and then mixed with agar in a 1:1 ratio. The mixed sample was consolidated with a setting machine, and the formed samples were ground and polished. Finally, the polished thin sections were placed under the Zeiss Scope A1 microscope. During measurements, 20–55 effective points were measured. Kerogen was isolated by the standard HCl/HF treatment.
The purpose was to simulate the entire evolution process of shale from low thermal maturity to the end of oil and gas production under different heating rates and pressure conditions. The thermal simulation experiments were conducted at the Guangzhou Institute of Geochemistry, Chinese Academy of Sciences. The temperature fluctuation was less than 1°C.
Rock-Eval was used to carry out the simulation experiment under the open system. The heating rates were 20°C/min, 30°C/min, 40°C/min, and 50°C/min; aiming at the middle Permian in the southeast of Junngar, 14 samples of the Permian source rocks were subjected to pyrolysis experiments with different heating rates to analyze hydrocarbon products at different temperature points.
The source rock sample No. 2911 was selected, which was sealed into the gold tube under the protection of argon, and the tube was placed in the autoclave filled with water through the high-pressure pump. The high-pressure water made the tube flexible and deformed to apply pressure on the sample encapsulated under the protection of argon to ensure that there was no air pollution. The gold pipe was sealed with wire welding. The samples were heated at the rates of 20°C/min and 2°C/min, respectively. The experiment was carried out under the pressures of 20, 60, 120, and 180 MPa, respectively, with pressure fluctuation < 5 MPa.
After the room temperature rose naturally to 250°C, the temperature rose to 275, 300, 325, 350, 375, 400, and 450°C, respectively, at the rates of 2°C/h and 20°C/h for 12 h, with temperature fluctuation <1°C. Taking out kerogen samples at each temperature point and measuring vitrinite reflectance, the products were collected at each temperature point, and the hydrocarbon yield at each temperature point was determined (Figure 2).
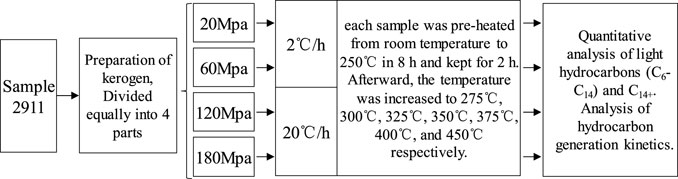
FIGURE 2. Schematic diagram of the pyrolysis analysis.
After heating the tube containing the sample, the tube was taken out of the autoclave. The detection contents included gas, light hydrocarbons (C6-14), and heavy hydrocarbons (C14 +). The tube was put into the vacuum system to release the gas into the system. The collection and analysis method of liquid hydrocarbons (C6 +) was as follows: after the gas analysis was completed, the on-line sample bottle frozen with liquid nitrogen was used to collect a small amount of C6-10 light hydrocarbons diffused into the vacuum glass tube; the sample bottle was removed and dichloromethane solvent was quickly injected. Then, the tube was taken out from the autoclave, cut together with the sample, put into the same sample bottle, and vibrated with an ultrasonicator for 1 min to completely dissolve the oil generated in the tube into the solvent to effectively avoid the loss of C6-10 hydrocarbons. Then 1 ml of clear liquid in the upper layer of a 4-ml sample bottle was taken out, transferred to a 2-ml sample bottle, and an automatic sampler was used for chromatographic analysis. The model of gas chromatography was Agilent 7890N, and the column is HP-5, 30 m × 0.32 × 0.25. Chromatographic conditions: the temperature of the sample inlet: 290°C, the initial temperature of the column box: 40°C, constant temperature for 5 min, which then rose to 290°C at the rate of 4°C/min for 10 min. Deuterated C24 was used as the internal standard for quantitative analysis of light hydrocarbons (C6-14). C6-14 saturated hydrocarbons and aromatics were quantified by the GC graph integration method. A part of C14+ was quantified by extraction, filtration, and weighing. The extraction solvent was dichloromethane; TEFLON organic filter membrane was adopted, with a pore diameter 0.45 μm. KINETIC software was used for data processing, and common frequency factor was used for all parallel reactions.
The source rock P2l collected in the Hongyanchi section is mainly composed of dark gray mudstone, with the total organic carbon (TOC) content ranging from 1.54 to 6.76%, the average of which is 3.44%. Chloroform bitumen “A” ranges from 0.06 to 0.32%, with an average of 0.17%; “S1+S2” ranges from 1.06 to 43.02 mg/g, with the average being 15.10 mg/g; hydrogen index (IH) is within the range of 25–566 mg/g, with an average of 301.14 mg/g, and the IH of most samples is above 200 mg/g; hydrocarbon productivity index (PI) lies between 0.02 and 0.09, with the average being 0.04; CP ranges from 0.09 to 3.59%, with an average of 1.25%; the degradation (D) rate (%) is within the range of 2.16–48.28%, with an average of 26.02%, and most samples have a degradation rate of about 20%; and the hydrocarbon index spans from 1.23 to 30.49, with the average being 12.40. In the Dongdalongkou section, the total organic carbon (TOC) content ranges from 0.69 to 12.0%; the “S1+S2” ranges from 0.9 to 75.1 mg/g (Figure 3). The Ro value of source rock samples P2l ranges between 0.55 and 0.84%, implying that the organic matters are in the immature and low mature stages.

FIGURE 3. Geochemical parameter profile of P2l of the Dongdalongkou section.
The sediment in the Middle Permian Lucaogou Formation belongs to freshwater lake–fluvial swamp facies; the rock has a laminar structure and a massive structure (Figure 4). Through the field geological survey and sampling in the southeast margin of the Junggar Basin, the kerogen macerals of the samples were identified (Table 1). The organic matters of the Middle Permian Lucaogou Formation in the Dongdalongkou section are dominated by type I organic matters, and those in the Hongyanchi section are dominated by type Ⅱ1.
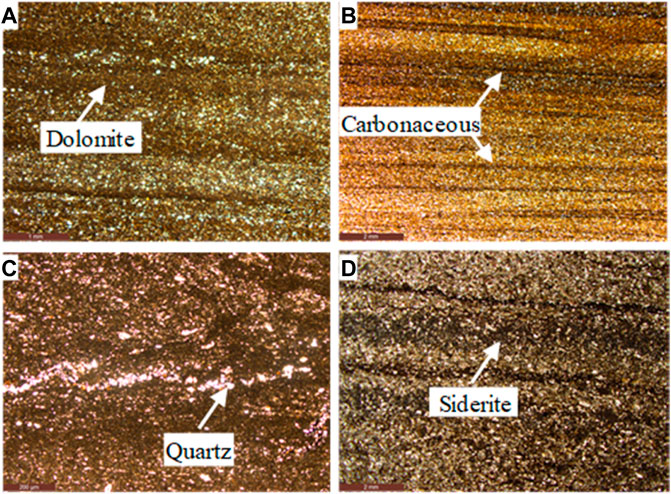
FIGURE 4. Images of the Lucaogou Formation shale samples of the Dongdalongkou section. (A) The sample is mainly composed of scaly argillaceous, 5% micro-cryptocrystalline dolomite, 2% carbonaceous component, and 3% silty sand. (B) The composition is mainly scaly argillaceous, 6% iron dolomite, 4% carbonaceous component, and 4% silty sand. The carbonaceous material is linearly distributed along the bedding, and the silty sand is mainly quartz, feldspar, and other particles. (C) The rock composition is mainly scaly argillaceous, 40% carbonate, and 7% silt, and the silt is unevenly distributed. Carbonate is mainly composed of calcite and siderite, both of which are cryptocrystalline and difficult to distinguish. Silt is mainly composed of quartz, feldspar, and other particles. (D) The rock has a very fine-grained sandy structure. The particle composition is mainly feldspar, a small amount of rock debris, and quartz. It can be seen that 2% of peat is distributed in strip and bedding orientation. Intergranular interstitial material is mainly carbonate, accounting for 10%, and a small amount of argillaceous material, accounting for 2%. The carbonate components are mainly siderite and a small amount of calcite. Siderite is distributed in petal and spherical shapes, and calcite microcrystalline structure.
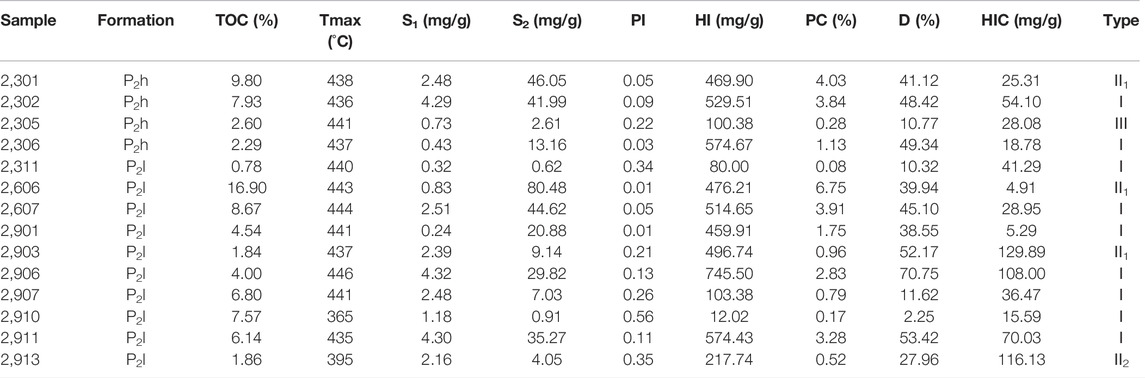
TABLE 1. TOC and Rock-Eval pyrolysis data of selected samples.
Rock-Eval pyrolysis was applied to conduct pyrolysis experiments at different heating rates to analyze hydrocarbon products obtained at different temperature points. The characteristics of samples collected from different regions, and strata were basically the same. Taking the analysis results of type I organic black mudstone samples in the Dongdalongkou section as an example, in the initial heating stage at a temperature of 300–425°C, the hydrocarbon yield of extracts with a low heating rate (20°C/min) was higher than that with a high heating rate (50°C/min). At 400°C, the phased hydrocarbon conversion rate of samples with a low heating rate (20°C/min) was 3.2%, while that of samples with a high heating rate (50°C/min) was 1.5%, with a difference of 1.7% between the two conversion rates (Figure 5). In the process of gradually heating up to 450°C, the difference of conversion rate further increases, and the maximum was 3.7%. Given different heating rates (20°C/min, 50°C/min), the cumulative conversion rate varied greatly at the peak of hydrocarbon generation at 400–450 °C (Figure 6), with the difference between two conversion rates reaching 20–30%. For example, at 425°C, there can be a difference as high as 23% between the two cumulative hydrocarbon conversion rates.
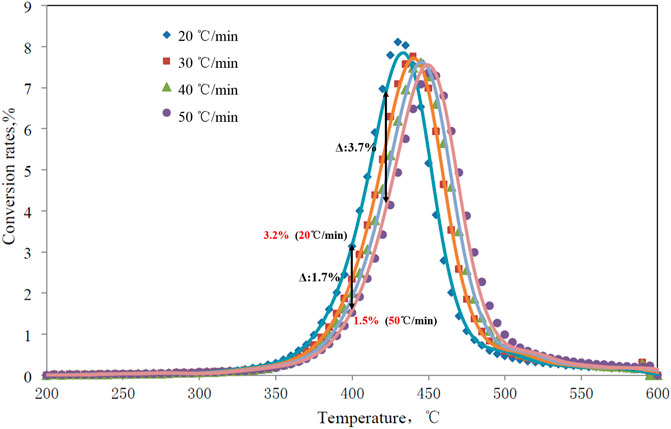
FIGURE 5. Phased hydrocarbon conversion rates of sample 2,910 of the Dongdalongkou section under different heating rates.
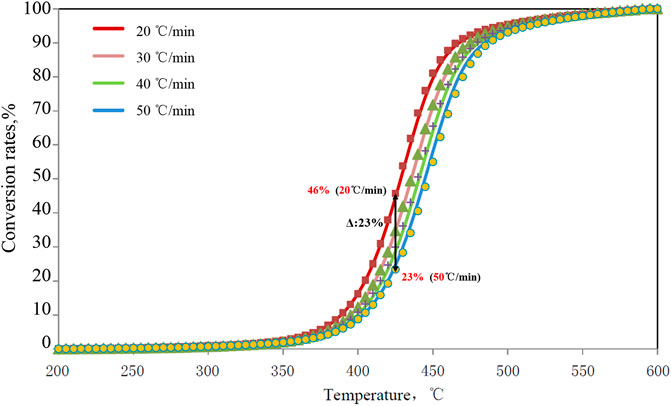
FIGURE 6. Cumulative hydrocarbon conversion rates of sample 2,910 of the Dongdalongkou section under different heating rates.
Under the following conditions above 500°C, because the experimental conditions were all constant temperature for 12 h, the amount of chloroform extract in the fast heating rate experiment was almost equal to that in the previous slow heating rate experiment, that was, the fast heating rate experiment only lag behind the slow heating rate experiment.
It implies the difference between the transformation of kerogen into hydrocarbons caused by different heating rates.
Therefore, the amount of chloroform extracted in the experiment with a low heating rate is more than that in the fast-heating experiment; this suggests that slow heating is more favorable for transforming organic matters into hydrocarbons. Based on the experimental results of the open system, the heating rate significantly affects the phased hydrocarbon conversion rate in the hydrocarbon generation reaction. Given the same ground temperature, the phased hydrocarbon conversion rate is higher in the hydrocarbon generation reaction with a lower heating rate.
The closed system thermal simulation experiment was conducted to measure the generated products at different heating rates. The phased oil yield at a low heating rate (2°C/h) significantly surpasses that at a high heating rate (20°C/h), with the competitive edge maintained (Figure 7). Especially in the peak stage of hydrocarbon generation (350–390°C), the phased oil yield at a low heating rate can reach 68.93 mg/g at 370°C, which was equivalent to 148% of the phased hydrocarbon yield at the high heating rate.
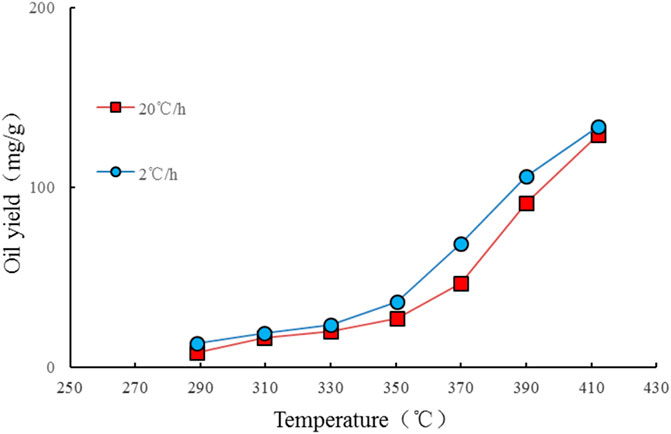
FIGURE 7. Phased oil yields at different heating rates of sample 2,911 in the closed system.
In view of the different heating rate results of the closed system, the analysis believes that the difference in the conversion rate of the two heating rates is due to the fact that the sample has entered the oil window (corresponding to 400°C), and the molecules that are easy to become oil and gas have long been broken down and discharged, at this time, the main residue in the sample is some difficult to fracture organic groups, and the pyrolysis reaction is also transformed from the cleavage of the low-ripening sample to the cleavage and polymerization, and even the polymerization is dominant, reflecting the polarization of the reaction. Rapid heating exerts adverse impacts on hydrocarbon generation, while slow heating is beneficial to both the generation and discharge of hydrocarbons, which is closely correlated with insufficient reaction time at high heating rates, indicating that the generation of oil and gas requires appropriate temperature and time, and a suitable heating rate contributes to the generation of oil and gas.
The composition of liquid hydrocarbon products with different heating rates is different, that is, under the pressure of 20 MPa, the liquid hydrocarbon products generated by heating simulation with a fast heating rate (20°C/h) are mainly heavy components C17-25, while light alkanes show a significantly slower heating rate (2°C/h) (Figure 8A). Under the pressure of 180 MPa, the liquid hydrocarbon components simulated by heating at different heating rates are significantly different only in the light C9-11 components, which show that the light components of the products with a slow heating rate are higher. The difference between other carbon numbers of hydrocarbons is not significant or basically similar (Figure 8B).
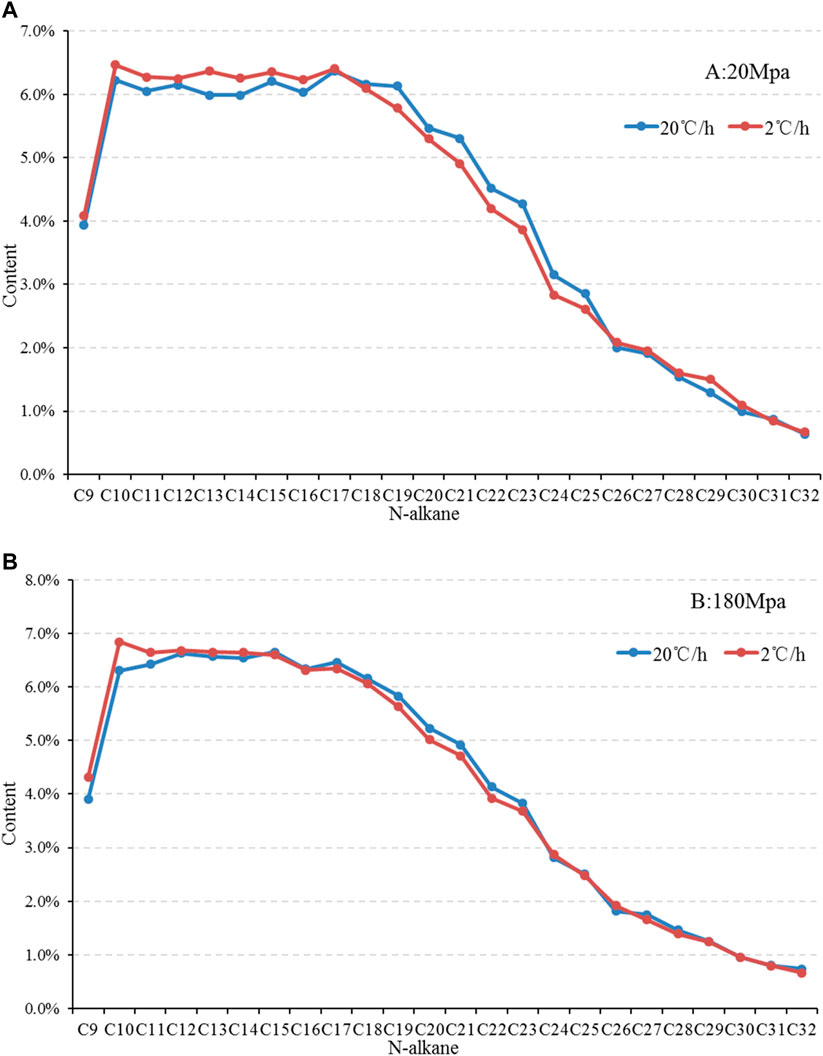
FIGURE 8. Composition comparison of liquid hydrocarbon products of sample 2,911 under different heating rates [(A) 20 Mpa, (B) 180 Mpa].
The results of the hydrocarbon yields of different hydrocarbon components under different pressure conditions under the same temperature show that the pressure conditions affect the hydrocarbon generation yields of different kerogen components. As the hydrocarbon generation reaction proceeds, high-pressure conditions can effectively promote the generation of liquid hydrocarbon products. At 60 Mpa, the phased yield of liquid hydrocarbon C6-14 is significantly higher than that at 20 Mpa (Figure 9), while there is no significant difference between the yields of liquid hydrocarbon C6-14 at 120 and 180 Mpa, with the phased yield being higher than that at 60 Mpa. By analyzing the yield of C14+ components with a high carbon number, it is found that in the early stage of the reaction, the higher the pressure, the higher the instantaneous yield, while at the end of the reaction, the phased yield declines under high pressure. As a result, in terms of the instantaneous yield of liquid hydrocarbon, the phased yield under low pressure surpasses that under high pressure at the end of evolution (Figure 10); when it comes to the cumulative yield of liquid hydrocarbon, with the increase in pressure, the oil yield gradually goes up, but there is a relatively small difference between the oil yields under the pressure of 120 and 180 Mpa.
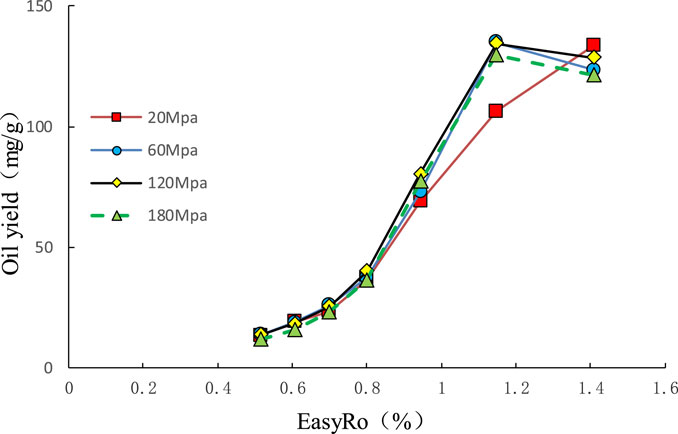
FIGURE 9. Comparison of phased oil yields of sample 2,911 under different pressure conditions.
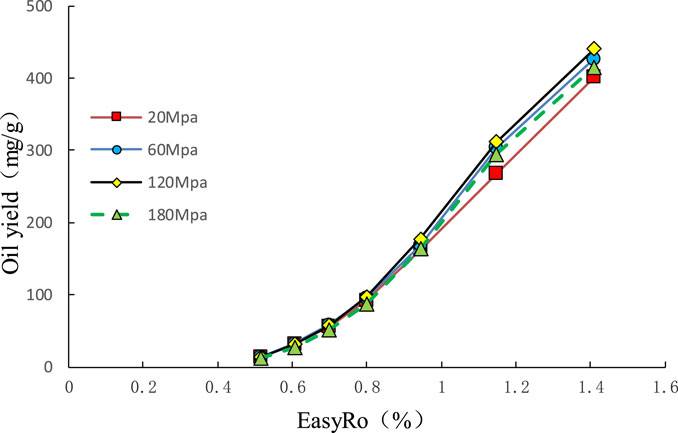
FIGURE 10. Comparison of cumulative oil yields of sample 2,911 under different pressure conditions.
The hydrocarbon generation evolution process of organic matter is included in a series of parallel and continuous reactions. The product concentration changes or the volume expansion effects of different components are different, resulting in discrepancy of influence under overpressure conditions on different components in the process of hydrocarbon generation (Al Darouich et al., 2006; Meng et al., 2008; Wu et al., 2016). Under the simulated experimental conditions of the same heating rate (2°C/h), the components of liquid hydrocarbon products under different pressures are significantly different (Figure 11). The chromatographic characteristics of hydrocarbon components under 20 Mpa are double peaks of C10 and C17, and the products under overpressure are leading peaks with C10 as the main peak carbon.
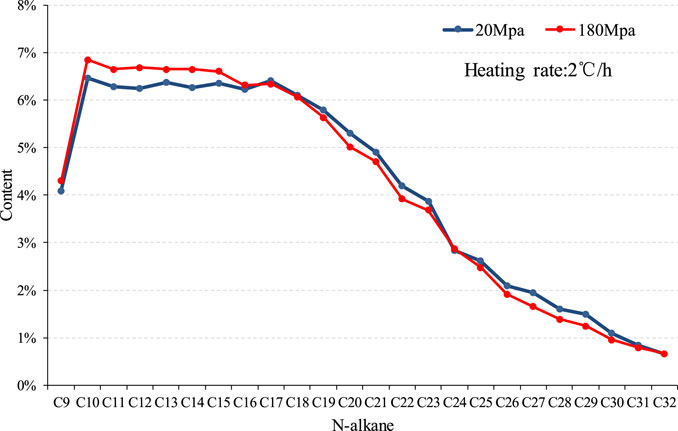
FIGURE 11. Composition comparison of liquid hydrocarbon products of sample 2,911 under different pressure conditions at the same heating rate.
We believe that the results reflect that the overpressure simulated experimental conditions can promote the cracking of heavy components and significantly increase the generation of light components.
Under the pressure of 20 Mpa, the activation energy is distributed within the range of 193–243 kj/mol, with the dominant frequency activation energy being 226 kj/mol, occupying a distribution ratio of 51.02%. Under a pressure of 60 Mpa, the activation energy varies from 188 kj/mol to 243 kj/mol, with a dominant frequency activation energy of 222 kj/mol, taking up a distribution ratio of 46.93%. Under a pressure of 120 Mpa, the activation energy ranges from 193 kj/mol to 243 kj/mol, with the dominant frequency activation energy being 226 kj/mol, occupying a distribution ratio of 67.32%, which is higher than that under the pressure of 60 Mpa. Under a pressure of 180 Mpa, the activation energy spans from 176 kj/mol to 243 kj/mol, with a dominant frequency activation energy of 226 kj/mol, taking up a distribution ratio of 45.1%, which is lower than that under the pressure of 60 Mpa. However, the initial activation energy is effectively reduced under the pressure of 180 Mpa, which creates more favorable conditions for the hydrocarbon generation reaction (Table 2).
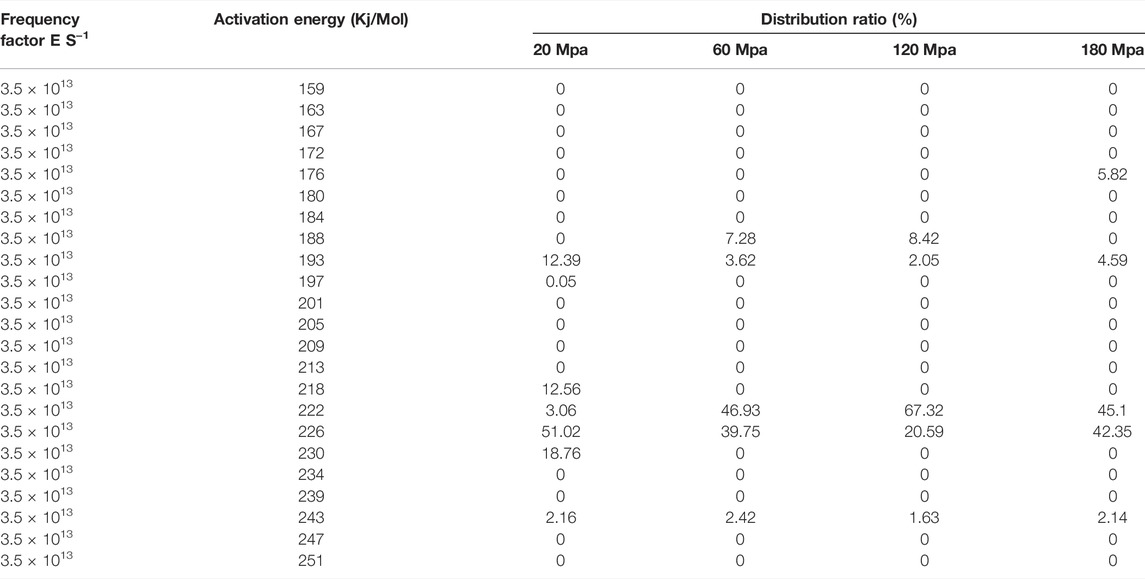
TABLE 2. Comparison of hydrocarbon generation kinetics under different pressures.
According to the hydrocarbon generation reactions under different pressures, the hydrocarbon generation kinetics was fitted. After unifying the kinetic pre-exponential factors, the distribution characteristics of activation energy under four different pressures were compared, and the distribution diagram of activation energy of hydrocarbon generation under different pressures was established, as shown in Figure 12. As the pressure increases, the dominant frequency of activation energy gradually declines.
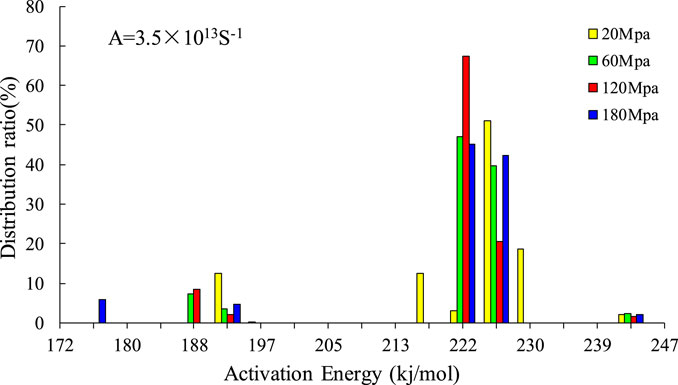
FIGURE 12. Comparison of distribution of activation energy of hydrocarbon generation of sample 2,911 under different pressure conditions.
1) The hydrocarbon yield under a low heating rate is higher than that under a high heating rate, and the hydrocarbon generation reaction can be fully carried out under a low heating rate, which is more favorable for hydrocarbon generation.
2) With the increase in pressure in the reaction system, the dominant frequency of activation energy of hydrocarbon generation gradually decreases; in terms of the hydrocarbon yield, the oil yield is higher in a high-pressure environment, especially the yield of C6-14 component in hydrocarbons is obviously increased, while there is a relatively small difference between the C14+ components.
3) The components of liquid hydrocarbon products under different pressures are significantly different; the overpressure simulated experimental conditions can promote the cracking of heavy components and significantly increase the generation of light components.
The effect of temperature and pressure observed in this study implies that in addition to temperature and time, pressure will have a significant control on the extent of hydrocarbon generation in a geological basin. The oil-increased effect of pressure could be more significant in geological basins than shown in this study because in geological basins, such as Junggar Basin, temperatures are much lower and the reaction time can be much longer than the condition used in this study.
The raw data supporting the conclusions of this article will be made available by the authors, without undue reservation.
All authors listed have made a substantial, direct, and intellectual contribution to the work and approved it for publication.
All authors were employed by the Exploration and Development Research Institute Shengli Oil Field, Sinopec.
This research was financially funded by grants from the Sinopec and Shengli oil field science and technology project (grant nos.YJQ 2002, P17001, P20013, and P20049). We are very grateful to the reviewers and the journal editors for giving valuable comments that improved the quality of this paper.
All claims expressed in this article are solely those of the authors and do not necessarily represent those of their affiliated organizations, or those of the publisher, the editors, and the reviewers. Any product that may be evaluated in this article, or claim that may be made by its manufacturer, is not guaranteed or endorsed by the publisher.
Al Darouich, T., BeharLargeau, F. C., and Largeau, C. (2006). Pressure Effect on the thermal Cracking of the Light Aromatic Fraction of Safaniya Crude Oil - Implications for Deep Prospects. Org. Geochem. 37, 1155–1169. doi:10.1016/j.orggeochem.2006.04.004
Bao, Y., Zhang, L., Zhang, S., Wang, Y., Zhang, L., Wu, L., et al. (2017). Simulation experiment and Mechanism of Hydrocarbon-Generation Retardation for Source Rocks[J]. Acta Petrolei Sinica 38 (7), 753–762. doi:10.7623/syxb201707003
Behar, F., Kressmann, S., Rudkiewicz, J. L., and Vandenbroucke, M. (1992). Experimental Simulation in a Confined System and Kinetic Modelling of Kerogen and Oil Cracking. Org. Geochem. 19, 173–189. doi:10.1016/0146-6380(92)90035-v
Braun, R. L., and Burnham, A. K. (1990). Mathematical Model of Oil Generation, Degradation, and Expulsion. Energy Fuels 4 (2), 132–146. doi:10.1021/ef00020a002
Burnham, A. K., Bey, N. K., and Koskinas, G. J. (1981). Hydrogen Sulfide Evolution from Colorado Oil Shale. ACS (Am. Chem. Soc. Symp. Ser. 163, 61–77. doi:10.1021/bk-1981-0163.ch005
Burnham, A. K. (2019). Kinetic Models of Vitrinite, Kerogen, and Bitumen Reflectance. Org. Geochem. 131, 50–59. doi:10.1016/j.orggeochem.2019.03.007
Burnham, A. K., and McConaghy, J. R. (2014). Semi-Open Pyrolysis of Oil Shale from the Garden Gulch Member of the Green River Formation. Energy Fuels 28, 7426–7439. doi:10.1021/ef502109m
Carr, A. D., Snape, C. E., Meredith, W., Uguna, C., Scotchman, I. C., and Davis, R. C. (2009). The Effect of Water Pressure on Hydrocarbon Generation Reactions: Some Inferences from Laboratory Experiments. Pet. Geosci. 15, 17–26. doi:10.1144/1354-079309-797
Connan, J., Montel, F., Banc, P. H., Sahuquet, B., and Jouhannel, R. (1992). Experimental Study of Expulsion of HCs from Shaley Source Rocks: Importance of Pressure on Expulsion Efficiencies[J]. Adv. Appl. Energ. Nat. Enviorment, 14–15.
Dalla, T., Mahlman, F., and Ernt, W. (1997). Experimental Study on the Pressure Dependence of Vitrinite Maturation. Org. Geochem. 61, 2921–2928.
Gao, G., Jiang, Z., Zhao, Z., and Wang, Z. (2004). Effect of Heating Rate on Hydrocarbon Generation Characteristics of Source Rocks under Simulated Hydrous Conditions[J]. Nat. Gas Geosci. 15 (5), 461–465.
Guo, R., and Yang, F. (2002). Inquisition to the Hydrocarbon Generation Mechanism for Algal Organic Matter[J]. J. Tongji Univ. (Natural Science) 30 (1), 42–45.
Hao, F., Li, S., Sun, Y., and Zhang, Q. (1995). Overpressure Retardation of Organic-Matter Maturation and Hydrocarbon Generation: A Case Study from the Yinggehai and Qiongdongnan Basins, Off-Shore South China Sea. AAPG Bulletin 79 (4), 551–562.
Hao, F., Jiang, J., Zou, H., Fang, Y., and Zeng, Z. (2004). Differential Retardation of Organic Matter Maturation by Overpressure[J]. Sci. China Ser. D: Earth Sci. 47 (9), 783–793.
He, S., Meddleton, M., Kaiko, A., Jiang, C., and Li, M. (2002). Two Case Studies of Themal Maturity and Thermal Modeling Within the Overpressured Jurassic Rocks of the Barrow Sub-Basin, North West Shelf of Australia. Marine and Petroleum Geology 19 (2), 143–159.
Hoering, T. C. (1984). Thermal Reactions of Kerogen with Added Water, Heavy Water and Pure Organic Substances. Org. Geochem. 5, 267–278. doi:10.1016/0146-6380(84)90014-7
Hunt, J. M. (1979). Petroleum Geochemistry and Geology [M]. San Francisco: M. H. Freeman and Company.
Ji, L., Wu, Y., He, C., and Su, L. (2016). High-pressure Hydrocarbon-Generation Simulation and Pore Evolution Characteristics of Organic-Rich Mudstone and Shale[J]. Acta Petrolei Sinica 37 (2), 172–181.
Khorasani, G. H., and Michelson, J. K. (1991). Geological and Laboratory Evidence for Early Generation of Large Amounts of Liquid Hydrocarbons Form Suberinite and Subereous Components[J]. Geochem. 17 (6), 1271–1285. doi:10.1016/0146-6380(91)90025-f
Lewan, M. D. (1997). Experiments on the Role of Water in Petroleum Formation. Geochimica et Cosmochimica Acta 61, 3691–3723. doi:10.1016/s0016-7037(97)00176-2
Lewan, M. D., Winters, J. C., and McDonald, J. H. (1979). Generation of Oil-like Pyrolyzates from Organic-Rich Shales. Science 203, 897–899. doi:10.1126/science.203.4383.897
Liao, L., Wang, Y., Chen, C., Shi, S., and Deng, R. (2018). Kinetic Study of marine and Lacustrine Shale Grains Using Rock-Eval Pyrolysis: Implications to Hydrocarbon Generation, Retention and Expulsion. Mar. Pet. Geology. 89, 164–173. doi:10.1016/j.marpetgeo.2017.01.009
Liu, W., Xu, Y., Shi, J., Lei, H., Zhang, B., et al. (1998). Bio-thermal Catalytic Transition Zone gas[M]. Beijing: China Science Publishing & Media Ltd, 147–154.
Liu, W., Xu, Y., Shi, J., Lei, H., Zhang, B., et al. (1996). Formation Mechanism and Evolution Model of Bio-thermal Catalytic Transition Zone Gas[J]. Sci. China (Series D: Earth Sciences) 26 (6), 511–517.
Liu, W., Xu, Y., Zhang, S., Liao, Y., Zhang, L., Song, Y., et al. (2000). A New Hydrocarbon Generation Mechanism-Mechanochemistry and its Experimental Evidence[J]. Acta Sedimentologica Sinica 18 (2), 314–318.
Lu, S., Fu, X., Li, Q., Liu, X., and Feng, Y. (2000). Restoration of the Original Parameters of the Chemical Kinetic Models for Generation of Hydrocarbons from Mature Organic Matter in the Tarim basin and its Significance[J]. Geol. Rev. 46 (5), 556–560.
Ma, W., Hou, L., Luo, X., Liu, J., Tao, S., Guan, P., et al. (2020). Generation and Expulsion Process of the Chang 7 Oil Shale in the Ordos Basin Based on Temperature-Based Semi-open Pyrolysis: Implications for Iin-Ssitu Conversion Process[J]. J. Pet. Sci. Eng. 190, 1–14. doi:10.1016/j.petrol.2020.107035
Meng, Y.-l., Li, B., Wang, Z.-g., Wang, Y.-c., Niu, J.-y., Yin, X.-l., et al. (2008). Overpressure Retardation of Organic Acid Generation and Clastic Reservoirs Dissolution in central Huanghua Depression. Pet. Exploration Develop. 35 (1), 40–43. doi:10.1016/s1876-3804(08)60006-3
Mukhopad-hyay, P. K. (1985). Characterization of Kerogen as Seen under the Aspect of Maturation and Hydrocarbon Generation[J]. Erdol Kohle 38, 7–18.
Petoukha, Y., and Selivanov, O. (1991). Promotion of Petroleum Formation by Source Rock deformation[C]. Manchester: Advance and application in the natural environment Manckerster university Press, 312–314. Org Geochem.
Price, L. C. (1993). Thermal Stability of Hydrocarbons in Nature: Limits, Evidence, Characteristics, and Possible Controls. Geochimica et Cosmochimica Acta 57, 3261–3280. doi:10.1016/0016-7037(93)90539-9
Price, L. C., and Wenger, L. M. (1992). The Influence of Pressure on Petroleum Generation and Maturation as Suggested by Aqueous Pyrolysis. Org. Geochem. 19, 141–159. doi:10.1016/0146-6380(92)90033-t
Sweeney, J., and Burnham, A. K. (1990). Evaluation of a Simple Model of Vitrinite Reflectance Based on Chemical Kinetics[J]. AAPG Bull. 74, 1559–1570. doi:10.1306/0c9b251f-1710-11d7-8645000102c1865d
Tissot, B. P., and Welt, D. H. (1978). Petroleum Formation and Occurrence- a New Approach to Oil and Gas exploration[M]. Berlin, Heidelberg, New York: Springer-Verlag.
Tissot, B. (1969). Premie’res Donne’es sur les Me’canismes et la Cine’tique de la Formation du Pe’trole Dans les Bassins Se’dimentaires. Simulation d’un Sche’ma Re’actionnel sur Ordinateur. Oil Gas Sci. Technol. 24, 470–501.
Ungerer, P., Behar, F., Villalba, M., Heum, O. R., and Audibert, A. (1988). Kinetic Modelling of Oil Cracking. Org. Geochem. 13, 857–868. doi:10.1016/0146-6380(88)90238-0
Wang, Q., Peng, P., Zhang, W., Liu, J., and Yu, C. (2018). Quantitative Full-Component Hydrocarbon-Generating Simulation and Crude Oil Mobility Evaluation of Shale in 7th Member of Yanchang Formation, Ordos Basin[J]. Acta Petrolei Sinica 39 (5), 541–553.
Wu, Y., Ji, L., He, C., Zhang, Z., Zhang, M., Sun, L., et al. (2016). The Effects of Pressure and Hydrocarbon Expulsion on Hydrocarbon Generation during Hydrous Pyrolysis of Type-I Kerogen in Source Rock. J. Nat. Gas Sci. Eng. 34, 1215–1224. doi:10.1016/j.jngse.2016.08.017
Xiao, L., Meng, Y., Zhang, L., Wei, A., Li, J., Zhang, W., et al. (2005). Vitrinite Reflectance Modeling in the Overpressured Formations. Petroleum Exploration and Development 32 (1), 14–17.
Yang, T., and Wang, H. (1986). Simulatioan of High Temperature-High Pressure of Rock’s Organic Matter. Oil & Gas Geology 8 (4), 380–390. doi:10.11743/ogg19870409
Zhao, X. (1984). Principle of Chemical Reaction kinetics[M]. Beijing: Higher Education press, 26–29.
Keywords: organic matters, hydrocarbon generation evolution, oil composition, hydrocarbon yield, activation energy
Citation: Guo R, Zhang G, Zeng Z, Wang Q, Zhao L, Wang J, Yu T and Gao J (2022) Analysis of Controlling Effect of Temperature–Pressure Conditions on Hydrocarbon Generation of Source Rocks. Front. Earth Sci. 10:856984. doi: 10.3389/feart.2022.856984
Received: 18 January 2022; Accepted: 14 March 2022;
Published: 08 April 2022.
Edited by:
Shang Xu, China University of Petroleum, ChinaReviewed by:
Qiqi Li, China University of Geosciences Wuhan, ChinaCopyright © 2022 Guo, Zhang, Zeng, Wang, Zhao, Wang, Yu and Gao. This is an open-access article distributed under the terms of the Creative Commons Attribution License (CC BY). The use, distribution or reproduction in other forums is permitted, provided the original author(s) and the copyright owner(s) are credited and that the original publication in this journal is cited, in accordance with accepted academic practice. No use, distribution or reproduction is permitted which does not comply with these terms.
*Correspondence: Ruichao Guo, Z3VvcnVpY2hhby5zbHl0QHNpbm9wZWMuY29t
Disclaimer: All claims expressed in this article are solely those of the authors and do not necessarily represent those of their affiliated organizations, or those of the publisher, the editors and the reviewers. Any product that may be evaluated in this article or claim that may be made by its manufacturer is not guaranteed or endorsed by the publisher.
Research integrity at Frontiers
Learn more about the work of our research integrity team to safeguard the quality of each article we publish.