 Andrey Yatsuk
 Alexander Gresov
 Glen Tritch Snyder
95% of researchers rate our articles as excellent or good
Learn more about the work of our research integrity team to safeguard the quality of each article we publish.
Find out more
ORIGINAL RESEARCH article
Front. Earth Sci. , 31 May 2022
Sec. Marine Geoscience
Volume 10 - 2022 | https://doi.org/10.3389/feart.2022.856496
This article is part of the Research Topic The Lifetime of Methane Bubbles Through Sediment and Water Column View all 14 articles
The continental margins of the East Siberian Sea and Arctic Ocean are among the Earth’s most inaccessible marine environments for hydrocarbon research due to the almost year-round presence of ice cover. Despite this, limited preliminary assessments which have been carried out to date have all yielded some indication of high oil and gas production potential in these regions. This article presents the results of gas-geochemical studies of seafloor sediments of the East Siberian Sea, obtained in three expeditions onboard the R/V “Akademik Lavrentiev” in 2008 (LV45), 2016 (LV77), and 2020 (LV90). The composition of sorbed hydrocarbon gases in seafloor sediments was analyzed. In addition, the stable isotopic composition of carbon was determined for CH4, C2H6, and CO2 in gases, which were desorbed from marine sediments. The sediments were also analyzed for organic matter content. Despite the absence of observable gas seepage directly into the water column, at some stations, increased concentrations of methane and hydrocarbon gases were encountered, indicating the widespread predominance of thermogenically derived gases. We present a hydrocarbon classification system which delineates eight identifiable sources of regional gas occurrences (coal gas, igneous rocks, solid bitumen, condensate-gas, gas-condensate, oil gas, gas oil, and oil gases). A stable isotopic analysis of carbon in CH4, C2H6, and CO2 indicates varying degrees of mixing between a shallow, early-kerogen gas source and a deeper mantle carbon source in some areas of the study.
The marginal-shelf zone of the East Siberian Sea (ESS), continental slope, and Podvodnikov basin of the Arctic Ocean (AO) have only in recent decades garnered close attention by scientists from around the world. This is related not only to improved access in the region but also to a growing body of geological evidence, indicating the presence of oil and gas fields of production potential (Sherwood, 1998; Kim et al., 2007; Khain et al., 2009; Bird and Houseknecht, 2011; Kim et al., 2016; Kazanin et al., 2017a; Kazanin et al., 2017c; Houseknecht et al., 2019) and a general interest in the consequences of global warming related to hydrocarbon release from polar regions (Shakhova et al., 2010).
Gas geochemistry is among the main methods used for prospecting hydrocarbon deposits (Horvitz, 1985; Hunt et al., 2002; Abrams, 2005; Gresov, 2011; Abrams, 2017). Such geochemical analyses of hydrocarbon gases (HCGs) that have migrated to the surface can provide useful information on subsurface hydrocarbon systems, especially in poorly explored “frontier” areas which lack information on petroleum systems which would otherwise be gleaned from deep drilling (Weniger et al., 2019). The main methodological approaches in the field of isotope gas geochemistry are well-documented by (Bernard et al., 1976; Schoell, 1983; Whiticar et al., 1986; Schoell, 1988; Whiticar, 1996; Galimov, 2006; Faber et al., 2015; Milkov and Etiope, 2018). The study of concentration and distribution of HCGs in gas-saturated sediments is, therefore, of key importance in understanding the conditions which have given rise to the formation of active gas seep systems. Arctic seeps are actively being studied in various regions of the AO; however, there are limited data regarding gas genesis. Several previous investigations have been conducted in the western region of the AO (Westbrook et al., 2009; Portnov et al., 2013; Mau et al., 2017; Pohlman et al., 2017; Pape et al., 2020) and in the Laptev Sea (Sapart et al., 2017; Baranov et al., 2020; Steinbach et al., 2021). Gas seeps have also recently been discovered in the East Siberian Sea (Thornton et al., 2020) (Figure 1).
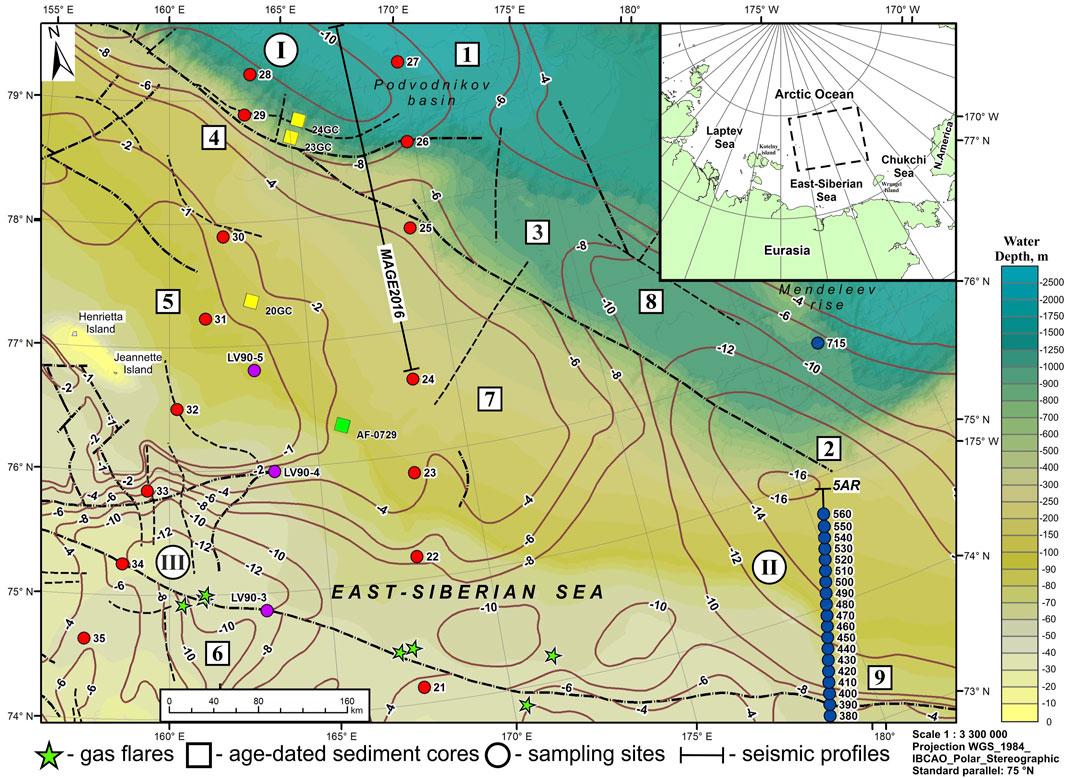
FIGURE 1. Structural tectonic map of the research area with isolines showing sedimentary cover thickness in kilometer (After Geological Map, 2015 and Geological Map of Russian Federation and Adjacent Waters, 2016) and bathymetry from IBCAO version 3.0 (Jakobsson et al., 2012). Sedimentary basins are as follows I) Cis-East Siberian, II) North Chukchi, and III) Novosibirsk. Geological structures are as follows: 1) Vilkitsky Depression West, 2) North Chukchi Depression, 3) Kucherov uplift, 4) Lomonosov–Mendeleyev flexure–faults zone, 5) De Long uplift, 6) Novosibirsk Depression, 7) North structural terrace, 8) Vilkitsky Depression East, and 9) Kolyuchinsky graben-rift. Position of observed gas flares (green stars) is from Thornton et al. (2020). The location of age-dated sediment cores (square) is from O’Regan et al. (2017), yellow square; and Geological Map (2015), green square. Gas geochemical sampling sites (circle) were sampled in 2008 (LV45), blue circle; 2017 (LV77), red circle, and 2020 (LV90), violet circle. Seismic profiles: 5AR from Sakulina et al. (2011) and MAGE 2016 from Kazanin et al. (2017a).
Hydrocarbon gases in seafloor sediments are primarily the result of two types of genesis: microbial (syngenetic) and thermogenic (epigenetic coupled with migration). Microbial HCGs, predominantly CH4, form within seafloor sediments as a result of microbial degradation of organic matter, where methane is the primary gas produced at relatively low temperature (Claypool and Kaplan, 1974; Whiticar et al., 1986; Stolper et al., 2014). Thermogenic HCGs, on the other hand, tend to have a much higher concentrations of C1–C5 gases and form in deep sediments and rocks through the thermal cracking of organic matter (Claypool and Kvenvolden, 1983; Stolper et al., 2014). Oils generated through thermal cracking can also undergo microbial degradation, resulting in secondary hydrocarbon gases (Head et al., 2003; Etiope et al., 2009; Milkov, 2011). In addition, CH4 can be of abiogenic origin and is produced in different geologic environments under a wide range of temperature and pressure during magmatic, volcanic, and high-temperature hydrothermal processes (Giggenbach, 1997; Etiope and Sherwood, 2013; Wen et al., 2016); however, in these cases methane is often not the primary gas present; CO2 is much more abundant.
Previous investigations have indicated several different isotopic features of HCGs in various areas of the Arctic Ocean (Knies et al., 2004; Cramer and Franke, 2005; Matveeva et al., 2015; Serov et al., 2015; Blumenberg et al., 2016; Lorenson et al., 2016; Graves et al., 2017; Sapart et al., 2017; Sevastyanov et al., 2019; Weniger et al., 2019; Kim et al., 2020).
Isotopic and gas-geochemical features of HCGs of seafloor sediments of the East Siberian Sea shelf has been discussed in a number of studies over the past decade (Shakirov et al., 2013; Gresov et al., 2016; Gresov et al., 2017; Gresov A. I. and Yatsuk A. V., 2020; Gresov A. I. and Yatsuk A. V., 2020; Gresov and Yatsuk, 2021). As a result of these works, the gas saturation and isotope-geochemical characteristics of HCGs in the bottom sediments of the southeastern sector of the ESS (Ayon, Longa, and Pegtymel sedimentary basins) have been studied. Potentially promising oil-bearing areas of the shelf have been identified and a comparative assessment of continental and subaqueous sources of hydrocarbons has been carried out.
In general, despite the significant amount of preliminary research which has been carried out in the East Arctic region, the degree to which detailed gas-geochemical data have been applied to ascertain the regional distribution of hydrocarbons and other gases in the bottom sediments of the ESS and the AO remains extremely limited.
The aim of this work is to study the chemical and isotopic composition of hydrocarbon gases (HCGs) in the seafloor sediments and determine gas-geochemical parameters and potential gas sources of the research area. By carrying out such work, we hope to determine the prospects of oil and gas potential across the region, filling in some of the gaps in our current knowledge of hydrocarbon distribution in the area.
The study area is located in the central part of the outer shelf of the ESS and the adjacent deep-water sector of the AO. This sector is covered almost year-round with ice and only occasionally in recent years have the waters been navigable for marine research.
The outer shelf of the study area is represented by the transition of a subhorizontal plain to an inclined plain which replaces it, with the overall bathymetry complicated by the island uplifts of Jeannette and Henrietta (Figure 1). De Long’s Ledge and a series of underwater valleys, mostly parallel to each other, also cross-cut the otherwise uniform bottom topography (Geological Map, 2015). The marginal-shelf zone of the ESS comprises the outer shelf and edge of the shelf and is bounded by isobaths of −100 and −200 m. At depths greater than 300 m, the slope steepens appreciably, with the maximum slope occurring between 500 and 700 m water depth. In Podvodnikov Basin (PB), where sea depths exceed 2500 m, the terrace and foot of the basin are traced to depths of 1200–2000 m and 2100–2400 m, respectively (Kazanin et al., 2017a).
Late Pleistocene and Holocene sediments of the study area are represented by clayey silt and silty clay, respectively. The total thickness of Quaternary sediments does not exceed 200 m (Geological Map, 2015; Kazanin et al., 2017a). Most of the bottom sediments of the outer shelf are reduced gray, dark gray, or black clayey silt sediments. Oxidized light brown, brown, and greenish silty clay sediments are characteristic of the continental slope, PB, and the deep-water part of the AO, respectively. The upper 0.1–0.6 meters of seafloor sediments are characterized by the Holocene age, and the deeper intervals are characterized by the Late Pleistocene age (Geological Map, 2015; O'Regan et al., 2017). Based on the small number of stations with age dating of sediments (Figure 1), presumably all the deep intervals of core samples from bottom stations studied by us are characterized by sediments of the Late Pleistocene age.
The tectonic structure of the study area is represented by three large sedimentary basins: Cis-East Siberian, North Chukchi (marginal-shelf basins), and Novosibirsk (intrashelf basin). Sedimentary basins are separated by the North structural terrace and by the De Long and Kucherov uplifts (Figure 1). An important structural and tectonic element that unites the Cis-East Siberian and North Chukchi basin is the Lomonosov–Mendeleev flexure-fault zone. In the Novosibirsk Basin, a similar element is the fault zone of the same name, complicated by its feathering thrusts (Geological Map, 2015; Kazanin et al., 2017a; Kazanin et al., 2017b). The geological structure of the region is characterized by a block structure of the earth’s crust and is limited by steeply dipping faults. The amplitude of displacement along faults reaches 2 km. Rifting is the leading process in the formation of most geological structures in the study area (Geological Map, 2015).
Information about the geological structure of the study area is based on published material from seismic surveys by Sevmorgeo, VNIIOkeangeologia, and MAGE (Sakulina et al., 2011; Verba, 2016; Kazanin et al., 2017a; Kazanin et al., 2017b; Kazanin et al., 2017c; Poselov et al., 2017) and seismic exploration and drilling of deep wells in the American sector of the Chukchi Sea (Sherwood, 1998; Bird and Houseknecht, 2011; Lorenson et al., 2011; Houseknecht et al., 2019). Because there is no drilling on the ESS shelf, an important source of information is also geological mapping of the nearest island territories (Franke and Hinz, 2012; Geological Map, 2015; Kus et al., 2015; Borukaev, 2017).
Geologically, in the study area, the Pre-Paleozoic formations are distinguished, represented by the basic layer of the lower crust and the diorite layer of the upper crust (Figure 2A). The depth of the mantle in the eastern part of the region is 29–30 km and that of basic and diorite layers is 17–20 and 13–17 km, respectively. The Archean–Proterozoic granite metamorphic layer of the upper crust along the 5AP profile was recorded up to station 440 (Figure 2A) (Sakulina et al., 2011; Kazanin et al., 2017c). In the western part of the study area, Archean–Proterozoic rocks are closest to the surface on the De Long uplift and in the area of Henrietta and Jeannette Islands (Franke and Hinz, 2012; Geological Map, 2015; Nikishin et al., 2021).
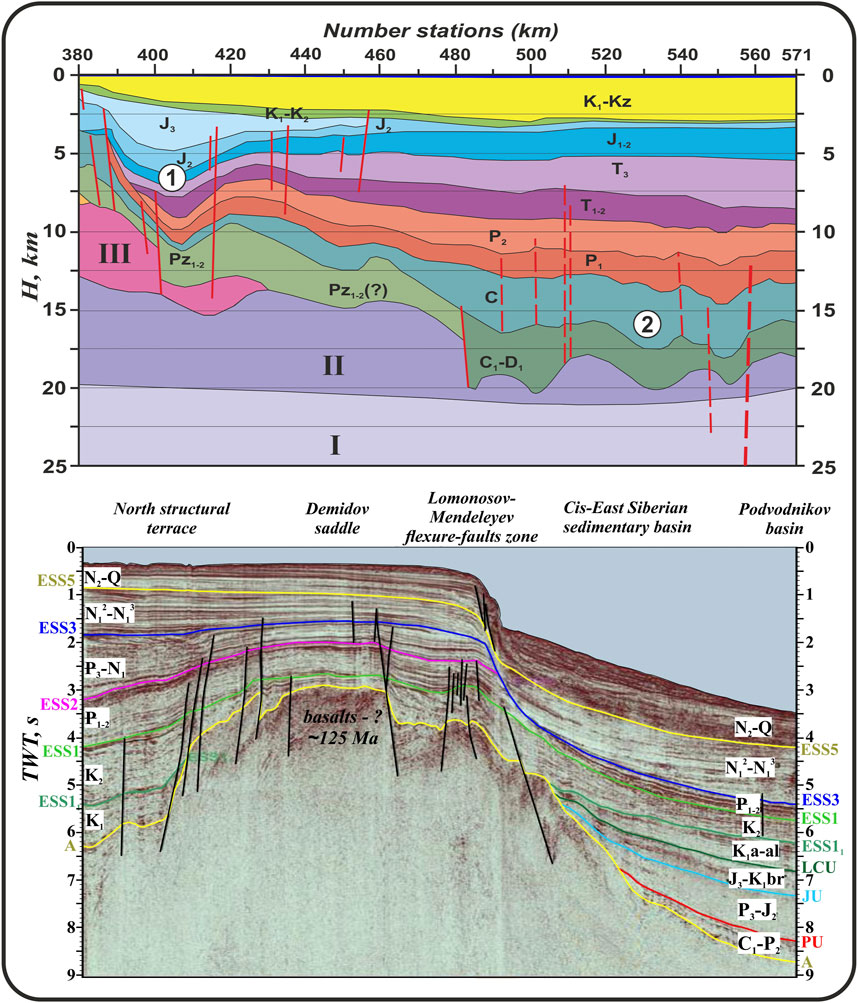
FIGURE 2. Geoseismic profiles of the East Siberian Sea: (A) 5AR—after Sakulina et al. (2011). Geostructures are as follows: 1) Kolyuchinsky graben-rift and 2) North Chukchi Depression. Pre-Paleozoic formations are (I) basite layer of the lower crust, II) diorite layer of the upper crust, and III) Archean–Upper Proterozoic granite-metamorphic layer of the upper crust. Red lines—known faults (solid) and assumed (discontinuous). (B) MAGE2016—after Kazanin et al. (2017a). Colored lines—reflectors of geoseismic rock associations and black lines—faults.
In the overlying Paleozoic, Mesozoic, and Cenozoic formations, by analogy with the American part of the Chukchi Sea (CS) and Northern Alaska, five structural and stratigraphic seismic complexes are distinguished (Figure 2B), separated by the surfaces of regional unconformities EU, PU, JU, BU (ESS11), mCU (ESS1), ESS2, RU (ESS3), and MU (ESS5): Lower Elsmir (Devonian–Lower Permian), Upper Elsmir (Upper Permian–Triassic–Lower Jurassic), Rift (Upper Jurassic–Barremian), Lower Brook and Upper Bermian (Aptian–Upper Bermian) complex, and others. These complexes are identified in the American sector of CS by using the well-drilling data (Sherwood, 1998; Bird and Houseknecht, 2011; Houseknecht et al., 2019) and can be traced to the west in the Russian sector of the CS and ESS, which suggests that the development and structure of these study areas are similar (Kazanin et al., 2017a; Kazanin et al., 2017b; Poselov et al., 2017; Nikishin et al., 2021). The similarity of the geological structure and the proven commercial oil and gas reservoir of the American sector of CS and Northern Alaska allow a favorable assessment of the hydrocarbon potential of the ESS.
The data for research ESS and AO were collected during three expeditions onboard the R/V Akademik M.A. Lavrentiev (Figure 1). Cruise LV45 was carried out in August/September 2008 along the meridional geological and geophysical profile 5AR (Sakulina et al., 2011; Shakirov et al., 2013; Verba, 2016; Gresov et al., 2017). The sample profile of the cruise LV45 (step of the stations is 10 km each) coincides with a multichannel seismic line 5AR (“Sevmorgeo”). Cruises LV77 (September 2016) and LV90 (September 2020) were carried out within the framework of the Russian–Chinese Arctic program “Arctic Silk Way”. On these cruises, the stations were operated along sparse profiles, depending on the actual ice conditions.
Seafloor sediments were collected using gravity corers of different length, ranging from 3 m to 8.35 m. Each core contained precut plastic liners (from 2.5 to 6 m in length). After arriving on the vessel deck, the gravity corers were disassembled, and the liners were immediately moved to the ship’s laboratory for sediment sampling. In total, coring was completed for 38 stations (Figure 1) at depths from 36 to 2565 m (Table 1). The total core length recovered from each gravity core ranged from 45 to 412 cm.
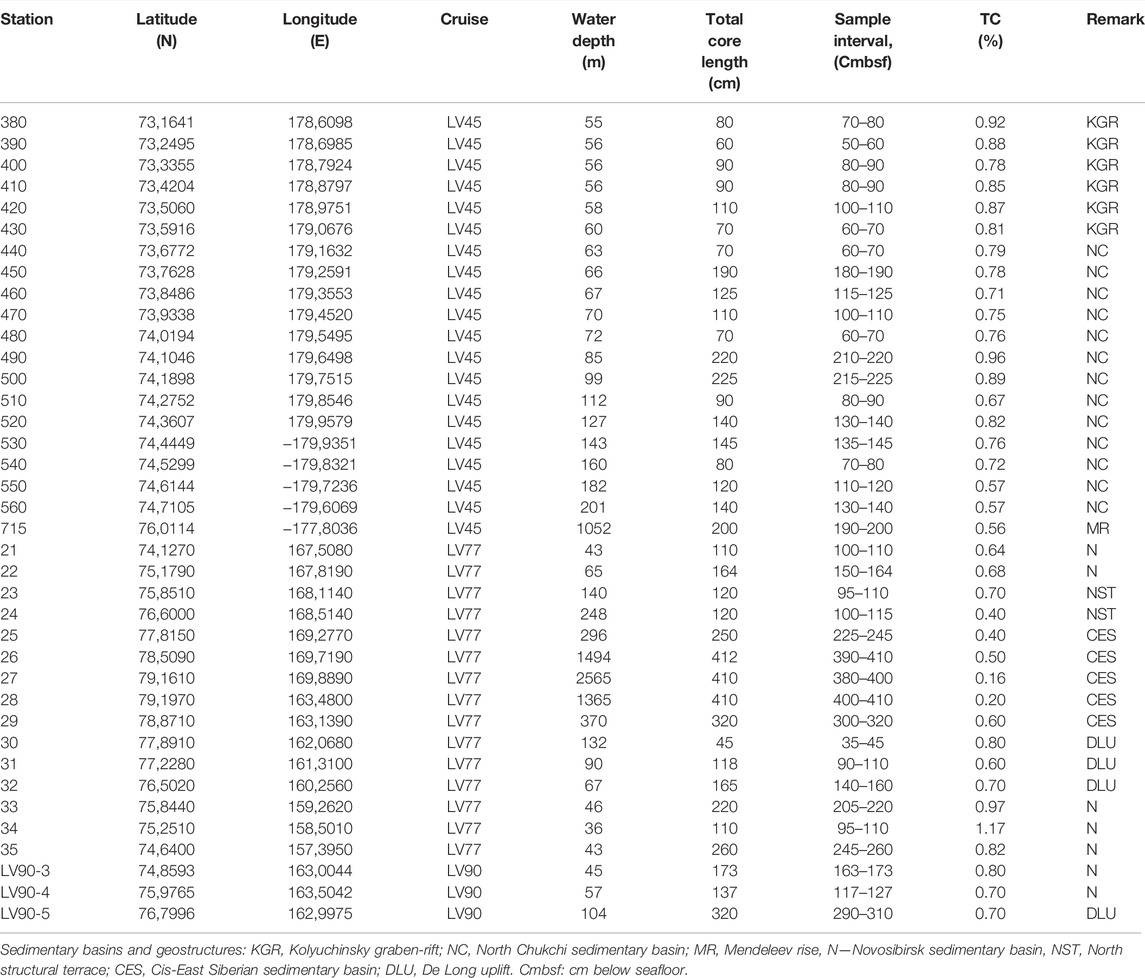
TABLE 1. General information about the research area.
Gas extraction from sediments was carried out by thermal vacuum degassing (TVD). Sediment samples (70–80 ml) were taken with 20-ml plastic syringes in 116-ml glass clear vials and immediately closed by sealed rubber caps with a closing valve. The lowest part of each core was used for sampling (Table 1). A total of 88 vials with sediments were selected (replicated two to three samples for each core). Sorbed gases were extracted using compact degassing systems of laboratory gas geochemistry POI, connected to each collecting vials. The maximum heating temperature was 60 °C. The working vacuum in the system was 0.9 atm. Degassing of each sample included three stages: free gas extraction at room temperature, thermal degassing (heating in water bath), and thermal vacuum degassing. The duration of gas extraction, depending on the type of sediment, was from 30 to 60 min. The work was carried out according to the current regulatory instructions (IGD’Skochinsky, 1977; VNIIGRIugol’, 1988), adapted to the features of marine sediments. The extracted gas sample was transferred into 68-ml sealed glass vials. In total, 198 gas samples were received after extraction. Duplicate samples were averaged for each station and thus formed the final selection of 38 samples (Table 2). Gas analysis was carried out immediately in ship laboratories (cruises LV45, LV90) or after completion of work (LV77); in this case, the samples were stored at 4 °C until GC analysis.
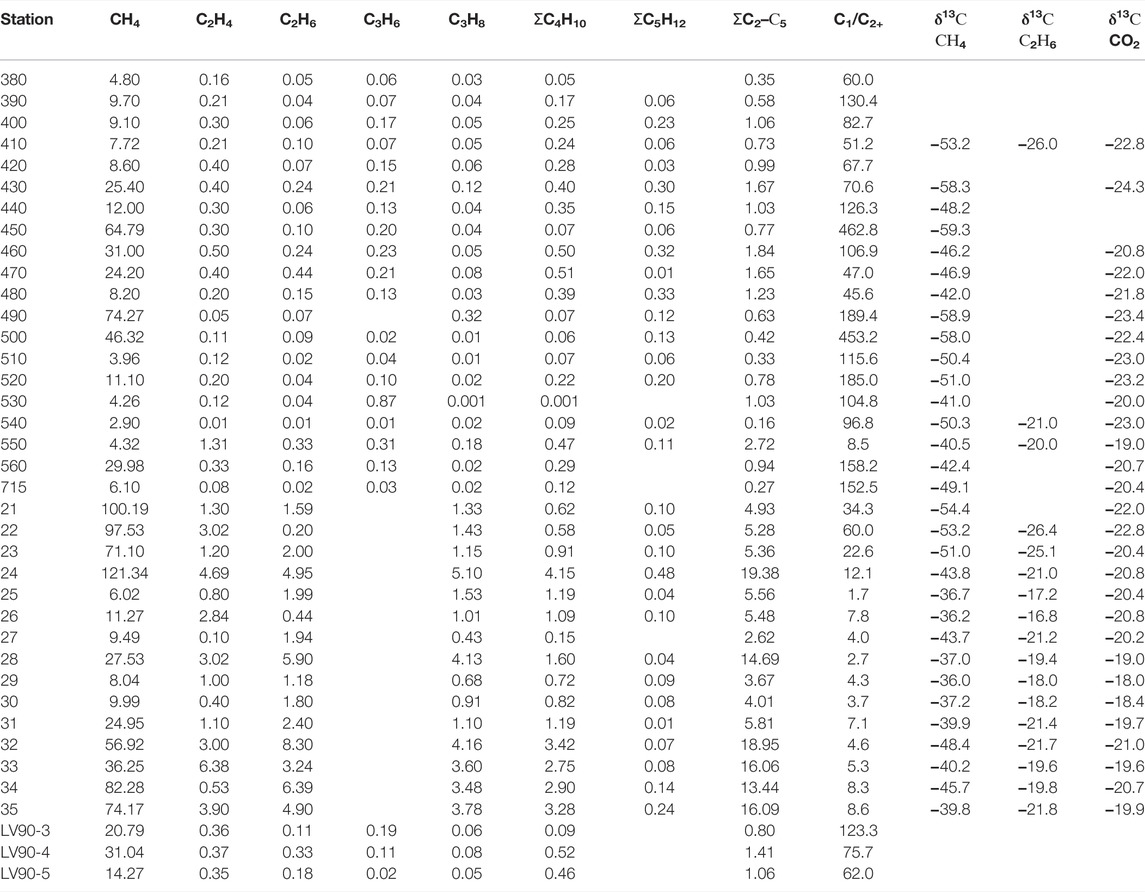
TABLE 2. Average values of gas composition (ppm, 10−4 vol%), C1/C2+ ratio, and carbon stable isotope ratios of sorbed gases in sediments from study area.
Gas analysis was performed by gas chromatography on a “CRISTALLUX 4000M” gas chromatograph (“Meta-Chrome”, Yoshkar-Ola, Russia). The sample was injected into the chromatograph using a sealed syringe. The minimum sample injection volume is 4 ml. The chromatograph module has three detectors: two thermal conductivity (TCD) and one flame ionization (FID) detectors. FID allows one to study the quantitative content of hydrocarbon composition (C1–C6) with a sensitivity of 10−6%. Inorganic gases, such as nitrogen, oxygen, carbon dioxide, and methane, with a concentration of more than 1%, were analyzed on a TCD, the sensitivity of which is 0.01%. A gas chromatograph has two packed columns: HayeSep R column, 2.5 m length, 2.5 mm i.d, 80/100, “Meta-Chrome”; NaA column, 3 m length, 3 mm i.d, 60/80. The temperature program was 50°C, 3 min hold, heating at 10°C/min to 190°C, 14 min hold at 190°C, and 3 min hold. The temperature for detectors was 195°C and that for the evaporator was 160°C. Carrier gas was ultrapure helium 6.0. The carrier gas flow rate was 20 ml/min, for hydrogen 30 ml/min, and for air 250 ml/min. Total analysis time was 20 min. Calibration gas mixtures of HCGs were manufactured by Air Liquide (Scott™), PGS Service, and VNIIM (concentration ranged from 1 ppm to 1%). The relative error of measurements does not exceed 5%. For laboratory gas geochemistry, POI FEB RAS was certified for measurements by Rosstandart (Russia).
Determination of carbon isotope composition δ13С-СН4, С2Н6, and CO2 was carried out in the laboratory of stable isotopes of the Far East Geological Institute (FEGI) and the Center for Isotope Research of the Russian Geological Research Institute (VSEGEI). The following equipment was used to perform the analyses: a high-vacuum setup for preparing samples for isotopic analysis and a mass spectrometer for the analysis of stable isotopes, Finnigan MAT 253 or Deltaplus XL using a double inlet system for measuring 13C/12C isotope ratios. Sample preparation for isotopic analysis was carried out using the method described by Velivetskaya et al., (2015). The measurement results for δ13C are given relative to the international VPDB standard and are expressed in ppm (‰):
where R is the carbon isotope ratio 13C/12C. Reproducibility of δ13С results in repeated analyses is ±0.2‰. In total, the stable carbon isotope ratios of methane were measured in 31 samples, ethane in 17 samples, and carbon dioxide in 29 samples (Table 2).
Total carbon (TC) contents of the lowest part of sediments were determined on subsamples collected in intervals for sorbed gas analysis. A total of 38 samples were analyzed by IR detection on a TOС-VCPN analyzer (Shimadzu, Japan). The measurement relative error did not exceed 1.5%. Measurements were carried out at the accredited Analytical Center (laboratory of analytical chemistry) of FEGI FEB RAS.
Cartographic data were produced in the ESRI®ArcGIS 10.2 software package. Distribution diagrams were compiled using Grapher 12.0. Statistical data were processed in the STATISTICA 10 program.
A complex of quantitative geochemical indicators was used to determine the genesis of HCGs: molecular mass of the hydrocarbon fraction, weight concentrations of particular hydrocarbons, their ratios, and data on the carbon isotope composition of δ13С-СН4, С2Н6, and СО2.
The molecular mass of the hydrocarbon fraction (MMHC) is the average weighted sum of the hydrocarbon component (Velev, 1974; Velev, 1981; Gresov, 2011). MMHC was based on the sum of the molecular weights of each hydrocarbon gas (C1—C5, g/mol). The next important parameter closely related to MMHC is weight concentrations of hydrocarbons normalized in relation to MMHC in parts per thousand (Velev, 1974; Velev, 1981; Gresov, 2011). These parameters are used for gas geochemical classification of gas sources.
A change in the composition of HCGs during their long existence in reservoirs, under changing thermobaric and geochemical conditions, is accompanied by a change in methane homolog content. With an increase in temperature, redistribution of methane homologs occurs—the conversion of propane to ethane and butane and propane and butane to ethane and pentane. To assess the degree of conversion of methane homologs, we used the ratio of the concentration product of ethane and butane to the propane content. The parameter is called the coefficient of the transformation hydrocarbon fraction (Gresov, 2011) in the form of
where C2, C3, and C4 are the weighted concentrations of ethane, propane, and group of butane, respectively. The value of Ktr is quite closely related to the age of the gas-bearing reservoir and indicates not only the degree of methane homolog conversion but also the time of formation and duration of HCG presence in the trap (Gresov, 2011; Gresov A. I. and Yatsuk A. V., 2020).
The Abrams coefficient (“wet” of hydrocarbon gases) (Abrams, 2005; Abrams, 2017) is widely used in world practice of gas-geochemical studies as an indicator of the enrichment degree of “heavy” hydrocarbon fractions. The value of Kwet represented by the ratio is as follows:
where C1–C5 are the weighted concentrations of hydrocarbons (in the author’s version, instead of vol% in Abrams, 2005). Kwet values are a rather informative indicator of the degree of maturity of selected gas sources (geological formations) and the genesis of HCGs of the continental margin and the southeastern part of the ESS shelf (Gresov A. I. and Yatsuk A. V., 2020; Gresov and Yatsuk, 2021).
The informative base of gas-geochemical studies is presented by materials of studied natural gases from the bottom sediments of the inner shelf of the ESS (Gresov et al., 2016; Gresov et al., 2017; Gresov A. I. and Yatsuk A. V., 2020; Gresov A. I. and Yatsuk A. V., 2020; Gresov and Yatsuk, 2021).
An additional indicator for determining the genesis of HCGs is the “Bernard coefficient”—C1/C2+ (Bernard et al., 1976) and the “Bernard plot”—C1/C2+ versus δ13C-CH4 (Bernard et al., 1976; Whiticar, 1999). It is generally accepted that for gases of thermogenic genesis, the Bernard coefficient is less than 100 (Bernard et al., 1976; Whiticar, 1999) and for typical microbial gases, it exceeds 1000 (Bernard et al., 1976; Whiticar, 1999; Milkov et al., 2005; Kim et al., 2020; Pape et al., 2020). Secondary microbial gases from oil degradation generally have C1/C2+ ratios between 10 and 1000. The isotopic composition δ13C-CH4 of primary microbial genesis is respectively less than −55‰ or −60‰ (Milkov et al., 2005; Kim et al., 2020; Pape et al., 2020), while for secondary microbial gases δ13C-CH4, it is between −50‰ and −30‰.
The plot δ13C-CH4 versus δ13C-CO2 has been used to distinguish between gases of different source origin: abiotic, thermogenic, primary microbial (Milkov and Etiope, 2018), and secondary microbial (Head et al., 2003; Milkov, 2011). In addition, the same plot has been used for the interpretation of fluid compositions ranging from high-temperature hydrothermal and geothermal systems to lower-temperature natural gas discharges based on the temperature-dependent isotopic equilibrium between CH4 and CO2 (Giggenbach, 1997; Horita, 2001; Hulston, 2004).
The plot δ13C-CH4 versus δ13C-C2H6 has been used for isotope/maturity forecast between organic precursors—huminitic vs. exinitic (Berner and Faber, 1996; Milkov, 2021). This ratio is very useful if data about regional carbon isotope values and maturity (vitrinite reflectance) of the sources of kerogen are available.
The total carbon content (TC) of the lowest part of sediment cores from the study area ranges from 0.16 to 1.17% (average = 0.71%) (Table 1). The maximum TC is found within the Kolyuchinsky graben-rift and the North Chukchi and Novosibirsk sedimentary basins (Table 1). Such features of the distribution are mostly due to the influence of river runoff and morphological and hydrodynamic features of the study area. The results are in good agreement with data on surface sediment composition by the CASCADE project (Martens et al., 2021).
The gas composition of the sorbed HCGs is presented in Table 2. The concentrations are given in parts per million (ppm, 10−4 vol%) and show a wide range of variability. Methane is the dominant component in HCGs. The CH4 concentrations range from 2.90 to 121.34 ppm (median = 17.53 ppm). There is a weak correlation between CH4 and C3H8 along with butane groups (r2 = 0.35 and 0.31). The maximum concentrations of methane in seafloor sediments are found within the Novosibirsk sedimentary basin and the North structural terrace. The minimum concentrations of methane are typical for stations in the Cis-East Siberian and North Chukchi sedimentary basins (Figure 3A).
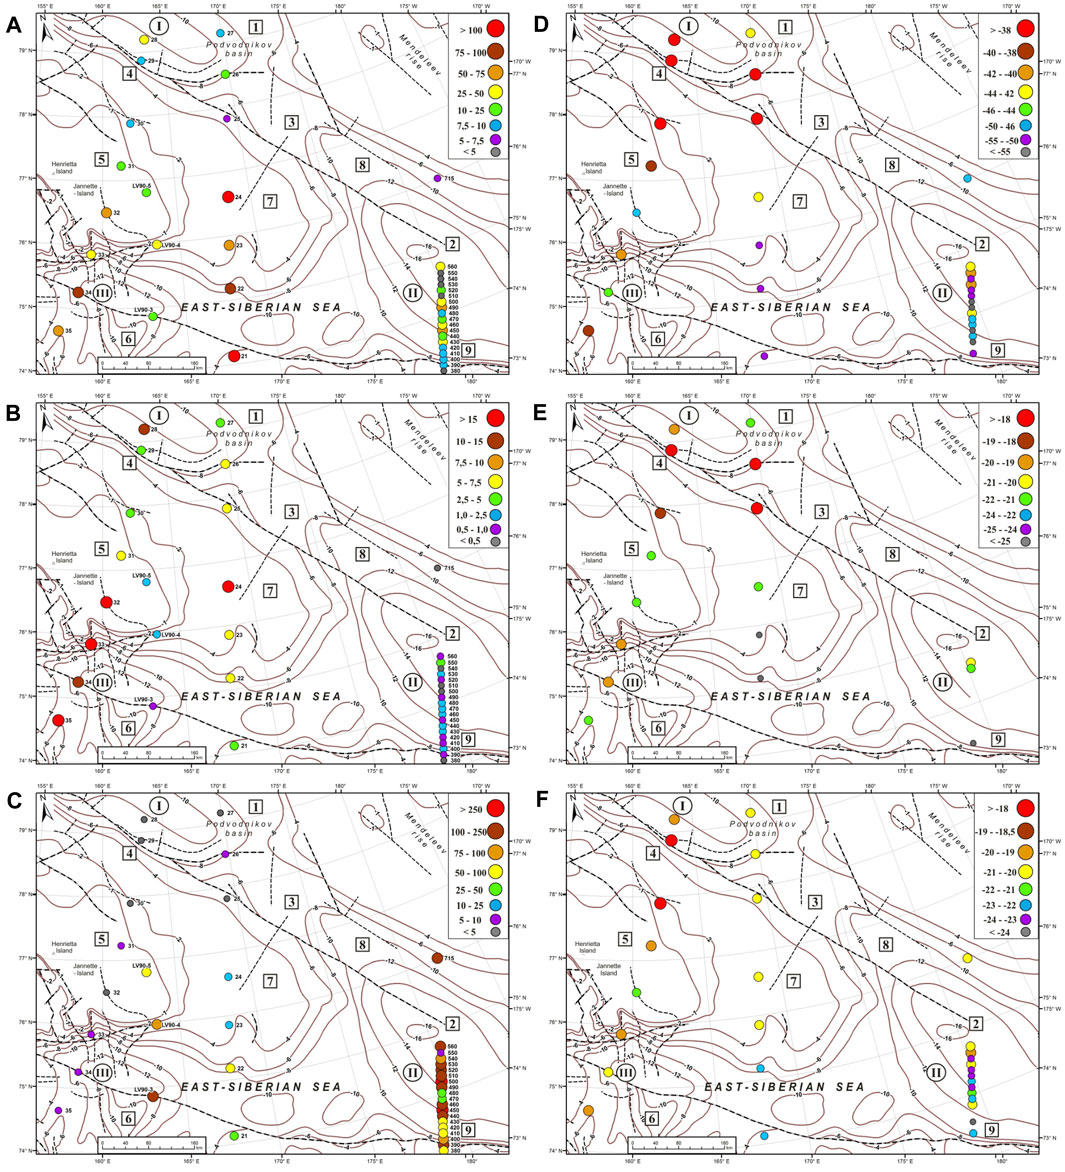
FIGURE 3. Distribution plot of the concentration of CH4 in ppm (A), C2–C5 in ppm (B), gas ratio C1/C2+ (C), and carbon isotope data of δ13C-CH4 (D), δ13C-C2H6 (E), and δ13C-CO2 (F).
Saturated HCGs are represented by ethane, propane, butane (sum of i-C4 and n-C4), and pentane (sum of i-C5 and n-C5). Ethane and propane were detected in all samples, ranging from 0.01 to 8.30 ppm (median: 0.22 ppm) and from 0.001 to 5.10 ppm (median: 0.08 ppm), respectively. The butane group concentrations range from 0.001 to 4.15 ppm (100% of samples, median = 0.43 ppm) and the pentane group from 0.01 to 0.48 (79% of samples, median: 0.09 ppm). In the ethane–propane–butane group, a good correlation was identified: ethane–propane (r2 = 0.85), ethane–butane (r2 = 0.79), and propane–butane (r2 = 0.90). Unsaturated hydrocarbons (ethene and propene) exceed saturated homologs (ethane and propane) in most samples from the eastern part; the opposite picture is observed in the western part of the study area (Table 2). Ethylene concentration ranges from 0.01 to 6.38 (100%; median: 0.38) and propylene from 0.01 to 0.87 (58%; median: 0.13). In general, the total content of C2–C5 hydrocarbons is higher in the western part of the study area (maximum concentrations are found within the North structural terrace, De Long uplift, and Novosibirsk basin) than in the eastern part (minimum in the Kolyuchinsky graben-rift and the North Chukchi basin) (Figure 3B).
The C1/C2+ ratio ranges from 2 to 463 (Table 2), lower values are observed in western part of the study area (Cis-East Siberian basins, De Long uplift, and Novosibirsk basin), and higher values in the east (North Chukchi basin) (Figure 3C).
Since our research has not found active gas seepage, the predominant type of gas migration in the near-surface sediments is upward diffusion of deeply derived thermogenic HCGs coupled with shallow contributions of microbial gas formed in situ. Methane concentrations are significantly lower than those of other regions which have been shown to host gas hydrates, such as the northern part of the Chukchi Sea (Kim et al., 2020). Previous studies in ESS have also noted low concentrations of methane in pore water (Miller et al., 2017). Unfortunately, the work of Miller et al. (2017) does not provide any information about real concentration values of methane and its homologs. The study does indicate that the sulfate–methane transition (SMT) zone is deep, ranging from 23 to 64 meters. We did not measure sulfate in our study. Given our depth range of gravity coring, we assume that that all our samples were collected within the sulfate reduction zone, shallower than the methanogenic zone. This may explain such small concentration range of methane. Despite this, the concentrations of HCGs in our work is an order of magnitude higher than those observed in both the Barents Sea (Knies et al., 2004; Blumenberg et al., 2016; Weniger et al., 2019) and the Laptev Sea (Cramer and Franke, 2005), but lower than in the Kara Sea (Serov et al., 2015) and the Chukchi Sea (Kim et al., 2020). These differences can possibly be associated with regional features of the distribution of HCGs or they may be associated to differences in station selection strategy and methodological approaches (headspace technique, TVD, and acid extraction).
The carbon isotopic signatures of the sorbed hydrocarbon gases (δ13C-CH4 and δ13C-C2H6) and carbon dioxide (δ13C-CO2) are shown in Table 2. The isotope composition of methane carbon (δ13С) varied from −59.3 to −36.0‰, ethane from −26.4 to −16.8‰, and carbon dioxide from −24.3 to −18.0‰. Good correlation was identified for δ13C-CH4–δ13C-C2H6 (r2 = 0.76) and δ13C-CH4–δ13C-CO2 (r2 = 0.70) and weak correlation for δ13C-CO2–δ13C-C2H6 (r2 = 0.37). The spatial distribution of carbon isotopic signatures is shown in plots (Figures 3D–F). The maximum values for all three components were obtained in the northwestern part of the study area (Cis-East Siberian sedimentary basins and Lomonosov–Mendeleev flexure-fault zone).
The values of the MMHC vary in the range from 16.31 g/mol to 27.53 g/mol, Ktr from 4.0 to 354.2, and Kwet from 2.5 to 69.7%. Within this group of parameters, there is a good and moderate correlation: MMHC–Kwet (r2 = 0.97), Ktr—Kwet (r2 = 0.67), and MMHC–Ktr (r2 = 0.65). In addition to this, a wide relationship with carbon isotope data was found (r2 = 0.42–0.78). The spatial distribution of gas genesis parameters is shown in plots (Figures 4A–C).
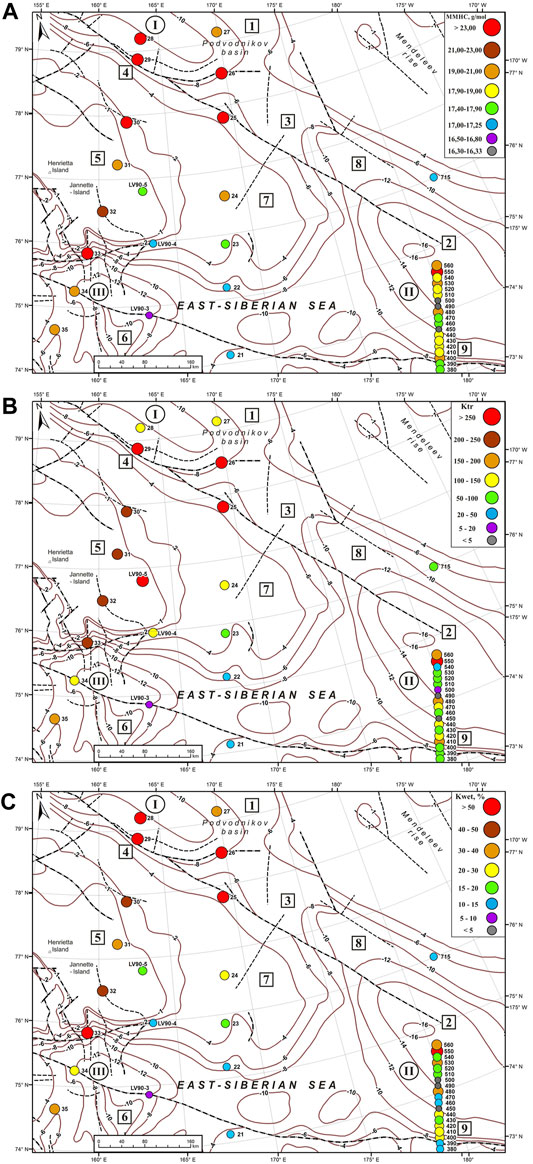
FIGURE 4. Distribution plot of the gas-geochemical parameters of sorbed HCGs of bottom sediments: MMHC (A), Ktr (B), and Kwet (C).
Based on previous experience and interpretation of gas-geochemical parameters in continental sedimentary basins of the Balkan region, Northern Bulgaria (Velev, 1974; Velev, 1981), Far East of Russia (Gresov, 2011), and subaqueous sedimentary basins ESS (Gresov et al., 2016; Gresov et al., 2017; Gresov A. I. and Yatsuk A. V., 2020; Gresov A. I. and Yatsuk A. V., 2020; Gresov and Yatsuk, 2021), we have compiled a generalized summary of the geochemical indicators for the southeastern part internal shelf of the ESS (Table 3). This made it possible to perform similar work for the external shelf of the ESS and adjacent part of the AO.
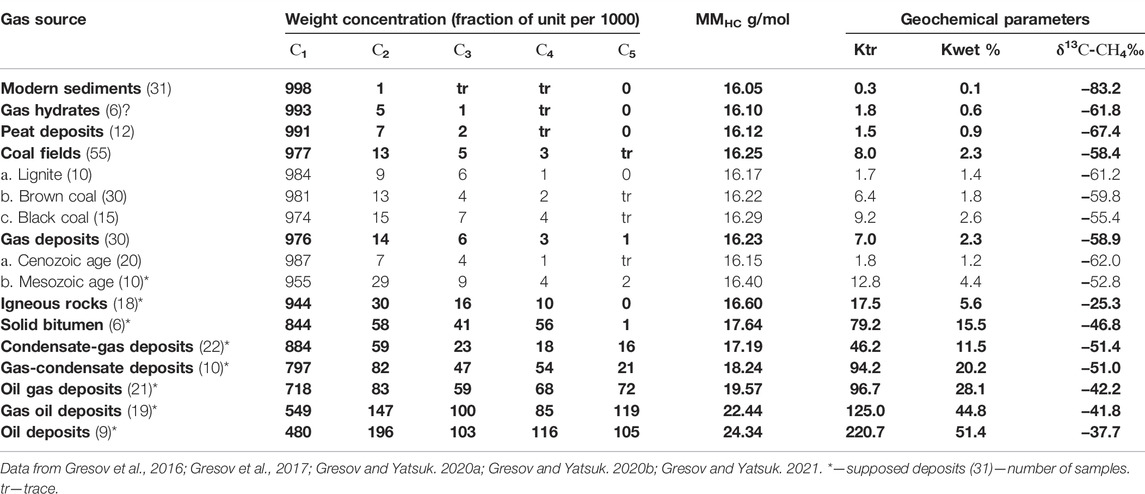
TABLE 3. Average values of geochemical indicators of bottom sediment hydrocarbon gases of the inner shelf of the East Siberian Sea.
Thus, we have determined eight main genetic groups of epigenetic HCGs in sediments of the edge shelf zone of the East Siberian Sea and adjacent part of the Arctic Ocean (Table 4). We assumed that these gases emanated from the supposed underlying deep sources in the process of natural diffusion and migration along the fault zones and lineaments of the study area. Relatively low values of total carbon content in sediments, probably from the Pleistocene age, appear to be responsible for the low levels of microbial gas formation in modern sediments. These gases are quite complicated to identify due to their mixing with the underlying migration gases of geological formations.
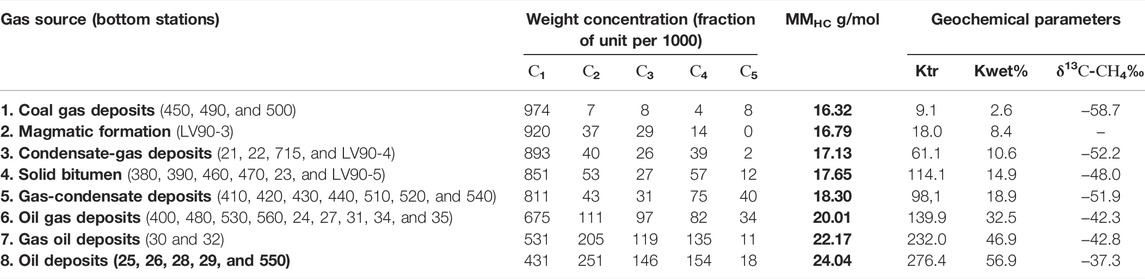
TABLE 4. Average values of geochemical indicators of bottom sediment HCGs of the edge shelf zone of the East Siberian Sea and adjacent part of the Arctic Ocean.
The first genetic group of HGCs is associated with black coal. The group is poorly represented in the study area (Table 4). The group is characterized by the values of the coefficients: MMHC: 16.29–16.33 g/mol, Ktr: 4–19, Kwet: 2.5–2.7, and δ13С-СН4 and СО2: −58 ... −59.3 and −23.4 ... −22.4‰, respectively. In contrast to the areas of the inner shelf (Gresov A. I. and Yatsuk A. V., 2020; Gresov and Yatsuk, 2021), this source is not predominant in the study area and occurs locally in the southern slope of the North Chukchi sedimentary basin (Figure 4A). The complexity of the formation of the first group determines the mixed polygenic composition of biochemical, thermogenic-transformed, and possibly magmatic gases formed in the upper part of the sedimentary cover. This is also confirmed by rather high values of the C1/C2+ ratio from 189 to 463, which is typical for gases of mixed genesis.
The second group of HCGs is also represented quite locally. Igneous HCGs are assumed for station LV90-3 with the following coefficient values: MMHC: 16.79 g/mol, Ktr: 18, and Kwet: 8.4. The values are close to those of the established gases of the Cretaceous igneous rocks of the southeastern part of the ESS. According to limited data, the isotopic composition of δ13С-СН4 varies from −29 to −25‰ (Gresov A. I. and Yatsuk A. V., 2020; Gresov A. I. and Yatsuk A. V., 2020).
The migration gases of the supposed condensate-gas deposits represent the third genetic group of HCGs of bottom sediments. The groups were characterized by the average value of MMHC: 17.13 g/mol, Ktr: 61.1, and Kwet: 10.6%. The C1/C2+ ratio ranges from 34 to 153. The average value of δ13С-СН4, С2Н6, and СО2 is –50.2, –26.4, and –21.7‰, respectively. The location of this group is mainly in Novosibirsk sedimentary basin (Figure 4A).
The fourth genetic group of hydrocarbon gases presented gas-geochemical parameters of solid bitumen of the continental-island framing and the internal shelf of the ESS (Table 3, Table 4). A specific feature of the gases in the eastern sector of the study area (stations 460, 470, 380, and 390) is their intermediate position between the sites of the first group and supposed oil gas deposits (Figure 4A) and in the western sector (station 23 and LV90-3) between station condensate-gas and oil gas deposit groups (Figure 4A). HCGs of the group are characterized by MMHC: 17.43–17.87 g/mol, Ktr: 72.9–257.0, and Kwet: 14.2–16.4%. The average value of δ13С-СН4, С2Н6, and СО2 is –48.0, –25.1, and –21.1‰, respectively. The C1/C2+ ratio is 71 in average. The formation of HCGs of solid bitumen is associated with the thermogenetic transformation of organic matter and in some cases with thermal influences of magmatic processes (anthraxolites) (Klubov, 1983; Borukaev, 2017; Gresov A. I. and Yatsuk A. V., 2020; Gresov A. I. and Yatsuk A. V., 2020). In general, the poorly studied issue of gas formation in solid bitumen in the East Arctic region requires more complicated research.
Migration gases of the supposed gas-condensate deposits represent the fifth genetic group of HCGs in sediments (Table 3, Table 4). This group has a value of MMHC ranging from 17.91 g/mol to 18.63 g/mol, Ktr: 42.3–151.0, and Kwet: 15.5–22.8%. The average value of δ13С-СН4, С2Н6, and СО2 is –51.9, –23.5, and –23.3‰, respectively. The C1/C2+ ratio is 102 in average. This group is most prevalent in the North Chukchi sedimentary basin (Figure 4A). Based on the gas-geochemical parameters, in the bottom sediments of the study area, there are probably two HCG subgroups of the supposed gas-condensate deposits with the values of Ktr 42.3–78.8 and 117.5–151.0. It has been established that HCGs of this group in most cases is a natural gas-geochemical "fringe" of oil and gas deposits.
Migration HCGs of the supposed oil gas, gas oil, and oil deposits represent the sixth, seventh, and eighth genetic groups of epigenetic gases of bottom sediments in the study area (Table 3, Table 4). The gas-geochemical parameters presented by MMHC: 19.35–20.71, 21.5–22.79, and 22.61–27.53 g/mol; Ktr: 64.8–236.8, 221.3–242.7, and 136.3–354.2; and Kwet: 25.8–37.3, 44.1–49.8, and 50.8–69.7% (Figures 4A–C). The isotope parameter range for δ13С-СН4, С2Н6, and СО2 is −45.7 to −39.9, −21.8 to −19.8, and −21.8 to −19.9‰; −42.8 to −37.2, −21.7 to −18.2, and −21.0 to −18.4‰; and −40.5 to −36.0, −20.0 to −16.8, and −20.8 to −18.0‰, respectively (Figures 3D–F). Previously, we have found similar parameters for oil gas deposits in the southeastern part of the ESS (Table 3) and continental deposits of Far East of Russia (Gresov, 2011). These groups of HCGs are located in the bottom sediments of North Chukchi, Cis-East-Siberian, Novosibirsk sedimentary basin, Longa uplift, Northern Terrace, and Lomonosov–Mendeleev flexure-fault zone.
Thus, the use of a complex of isotope and gas-geochemical indicators is a rather informative method for identifying various regional and stratigraphic gas sources of hydrocarbons in bottom sediments. It was found that all the isotope and gas-geochemical parameters of HCGs are closely associated with each other by wide correlation (r2 = 0.37–0.97) (Table 5).
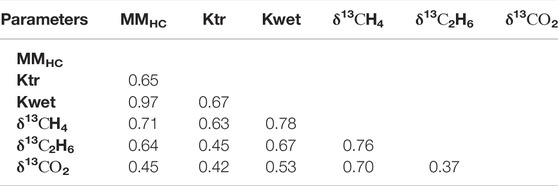
TABLE 5. Correlation (r2) between gas genetic indicators of the study area.
In the context of global climate change processes, great attention is paid to the current state of the Arctic region. At the same time, a number of studies have provided differing estimates as to the potentially catastrophic climatological impact resulting from the destruction of marine permafrost and massive greenhouse gas emissions (Shakhova et al., 2010; Shakhova et al., 2017). Most of these estimates are given for the water area of the inner ESS shelf. At the same time, a number of other studies indicate a rather limited or local distribution of these processes in the outer ESS shelf and adjacent part of the Arctic Ocean (Thornton et al., 2016; Miller et al., 2017; Sparrow et al., 2018; Thornton et al., 2020). In addition, it is important to emphasize that the study of the processes of migration of methane in the aquatic environment and at the water–atmosphere boundary should always be accompanied by a direct study of its bottom sources. In this regard, the ability to separate surface and deep sources of methane formation is especially important. It should be noted that the existing estimates of geological methane emissions are far from complete (Sherwood et al., 2017; Etiope et al., 2019), and the available global estimates have a large uncertainty in the values of natural methane emissions (Saunois et al., 2020).
Gas geochemistry is widely used to obtain information about the origin and sources of gas in geological systems. In this work, we used a complex technique for the determination and interpretation of isotope and gas-geochemical parameters to identify and determine the genesis of bottom sediment sorbed gases. The representativeness of our methodology has been confirmed by approbation of the results at continental and subaqueous areas with proven oil and gas-bearing sedimentary basins of the Northeast of Russia (Gresov, 2011; Gresov et al., 2012; Gresov et al., 2016; Gresov et al., 2017; Gresov A. I. and Yatsuk A. V., 2020), Balkan region, and Northern Bulgaria (Velev, 1974; Velev, 1981).
Undoubtedly, we understand that the sample and analysis of HCGs of surface sediments and samples from the source itself (natural gas seepage, commercial gas drilling, and oil- and gas-bearing rock) are slightly different factors. The thermogenic gases can have a long migration history to the surface and have possibly undergone various changes over time. There are works that show that it is possible to predict gas sources directly on a sufficiently large statistical scale (Schoell, 1983; Faber et al., 2015; Abrams, 2017; Weniger et al., 2019; Milkov, 2021). To check an important question: how does our proposed methodology correlate with existing classifications and approaches to assessing the genesis of gases, we used three famous diagrams: plot of values of δ13C-CH4 versus δ13C-CO2 after Giggenbach 1997 (Figure 5A), Bernard diagram (Bernard et al., 1976) (Figure 6A), and plot of values of δ13C-C2H6 versus δ13C-CH4 after Milkov et al., 2005 (Figure 7A). Thus, based on a comparison with the main classification diagrams, we see that the distribution of thermogenic-sorbed gases prevails in the studied area. The influence of the processes of microbial formation, secondary microbial formation, and biodegradation (Etiope et al., 2009; Milkov, 2011) in the studied area of the ESS was not recorded.
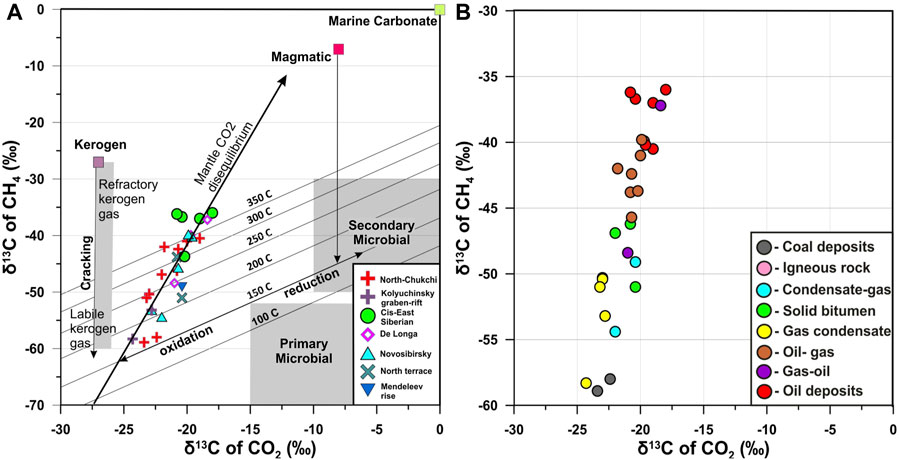
FIGURE 5. Plot of values of δ13C-CH4 vs. δ13C-CO2 after Giggenbach (1997) (A). Thin solid lines represent compositions expected for attainment of isotopic equilibrium as a function of temperature. Solid dashed lines correspond to compositions expected for formation of CH4 and CO2 from a common C source, such as a kerogen with δ13C of total C of −27‰, or magmatic C with δ13C of −7‰, as a function of the percentage of CO2 in the gas mixture formed. Plot of values of δ13C-CH4 vs. δ13C-CO2 with author’s gas genetic groups (B): 1) coal and gas deposits, 2) igneous rock, 3) condensate-gas, 4) solid bitumen, 5) gas condensate, 6) oil gas, 7) gas oil, and 8) oil deposits.
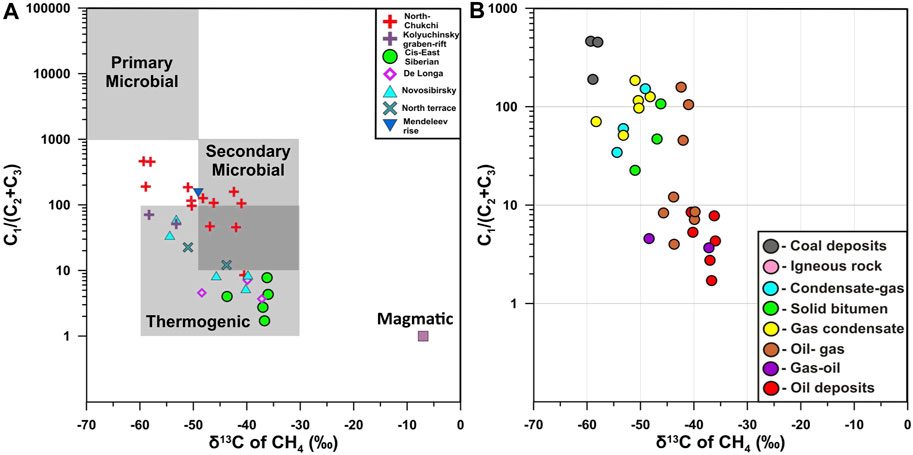
FIGURE 6. Bernard diagram (after Bernard et al., 1976). (A) Bernard diagram versus author’s gas genetic groups (B). Genetic groups are the same such as in Figure 5.
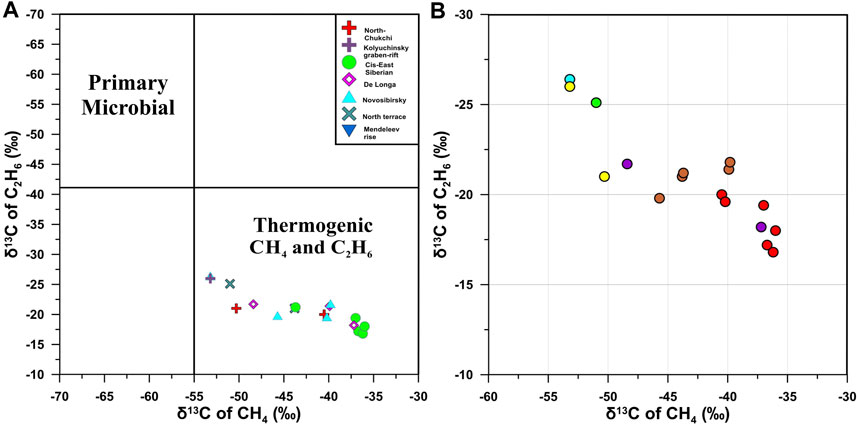
FIGURE 7. Plot of values of δ13C-C2H6 versus δ13C-CH4 after Milkov et al., 2005. Plot of values of δ13C-C2H6 versus δ13C-CH4 with author’s gas genetic groups (B). Genetic groups are the same such as in Figure 5.
The plot of δ13C-CH4 versus δ13C-CO2 shows us values for both components in the thermogenic field (Figure 5A). Isotherms from 100 to 350 °C show a starting gas characteristic of thermogenic gas from early-stage cracking of the more labile components of kerogen (Giggenbach, 1997), which becomes progressively more enriched in 13C in both CH4 and CO2. The highest equilibrium reservoir temperatures derived from Hulston (2004) on the high end of what would be expected for methane-rich hydrocarbons. The progressively heavier 13C values do not appear to represent the mixing between a secondary microbial gas source, similar to values indicated in previous studies (Head et al., 2003; Milkov, 2011), with a labile kerogen thermogenic gas as indicated by Giggenbach (1997). Instead, the gases trend toward a high-temperature magmatic end-member as has been observed in deep high-temperature geothermal systems (Giggenbach, 1997). Such values for magmatic gases seem to be influenced by subduction recycling of carbonates into the mantle. In any case, the Cis-East Siberian sedimentary basin has a sedimentary cover depth up to 10 km and De Long uplift up to 4 (Figure 1, Figure 2B). In our opinion, the most enriched 13C samples shown in Figure 5A reflect the admixture deeply sourced of magmatic gas with a more labile kerogen source, predominantly in the western part of the study area. The source of the magmatic fluid may be Cretaceous basalts and intrusions, which are widespread at the base of the basement of the De Long uplift (Nikishin et al., 2021). Migration of fluids to the upper part of the sedimentary cover is possible along a network of tectonic faults that are deep (>5–6 km) and represent an extended Lomonosov–Mendeleev flexure-fault zone (Figure 1, Figure 2B). The localization of such fluids in the course of vertical and lateral diffusion is possible in the zone of anticlinal uplifts and wedging out traps in the presence of seals. Promising areas of oil and gas deposits in the area of the De Long uplift were discovered according to MAGE data. There are 20 local anticlinal dome-shaped structures mapped, in the arch of which anomalies of the "bright spot" type were found (Kazanin et al., 2017a). The largest anomaly was found in the area of the Demidov saddle (length 39.5 km). Station 25 is located in the region of the dome-shaped uplift of the Demidov saddle and has typical parameter HCGs of oil fields: MMHC: 27,5, Ktr: 265, Kwet: 70% and “heavy” isotopic composition of sorbed gases (Table 2). The average value of the geothermal coefficient in the outer ESS shelf is 57 °C/km (O’Regan et al., 2016). According to the roughest estimates, then the source of the origin of the gas maybe lies at a depth of approximately 6 km. This fully coincides with the geological features of the region, and the existing structure of tectonic faults is a channel for migration to the surface.
In the eastern part of the study area, the influence of magmatism is not so noticeable; perhaps the very large depth of the sedimentary layer (more than 16 km in the depocenter) has an effect (Figure 2A). However, there is also a tendency toward an increase in the gas–genetic parameters of oil and gas potential toward the Lomonosov–Mendeleev flexure-fault zone (Figure 3, Figure 4). In the eastern part of the study area, the predominant sources of HCGs are gas-condensate sources and coal-bearing formations.
As with the previous figure, a plot of δ13C-CH4 vs. C1/C2+ (Figure 6) shows that the same most thermogenic gases in the trend toward a magmatic gas end-member as indicated by Giggenbach (1997). The presence of higher C1/C2+ values, particularly the North Chukchi area gases, indicates some involvement of both primary microbial and secondary microbial gases. Likewise, a plot of δ13C-CH4 vs. δ13C-C2H6 (Figure 7) shows mixing of a thermogenic end-member where both C2H6 and CH4 are relatively more enriched in 13C, with an end-member containing both microbial CH4 and thermogenic C2H6.
All of the isotopic diagrams indicate similar patterns in regard to the separation of potential sources in the series coal, condensate-gas, bitumen, gas condensate, and oil and gas (Figure 5B, Figure 6B, and Figure 7B). In addition to this, we create diagrams of the dependence of the three main gas genetic indicators (MMHC, Ktr, and Kwet) among themselves (Figure 8) and between carbon isotopes of δ13С-СН4 (Figure 9). In this case, the source categorization schema turns out to be quite good as all parameters have a good cross-correlation. In our opinion, the additional use of these three coefficients derived from weighted concentrations of hydrocarbon gases significantly expands the possibilities of interpreting gas data for hydrocarbon prospecting.
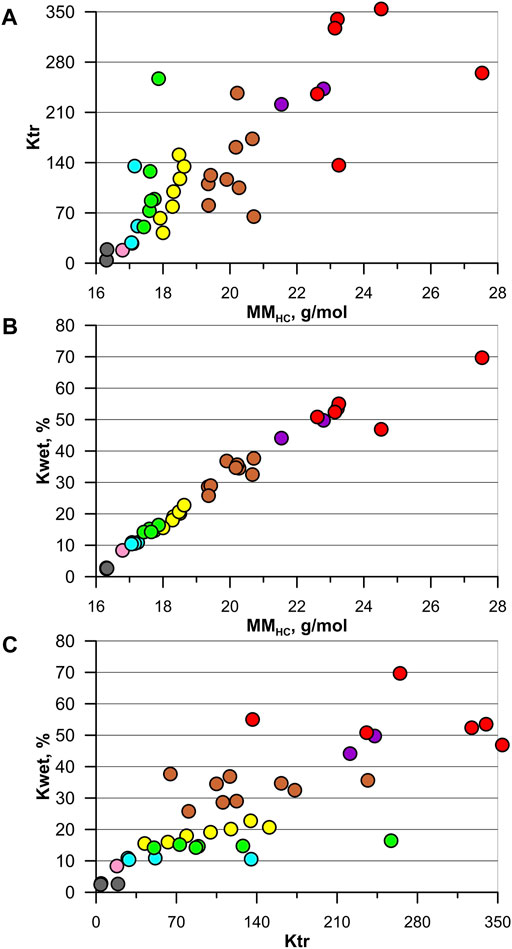
FIGURE 8. Paragenetic variability of gas-geochemical parameters MMHC-Ktr (A), MMHC-Kwet (B), and Kwet-Ktr (C). Genetic groups are the same such as in Figure 5.
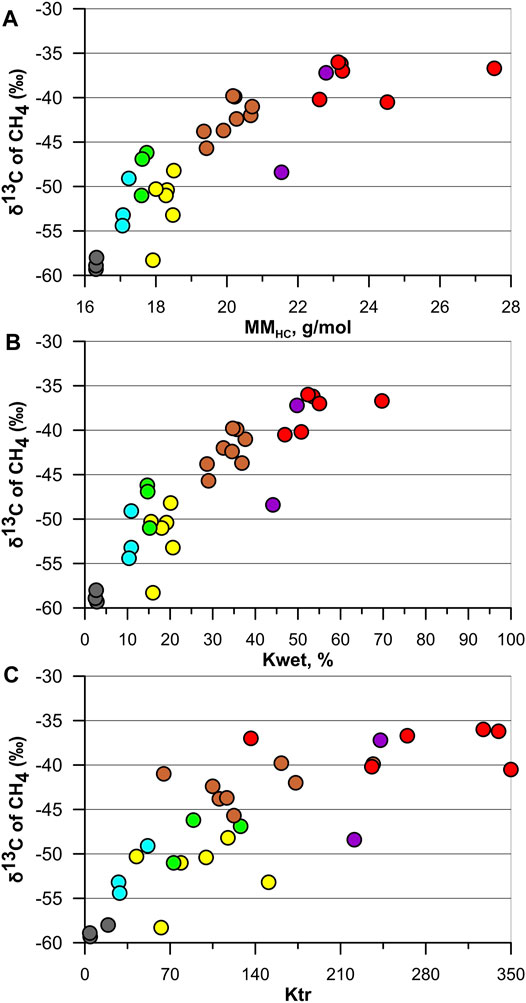
FIGURE 9. Paragenetic variability of gas-geochemical and carbon isotopic data δ13C-CH4 with MMHC (A), Kwet (B), and Ktr (C). Genetic groups are the same such as in Figure 5.
Next, a major feature of the distribution of thermogenic hydrocarbon gases is the mutual distribution of weight concentrations of hydrocarbons fractions. So, for HCGs of coal gas deposits is the steeply descending distribution of the weight concentrations of particular hydrocarbons toward high molecular mass members. Concentrations naturally decreases and the rule Сn > Cn + 1 is completed with an increase in the sequence number of homologs. This feature is interpreted as a sign of a genetic relationship between members of the hydrocarbon fraction. Based on the validity of this assumption, one can consider HCGs of the first group as a set of interrelated and arranged elements of some integral gas-geochemical formation of the upper part of the Cenozoic–Cretaceous sedimentary cover. HCGs of the other genetic groups are characterized by an irregular distribution of weight concentrations of hydrocarbons in the form of Сn = Cn + 1, Сn > Cn + 1, and Сn < Cn + 1 (Table 3, Table 4). This specific feature is typical for HCGs of gas oil and oil deposits of coal oil- and gas-bearing sedimentary basins in the Northeast of Russia (Gresov, 2011; Gresov et al., 2012).
Thus, the proposed methodology for determining HCG sources can be used quite organically with known classification schemes, mutually complementing and checking each other. We suggest several important points for conducting future studies which will improve on the qualitative analysis of hydrocarbon genesis:
- Carrying out a complete analysis of the content of HCGs C1–C5, especially at the level of trace concentrations.
- Information about regional geology, geophysical knowledge, and objects analogous to the industrial development of hydrocarbons is very important.
- The use of a large number of gas genetic parameters and classifications and sufficient statistics.
The solution of these issues in the future will significantly enhance the predictive assessment of oil and gas prospects and our fundamental knowledge about the processes of migration and accumulation of natural gases in the sedimentary cover of the Earth
As a result of the studies, the distribution of hydrocarbon gases was established, which are of great practical importance in the search and forecast of hydrocarbon deposits of the ESS marginal-shelf zone, the continental slope, and geological structures of the Arctic Ocean.
In the process of research in the bottom sediments, eight main genetic groups of epigenetic HCGs were identified, originating from supposed underlying gas sources in the process of natural diffusion and migration. Relatively low TC values determine the formation of insignificant volumes of syngenetic gases of modern sediments, which are difficult to identify due to their mixing with the migration gases of underlying geological formations. In general, the formation of the bottom sediment gas composition of the marginal-shelf zone of the ESS and AO is subject to the rules of additivity, that is, sequential spatiotemporal accumulation of migration gases in sediments with the dominance of the gas phase and gas-geochemical parameters of a more gas-saturated source.
Based on the data of gas geochemical studies, the areas of the southeastern part of the Cis-East Siberian sedimentary basin (Vilkitsky depression), Lomonosov–Mendeleev structural tectonic zone, and northwestern part of the Novosibirsk basin are among the most highly promising oil-bearing forecast areas in the western sector of the study area. Similar territories in the eastern part of the study area include the southern flank and the central part of the North Chukchi basin.
The study of these inaccessible areas of the Arctic Ocean is important not only from the standpoint of resource hydrocarbon potential but also important from the point of view of climate change and the study of natural sources of greenhouse gases into the environment.
The raw data supporting the conclusion of this article will be made available by the authors, without undue reservation.
AG provided funding to conduct the research. AY, AG, and GS have contributed to the design of the study. AG analyzed the geological structure of the region. AG and AY participated in sea cruises and collected sediment samples. AY performed geochemical processing and gas analysis. GS performed isotope data processing and visualization of the genetic characteristics of HCGs. AY, AG, and GS contributed to the interpretation of the results. AY majorly contributed to writing the manuscript. All authors helped shape the research, analysis, and manuscript.
Gas-geochemical studies were carried out with the financial support of the State Assignment No. 0211-2021-0006 (121021500055-0). Marine expeditionary operations (cruises LV77 and LV90) were carried out with the financial support of the Ministry of Education and Science of the Russian Federation, the National Natural Science Foundation of the Republic of China NSFC-Shandong (Grant Nos. U1606401 and 41420104005), and grant from the Marine S&T Fund of Shandong Province (No. 2018SDKJ0104-3).
The authors declare that the research was conducted in the absence of any commercial or financial relationships that could be construed as a potential conflict of interest.
All claims expressed in this article are solely those of the authors and do not necessarily represent those of their affiliated organizations, or those of the publisher, the editors, and the reviewers. Any product that may be evaluated in this article, or claim that may be made by its manufacturer, is not guaranteed or endorsed by the publisher.
We are grateful to the management of “Sevmorgeo” and POI FEB RAS. We greatly appreciate the head of cruises Renat Shakirov (LV45), Anatoly Astakhov (LV77), and Yuri Vasilenko (LV90) for their support in marine gas-geochemical studies. We are grateful to Viktor Kalinchuk (POI FEB RAS) for help with sediment sampling and Elena Maltseva and Dmitry Shvalov for gas analytic support. We are also very grateful to the editor and three reviewers for their constructive comments and help in improving this work.
Abrams, M. A. (2005). Significance of Hydrocarbon Seepage Relative to Petroleum Generation and Entrapment. Mar. Petroleum Geol. 22, 457–477. doi:10.1016/j.marpetgeo.2004.08.003
Abrams, M. (2017). Evaluation of Near-Surface Gases in Marine Sediments to Assess Subsurface Petroleum Gas Generation and Entrapment. Geosciences 7 (2), 35. doi:10.3390/geosciences7020035
Baranov, B., Galkin, S., Vedenin, A., Dozorova, K., Gebruk, A., and Flint, M. (2020). Methane Seeps on the Outer Shelf of the Laptev Sea: Characteristic Features, Structural Control, and Benthic Fauna. Geo-Mar Lett. 40, 541–557. doi:10.1007/s00367-020-00655-7
Bernard, B. B., Brooks, J. M., and Sackett, W. M. (1976). Natural Gas Seepage in the Gulf of Mexico. Earth Planet. Sci. Lett. 31 (1), 48–54. doi:10.1016/0012-821X(76)90095-9
Berner, U., and Faber, E. (1996). Empirical Carbon Isotope/maturity Relationships for Gases from Algal Kerogens and Terrigenous Organic Matter, Based on Dry, Open-System Pyrolysis. Org. Geochem. 24 (10-11), 947–955. doi:10.1016/s0146-6380(96)00090-3
Bird, K. J., and Houseknecht, D. W. (2011). Chapter 32 Geology and Petroleum Potential of the Arctic Alaska Petroleum Province. Geol. Soc. Lond. Memoirs 35 (1), 485–499. doi:10.1144/m35.32
Blumenberg, M., Lutz, R., Schlömer, S., Krüger, M., Scheeder, G., Berglar, K., et al. (2016). Hydrocarbons from Near-Surface Sediments of the Barents Sea North of Svalbard - Indication of Subsurface Hydrocarbon Generation? Mar. Petroleum Geol. 76, 432–443. doi:10.1016/j.marpetgeo.2016.05.031
Borukaev, G. C. (2017). Organic Geochemistry of Paleosoic-Triassic Sediments of Wrangel Island. Oil Gas Geol. 4, 79–89. https://cyberleninka.ru/article/n/organicheskaya-geohimiya-paleozoy-triasovyh-otlozheniy-ostrova-vrangelya/pdf (in Russian).
Claypool, G. E., and Kaplan, I. R. (1974). “The Origin and Distribution of Methane in Marine Sediments,” in Natural Gases in Marine Sediments. Editor I. R. Kaplan (Boston: Springer), 3, 99–139. Marine science. doi:10.1007/978-1-4684-2757-8_8
Claypool, G. E., and Kvenvolden, K. A. (1983). Methane and Other Hydrocarbon Gases in Marine Sediment. Annu. Rev. Earth Planet. Sci. 11, 299–327. doi:10.1146/annurev.ea.11.050183.001503
Cramer, B., and Franke, D. (2005). Indications for an Active Petroleum System in the Laptev Sea, NE Siberia. J. Pet. Geol. 28, 369–384. doi:10.1111/J.1747-5457.2005.TB00088.X
Etiope, G., Ciotoli, G., Schwietzke, S., and Schoell, M. (2019). Gridded Maps of Geological Methane Emissions and Their Isotopic Signature. Earth Syst. Sci. Data 11, 1–22. doi:10.5194/essd-11-1-2019
Etiope, G., Feyzullayev, A., Milkov, A. V., Waseda, A., Mizobe, K., and Sun, C. H. (2009). Evidence of Subsurface Anaerobic Biodegradation of Hydrocarbons and Potential Secondary Methanogenesis in Terrestrial Mud Volcanoes. Mar. Petroleum Geol. 26 (9), 1692–1703. doi:10.1016/j.marpetgeo.2008.12.002
Etiope, G., and Sherwood Lollar, B. (2013). Abiotic Methane on Earth. Rev. Geophys. 51, 276–299. doi:10.1002/rog.20011
Faber, E., Schmidt, M., and Feyzullayev, A. A. (2015). Geochemical Hydrocarbon Exploration - Insight from Stable Isotope Models. Oil Gas. J. 41, 93–98. https://www.researchgate.net/publication/282273227_Geochemical_Hydrocarbon_Exploration_-_Insights_from_Stable_Isotope_Models.
Franke, D., and Hinz, K. (2012). “Geology of the Shelves Surrounding the New Siberian Islands from Seismic Images,” in Regional Geology and Tectonics: Phanerozoic Rift Systems and Sedimentary Basins (Oxford, UK: Elsevier), 37, 279–297. doi:10.1016/b978-0-444-56356-9.00011-0
Galimov, E. M. (2006). Isotope Organic Geochemistry. Org. Geochem. 37 (10), 1200–1262. doi:10.1016/j.orggeochem.2006.04.009
Geological Map of Russian Federation and Adjacent Waters (2016). Geological Map of Russia and Adjacent Water Areas 1:2 500 000. St. Petersburg: A. P. Karpinsky Russian Geological Research Institute. http://www.vsegei.com/ru/info/atlas/geol/(in Russian).
Geological Map (2015). Ser. Laptevo-Sibiromorskaya, Okeanskaya. Sheet No. T-57-60 – Henrietta Island. 1:1 000 000. Explanatory Note. St. Petersburg, A. P.: Karpinsky Russian Geological Research Institute. https://webftp.vsegei.ru/GGK1000/T-57-60/T-57-60_ObZap.pdf (in Russian).
Giggenbach, W. F. (1997). Relative Importance of Thermodynamic and Kinetic Processes in Governing the Chemical and Isotopic Composition of Carbon Gases in High-Heatflow Sedimentary Basins. Geochimica Cosmochimica Acta 61 (17), 3763–3785. doi:10.1016/s0016-7037(97)00171-3
Graves, C. A., James, R. H., Sapart, C. J., Stott, A. W., Wright, I. C., Berndt, C., et al. (2017). Methane in Shallow Subsurface Sediments at the Landward Limit of the Gas Hydrate Stability Zone Offshore Western Svalbard. Geochimica Cosmochimica Acta 198, 419–438. doi:10.1016/j.gca.2016.11.015
Gresov, A. I. (2011). Geochemical Classification of Hydrocarbon Gases of the Coal Basins of East Russia. Russ. J. Pac. Geol. 5 (2), 164–179. doi:10.1134/s1819714011020047
Gresov, A. I., Obzhirov, A. I., Yatsuk, A. V., Mazurov, A. K., and Ruban, A. S. (2017). Gas Content of Bottom Sediments and Geochemical Indicators of Oil and Gas on the Shelf of the East Siberian Sea. Russ. J. Pac. Geol. 11, 308–314. doi:10.1134/S1819714017040030
Gresov, A. I., Shakhova, N. E., Sergiyenko, V. I., Yatsuk, A. V., and Semiletov, I. P. (2016). Isotope and Geochemical Parameters of Hydrocarbon Gases in Bottom Sediments of the Shelf of the East Siberian Sea. Dokl. Earth Sc. 469 (2), 864–866. doi:10.1134/S1028334X16080225
Gresov, A. I., and Yatsuk, A. V. (2020a). Gas Geochemical Indicators of Oil and Gas Occurrence in South-Eastern Part of East Siberian Sea. Geol. Oil Gas 4, 83–96. doi:10.31087/0016-7894-2020-4-83-96
Gresov, A. I., and Yatsuk, A. V. (2020b). Geochemistry and Genesis of Hydrocarbon Gases of the Chaun Depression and Ayon Sedimentary Basin of the East Siberian Sea. Russ. J. Pac. Geol. 14, 87–96. doi:10.1134/S1819714020010042
Gresov, A. I., and Yatsuk, A. V. (2021). Geological Implications for Gas Saturation of Bottom Sediments in Sedimentary Basins in the Southeastern Sector of the East Siberian Sea. Russ. Geol. Geophys. 62 (2), 157–172. doi:10.2113/RGG20194075
Gresov, A. I., Yatsuk, A. V., Obzhirov, A. I., Razvozzhaeva, E. P., and Kirillova, G. L. (2012). Gas-geochemical Evaluation of the the Petroleum Potential of the Birofeld Graben of the Middle Amur Sedimentary Basin (Russian Far East). Russ. J. Pac. Geol. 6 (2), 143–157. doi:10.1134/s1819714012020030
Head, I. M., Jones, D. M., and Larter, S. R. (2003). Biological Activity in the Deep Subsurface and the Origin of Heavy Oil. Nature 426, 344–352. doi:10.1038/nature02134
Horita, J. (2001). Carbon Isotope Exchange in the System CO2-CH4 at Elevated Temperatures. Geochimica Cosmochimica Acta 65, 1907–1919. –1919. doi:10.1016/S0016-7037(01)00570-1
Horvitz, L. (1985). Geochemical Exploration for Petroleum. Science 229, 821–827. doi:10.1126/science.229.4716.821
Houseknecht, D. W., Bird, K. J., and Garrity, C. (2019). Geology and Assessment of Undiscovered Oil and Gas Resources of the Arctic Alaska Province, 2008, T. E. E of Moore, and D. L. Gautier, eds., The 2008 Circum-Arctic Resource Appraisal: Reston, VA: U.S. Geological Survey, 25. doi:10.3133/pp1824EProfessional Paper 1824 [Supersedes USGS Scientific Investigations Report 2012–5147]
Hulston, J. R. (2004). Factors Controlling the Carbon Isotopic Composition of Methane and Carbon Dioxide in New Zealand Geothermal and Natural Gases. Geochem. Soc. Spec. Publ. 9, 67–83. A Tribute to Isaac R. Kaplan. doi:10.1016/S1873-9881(04)80008-7
Hunt, J. M., Philp, R. P., and Kvenvolden, K. A. (2002). Early Developments in Petroleum Geochemistry. Org. Geochem. 33 (9), 1025–1052. doi:10.1016/s0146-6380(02)00056-6
IGD’Skochinsky (1977). Instructions for Determining and Predicting the Gas Content of Coal Seams and Enclosing Rocks during Exploration. Moscow: Nedra. https://pdf.standartgost.ru/catalog/Data2/1/4293730/4293730660.pdf.
Jakobsson, M., Mayer, L., Coakley, B., Dowdeswell, J. A., Forbes, S., Fridman, B., et al. (2012). The International Bathymetric Chart of the Arctic Ocean (IBCAO) Version 3.0. Geophys. Res. Lett. 39, L12609. doi:10.1029/2012gl052219
Kazanin, G. S., Barabanova, Y. B., Kirillova-Pokrovskaya, T. A., Chernikov, S. F., Pavlov, S. P., and Ivanov, G. I. (2017a). Continental Margin of the East Siberia Sea: Geological Structure and Hydrocarbon Potential. Razved. Okhrana Nedr 10, 51–55. http://rion-journal.com/2017/11/02/10-2017/(in Russian).
Kazanin, G. S., Poselov, V. A., Zayats, I. V., Ivanov, G. I., Makarov, E. S., Vasil’ev, A. S., et al. (2017b). Complex Geophysical Studies of the Central Deep-Water Part of the Arctic Ocean. Razved. Okhrana Nedr 10, Р25–30. http://rion-journal.com/2017/11/02/10-2017/(in Russian).
Kazanin, G. S., Verba, M. L., Ivanov, G. I., Kirillova-Pokrovskaya, T. A., and Smirnov, O. E. (2017c). Tectonic Map of the East Siberian Sea: the Role of the Paleozoic Complex of the Sedimentary Cover (According to Seismic Data from MAGE). Razved. Okhrana Nedr 10, 61–67. http://rion-journal.com/2017/11/02/10-2017/(in Russian).
Khain, V. E., Polyakova, I. D., and Filatova, N. I. (2009). Tectonics and Petroleum Potential of the East Arctic Province. Russ. Geol. Geophys. 50 (4), 334–345. doi:10.1016/j.rgg.2009.03.006
Kim, B. I., Evdokimova, N. K., and Kharitonova, L. I. (2016). Structure, Oil and Gas Potential, Oil-Geological Zonation of Russian West-Arctic Shelf. Oil Gas Geol. 1, 2–15. https://www.oilandgasgeology.ru/_files/ugd/19d8ab_8f8b1279dee840f8a4659c1aba4b5d9f.pdf (in Russian).
Kim, B. I., Evdokimova, N. K., Suprunenko, O. I., and Yashin, D. S. (2007). Oil Geological Zoning of Offshore Areas of the East-Arctic Seas of Russia and Their Oil and Gas Potential Prospects. Oil Gas Geol. 2, 49–59. https://drive.google.com/open?id=0B_bCwpRhYduYdlpRMldIRERtWlE (in Russian).
Kim, J.-H., Hachikubo, A., Kida, M., Minami, H., Lee, D.-H., Jin, Y. K., et al. (2020). Upwarding Gas Source and Postgenetic Processes in the Shallow Sediments from the ARAON Mounds, Chukchi Sea. J. Nat. Gas Sci. Eng. 76, 103223. doi:10.1016/j.jngse.2020.103223
Klubov, B. A. (1983). Natural Bitumens of the North. Prirodnyye Bitumy Severa. Moscow Nedra. https://www.osti.gov/etdeweb/biblio/5289125 (in Russian).
Knies, J., Damm, E., Gutt, J., Mann, U., and Pinturier, L. (2004). Near-surface Hydrocarbon Anomalies in Shelf Sediments off Spitsbergen: Evidences for Past Seepages. Geochem. Geophys. Geosyst. 5 (6). doi:10.1029/2003gc000687
Kus, J., Tolmacheva, T., Dolezych, M., Gaedicke, C., Franke, D., Brandes, C., et al. (2015). Organic Matter Type, Origin and Thermal Maturity of Paleozoic, Mesozoic and Cenozoic Successions of the New Siberian Islands, Eastern Russian Arctic. Int. J. Coal Geol. 152, 125–146. doi:10.1016/j.coal.2015.11.003
Lorenson, T. D., Collett, T. S., and Hunter, R. B. (2011). Gas Geochemistry of the Mount Elbert Gas Hydrate Stratigraphic Test Well, Alaska North Slope: Implications for Gas Hydrate Exploration in the Arctic. Mar. Petroleum Geol. 28, 343–360. doi:10.1016/j.marpetgeo.2010.02.007
Lorenson, T. D., Grienert, J., and Coffin, R. B. (2016). Dissolved Methane in the Beaufort Sea and the Arctic Ocean, 1992-2009; Sources and Atmospheric Flux. Limnol. Oceanogr. 61, S300–S323. doi:10.1002/lno.10457
Martens, J., Romankevich, E., Semiletov, I., Wild, B., van Dongen, B., Vonk, J., et al. (2021). CASCADE - the Circum-Arctic Sediment CArbon DatabasE. Earth Syst. Sci. Data 13, 2561–2572. doi:10.5194/essd-13-2561-2021
Martin Schoell, M. (1983). Genetic Characterization of Natural Gases. Bulletin 67, 2225–2238. doi:10.1306/ad46094a-16f7-11d7-8645000102c1865d
Matveeva, T., Savvichev, A., Semenova, A., Logvina, E., Kolesnik, A., and Bosin, A. (2015). Source, Origin, and Spatial Distribution of Shallow Sediment Methane in the Chukchi Sea. Oceanography 28, 202–217. doi:10.5670/oceanog.2015.66
Mau, S., Römer, M., Torres, M. E., Bussmann, I., Pape, T., Damm, E., et al. (2017). Widespread Methane Seepage along the Continental Margin off Svalbard - from Bjørnøya to Kongsfjorden. Sci. Rep. 7, 42997. doi:10.1038/srep42997
Milkov, A. V., Claypool, G. E., Lee, Y.-J., and Sassen, R. (2005). Gas Hydrate Systems at Hydrate Ridge Offshore Oregon Inferred from Molecular and Isotopic Properties of Hydrate-Bound and Void Gases. Geochimica Cosmochimica Acta 69, 1007–1026. doi:10.1016/j.gca.2004.08.021
Milkov, A. V., and Etiope, G. (2018). Revised Genetic Diagrams for Natural Gases Based on a Global Dataset of >20,000 Samples. Org. Geochem. 125, 109–120. doi:10.1016/j.orggeochem.2018.09.002
Milkov, A. V. (2021). New Approaches to Distinguish Shale-Sourced and Coal-Sourced Gases in Petroleum Systems. Org. Geochem. 158, 104271. doi:10.1016/j.orggeochem.2021.104271
Milkov, A. V. (2011). Worldwide Distribution and Significance of Secondary Microbial Methane Formed during Petroleum Biodegradation in Conventional Reservoirs. Org. Geochem. 42 (2), 184–207. doi:10.1016/j.orggeochem.2010.12.003
Miller, C. M., Dickens, G. R., Jakobsson, M., Johansson, C., Koshurnikov, A., O'Regan, M., et al. (2017). Pore Water Geochemistry along Continental Slopes North of the East Siberian Sea: Inference of Low Methane Concentrations. Biogeosciences 14 (12), 2929–2953. doi:10.5194/bg-14-2929-2017
Nikishin, A. M., Petrov, E. I., Cloetingh, S., Malyshev, N. A., Morozov, A. F., Posamentier, H. W., et al. (2021). Arctic Ocean Mega Project: Paper 2 - Arctic Stratigraphy and Regional Tectonic Structure. Earth-Science Rev. 217, 103581. doi:10.1016/j.earscirev.2021.103581
O'Regan, M., Backman, J., Barrientos, N., Cronin, T. M., Gemery, L., Kirchner, N., et al. (2017). The De Long Trough: a Newly Discovered Glacial Trough on the East Siberian Continental Margin. Clim. Past. 13, 1269–1284. doi:10.5194/cp-13-1269-2017
O'Regan, M., Preto, P., Stranne, C., Jakobsson, M., and Koshurnikov, A. (2016). Surface Heat Flow Measurements from the East Siberian Continental Slope and Southern Lomonosov Ridge, Arctic Ocean. Geochem. Geophys. Geosyst. 17, 1608–1622. doi:10.1002/2016GC006284
Pape, T., Bünz, S., Hong, W. L., Torres, M. E., Riedel, M., Panieri, G., et al. (2020). Origin and Transformation of Light Hydrocarbons Ascending at an Active Pockmark on Vestnesa Ridge, Arctic Ocean. J. Geophys. Res. Solid Earth 125. doi:10.1029/2018JB016679
Pohlman, J. W., Greinert, J., Ruppel, C., Silyakova, A., Vielstädte, L., Casso, M., et al. (2017). Enhanced CO 2 Uptake at a Shallow Arctic Ocean Seep Field Overwhelms the Positive Warming Potential of Emitted Methane. Proc. Natl. Acad. Sci. U.S.A. 114, 5355–5360. doi:10.1073/pnas.1618926114
Portnov, A., Smith, A. J., Mienert, J., Cherkashov, G., Rekant, P., Semenov, P., et al. (2013). Offshore Permafrost Decay and Massive Seabed Methane Escape in Water Depths >20 M at the South Kara Sea Shelf. Geophys. Res. Lett. 40 (15), 3962–3967. doi:10.1002/grl.50735
Poselov, V. A., Butsenko, V. V., Zholondz, S. M., Zholondz, A. S., and Kireev, A. A. (2017). Seismic Stratigraphy of Sedimentary Cover in the Podvodnikov Basin and North Chukchi Trough. Dokl. Earth Sc. 474 (2), 688–691. doi:10.1134/S1028334X17060137
Sakulina, T. S., Verba, M. L., Kashubina, T. V., Krupnova, N. A., Tabyrtsa, S. N., and Ivanov, G. I. (2011). Complex Geological and Geophysical Researches on the 5-AR Profile in the East-Siberian Sea. Razved. Okhrana Nedr 10, 17–23. http://docplayer.com/38712759-Kompleksnye-geologo-geofizicheskie-issledovaniya-na-opor-nom-profile-5-ar-v-vostochno-sibirskom-more.html (in Russian).
Sapart, C. J., Shakhova, N., Semiletov, I., Jansen, J., Szidat, S., Kosmach, D., et al. (2017). The Origin of Methane in the East Siberian Arctic Shelf Unraveled with Triple Isotope Analysis. Biogeosciences 14, 2283–2292. doi:10.5194/bg-14-2283-2017
Saunois, M., Stavert, A. R., Poulter, B., Bousquet, P., Canadell, J. G., Jackson, R. B., et al. (2020). The Global Methane Budget 2000-2017. Earth Syst. Sci. Data 12, 1561–1623. doi:10.5194/essd-12-1561-2020
Schoell, M. (1988). Multiple Origins of Methane in the Earth. Chem. Geol. 71, 1–10. doi:10.1016/0009-2541(88)90101-5
Serov, P., Portnov, A., Mienert, J., Semenov, P., and Ilatovskaya, P. (2015). Methane Release from Pingo-like Features across the South Kara Sea Shelf, an Area of Thawing Offshore Permafrost. J. Geophys. Res. Earth Surf. 120, 1515–1529. doi:10.1002/2015JF003467
Sevastyanov, V. S., Fedulov, V. S., Fedulova, V. Y., Kuznetsova, O. V., Dushenko, N. V., Naimushin, S. G., et al. (2019). Isotopic and Geochemical Study of Organic Matter in Marine Sediments from the Indigirka Delta to the Ice Shelf Border of the East-Siberian Sea. Geochem. Int. 57 (5), 489–498. doi:10.1134/S0016702919050100
Shakhova, N., Semiletov, I., Gustafsson, O., Sergienko, V., Lobkovsky, L., Dudarev, O., et al. (2017). Current Rates and Mechanisms of Subsea Permafrost Degradation in the East Siberian Arctic Shelf. Nat. Commun. 8, 15872. doi:10.1038/ncomms15872
Shakhova, N., Semiletov, I., Salyuk, A., Yusupov, V., Kosmach, D., and Gustafsson, Ö. (2010). Extensive Methane Venting to the Atmosphere from Sediments of the East Siberian Arctic Shelf. Science 327 (5970), 1246–1250. doi:10.1126/science.1182221
Shakirov, R. B., Sorochinskaya, A. V., and Obzhirov, A. I. (2013). Gas Geochemical Anomalies in Sediments of the East Siberian Sea. KRAUNZ. Earth Sci. 21 (1), 231–243. http://www.kscnet.ru/journal/kraesc/article/viewFile/350/pdf (in Russian).
Sherwood, K. W. (1998). “Undiscovered Oil and Gas Resources,” in Alaska Federal Offshore. Editors K. W. Sherwood, J. D. Craig, and L. W. Cook (Department of the Interior Minerals Management Service), 531. As of January 1995Alaska OCS Monograph, MMS 980054. Anchorage, AK.
Sherwood, O. A., Schwietzke, S., Arling, V. A., and Etiope, G. (2017). Global Inventory of Gas Geochemistry Data from Fossil Fuel, Microbial and Burning Sources, Version 2017. Earth Syst. Sci. Data 9, 639–656. doi:10.5194/essd-9-639-2017
Sparrow, K. J., Kessler, J. D., Southon, J. R., Garcia-Tigreros, F., Schreiner, K. M., Ruppel, C. D., et al. (2018). Limited Contribution of Ancient Methane to Surface Waters of the U.S. Beaufort Sea Shelf. Sci. Adv. 4 (1), eaao4842. doi:10.1126/sciadv.aao4842
Steinbach, J., Holmstrand, H., Shcherbakova, K., Kosmach, D., Brüchert, V., Shakhova, N., et al. (2021). Source Apportionment of Methane Escaping the Subsea Permafrost System in the Outer Eurasian Arctic Shelf. Proc. Natl. Acad. Sci. U.S.A. 118 (10), e2019672118. doi:10.1073/pnas.2019672118
Stolper, D. A., Lawson, M., Davis, C. L., Ferreira, A. A., NetoSantos, E. V. S., Ellis, G. S., et al. (2014). Formation Temperatures of Thermogenic and Biogenic Methane. Science 344, 1500–1503. doi:10.1126/science.1254509
Thornton, B. F., Geibel, M. C., Crill, P. M., Humborg, C., and Mörth, C.-M. (2016). Methane Fluxes from the Sea to the Atmosphere across the Siberian Shelf Seas. Geophys. Res. Lett. 43 (11), 5869–5877. doi:10.1002/2016GL068977
Thornton, B. F., Prytherch, J., Andersson, K., Brooks, I. M., Salisbury, D., Tjernström, M., et al. (2020). Shipborne Eddy Covariance Observations of Methane Fluxes Constrain Arctic Sea Emissions. Sci. Adv. 6, eaay7934. doi:10.1126/sciadv.aay7934
Velev, V. K. (1981). Molecular Mass of Hydrocarbon Fraction and Weight Distribution of С1–С5 Components in Natural Gases of Different Genetic Types. Precambrian Org. Geochem. Oils, Gases Org. Matter, 22–28. Moscow: Nauka (in Russian).
Velev, V. K. (1974). Molecular Weight of the Hydrocarbon Fraction of Natural Gas Systems as a Classification Feature and as an Indicator in the Search for Oil and Gas. Rep. Bulg. Acad. Sci. 27 (3), 379–382. (in Russian).
Velivetskaya, T. A., Ignatev, A., and Kiyashko, S. (2015). “Universal Method for Preparation of Liquid, Solid and Gaseous Samples for Determining the Isotopic Composition of Carbon,” in Isotope Ratio Mass Spectrometry of Light Gas‐Forming Elements. Editor V. S. Sevastyanov (UK: CRC Press), 119–134.
Verba, M. L. (2016). Paleozoic Section of the Sedimentary Cover of the East Siberian Sea's Northern Outskirts and its Importance to Petroleum Potential Assessment. Neftegazov. Geol. Teor. I Prakt. 11 (4), 17. doi:10.17353/2070-5379/46_2016
VNIIGRIugol (1988). A Manual for Determining the Gas Content of the Host Rocks of Coal Deposits during Geological Exploration. Moscow: Nedra. https://pdf.standartgost.ru/catalog/Data2/1/4293741/4293741104.pdf (in Russian).
Wen, H.-Y., Sano, Y., Takahata, N., Tomonaga, Y., Ishida, A., Tanaka, K., et al. (2016). Helium and Methane Sources and Fluxes of Shallow Submarine Hydrothermal Plumes Near the Tokara Islands, Southern Japan. Sci. Rep. 6, 34126. doi:10.1038/srep34126
Weniger, P., Blumenberg, M., Berglar, K., Ehrhardt, A., Klitzke, P., Krüger, M., et al. (2019). Origin of Near-Surface Hydrocarbon Gases Bound in Northern Barents Sea Sediments. Mar. Petroleum Geol. 102, 455–476. doi:10.1016/j.marpetgeo.2018.12.036
Westbrook, G. K., Thatcher, K. E., Rohling, E. J., Piotrowski, A. M., Pälike, H., Osborne, A. H., et al. (2009). Escape of Methane Gas from the Seabed along the West Spitsbergen Continental Margin. Geophys. Res. Lett. 36, 1–5. doi:10.1029/2009gl039191
Whiticar, M. J. (1999). Carbon and Hydrogen Isotope Systematics of Bacterial Formation and Oxidation of Methane. Chem. Geol. 161, 291–314. doi:10.1016/s0009-2541(99)00092-3
Whiticar, M. J., Faber, E., and Schoell, M. (1986). Biogenic Methane Formation in Marine and Freshwater Environments: CO2 Reduction vs. Acetate Fermentation-Isotope Evidence. Geochimica Cosmochimica Acta 50, 693–709. doi:10.1016/0016-7037(86)90346-7
Keywords: methane, hydrocarbons, carbon isotopes, genesis, East Siberian Arctic shelf
Citation: Yatsuk A, Gresov A and Snyder GT (2022) Hydrocarbon Gases in Seafloor Sediments of the Edge Shelf Zone of the East Siberian Sea and Adjacent Part of the Arctic Ocean. Front. Earth Sci. 10:856496. doi: 10.3389/feart.2022.856496
Received: 17 January 2022; Accepted: 20 April 2022;
Published: 31 May 2022.
Edited by:
Regina Katsman, University of Haifa, IsraelReviewed by:
Andrey Maslov, Geological Institute (RAS), RussiaCopyright © 2022 Yatsuk, Gresov and Snyder. This is an open-access article distributed under the terms of the Creative Commons Attribution License (CC BY). The use, distribution or reproduction in other forums is permitted, provided the original author(s) and the copyright owner(s) are credited and that the original publication in this journal is cited, in accordance with accepted academic practice. No use, distribution or reproduction is permitted which does not comply with these terms.
*Correspondence: Andrey Yatsuk, eWF0c3VrQHBvaS5kdm8ucnU=
Disclaimer: All claims expressed in this article are solely those of the authors and do not necessarily represent those of their affiliated organizations, or those of the publisher, the editors and the reviewers. Any product that may be evaluated in this article or claim that may be made by its manufacturer is not guaranteed or endorsed by the publisher.
Research integrity at Frontiers
Learn more about the work of our research integrity team to safeguard the quality of each article we publish.