 Liming Fan
 Xin Wang
95% of researchers rate our articles as excellent or good
Learn more about the work of our research integrity team to safeguard the quality of each article we publish.
Find out more
ORIGINAL RESEARCH article
Front. Earth Sci. , 12 April 2022
Sec. Marine Geoscience
Volume 10 - 2022 | https://doi.org/10.3389/feart.2022.855644
This article is part of the Research Topic Sedimentation on the Continental Margins: From Modern Processes to Deep-Time Records View all 28 articles
Based on the CTD profiles and mooring measurements of the Line W program in the North Atlantic about 35°N/70°W, we investigated the spatial variability of internal wave-induced strain variance along the Line W section and the associated reasons. The results showed that the internal wave strain variance over the slope could be up to five times larger than that in the interior. We have validated that internal tides and near-inertial waves were not the crucial processes for causing this variability. Meanwhile, we found that the high-frequency internal waves generated by the interaction of anticyclonic eddy and low-frequency internal waves may be a potential cause of strain enhancement. This study implies a potential route of mesoscale eddies to enhance the strain variance induced by internal waves.
Strain is defined as the vertical derivative of isopycnal displacement, which is an important feature of the ocean flow field. Meanwhile, the oceanic strain is thought to be a key link in the process of energy dissipation in the internal wave field, and a contributor to microscale mixing in the sea. Most oceanic strain phenomena occur because of the existence of an internal wave field, so the space variability of the strain field is closely related to the internal waves. There are many processes which can result in internal wave strain, such as near-inertial internal waves (NIWs) generated by sea surface wind (Alford and Gregg, 2001) or geostrophic flow adjustment (Xu et al., 2013), lee waves generated by tidal currents and eddies over the topography of the seafloor, and internal tides (ITs) generated by barotropic tide over topography (Waterhouse et al., 2017).
Recently, it was reported that mesoscale eddies can lead to the generation of internal waves by interacting with other processes and enhance the internal waves by trapping them. Clément et al. (2016) implicated that the local internal wave field was modulated by mesoscale eddies impinging on the boundary, and anticyclonic eddy with a substantial near-bottom flow was associated with an elevated internal wave shear variance and turbulent dissipation, relative to cyclonic eddy. Joyce et al. (2013) observed the clockwise downward-propagating NIWs within a Gulf Stream warm-core ring, which showed enhanced NIW energy within the sloping pycnocline at depths of 300–700 m, and then they used a numerical model to simulate wind-forced NIWs within anticyclonic eddies, the results showed similar features to the observations. In the Drake Passage, St. Laurent et al. (2012) found a dominance of upward propagating energy, consistent with lee waves being generated by the mesoscale eddies impinging on rough topography. In the Southern Ocean, similar findings could be reached from some field observations (Brearley et al., 2013; Sheen et al., 2015). By field observation, in the Lofoten Basin, Fer et al. (2018) demonstrated that the sources of energy for the observed turbulence were the background shear and the sub-inertial energy trapped by the negative vorticity of the Lofoten Basin eddy, the spectral analysis showed an increased high-wavenumber clockwise-polarized shear variance in the core and rim regions, consistent with downward-propagating NIWs.
However, the resultant behavior of the interaction between mesoscale eddies and internal waves has been observed rarely. In this study, we investigate the spatial variability of strain along the Line W section in the North Atlantic and look for what causes the variation in strain. The data and methods are presented in Materials and Methods. Results section shows the spatial variability of the internal wave strain along the Line W section. Then we examine the contributions from different kinds of internal waves and propose a possible explanation in Discussion. The final Conclusion section is a brief summary.
The data used in this study were obtained from the Line W program (https://scienceweb.whoi.edu/linew/index.php), which was initiated since 1994 and designed to measure the Gulf Stream and deep western boundary current in the Atlantic. Cruises were run twice a year along a fixed section, which was roughly orthogonal to the isobaths of the continental slope (Figure 1). Here, we used the current measurements at mooring W4 and W5, with a temporal interval of 30 min from 30 April 2004 to 16 May 2008. At W4, the measurements were conducted at 1,052, 1,652, 2,252, 2,702, 3,252, and 3,600 m, respectively; at W5, the measurements were conducted at 999 and 4,084 m.
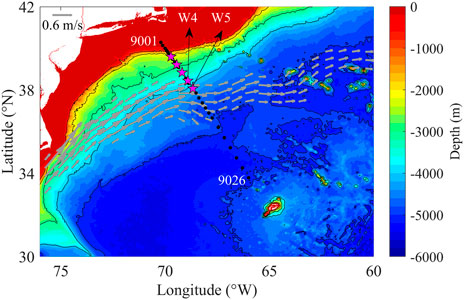
FIGURE 1. Map of the Line W region. Moorings and shipboard stations are indicated by magenta stars and black dots, respectively. The gray arrows from Hycom climatological data (50 m) are used to mark the Gulf Stream pathway.
The CTD measurements along the section were used. There are totally 26 CTD stations (from 9,001 to 9,026) along the section. The CTD samplings were throughout the whole water column, and the measurements were binned into 2 dbar in vertical. The CTD section was conducted separately in spring and autumn of each year; however, sometimes the section was only half occupied. In this study, we used four wholly occupied sections conducted in November 2003, September 2004, October 2007, and October 2010. In order to determine whether the mesoscale eddies pass through the section, lowered ADCP measurements were used.
In addition to these field measurements, a sea-level anomaly (SLA) from AVISO+ (https://www.aviso.altimetry.fr/en/home.html) was used to identify mesoscale eddies. Climatological current data from Hycom (https://www.hycom.org/) were used to mark the pathway of the Gulf Stream. The daily wind speed at 10 m height from ERA-Interim reanalysis data of ECMWF product (https://www.ecmwf.int/), high-resolution bathymetry data (https://topex.ucsd.edu/WWW_html/srtm15_plus.html), and the velocity amplitude of the barotropic tide from TPXO 9.0 (https://www.tpxo.net/home/) were also used to conduct the associated analysis.
Note that strain is defined as the vertical derivative of isopycnal displacement and need departures from a time–mean density profile. However, estimates of the time mean are not available. Instead, we assume that large vertical length scales in the density profiles represent the time mean, and that small vertical length scales represent the internal wave field. During calculation, we interpolated original CTD profiles into a 10-m-depth grid and, each profile was broken into a half-overlapping 320-m-long segment, starting from the bottom. The strain variance
where
The stratification
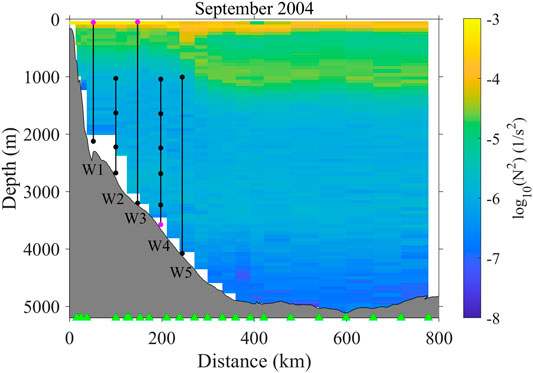
FIGURE 2. Stratification variation along the Line W section in September 2004. The horizontal label is the distance from the first station 9,001. The green triangles indicate the location of shipboard stations, black lines represent the moorings, dots indicate the location of current meters, and magenta dots represent incomplete records for entire four years.
The frequency spectra of the horizontal velocity (u, v) at W5 are shown in Figure 3. The spectra are dominated by peaks at a semidiurnal frequency (M2) and local inertial frequency (f). At frequency f, the energy level at 999 m is 1.9 × 10² m2/s2, about three times larger than that at 4,084 m (0.6 × 10² m2/s2). On the contrary, at the frequency of M2, the spectral level at 999 m is 0.7 × 10² m2/s2, approximately half of that at 4,084 m (1.5 × 10² m2/s2). Moreover, the slope of the spectra changes with the water depth, being 2.2 at 999 m and 2.5 at 4,084 m, suggesting that the deeper the depth, the weaker the higher frequency internal waves.
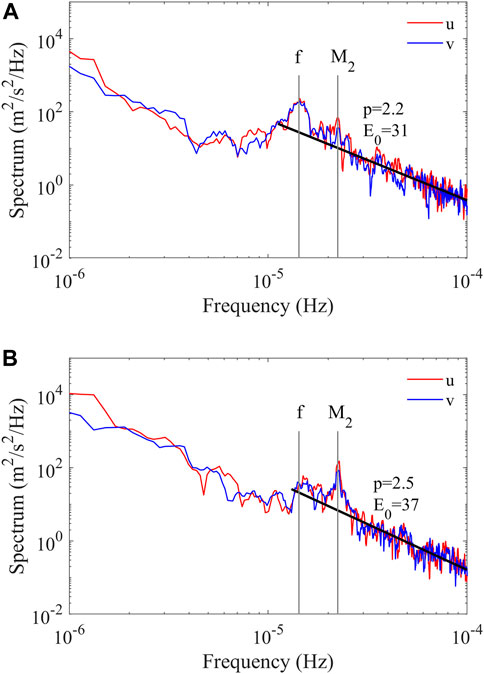
FIGURE 3. Frequency spectra of horizontal velocity at 999 m (A) and 4,084 m (B) at W5 during the period from 1 September 2004 to 1 October 2004. The black line is the line E0Nω-p, with observed N = 1.3 × 10⁻³ s−1 at 999 m and 3.4 × 10⁻⁴ s−1 at 4,084 m. The values of E0 and p are shown in each panel, and the unit of E0 is m2 (spectra for other periods are similar and not shown).
The internal wave strain variance is shown in Figure 4. Here, we provide the result along four sections which were sampled more extensively. There exists a high strain variance region over the slope, which is approximately above 3,000 m vertically, and far to 400 km horizontally. This is much more pronounced in September 2004 and October 2007.
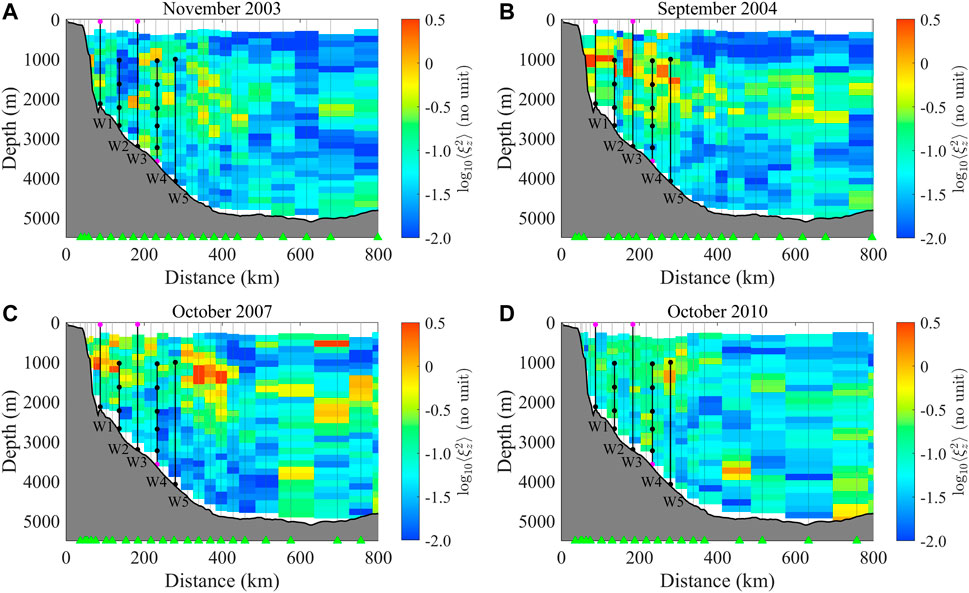
FIGURE 4. Spatial distributions of internal wave strain variance
The mean values of the internal wave strain variance over the slope and interior are shown in Table 1. In November 2003, the smallest mean value (0.06) is in the interior. The situation in October 2010 is similar to that in November 2003. In September 2004, the strain variance over the slope (0.48) is significantly different from that in November 2003 and October 2010 (0.15 and 0.12 over the slope, respectively). In October 2007, there is a synchronous enhancement of strain variance over the slope and in the interior. Compared to November 2003, the strain variance has a simultaneous enhancement in October 2007 (0.24 over the slope and 0.20 in the interior).
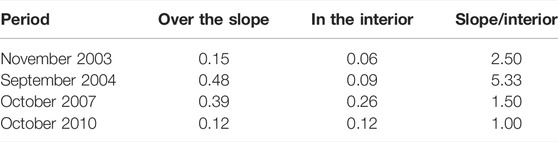
TABLE 1. Values of internal wave strain variance along the Line W section during different periods, and the ratio of slope to interior. (The values were inferred by averaging the strain variance over the whole water column in the slope and interior, respectively. The separation between the slope and interior is at station 9,018.)
Through the spatial distribution of SLA (Figure 5), it is suggested that September 2004 is one of the most likely periods for the interaction between mesoscale eddies and internal waves.
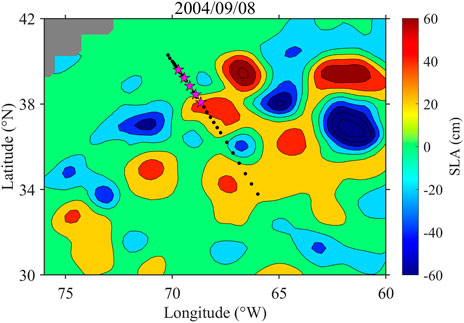
FIGURE 5. The spatial distribution of SLA on 8 September 2004, corresponding to the September 2004 cruise.
To explore the reasons responsible for this spatial variability in September 2004, we examine the contributions from ITs, NIWs, and high-frequency internal waves (HFIWs) which are closely related to the internal wave strain variance.
The barotropic tide is an important source to generate IT and internal wave strain variance (Waterhouse et al., 2017). IT is produced in stratified regions where barotropic tidal currents flow over topography, and the frequencies are equal to those of the barotropic tides (St. Laurent and Garrett, 2002). To understand the field of the semidiurnal barotropic tide in the observed area, tidal ellipses are shown in Figure 6A. In terms of tidal velocity magnitude, the semimajor axis is 0.82 m/s over the slope and 0.81 m/s in the interior and the semiminor axis is 0.36 m/s over the slope and 0.29 m/s in the interior. This comparison shows that the intensity of the semidiurnal barotropic tide is basically the same between the slope and interior.
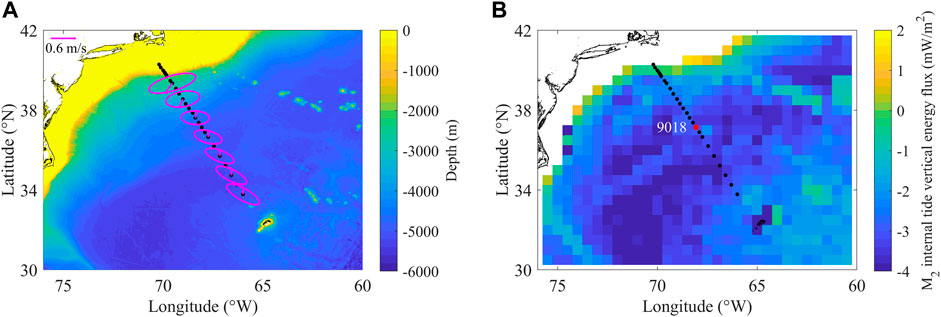
FIGURE 6. (A) Tidal current ellipses of M2 along the Line W section. (B) Vertical energy flux of M2 IT in the study region (the red dot represents the separation between the slope and interior, at station 9,018).
Based on the barotropic tide and bathymetry data, we further examine the vertical energy flux of the IT which is a quantity of primary interest for mixing. In the study area, the slope of the tidal beam α = [(ω2-f2)/(N2-ω2)]1/2 is 0.07 and the steepest topography slope s = 0.05, indicating that the topography is subcritical for the semidiurnal IT. The vertical energy flux of the IT Ef over the subcritical region can be derived as follows:
where
The map of the derived vertical energy flux is shown in Figure 6B. Along the whole section, the energy flux is mainly in the order of 10−3 mW/m2, with little higher values of 10−2 mW/m2 over the shallow water. The mean values of the vertical energy flux are 2.4 × 10⁻³ mW/m2 and 1.3 × 10⁻³ mW/m2 over the slope and in the interior, respectively, and the ratio of the slope to interior is 1.85.
This result implies that the semidiurnal IT is not the key reason for the significant increase in the strain over the slope in September 2004 but may be an important factor affecting the spatial variability of strain variance in November 2003 and October 2010. Because the mean value of the ratio about the slope to interior (2.50 and 1.00, respectively) is 1.75, which is very close to the ratio (1.85) due to the semidiurnal IT. Kelly et al. (2016) found that as ITs refract and/or reflect at the Gulf Stream, wave–flow interaction can cause the reappearance of ITs at shelf break; thus, their onshore energy fluxes are intermittent.
The record from current meter at W5 is taken as an example. According to the result of frequency spectra, it indicates that NIWs are possible throughout the whole water depth. The near-inertial horizontal velocity (ui, vi) can be estimated from the time series of velocity by band-pass filtering with a fourth-order Butterworth filter and a cutoff frequency band from 0.8f to 1.2f. The near-inertial horizontal kinetic energy (HKE) is calculated as follows:
Here we take ρ0 as 1,032 kg/m3 at 999 m.
Figure 7 shows the temporal variation of the near-inertial HKE and corresponding sea surface wind speed during the first measurement period from 1 May 2004 to 2 April 2005. It is apparent that the near-inertial HKE is elevated, with a mean value of 0.47 J/m3 during the period in which wind speed is roughly larger than 8.2 m/s (from November 2004 to April 2005). In contrast, from May 2004 to October 2004, the mean value of the near-inertial HKE is as low as 0.26 J/m3, accompanied by the weak wind speed of 6.3 m/s. This implies that the near-inertial motions at 999 m are closely linked to the sea surface wind field.
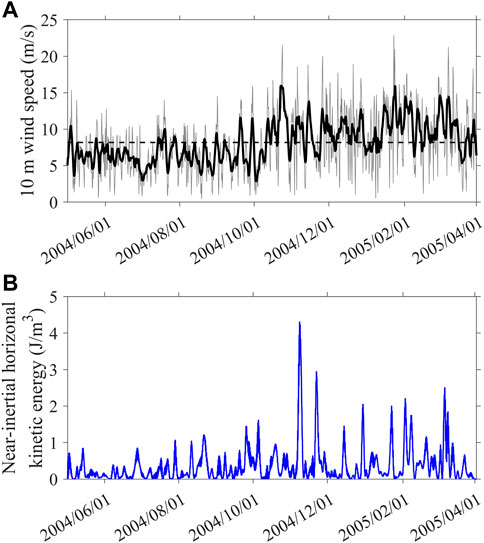
FIGURE 7. (A) 10 m wind speed above sea surface (the gray line is raw data; the thick black line is 3-day smoothing data, and the dashed line is the mean value). (B) Near-inertial HKE at 999 m. The period is from 1May 2004 to 2 April 2005, and the results from other periods are similar and not shown.
Because there are no velocity measurements in the interior, we cannot compare the near-inertial HKE between the slope and interior directly. Alternatively, we investigated the variation of the sea surface wind field along the whole section, which is the main factor modulating the near-inertial motion in the upper ocean (Alford et al., 2012).
Wind-induced near-inertial energy has been believed to be an important source for generating the ocean mixing required to maintain the global meridional overturning circulation. Zhai et al. (2009) found that nearly 70% of the wind-induced near-inertial energy at the sea surface is lost to turbulent mixing within the top 200 m by analyzing model data. Zhai et al. (2005) implicated that the interaction between inertial oscillations generated by a storm and a mesoscale eddy field is an important way for the near-inertial energy entering the ocean and is ultimately available for mixing. Lelong et al. (2020) and Zhai et al. (2005) came to the same conclusion that near-inertial energy could propagate to the deeper layer of the ocean with the help of the anticyclonic eddy. As shown in Figure 8, in September 2004, the variability of wind along the whole section is weak, both for magnitude and direction, and there were no hurricanes during the observation period. The NIWs induced by sea surface wind and used to furnish diapycnal mixing would not have a significant difference between the slope and interior because the majority of the near-inertial energy was lost to turbulent mixing within the top 200 m and hence could not cause the spatial variability of internal wave strain variance as mentioned previously.
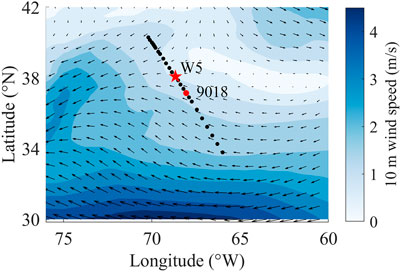
FIGURE 8. 10 mwind speed above sea surface in the study region, blue contour is wind speed; the data are averaged in September 2004.
In addition to the low-frequency motions mentioned previously, we examined the HFIWs and their relation to the sub-inertial flow and the total internal waves. Here, the HFIW motion is derived from 3–10 cycles per day (cpd) band-pass filter, and the sub-inertial component is estimated by using a fourth-order Butterworth low-pass filter, with a cutoff frequency of 0.2 cpd. The total internal wave velocity, by subtracting the sub-inertial flow from the original velocity and then subtracting its depth average, contains only the baroclinic velocity.
During the observation period in September 2004, a mesoscale eddy passing through the section can be observed using lowered ADCP data. From the velocity contours of Figure 9A, the horizontal scale of the eddy is about 250 km, and the cross-sectional current velocity is positive in the left half and negative in the right half, indicating that the eddy is a clockwise-rotating anticyclonic eddy, and the eddy is dominated by the barotropic mode due to the consistent flow direction from the surface to the bottom. In the region above 1,000 m in vertical and 200–450 km in horizontal direction, the maximum value of the current velocity is 1.80 m/s and the minimum value is −0.58 m/s. Note that the observed current velocity contains the eddy part and the Gulf Stream part. The magnitude of the current velocity exceeds 0.1 m/s in the region from 1,000 m to the seafloor, indicating that the vertical influence depth of anticyclonic eddy can reach the seafloor. From the satellite altimeter data, a anticyclonic eddy passing through the Line W section can also be observed, which indicates that it is feasible to use lowered ADCP data to determine the general location of the eddy.
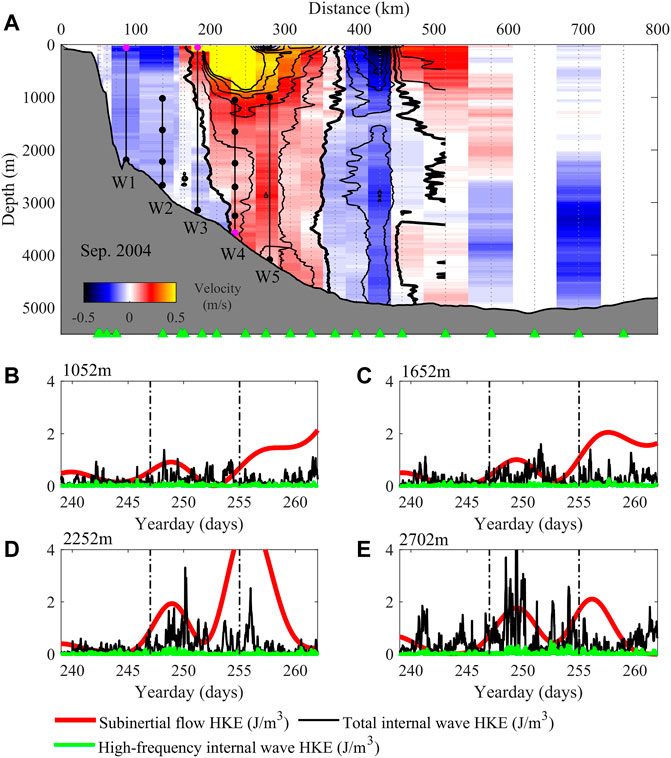
FIGURE 9. (A) Cross-sectional velocity distribution in September 2004; the thick black line represents velocity is 0 and contour interval is 0.1 m/s. (B–E) Sub-inertial flow (red), total internal wave (black), and HFIW (green) HKE at mooring W4 at the depth of 1,052, 1,652, 2,252, and 2,702 m. The period is from 27 August 2004 to 19 September 2004. The dashed lines indicate the shipboard observation period in September 2004.
Mooring W4 is under the influence of the anticyclonic eddy and has more current meters, so we calculate and analyze the HKE of the sub-inertial flow, total internal wave, and HFIW at W4. The results show that (Figures 9B–E) before the appearance of the anticyclonic eddy, when the HKE of the sub-inertial flow is small, the HKE of the total internal wave is relatively weak, while the anticyclonic eddy appears, the HKE of the total internal wave shows a significant trend of enhancement. At the depths of 1,052 m, 1,652 m, 2,252 m, and 2,702 m, the mean HKE of the total internal wave increases from 0.15 J/m3 to 0.28 J/m3, from 0.18 J/m3 to 0.33 J/m3, from 0.14 J/m3 to 0.47 J/m3, and from 0.40 J/m3 to 0.80 J/m3, respectively. There is a positive correlation between the HKE of the internal wave and the HKE of the anticyclonic eddy. When the HKE of the total internal wave increases dramatically, the HKE of the HFIW also appears to be elevated, for example, at the depths of 2,252 m and 2,752 m, the mean HKE of the HFIW increases from 0.03 J/m3 to 0.04 J/m3 and from 0.03 J/m3 to 0.08 J/m3, respectively. This suggests that anticyclonic eddy contributes to HFIWs in this region, which is reported by Liang and Thurnherr (2011; 2012), who found that sub-inertial velocity pulses were directly related to mesoscale eddies spanning the entire water column and suggested that NIWs were likely to be excited by mesoscale eddies.
To better understand the effect of anticyclonic eddy on internal waves, a spectrum analysis is performed by comparing the kinetic energy spectrum of internal waves before (from 27 August 2004 to 3 September 2004) and during (from 4 September 2004 to 12 September 2004) the emergence of the anticyclonic eddy, and the result is shown in Figure 10. The energy of the internal waves is more easily transferred toward higher-frequency internal waves during the period of eddy appearance, and this phenomenon is distinct at 2,702 m, and kinetic energy integration within the HFIW band (3–10 cpd) increases from 24.89 cm2/s2 to 60.06 cm2/s2. During the observation period, the IT and NIW kinetic energies are stronger at 2,702 m, and wave–wave interactions occur with the catalytic effect of the anticyclonic eddy, and HFIWs (-f2S2, -f3M2, 2f2M2, etc.) are developed and enhanced.
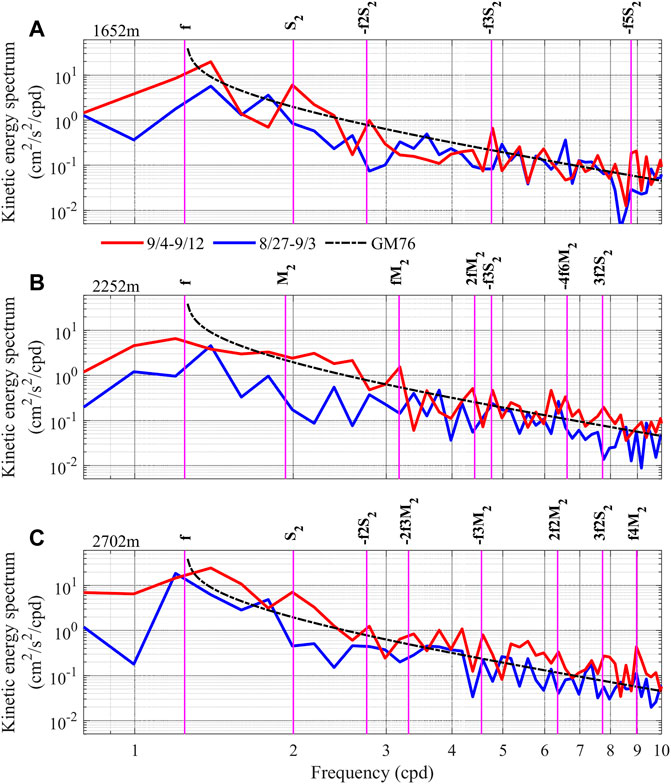
FIGURE 10. (A–C) Kinetic energy spectrum of internal waves from 4 September 2004 to 12 September 2004 (red) and from 27 August 2004 to 3 September 2004 (blue) at 1,652 m, 2,252 m, and 2,702 m. The black dash lines indicate the GM76 spectrum, and magenta lines represent different frequencies of internal waves.
Based on the deep-ocean mooring measurements in the South China Sea, Hu et al. (2020) found that interactions between eddies and rough topography generated deep-ocean NIW pulses that constituted as a local sink for the eddy energy. Then NIWs further catalyzed non-linear interactions among internal waves, which manifested as significant enhancements of higher frequency internal wave energy. The results we obtained were in general agreement with the second part of the study of Hu et al. (2020), indicating that our results are reliable.
These results indicate that the appearance of the anticyclonic eddy effectively promotes the increase in the kinetic energy of the internal wave field and transfers the energy from the low-frequency internal waves to the higher frequency internal waves, resulting in a positive energy cascade transfer. This explains the significant enhancement of the strain variance occurring over the slope in September 2004.
Based on the field measurement from the Line W section, the spatial variability of internal wave strain variance and its possible reasons were examined and explored. The results suggest that the internal wave strain variance over the slope can be up to five times larger than that in the interior. Although ITs and wind-induced NIWs can result in internal wave strain variance, they are not the crucial reason responsible for the spatial variability of the strain in September 2004. The mooring observation suggests that the HFIW is the potential reason for high-level values over the slope. This study indicates that HFIWs generated by the wave–wave interactions, caused by the interaction between the anticyclonic eddy and low-frequency internal waves, may be an important route to furnish internal wave strain variance.
The dataset analyzed in this study is from the Line W program (https://scienceweb.whoi.edu/linew/index.php). In addition, the sea-level anomaly (SLA) is from AVISO+ (https://www.aviso.altimetry.fr/en/home.html); climatological current data are from Hycom (https://www.hycom.org/); daily wind speed at 10 m height is from ERA-Interim reanalysis data (https://www.ecmwf.int/); high-resolution bathymetry data are taken from (https://topex.ucsd.edu/WWW_html/srtm15_plus.html), and the barotropic tide data are from TPXO 9.0 (https://www.tpxo.net/home/).
LF and XW conceptualized the research idea. LF was involved in formal analysis and original draft preparation. XW reviewed and edited the paper. All authors have read and agreed to the published version of the manuscript.
This work was jointly supported by the Natural Science Outstanding Youth Fund of Shandong Province (ZR2019JQ13), National Key R&D Program of China (2019YFB1504402), and the Natural Science Foundation of China (42076012 and 42006012).
The authors declare that the research was conducted in the absence of any commercial or financial relationships that could be construed as a potential conflict of interest.
All claims expressed in this article are solely those of the authors and do not necessarily represent those of their affiliated organizations, or those of the publisher, the editors, and the reviewers. Any product that may be evaluated in this article, or claim that may be made by its manufacturer, is not guaranteed or endorsed by the publisher.
We thank the Line W program for their dedication and continuing support, as well as two reviewers for their constructive comments.
Alford, M. H., Cronin, M. F., and Klymak, J. M. (2012). Annual Cycle and Depth Penetration of Wind-Generated Near-Inertial Internal Waves at Ocean Station Papa in the Northeast Pacific. J. Phys. Oceanogr. 42, 889–909. doi:10.1175/JPO-D-11-092.1
Alford, M. H., and Gregg, M. C. (2001). Near-Inertial Mixing: Modulation of Shear, Strain and Microstructure at Low Latitude. J. Geophys. Res. 106, 16947–16968. doi:10.1029/2000JC000370
Brearley, J. A., Sheen, K. L., Naveira Garabato, A. C., Smeed, D. A., and Waterman, S. (2013). Eddy-Induced Modulation of Turbulent Dissipation over Rough Topography in the Southern Ocean. J. Phys. Oceanogr. 43, 2288–2308. doi:10.1175/JPO-D-12-0222.1
Clément, L., Frajka-Williams, E., Sheen, K. L., Brearley, J. A., and Garabato, A. C. N. (2016). Generation of Internal Waves by Eddies Impinging on the Western Boundary of the North Atlantic. J. Phys. Oceanogr. 46, 1067–1079. doi:10.1175/JPO-D-14-0241.1
Fer, I., Bosse, A., Ferron, B., and Bouruet-Aubertot, P. (2018). The Dissipation of Kinetic Energy in the Lofoten Basin Eddy. J. Phys. Oceanogr. 48, 1299–1316. doi:10.1175/JPO-D-17-0244.1
Hu, Q., Huang, X., Zhang, Z., Zhang, X., Xu, X., Sun, H., et al. (2020). Cascade of Internal Wave Energy Catalyzed by Eddy‐Topography Interactions in the Deep South China Sea. Geophys. Res. Lett. 47, e2019GL086510. doi:10.1029/2019GL086510
Joyce, T. M., Toole, J. M., Klein, P., and Thomas, L. N. (2013). A Near-Inertial Mode Observed within a Gulf Stream Warm-Core Ring. J. Geophys. Res. Oceans 118, 1797–1806. doi:10.1002/jgrc.20141
Kelly, S. M., Lermusiaux, P. F. J., Duda, T. F., and Haley, P. J. P. J. (2016). A Coupled-Mode Shallow-Water Model for Tidal Analysis: Internal Tide Reflection and Refraction by the Gulf Stream. J. Phys. Oceanogr. 46, 3661–3679. doi:10.1175/JPO-D-16-0018.1
Lelong, M.-P., Cuypers, Y., and Bouruet-Aubertot, P. (2020). Near-Inertial Energy Propagation inside a Mediterranean Anticyclonic Eddy. J. Phys. Oceanogr. 50, 2271–2288. doi:10.1175/JPO-D-19-0211.1
Liang, X., and Thurnherr, A. M. (2012). Eddy-Modulated Internal Waves and Mixing on a Midocean Ridge. J. Phys. Oceanogr. 42, 1242–1248. doi:10.1175/JPO-D-11-0126.1
Liang, X., and Thurnherr, A. M. (2011). Subinertial Variability in the Deep Ocean Near the East Pacific Rise between 9° and 10°N. Geophys. Res. Lett. 38, a–n. doi:10.1029/2011GL046675
Mauritzen, C., Polzin, K. L., McCartney, M. S., Millard, R. C., and West-Mack, D. E. (2002). Evidence in Hydrography and Density Fine Structure for Enhanced Vertical Mixing over the Mid-Atlantic Ridge in the Western Atlantic. J. Geophys. Res. 107, 11–19. doi:10.1029/2001JC001114
Sheen, K. L., Brearley, J. A., Naveira Garabato, A. C., Smeed, D. A., Laurent, L. S., Meredith, M. P., et al. (2015). Modification of Turbulent Dissipation Rates by a Deep Southern Ocean Eddy. Geophys. Res. Lett. 42, 3450–3457. doi:10.1002/2015GL063216
St. Laurent, L., and Garrett, C. (2002). The Role of Internal Tides in Mixing the Deep Ocean. J. Phys. Oceanogr. 32, 2882–2899. doi:10.1175/1520-0485(2002)032<2882:troiti>2.0.co;2
St. Laurent, L., Naveira Garabato, A. C., Ledwell, J. R., Thurnherr, A. M., Toole, J. M., and Watson, A. J. (2012). Turbulence and Diapycnal Mixing in Drake Passage. J. Phys. Oceanogr. 42, 2143–2152. doi:10.1175/JPO-D-12-027.1
Waterhouse, A. F., Mackinnon, J. A., Musgrave, R. C., Kelly, S. M., Pickering, A., and Nash, J. (2017). Internal Tide Convergence and Mixing in a Submarine Canyon. J. Phys. Oceanogr. 47, 303–322. doi:10.1175/JPO-D-16-0073.1
Xu, Z., Yin, B., Hou, Y., and Xu, Y. (2013). Variability of Internal Tides and Near-Inertial Waves on the Continental Slope of the Northwestern South China Sea. J. Geophys. Res. Oceans 118, 197–211. doi:10.1029/2012JC008212
Zhai, X., Greatbatch, R. J., Eden, C., and Hibiya, T. (2009). On the Loss of Wind-Induced Near-Inertial Energy to Turbulent Mixing in the Upper Ocean. J. Phys. Oceanogr. 39, 3040–3045. doi:10.1175/2009JPO4259.1
Keywords: strain variance, internal waves, mesoscale eddies, wave-wave interactions, North Atlantic
Citation: Fan L and Wang X (2022) Variability of Internal Wave Strain Over the Western Boundary Region in the North Atlantic. Front. Earth Sci. 10:855644. doi: 10.3389/feart.2022.855644
Received: 15 January 2022; Accepted: 14 March 2022;
Published: 12 April 2022.
Edited by:
Fangjian Xu, Hainan University, ChinaReviewed by:
Hongzhou Xu, Institute of Deep-Sea Science and Engineering (CAS), ChinaCopyright © 2022 Fan and Wang. This is an open-access article distributed under the terms of the Creative Commons Attribution License (CC BY). The use, distribution or reproduction in other forums is permitted, provided the original author(s) and the copyright owner(s) are credited and that the original publication in this journal is cited, in accordance with accepted academic practice. No use, distribution or reproduction is permitted which does not comply with these terms.
*Correspondence: Xin Wang, d3h0am5rMDIyQDEyNi5jb20=
Disclaimer: All claims expressed in this article are solely those of the authors and do not necessarily represent those of their affiliated organizations, or those of the publisher, the editors and the reviewers. Any product that may be evaluated in this article or claim that may be made by its manufacturer is not guaranteed or endorsed by the publisher.
Research integrity at Frontiers
Learn more about the work of our research integrity team to safeguard the quality of each article we publish.