 Sorranat Ratchawang
 Srilert Chotpantarat
 Pimchaya Charoenrojying2
- 1International Programs in Hazardous Substance and Environmental Management, Graduate School, Chulalongkorn University, Bangkok, Thailand
- 2Department of Geology, Faculty of Science, Chulalongkorn University, Bangkok, Thailand
- 3Research Program on Controls of Hazardous Contaminants in Raw Water Resources for Water Scarcity Resilience, Center of Excellence on Hazardous Substance Management (HSM), Chulalongkorn University, Bangkok, Thailand
- 4Research Unit of Green Mining (GMM), Environmental Research Institute, Chulalongkorn University (ERIC), Bangkok, Thailand
Groundwater has been widely used in Thailand for many purposes, including agricultural activities; therefore, groundwater can be contaminated and affect the environment and human health. One of the most commonly applied and imported pesticides is atrazine, which is an herbicide used to control annual broadleaf and grass weeds in sugarcane. Monitoring and reducing the atrazine leaching potential into groundwater would play an important role in preventing this problem. The aim of this study is to evaluate the leaching potential of atrazine in Song Phi Nong District, Suphan Buri Province, via the attenuation/retardation factor model (AF/RF model) and the groundwater ubiquity score (GUS). It was found that most of the agricultural areas, especially the sugarcane fields, had high leaching potential due to the low adsorption and water holding capacity of the soil. The performance of the model was then evaluated by the result of nitrate (NO3−) detection in groundwater, which has been reported to be a pesticide and herbicide leaching indicator. Interestingly, the area with high leaching potential was partly contaminated by high NO3− concentration. However, some factors relating to leaching potential in the area were not considered in the model, causing low nitrate concentration detection. The isotopic ratio was also measured in this study to identify sources of NO3−; most of the nitrate in the groundwater samples, as a result, was polluted by human activities, especially from domestic wastewater. The AF/RF model can be a risk management and groundwater resource planning assistant, leading to human health and environmental protection related to pesticide-contaminated groundwater.
Introduction
Groundwater is a major source of fresh water in the world and is widely used for many purposes, including drinking water, industrial estate water, and agricultural and municipal supplies. It is subject to contamination by leaching from both point sources and nonpoint sources (Ki and Ray, 2015). One of the ways to protect groundwater is agricultural chemical monitoring as pest control and prevention strategies during the cultivation of various crops are the main purposes causing the increase in production (Vieira et al., 2021). Although pesticides are formulated to control and prevent agricultural losses, these compounds can also directly or indirectly affect other organisms depending on the toxicity and properties of the active compound (Tsai, 2013). Atrazine is one of the most widely used pesticides in the world and is the most commonly detected in groundwater (Schreglmann et al., 2013; Almberg et al., 2018; Rohr, 2018). In addition, one of the most applied and imported pesticides in Thailand is atrazine, which is an herbicide used to control annual broadleaf and grass weeds in sugarcane and corn (Panuwet et al., 2012; Yue et al., 2017). However, atrazine also damages several other organisms (Solomon et al., 2013), and its presence in the aquatic environment can compromise the conservation of biodiversity in addition to causing serious damage to human health (Chevrier et al., 2011). Atrazine was detected in concentrations of 0.058–0.086 μg/l in water samples collected from the Chao Phraya River, which is located in central Thailand (Kruawal et al., 2005). In the central plain of Thailand, 1.89 μg/l of atrazine was found in groundwater wells; this must be considered a health concern because atrazine is an endocrine disruptor in humans (Lasserre et al., 2009). Monitoring and reducing the atrazine leaching potential into groundwater would play an important role in protecting the environment and human health.
Plants face problems with annual broadleaf weeds; in this study, sugarcane was selected as it has been widely planted in Song Phi Nong District, Suphan Buri Province. It requires atrazine with a use rate of 480–640 g/m2 to deal with the problem. In addition, nitrogen-based fertilizers are also intensively utilized in this area for adding nutrients; as a result, nitrate (NO3−) has been found in shallow wells around the agricultural area. Nitrate contamination in both surface water and groundwater is an international problem requiring a response and scientific analysis due to its effect on human health. Groundwater samples from agricultural areas in Chiang Mai Province in northern Thailand were found to be contaminated by high concentrations of nitrate (˃ 290 mg/L) (Putthividhya and Pipitsombat, 2015), and nitrate has also been detected in surface water and shallow groundwater in Suphan Buri and Kanchanaburi provinces. Interestingly, co-occurrence of atrazine and NO3− has also been reported in groundwater at several places (Gosselin et al., 1997; Spalding et al., 2003; Exner et al., 2010; Toccalino et al., 2012; Stayner et al., 2017). A positive correlation between atrazine and nitrate in groundwater and drinking water samples was reported in a study conducted in Canada (Dalton et al., 2014). The correlation between atrazine and NO3− was also reported in Germany related to leaching from intensively used agricultural fields (Vonberg et al., 2014). Therefore, this study aims to use NO3− as an indicator of atrazine present in groundwater as the Department of Groundwater Resources (2009) reported that atrazine in groundwater samples in the agricultural area in Suphan Buri province was lower than the detection limit.
Furthermore, groundwater contamination in an agricultural area is caused by the leaching of several contaminants, such as atrazine, which may occur in sugarcane fields. Simulation models are appropriate tools for preventing groundwater contamination as they can predict pollution risks, leading to groundwater protection from such pollutants. In the case of studying nonpoint source pollution, it is necessary to consider the problem at a regional scale; the use of a simulation model integrated with the Geographical Information System (GIS) is very effective (De Paz and Rubio, 2006). Essentially, adsorption behavior plays an important role in the assessment of the leaching potential of pesticides into groundwater. It has been reported that a lower adsorption coefficient results in a higher leaching potential (Chorom et al., 2010; Yao et al., 2012). Previous studies have shown that the adsorption process of organic compounds like atrazine is complex and affected by many parameters, including pH, clay content, cation exchange capacity, organic matter, the surface area of the adsorbent, and ionic strength (Kodešová et al., 2011; Saravanan et al., 2015; Fan et al., 2016; Yang et al., 2019; Yu et al., 2020; Copaja and Gatica-Jeria, 2021). Several studies have used simple models or indexes, for example, the leaching index (De Paz and Rubio, 2006), and the groundwater ubiquity score (GUS) (Gustafson, 1989), to assess pesticide leaching in agricultural areas. One of the useful models in this regard is the AF/RF (Attenuation/Retardation Factor) model, which is a tier-1 model based on the attenuation factor (AF) approach (Li et al., 1998). This model has been used in combination with GIS to study the leaching potential of pesticides at the regional scale, but it has not been used to evaluate the atrazine leaching potential in the sugarcane area of Thailand, especially in Suphan Buri Province (Hall et al., 2015; Ki et al., 2015; Ki and Ray, 2015).
Thus, the objective of this study is to evaluate the leaching potential of atrazine in Song Phi Nong District, Suphan Buri Province, as these are the areas used as sugarcane fields via the AF/RF model. The performance of the model was compared with the result of GUS index; moreover, the result of the model was also compared with NO3− concentration in groundwater as it has been reported as an indicator of atrazine contamination. Finally, sources of nitrate were identified using hydrochemical characteristics and the nitrogen isotope technique. From this study, we expect that the leaching tool will provide new insight into groundwater vulnerability assessment for contaminants of agricultural chemicals such as atrazine and others.
The Study Area
The study area was located in Song Phi Nong District, Suphan Buri Province, Thailand. The area coverage is approximately 750 km2, which is mostly utilized for planting sugarcane in addition to rice in the west. The topography of the province is mainly floodplain in the eastern part and mountainous areas in the west. The average annual rainfall (2003–2015) ranges from 646.9 to 1,303.6 mm, and the average temperature ranges from 25.4 to 31.3°C. The Department of Groundwater Resources (DGR) states that this province can be divided into highland and lowland areas, and groundwater can be defined in both consolidated and unconsolidated aquifers in most of the agricultural lowland (Department of Groundwater Resource, 2009); the unconsolidated aquifers consist of gravel, sand, and clay of delta plains, rolling terraces, and alluvial plains. The geology of the study area mostly comprises alluvial and alluvial fan delta deposits of Quaternary age with lime nodules. Moreover, hydrogeological units in this study consist of both unconsolidated and consolidated aquifers, including alluvial aquifers (Qfd), terrain deposit aquifers (Qt), and Ordovician limestone aquifers (Ols). The study area is mainly used for agriculture, leading to the application of fertilizers and pesticides to increase crop yield. Groundwater in this area has been found to be contaminated by nitrate caused by the application of nitrogen-based fertilizer (Wisittammasri and Chotpantarat, 2016; Juntakut, 2018). In addition, pesticide pollutants were found in the groundwater, demonstrating the possibility of leaching of pesticides from soil to groundwater, although the detected concentrations did not exceed the soil and groundwater quality standards in Thailand for 110 mg/kg and 0.02 mg/l, respectively. Based on the land use map in this area, there are various kinds of land utilization, including active paddy fields, sugarcane fields, landfills, and communities. Especially in sugarcane fields, intensive use of atrazine for weed control was reported. To define the leaching risk of atrazine in the study area, soil samples were collected from 8 different points in a sugarcane field to investigate the adsorption behaviors of atrazine in each individual soil. Moreover, 13 groundwater wells were sampled to measure atrazine and nitrate concentrations due to long-term application in the agricultural areas. The study area is shown in Figure 1.
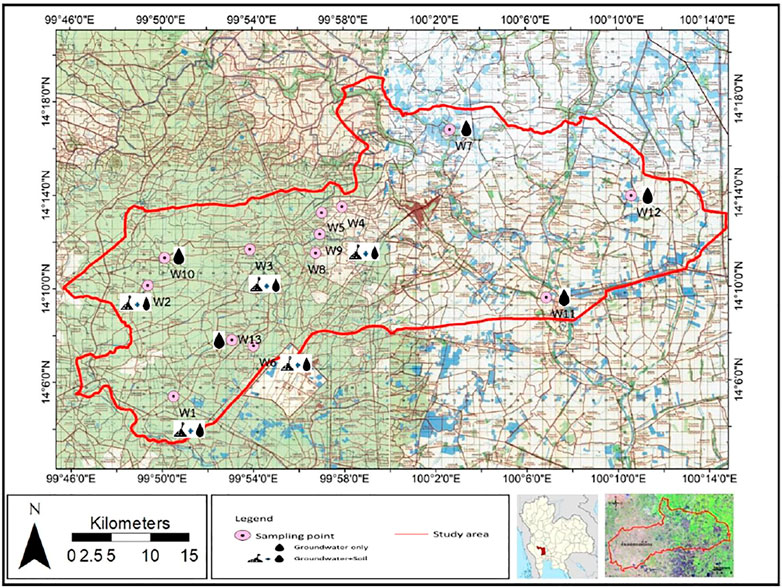
FIGURE 1. Study area and groundwater sampling points.
Methodology
Soil and Groundwater Sampling
The locations of the 8 and 13 soil and groundwater sampling points, respectively, are shown in Figure 1 and Supplementary Table S1. This study focused on the agricultural area, so soil and groundwater in other land use in the eastern area were not densely collected. Moreover, the elevation of the groundwater wells conforms to the geographic profile. For groundwater sampling, the groundwater level was first measured using a water level meter; then, a bailer was gently dropped on the top of water column in the shallow groundwater wells until it was full. At this point, the water was transferred into an appropriate sample container. In addition, for deep groundwater wells, there was a pumping system installed for groundwater consumption and it was pumped out before collecting groundwater samples as it is a selected purging method that does not alter the geochemical and physical properties. Additional parameters measured on-site were pH, oxidation–reduction potential (ORP), dissolved oxygen (DO), electrical conductivity (EC), and temperature. The samples were stored at a temperature lower than 4°C in an ice box during transportation.
For the soil sampling, samples were collected in a sugarcane field in the study area based on different soil textures contained in the study area with different collecting methods, i.e., bulk soil sampling and soil core sampling. For the bulk soil sampling, each sampling point was collected at a depth of 15-cm from 5 different spots around the point. These five locations were approximately 10 m from each other. The sub-samples were then mixed together for representative soil at the sampling point. For the soil core sampling, surface soil to 15-cm depth was removed, and the core was collected using a 100-cm3 soil core sampler with duplicate samples. The core sampler was then hammered down to preserve the depositional sequence. Finally, bulk soil samples were air-dried for 1 week and then passed through a 2-mm sieve. Only soil particles ≤2 mm were retained for further adsorption experiments.
Soil Sample Analysis
Soil core samples were used to determine the bulk density of soil at each sampling point after being oven-dried at 105°C for 3 days. The samples were also used to define hydraulic conductivity through the Falling head permeability test, indicating the potential for water flowing through the soil. Additionally, 2-mm diameter soil bulk samples were used to identify the texture of each sample, and pH and organic matter were measured from the bulk soil samples. 20 g of soil were added to 20 ml of distilled water (1:1 w/w) in the 60 ml PE bottle and were stirred regularly for 30 min. Then, the soil samples were left for 30 min until settled; pH of the water above the soil was determined by pH electrode (Pansu and Gautheyrou, 2006). Soil organic matter (%OM), in this study, was measured using the Walkley and Black Method (Mylavarapu, 2014), while soil texture was defined by Robinson’s pipette analysis (Augustin and Cihacek, 2016; de Oliveira Morais et al., 2019). Moreover, %OM can be converted into soil organic carbon (%OC) by the following equation:
To define the adsorption coefficient of atrazine in soil (Kd), a batch adsorption experiment was carried out (Yue et al., 2017). Firstly, a 15-ml centrifuge tube was filled with 1 g of each 2-mm diameter bulk soil sample from the different points in the study area along with 10 ml of atrazine solution (standard atrazine with >97.0% purity purchased from Tokyo Chemical Industry Co., Ltd. in a background solution of acetonitrile and 0.01 mol/l CaCl2 for maintaining the ionic strength). In this case, atrazine was added at an initial concentration of 0.5, 1, 5, 10, and 20 mg/l, respectively. Next, all tubes were sealed and shaken for 24 h; then, the suspension was centrifuged for 5 min at 5,000 rpm (Chefetz et al., 2004). Yue et al. (2017) claimed that the equilibrium time of atrazine adsorption was approximately 24 h as the adsorption occurred on the surface of soil organic matter. After the centrifugation, 2 ml of supernatant was filtered through a 0.45-µm pore size membrane and analyzed by High-Performance Liquid Chromatography (HPLC) with a model 490E UV detector, and a Hewlett Packard C18 column 250 mm, 5 µm particle size, 3 mm diameter. The mobile phase was a 60:40 mixture of acetonitrile and deionized water with a flow rate of 1 ml/min. Twenty µl of the sample was injected with a selected wavelength of 220 nm for each analysis with a retention time of 3.8 min; each adsorption experiment was performed in triplicate. Additionally, a blank sample (no soil) was prepared with the different initial concentrations.
The difference between the calculated initial atrazine concentration in the solution and the equilibrium concentration is the amount of absorbed atrazine in the soil. Kd was estimated as the ratio of the adsorbed atrazine concentration to the remaining concentration in solution at equilibrium. If the isotherm is linear, Kd corresponds to the isotherm slope. The defined Kd values were normalized to the fractional soil organic carbon content (foc) of each soil to determine the adsorption coefficient (Koc) by the following equation:
Linear, Freundlich, or Langmuir adsorption models have commonly been used to describe analytical adsorption isotherms (Schwarzenbach et al., 1993). To clarify the overall adsorption process of atrazine in all soil samples, Langmuir and Freundlich sorption models have been used. The Langmuir isotherm model assumes that the energy adsorbed on the surface of the adsorbent is uniform with no interaction between the adsorbed molecules (Langmuir, 1918; Sahu et al., 2016). On the other hand, the Freundlich isotherm model is used to describe heterogeneous surface equations such as the heterogeneity of the adsorbent surface, the adsorption energy, and the exponential distribution of the adsorption point (Freundlich, 1907). In this study, isotherms were modeled using Langmuir and Freundlich models and given their expressions since they show related results.
HYDRUS-1D
HYDRUS-1D is an environmental model for simulating fluid movement and contaminant transport in one-dimensional various saturated media (Šimunek et al., 2012). The Richards equation and Fickian-based advection-dispersion equations are used to govern solute transport in the liquid phase and diffusion in the gaseous phase (Ladu and Zhang, 2011). In this study, HYDRUS-1D was used to predict the hydraulic conductivity with the following equation, which is modified from Richard’s equation (Ali et al., 2021):
where h is the water pressure head (L), θ is the volumetric water content (L3L−3), t is leaching time (minutes), x is the spatial coordinate (positive equivalent to upwards), and K is the unsaturated hydraulic conductivity (LT−1). It should be noted that Richard’s equation does not account for the effects of the vapor phase in water flow but considers only the liquid phase in the water mass balance.
Attenuation/Retardation Factor Model and Groundwater Ubiquity Score Index
The attenuation/retardation factor model (AF/RF model) is a tier-1 or simple model used to determine the leaching potential of a pesticide through the soil profile (Rao et al., 1985). This model can be used to solve large-scale problems because it does not require an excessive amount of data. The Attenuation Factor, or AF value, ranges from 0 to 1. The value indicates the possibility of pesticides leaching from the soil surface to the groundwater table. If the AF value is 1, it means that the pesticide is non-adsorbed and has a high groundwater pollution risk. In contrast, if the AF is 0, the pesticide is considered a strongly adsorbed pesticide and has a low groundwater pollution risk (De Paz and Rubio, 2006). The AF value can be defined by the following equation:
where d is the groundwater depth (m), θFC is the water content at field capacity, q is the water recharge through soil or water flow (m/d), and t1/2 is the half-life of the pesticide (d). Additionally, RF is the retardation factor and can be computed by the following equation:
where ρb is the bulk density of soil (kg/m3), foc is the organic carbon content fraction, and Koc is the adsorption coefficient (m3/kg). To evaluate the degree of leaching risk to groundwater of the pesticide under study, the AF value is classified into five classes, as shown in Table 1 (Khan and Liang, 1989). The required data were stored in a GIS, which was integrated with the AF/RF model to evaluate the potential of leaching groundwater of the pesticide.
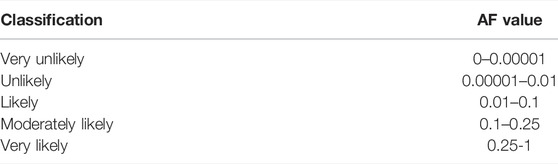
TABLE 1. Leaching potential categories.
Moreover, the Groundwater Ubiquity Score (GUS) index was used to assess the vulnerability of atrazine in the study area. This screening method uses the Koc value and t1/2 to rank the leaching potential of the pesticide to groundwater. A pesticide with a GUS value less than 1.8 is described as a “non-leacher,” a pesticide with a value greater than 2.8 is described as a “leacher,” and a pesticide with a value between 1.8 and 2.8 is considered “transitional.” The GUS value can be calculated by the following equation:
The Chi-Square Test
The chi-square test is the sum of the squared difference between the estimated value provided by the model and the experimental data (Ho and Ofomaja, 2006). The chi-square test was used to assess the adsorption isotherm with the following equation:
where qe is the equilibrium data from the experiment (mg/g) and qe, model is the amount of adsorbed atrazine per mass of soil (mg/g). If X2 is a small number, it can be concluded that the observed data and calculated data are almost the same.
Groundwater Sample Analysis for Hydrochemical Characteristics and Isotopes
All 13 groundwater samples were filtered through a 0.45-µm pore size membrane to avoid clogging during injection, and stable isotopes in water (oxygen and deuterium isotopes: δ18O and δ2H) were analyzed using cavity ring-down spectroscopy (model L2130-i, Picarro Inc., Santa Clara, United States) at the Thailand Institute of Nuclear Technology (TINT). Moreover, the compositions of nitrogen isotopes (δ15N) and δ18O were analyzed by the denitrifier method (Sigman et al., 2001) at the UC Davis Stable Isotope Facility, University of California, United States. The analytical precision for δ15N and δ18O were approximately ±0.1‰ and ±0.3‰, respectively. All stable isotopic compositions (delta, δ) were reported in per mil (‰) notation using the following equation:
where Rsample is the isotope ratio of the sample and Rstandard is the isotope ratio of the standard.
For analysis of cations (Ca2+, Mg2+, and Na+), all groundwater samples were acidified to pH < 2 with nitric acid (HNO3) and loaded into an atomic adsorption spectrophotometer (AAS) (Analytik Jena model ZEEnit 700, Jena, Germany). For analysis of anions (F−, Cl−, NO3−, NO2−, SO42−, HCO3−, and CO32−), the samples were loaded into an ion chromatography (IC) system (model Dionex ICS-2500, Sunnyvale, United States). Then, total alkalinity was determined from the samples to also measure HCO3− and CO32− due to the limitation of AAS.
Results and Discussion
On-Site Parameter Measurements
The results of the on-site parameter measurements indicated that the pH of the groundwater samples ranged from 7.10 to 8.40, with an average of 7.77, indicating normal to mildly alkaline conditions (Supplementary Table S2). The temperature of the groundwater samples was between 27 and 30.8°C. However, the temperature of some groundwater samples could not be measured because the samples were not collected directly from the wells. Dissolved oxygen (DO) varied in the range of 4.7–7.1 mg/l. The high amount of oxygen in the samples can be explained by the diffusion of oxygen from the atmosphere due to the shallow water level of the groundwater wells (Rose and Long, 1988). It is interesting that high DO was found although W11 was a deep well; this might imply that the groundwater in this well was oxygenated by the effect of groundwater pumping (Bonte et al., 2017). Electrical conductivity (EC) ranged from 356 to 4,850 µS, and the total dissolved solids (TDS) ranged from 268 to 2,430 mg/l. Fluctuation of the oxidation–reduction potential (ORP) was also found in this study, indicating that both oxidizing and reducing environments occur in the groundwater environments.
Groundwater Analysis
The result of the cation and anion groundwater analysis displayed that Cl− and F− were in the range of 1.00–2,105.70 mg/l and 1.97–20.58 mg/l, respectively. Interestingly, NO3− concentrations were relatively high in W3, W5, W6, and W10, ranging from 22.29 to 96.01 mg/l, as shown in Figure 2; however, NO3− concentration groundwater detected in all samples was lower than the drinking water standard (50 mg/l). High NO3− concentrations were mainly found in an agricultural area in the western part of Song Phi Nong District, which is one of the possible sources of NO3−. Moreover, Ca2+, Mg2+, and Na+ of these groundwater samples ranged from 3.50 to 204.40 mg/l, 1.50–102.00 mg/l, and 4.50–477.00 mg/l, respectively. SO42− and NO2− could not be detected in some of the samples due to their low concentrations.
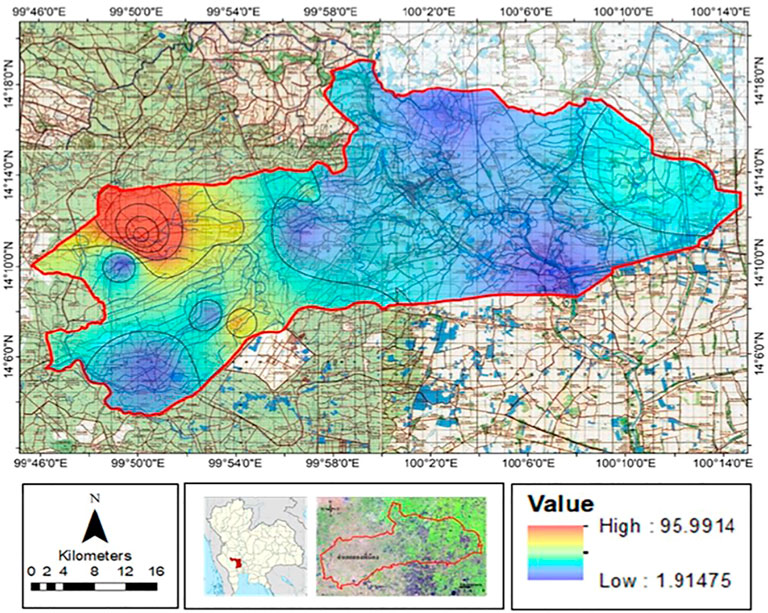
FIGURE 2. Nitrate distribution in groundwater of the study area.
In addition, the result of the cation and anion measurements is normally used to define the water type by the Piper diagram (Zhang et al., 2015), as indicated in Figure 3. This diagram graphically displays the relative proportions of major cations and anions to facilitate the identification of geochemical facies. Six types of water were found in this experiment, including Ca–Cl, Ca–Na–Cl, Ca–HCO3–Cl, Na–Cl, Na–HCO3–Cl, and Ca–Na–HCO3, as shown in Supplementary Table S3. It can be concluded that different types of water arose from different sources, and some of the groundwater samples had Cl as a dominant constituent, indicating that groundwater in some areas was affected by human activities, especially fertilizer application and wastewater discharge (Ogrinc et al., 2019).
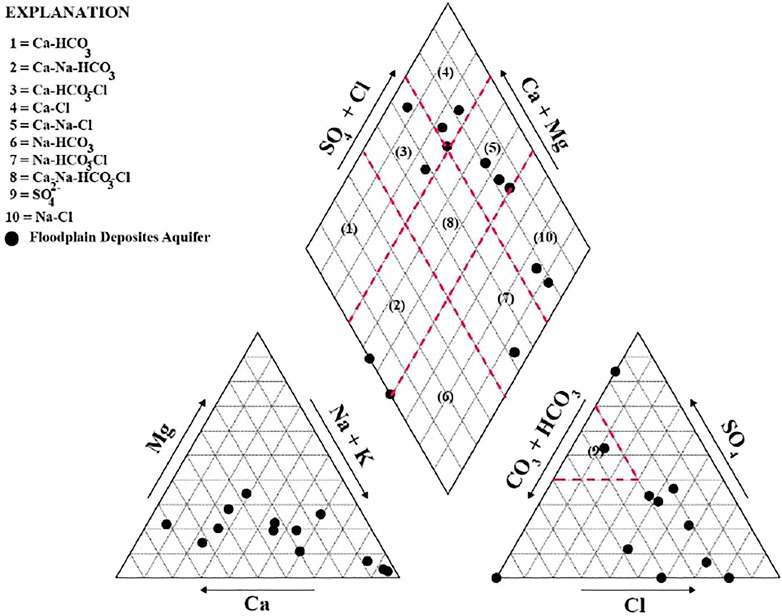
FIGURE 3. Piper diagram indicating water types of groundwater samples.
The isotopic ratios of the water samples indicated that the δ18O and δ2H of the samples ranged from −7.75‰ to −3.44‰ and from −53.66‰ to −25.63‰, respectively. The relationship between δ18O and δ2H is illustrated in Figure 4 as an evaporation trend (orange line) and has the linear equation of δ18O = 4.23776 δ2H—17.392. The slope of the line is different from one area to another depending on the local climate (Zhang et al., 2013). The relationship was compared to the Bangkok Local Meteoric Water Line (BKK LMWL) because Suphan Buri Province has almost the same elevation and distance from the sea as Bangkok. According to Figure 4, the evaporation trend was almost the same as the BKK LMWL, showing that the groundwater table was shallow and that most of the waters were contaminated by human activities on the ground surface, particularly fertilizer application. This occurred because the land had been used mainly for sugarcane fields for a long period of time. The result also indicated that surface water and groundwater are connected. In contrast, W12 was far from the BKK LMWL, indicating that the groundwater level was deeper than those of other wells. The ORP of W12 revealed a reducing condition, indicating that the water comes from a deep confined aquifer. As shown by the map, the NO3− in W12 may not be from fertilizer application due to the deep groundwater level. These results can be implied that groundwater resources in this study area can be contaminated by atrazine as the area is used for agriculture. Moreover, the δ15NAir and δ18OVSMOW in the study area varied from 3.51 to 28.42‰ and −3.92 to 19.79‰, respectively, as illustrated in Supplementary Table S4. The values of δ15NAir and δ18OVSMOW at W12 and W4 were mostly higher than those at the other sampling points.
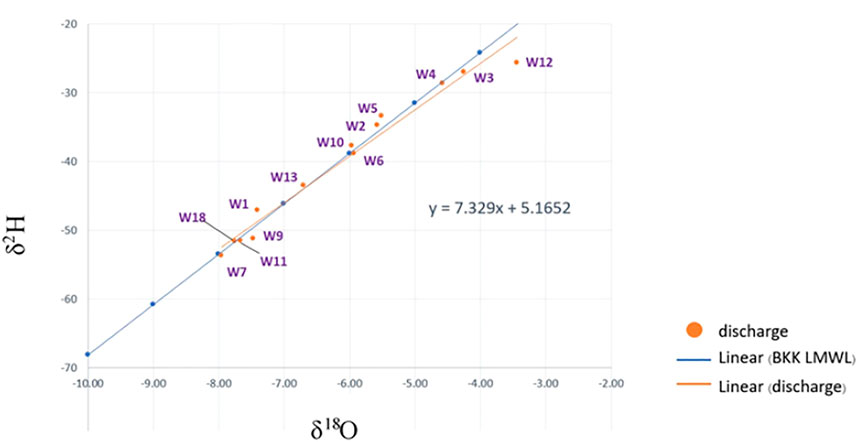
FIGURE 4. δ2H and δ18O of groundwater in the study area compared with the Bangkok Local Meteoric Water Line (BKK LMWL).
According to the result of the nitrogen isotope analysis shown in Figure 5, groundwater in the study area was affected by three sources, including domestic wastewater, farming, and fertilizer. However, it was found that most of the areas were urban zones, indicating that the NO3− in groundwater was from sewage manure or domestic wastewater (Matiatos, 2016). Furthermore, the majority of the groundwater samples in the study area belong to the Ca–Na–Cl and Ca–Cl types, demonstrating that Cl− is a dominant ion in the contaminated water. As mentioned, the NO3− and Cl− detected in the area were mainly derived from anthropogenic activities.
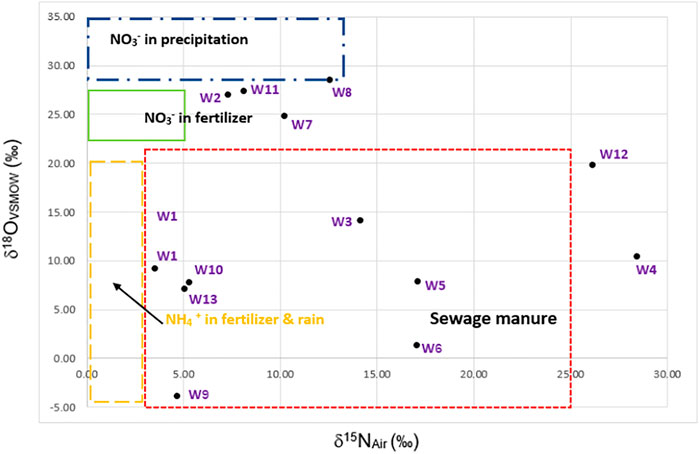
FIGURE 5. Plot of δ15NAir and δ18OVSMOW for groundwater samples from the study area.
Physico-Chemical Properties of Soils
The properties of each soil sample collected in a sugarcane field in this study area (i.e., pH, organic matter (OM), bulk density, hydraulic conductivity, and soil texture) are listed in Table 2 According to the table, the pH values of the samples ranged from 6.80 to 7.90, indicating mildly alkaline conditions. The result was nearly the same as the pH of the groundwater samples collected in this area because of sediments from the weathered limestone and the use of an alkaline pesticide in the sugarcane field. Based on soil texture, there are four different soil types (e.g., clay, clay loam, sandy clay loam, and loam). The OM of the soil samples was in the range of 1.07–2.62%. Only two samples (S5 and S6) indicated OM values higher than 2%. The bulk density of the soil samples ranged from 1.51 to 1.70 g/cm3. Hydraulic conductivity values were in the range of 0.003–0.103 m/d, corresponding to the soil textures. The hydraulic conductivity of all soil samples was not higher than 0.01 m/d, except for S2 and S3, which had values of 0.016 and 0.103 m/d, respectively. In addition, due to an error in soil sample collection, some unreasonable values were obtained from the experiment for estimating hydraulic conductivity; thus, the Neural Network Prediction (NNP) option available in HYDRUS-1D was applied by assigning the values of bulk density as well as the sand, silt, and clay percentages measured from the samples. According to the result, the hydraulic conductivity values of S4, S7, and S8 were defined by HYDRUS-1D. As a result, it can be concluded that most of this area has low water holding capacity, as inferred from soil texture.
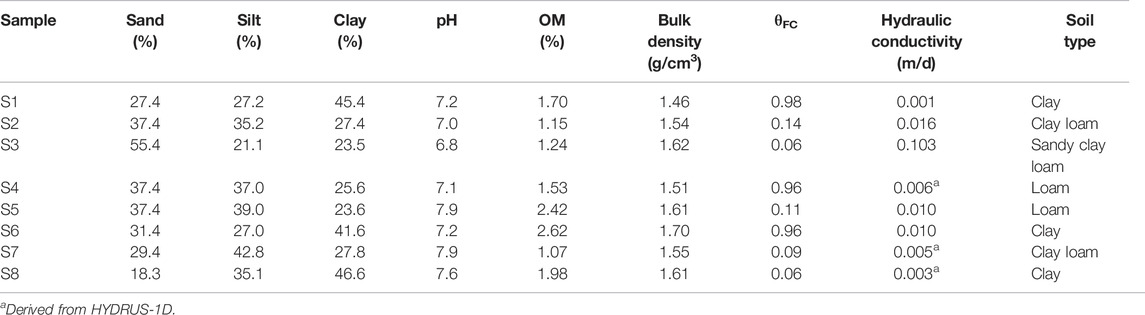
TABLE 2. Physico-chemical properties of eight soil samples collected from the sugarcane field.
A batch adsorption experiment was also used to assess the adsorption coefficients of soil samples collected in the study area. The results of the experiment are presented in Figure 6. According to the results, most of the samples can be fitted with the Freundlich isotherm, indicating that adsorption may occur with heterogeneous active site energy distribution on the soil surface. Therefore, the Freundlich constant (Kf) was suitable for determining Koc. Kf was used as Kd, as in the following equation (Martins et al., 2018):
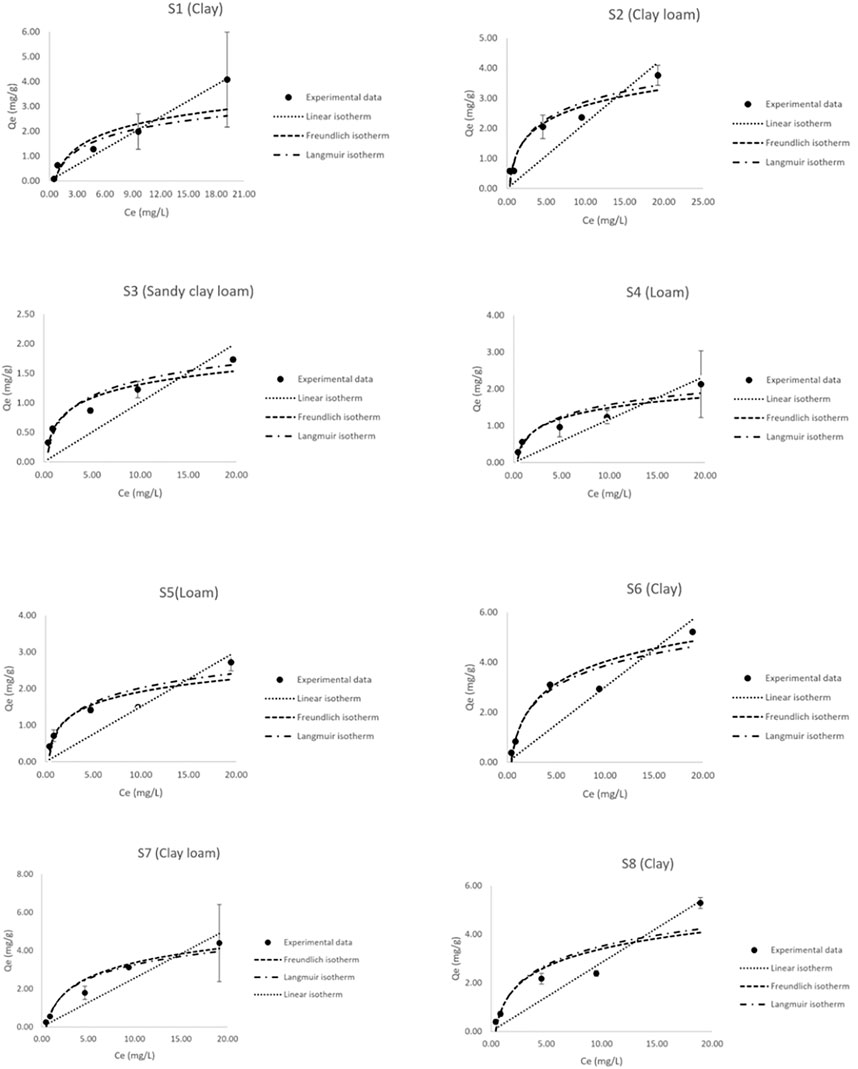
FIGURE 6. The experimental data of the soil samples plotted with different fitted sorption isotherms.
Sample S6 was identified as the sample with the highest adsorption capacity (Kd = 0.301 l/kg, Kf = 0.822 m3/kg, and QM = 6.575 mg/g) because it also had the highest %OM (2.62%), which is considered to be an important factor influencing the adsorption capacity of the soil. Previous studies have also found that OM was a significant factor in the adsorption of atrazine in soil (Yue et al., 2013; Jing et al., 2020; Yu et al., 2020).
According to the result of the soil analysis, the measured properties displayed that clay content and OM affected the adsorption coefficient (Kd or Kf). A previous study also reported soil OM content played an important role in atrazine adsorption in soil and sediment (Yue et al., 2013; Yue et al., 2017). Moreover, the adsorption isotherms for atrazine of the soils in the study area were described by the Freundlich isotherm with a regression coefficient (R2) between 0.964 and 0.997 as well as a chi-square between 0.066 and 0.696. The linear, Freundlich, and Langmuir constants, representing the adsorption properties of the soils, are presented in Table 3.
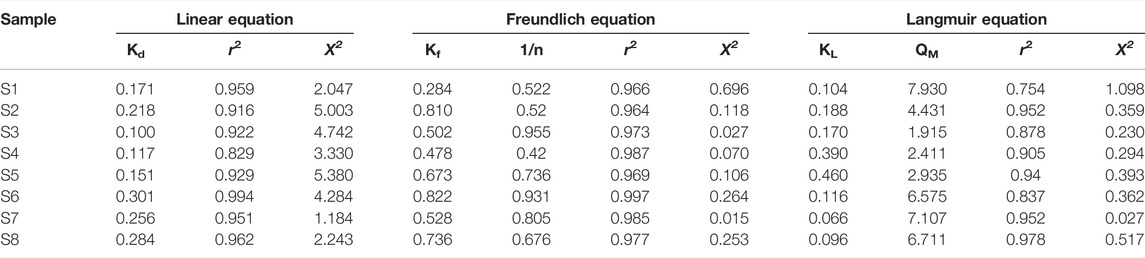
TABLE 3. Parameters of the linear, Freundlich, and Langmuir equation for the sorption of atrazine into soil in the study area.
Previous studies also reported the adsorption capacity of atrazine in a different isotherm, as illustrated in Table 4. The Kd from other research was in the range of 0.51–4.00 l/kg, whereas the Kd measured in this study ranged from 0.100 to 0.301 l/kg, which is lower than those of the other studies. It can be concluded that the soil samples in this study contained less clay content or lower OM. Additionally, the Kf values derived from previous studies were from 0.60 to 3.90 l/kg, while the Kf measured in this study was partly within the range of the values from other research, with values of 0.284–0.822 l/kg.
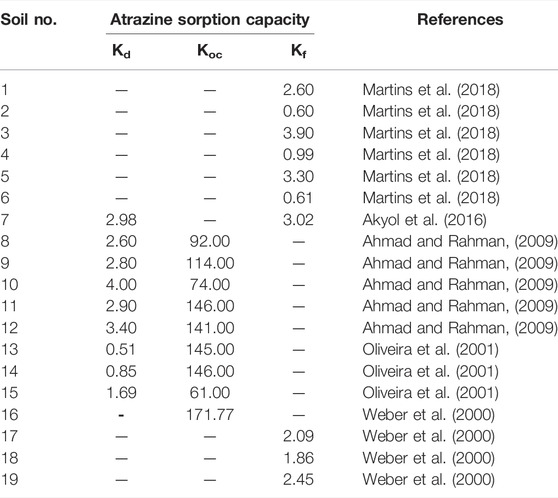
TABLE 4. Sorption capacity of atrazine from previous studies.
Attenuation/Retardation Factor Model and Groundwater Ubiquity Score Index
In this study, the leaching risk of atrazine was derived from the AF/RF model. The leaching potential of atrazine was classified into five classes: very unlikely (0–0.00001), unlikely (0.00001–0.01), likely (0.01–0.1), moderately likely (0.1–0.25), and very likely (0.25–1) (Khan and Liang, 1989); for large field-scale evaluation, the results are best presented in the form of a map. As illustrated in Figure 7, the leaching potential of atrazine is high in most of the agricultural areas in the western part of the study area due to the low adsorption capacity of the soil (Koc). This study only focused on agricultural areas which are mostly located in the western part of the area, while soil samples were not densely collected from the urban eastern area. The adsorption capacity in this area was in the range of 0.017–0.121 m3/kg; it was found that different leaching potentials dependent on the soil properties. Soil with low clay content showed low water holding capacity and high hydraulic conductivity (Li et al., 2018). It should be noted that most of the soils with low water holding capacity and low OM appeared to have a high risk for atrazine leaching.
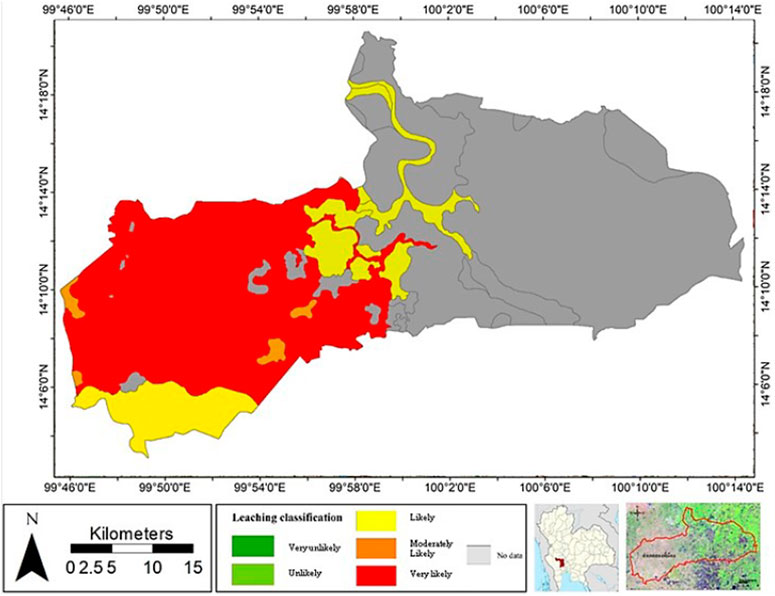
FIGURE 7. Leaching potential map for atrazine in the study area.
To evaluate the performance of the model, the result of the model was compared with the NO3− concentration detected in the groundwater. Interestingly, Department of Groundwater Resource (2009) detected only a low concentration of atrazine (lower than the detection limit) in groundwater samples collected within the study area as atrazine was strongly adsorbed by soil. It has been reported from studies in several regions that NO3− can be an indicator for pesticide and herbicide leaching to the groundwater table (Kross and Hallberg, 1990; Hallberg, 1997; Vonberg et al., 2014); most of the areas with high leaching potential was also contaminated with high NO3− concentration compared to the area with lower leaching risk. However, the area with high leaching risk might be affected by other factors which were not considered in this model, such as the aquifer horizontal hydraulic conductivity, microbial degradation rate, volatilization, crop-root uptake, and dose of pesticide usage. Furthermore, the GUS score can also be used to evaluate leaching potential. According to Table 5, the GUS scores in this study area were in the range of 3.68–4.83; as a result, the agricultural area could be described as the leachable area because GUS scores there were higher than 2.8.

TABLE 5. GUS scores of each soil sample collected in agricultural areas.
Additionally, the soil with high clay content expressed a high adsorption coefficient; in contrast, loam and sandy clay loam soils were found to have low adsorption coefficients due to the low clay contents found in such soil samples. Khan (2016) also reported a positive correlation between the adsorption coefficient and clay content. It was also reported that using partial rank correlation coefficient analysis (PRCC) based on foc was the most effective leaching potential analysis (D'Alessio et al., 2018). The leaching evaluation map of this study provides an overview for estimating pollution potential; generally, the AF index is used to identify areas with a high potential of groundwater contamination from chemicals. From the result of this evaluation, the area of a high AF index should be monitored first when establishing a groundwater monitoring system. Moreover, the GUS index estimated in this study confirmed that soil in the area had high atrazine leaching potential, meaning that atrazine can leach to the groundwater table as NO3−, the pesticide and herbicide indicator, was detected in the subsurface water resource.
Yue et al. (2013) also reported that atrazine in the range of 1.9–54.9 μg/kg was absorbed by soil residue in China. A previous study also reported atrazine concentration in groundwater in an area near the selected area of this study (Thapinta and Hudak, 2003); atrazine concentration was detected in 13 of 90 wells, with the highest concentration in the vicinity of 1.89 ppb. Interestingly, although soil in this area was described as having a high leaching risk as a result of this study, the Department of Groundwater Resources (2009) found atrazine with a low concentration because other factors affecting leaching potential, such as horizontal hydraulic conductivity and specific half-life of each soil sample, was not used for estimating the AF value. Furthermore, it was reported that atrazine with an average concentration of 0.133 mg/kg in topsoil and 0.183 mg/kg in subsoil was detected in soil with a pH of 5 in the Huay Kapo Watershed, Nam Nao District, Phetchabun Province, Thailand (Phewnil et al., 2010). It can be concluded that topsoil had higher hydraulic conductivity, leading to higher atrazine concentration in groundwater as NO3− was a presence with higher concentration. Moreover, as atrazine is slightly alkaline, the lower pH of the soil, the higher the adsorption of atrazine in the soil (Jing et al., 2020). At soil pH of below 7, known as an acidic condition, atrazine may pick up hydrogen ions from the soil solution providing a positive charge to the atrazine molecule increasing the attraction between atrazine molecule and negatively charged soil colloids.
Conclusion
In this study, soil and groundwater were collected to evaluate atrazine leaching potential by using NO3− as an indicator in groundwater. The properties of both soil and groundwater were also identified. It was found that most of the agricultural area, especially the sugarcane field, had high leaching potential and GUS (Groundwater Ubiquity Score) within the range of 3.68–4.83 as a result of the evaluation by the AF/RF (Attenuation factor/Retardation factor) model and GUS model, respectively, due to the low adsorption capacity and water holding capacity of the soil. The adsorption capacity in this area was in the range of 0.017–0.121 m3/kg; moreover, most of the samples could be fitted with the Freundlich isotherm. For groundwater samples, NO3− was relatively high in W3, W5, W6, and W10, ranging from 22.29 to 96.01 mg/l. All groundwater samples had a lower NO3− concentration than the standard limit, which is 50 mg/l for drinking water. Based on the nitrogen isotope analysis, sources of NO3− include both human activities and natural sources. A high NO3− concentration was found in the western part of Song Phi Nong District, which is used mostly for agricultural fields.
NO3− has been reported to be an indicator of pesticide and herbicide leaching, which is useful for evaluating the performance of the model. As a result of this evaluation, most of the area with high leaching potential was determined to be partly contaminated by high NO3− concentration. However, some factors (e.g., aquifer horizontal hydraulic conductivity, microbial degradation rate, volatilization, crop-root uptake, and dose of pesticide usage) (Pérez-Lucas et al., 2019; Navarro et al., 2021), which can cause high leaching potential in the area, were not considered in the model, causing low nitrate concentration detection. The isotopic ratio was also measured in this study to identify sources of NO3−. It was found that most of the nitrate in the groundwater samples was from human activities, especially from domestic wastewater. This evaluation can facilitate risk management, groundwater resource planning, and protection from health risks related to pesticide-contaminated groundwater.
Data Availability Statement
The original contributions presented in the study are included in the article/Supplementary Material; further inquiries can be directed to the corresponding author.
Author Contributions
Conceptualization, methodology, validation, and data curation: SR and SC; software, formal analysis, investigation, writing—original draft preparation, and visualization: SR and PC; and resources, writing—review and editing, supervision, project administration, and funding acquisition: SC. All authors have read and agreed to the published version of the manuscript.
Funding
The Grant for International Research Integration: Chula Research Scholar, Ratchadaphiseksomphot Endowment Fund (GCURS-59-06-79-01), the Ratchadaphisek Sompoch Endowment Fund (2019), Chulalongkorn University (762003-CC), and the Ratchadaphiseksomphot Endowment Fund, Chulalongkorn University, funded the research unit.
Conflict of Interest
The authors declare that they have no known competing financial interests or personal relationships that could have appeared to influence the work reported in this paper.
Publisher’s Note
All claims expressed in this article are solely those of the authors and do not necessarily represent those of their affiliated organizations, or those of the publisher, the editors, and the reviewers. Any product that may be evaluated in this article, or claim that may be made by its manufacturer, is not guaranteed or endorsed by the publisher.
Acknowledgments
The authors thankfully acknowledge the International Postgraduate Programs in Environmental Management, Graduate School, Chulalongkorn University, National Research Council of Thailand (NRCT): NRCT5-RSA63001-06, the Thailand Science research, and Innovation Fund, Chulalongkorn University, (CUFRB65_dis(2)_090_23_20) and Ratchadaphisek Sompoch Endowment Fund (2021), Chulalongkorn University (764002-ENV), for their invaluable support. Also, they gratefully acknowledge the Department of Geology for their invaluable support in terms of facilities and scientific equipment.
Supplementary Material
The Supplementary Material for this article can be found online at: https://www.frontiersin.org/articles/10.3389/feart.2022.855599/full#supplementary-material
References
Ahmad, R., and Rahman, A. (2009). Sorption Characteristics of Atrazine and Imazethapyr in Soils of New Zealand: Importance of Independently Determined Sorption Data. J. Agric. food Chem. 57 (22), 10866–10875. doi:10.1021/jf901365j
Akyol, N. H., Özbay, İ., Akyol, G., and Özbay, B. (2016). Sorption-desorption Behavior of Atrazine for Calcareous Soil from Antalya, Turkey. WSEAS Trans. Environ. Dev. 12, 332–336.
Ali, A., Bennett, J. M., Biggs, A. A. J., Marchuk, A., and Ghahramani, A. (2021). Assessing the Hydraulic Reduction Performance of HYDRUS-1D for Application of Alkaline Irrigation in Variably-Saturated Soils: Validation of pH Driven Hydraulic Reduction Scaling Factors. Agric. Water Manag. 256, 107101. doi:10.1016/j.agwat.2021.107101
Almberg, K., Turyk, M., Jones, R., Rankin, K., Freels, S., and Stayner, L. (2018). Atrazine Contamination of Drinking Water and Adverse Birth Outcomes in Community Water Systems with Elevated Atrazine in Ohio, 2006-2008. Ijerph 15 (9), 1889. doi:10.3390/ijerph15091889
Augustin, C., and Cihacek, L. J. (2016). Relationships between Soil Carbon and Soil Texture in the Northern Great Plains. Soil Sci. 181 (8), 386–392. doi:10.1097/ss.0000000000000173
Bonte, M., Wols, B., Maas, K., and Stuyfzand, P. (2017). Sources of Dissolved Oxygen in Monitoring and Pumping Wells. Hydrogeol. J. 25 (1), 55–66. doi:10.1007/s10040-016-1477-9
Chefetz, B., Bilkis, Y. I., and Polubesova, T. (2004). Sorption-desorption Behavior of Triazine and Phenylurea Herbicides in Kishon River Sediments. Water Res. 38 (20), 4383–4394. doi:10.1016/j.watres.2004.08.023
Chevrier, C., Limon, G., Monfort, C., Rouget, F., Garlantézec, R., Petit, C., et al. (2011). Urinary Biomarkers of Prenatal Atrazine Exposure and Adverse Birth Outcomes in the PELAGIE Birth Cohort. Environ. Health Perspect. 119 (7), 1034–1041. doi:10.1289/ehp.1002775
Chorom, M., Sharifi, H., and Motamedi, H. (2010). Bioremediation of a Crude Oil-Polluted Soil by Application of Fertilizers. Iran. J. Environ. HEALTH Sci. Eng. (IJEHSE) 7, 319–326.
Copaja, S. V., and Gatica-Jeria, P. (2021). Effects of Clay Content in Soil on Pesticides Sorption Process. J. Chil. Chem. Soc. 66 (1), 5086–5092. doi:10.4067/s0717-97072021000105086
D'Alessio, M., Wang, T., Swift, C. E., Shanmungam, M. S., and Ray, C. (2018). A Tier-I Leaching Risk Assessment of Three Anticoagulant Compounds in the Forested Areas of Hawai'i. Sci. total Environ. 630, 889–902. doi:10.1016/j.scitotenv.2018.02.257
Dalton, R. L., Pick, F. R., Boutin, C., and Saleem, A. (2014). Atrazine Contamination at the Watershed Scale and Environmental Factors Affecting Sampling Rates of the Polar Organic Chemical Integrative Sampler (POCIS). Environ. Pollut. 189, 134–142. doi:10.1016/j.envpol.2014.02.028
De Paz, J. M., and Rubio, J. L. (2006). Application of a GIS-AF/RF Model to Assess the Risk of Herbicide Leaching in a Citrus-Growing Area of the Valencia Community, Spain. Sci. Total Environ. 371 (1-3), 44–54. doi:10.1016/j.scitotenv.2006.07.018
Department of Groundwater Resource (2009). The Assessment of Agricultural Pollutants in Groundwater and Guildline Design for Groundwater Remediation in Kanchanaburi and Suphanburi Provinces Project Bangkok. Thailand.
Exner, M. E., Perea-Estrada, H., and Spalding, R. F. (2010). Long-term Response of Groundwater Nitrate Concentrations to Management Regulations in Nebraska's Central Platte Valley. Sci. World J. 10, 286–297. doi:10.1100/tsw.2010.25
Fan, T.-T., Wang, Y.-J., Li, C.-B., He, J.-Z., Gao, J., Zhou, D.-M., et al. (2016). Effect of Organic Matter on Sorption of Zn on Soil: Elucidation by Wien Effect Measurements and EXAFS Spectroscopy. Environ. Sci. Technol. 50 (6), 2931–2937. doi:10.1021/acs.est.5b05281
Freundlich, H. (1907). Über die Adsorption in Lösungen. Z. für Phys. Chem. 57U (1), 385–470. doi:10.1515/zpch-1907-5723
Gosselin, D. C., Headrick, J., Tremblay, R., Chen, X.-H., and Summerside, S. (1997). Domestic Well Water Quality in Rural Nebraska: Focus on Nitrate-Nitrogen, Pesticides, and Coliform Bacteria. Groundw. Monit. Remediat. 17 (2), 77–87. doi:10.1111/j.1745-6592.1997.tb01280.x
Gustafson, D. (1989). Groundwater Ubiquity Score: a Simple Method for Assessing Pesticide Leachability. Environ. Toxicol. Chem. 8 (4), 339–357. doi:10.1002/etc.5620080411
Hall, K. E., Ray, C., Ki, S. J., Spokas, K. A., and Koskinen, W. C. (2015). Pesticide Sorption and Leaching Potential on Three Hawaiian Soils. J. Environ. Manag. 159, 227–234. doi:10.1016/j.jenvman.2015.04.046
Hallberg, G. (1997). Pesticides in Ground Water; Distribution, Trends, and Governing Factors. J. Ground Water 35 (5), 920–922.
Ho, Y.-S., and Ofomaja, A. E. (2006). Pseudo-second-order Model for Lead Ion Sorption from Aqueous Solutions onto Palm Kernel Fiber. J. Hazard. Mater. 129 (1-3), 137–142. doi:10.1016/j.jhazmat.2005.08.020
Jing, S., Lan, M. X., Wen, W., Jing, Z., Hao, Z., and Jun, W. Y. (2020). Adsorption Characteristics of Atrazine on Different Soils in the Presence of Cd (II). Adsorpt. Sci. Technol. 38 (7-8), 225–239. doi:10.1177/0263617420928845
Juntakut, P. (2018). Occurrence of Nitrate in the Nebraska's Groundwater System: Identifying Factors, Examining the Best Management Practices, and Analyzing Costs.
Khan, M. A., and Liang, T. (1989). Mapping Pesticide Contamination Potential. Environ. Manag. 13 (2), 233–242. doi:10.1007/bf01868370
Ki, S. J., and Ray, C. (2015). A GIS-Assisted Regional Screening Tool to Evaluate the Leaching Potential of Volatile and Non-volatile Pesticides. J. Hydrology 522, 163–173. doi:10.1016/j.jhydrol.2014.12.024
Ki, S. J., Ray, C., and Hantush, M. M. (2015). Applying a Statewide Geospatial Leaching Tool for Assessing Soil Vulnerability Ratings for Agrochemicals across the Contiguous United States. Water Res. 77, 107–118. doi:10.1016/j.watres.2015.03.009
Kodešová, R., Kočárek, M., Kodeš, V., Drábek, O., Kozák, J., and Hejtmánková, K. (2011). Pesticide Adsorption in Relation to Soil Properties and Soil Type Distribution in Regional Scale. J. Hazard. Mater. 186 (1), 540–550.
Kross, B., and Hallberg, G. R. (1990). The Iowa State-wide Rural Well-Water Survey Water-Quality Data: Initial Analysis.
Kruawal, K., Sacher, F., Werner, A., Müller, J., and Knepper, T. P. (2005). Chemical Water Quality in Thailand and its Impacts on the Drinking Water Production in Thailand. Sci. Total Environ. 340 (1-3), 57–70. doi:10.1016/j.scitotenv.2004.08.008
Ladu, J. L. C., and Zhang, D.-r. (2011). Modeling Atrazine Transport in Soil Columns with HYDRUS-1D. Water Sci. Eng. 4 (3), 258–269.
Langmuir, I. (1918). The Adsorption of Gases on Plane Surfaces of Glass, Mica and Platinum. J. Am. Chem. Soc. 40 (9), 1361–1403. doi:10.1021/ja02242a004
Lasserre, J.-P., Fack, F., Revets, D., Planchon, S., Renaut, J., Hoffmann, L., et al. (2009). Effects of the Endocrine Disruptors Atrazine and PCB 153 on the Protein Expression of MCF-7 Human Cells. J. Proteome Res. 8 (12), 5485–5496. doi:10.1021/pr900480f
Li, S., Zhang, Y., Yan, W., and Shangguan, Z. (2018). Effect of Biochar Application Method on Nitrogen Leaching and Hydraulic Conductivity in a Silty Clay Soil. Soil Tillage Res. 183, 100–108. doi:10.1016/j.still.2018.06.006
Li, Z. C., Yost, R. S., and Green, R. E. (1998). Incorporating Uncertainty in a Chemical Leaching Assessment. J. Contam. hydrology 29 (4), 285–299. doi:10.1016/s0169-7722(97)00021-1
Martins, E. C., de Freitas Melo, V., Bohone, J. B., and Abate, G. (2018). Sorption and Desorption of Atrazine on Soils: The Effect of Different Soil Fractions. Geoderma 322, 131–139. doi:10.1016/j.geoderma.2018.02.028
Matiatos, I. (2016). Nitrate Source Identification in Groundwater of Multiple Land-Use Areas by Combining Isotopes and Multivariate Statistical Analysis: A Case Study of Asopos Basin (Central Greece). Sci. Total Environ. 541, 802–814. doi:10.1016/j.scitotenv.2015.09.134
Morais, P. A. d. O., Souza, D. M. d., Carvalho, M. T. d. M., Madari, B. E., and de Oliveira, A. E. (2019). Predicting Soil Texture Using Image Analysis. Microchem. J. 146, 455–463. doi:10.1016/j.microc.2019.01.009
Mylavarapu, R. (2014). Walkley-Black Method. Soil Test Methods from the Southeastern United States: 158.
Navarro, L., Camacho, R., López, J. E., and Saldarriaga, J. F. (2021). Assessment of the Potential Risk of Leaching Pesticides in Agricultural Soils: Study Case Tibasosa, Boyacá, Colombia. Heliyon 7 (11), e08301. doi:10.1016/j.heliyon.2021.e08301
Ogrinc, N., Tamše, S., Zavadlav, S., Vrzel, J., and Jin, L. (2019). Evaluation of Geochemical Processes and Nitrate Pollution Sources at the Ljubljansko Polje Aquifer (Slovenia): A Stable Isotope Perspective. Sci. total Environ. 646, 1588–1600. doi:10.1016/j.scitotenv.2018.07.245
Oliveira, R. S., Koskinen, W. C., and Ferreira, F. A. (2001). Sorption and Leaching Potential of Herbicides on Brazilian Soils. Weed Res. 41 (2), 97–110. doi:10.1046/j.1365-3180.2001.00219.x
Panuwet, P., Siriwong, W., Prapamontol, T., Ryan, P. B., Fiedler, N., Robson, M. G., et al. (2012). Agricultural Pesticide Management in Thailand: Status and Population Health Risk. Environ. Sci. Policy 17, 72–81. doi:10.1016/j.envsci.2011.12.005
Pérez-Lucas, G., Vela, N., El Aatik, A., and Navarro, S. (2019). Environmental Risk of Groundwater Pollution by Pesticide Leaching through the Soil Profile. Pesticides-Use and Misuse and Their Impact in the Environment, 1–28.
Phewnil, O., Panichsakpatana, S., Tungkananuruk, N., and Pitiyont, B. (2010). Atrazine Transport from the Maize (Zea mays L.) Cultivated Upland Soil in Huay Kapo Watershed, Nam Nao District, Phetchabun Province, Thailand. Thai J. Agric. Sci. 43 (3), 119–127.
Putthividhya, A., and Pipitsombat, R. (2015). GIS-based and Laboratory-Scaled Leaching Assessment of Agricultural Contamination in Heavily Cultivated Area of Thailand. Environ. Earth Sci. 73 (8), 3975–3986. doi:10.1007/s12665-014-3683-x
Rao, P., Hornsby, A., and Jesup, R. (1985). in Proceedings Soil and Crop Science Society of Florida.Indices for Ranking the Potential for Pesticide Contamination of Groundwater
Rohr, J. R. (2018). Atrazine and Amphibians: A Story of Profits, Controversy, and Animus. Encycl. Anthropocene 5, 141–148. doi:10.1016/b978-0-12-809665-9.09885-2
Rose, S., and Long, A. (1988). Monitoring Dissolved Oxygen in Ground Water: Some Basic Considerations. Ground Water Monit. Rev. 8 (1), 93–97. doi:10.1111/j.1745-6592.1988.tb00981.x
Sahu, M. K., Mandal, S., Yadav, L. S., Dash, S. S., and Patel, R. K. (2016). Equilibrium and Kinetic Studies of Cd(II) Ion Adsorption from Aqueous Solution by Activated Red Mud. Desalination Water Treat. 57 (30), 14251–14265. doi:10.1080/19443994.2015.1062428
Saravanan, S., Ramamurthy, P. C., and Madras, G. (2015). Effects of Temperature and Clay Content on Water Absorption Characteristics of Modified MMT Clay/cyclic Olefin Copolymer Nanocomposite Films: Permeability, Dynamic Mechanical Properties and the Encapsulated Organic Device Performance. Compos. Part B Eng. 73, 1–9. doi:10.1016/j.compositesb.2014.12.030
Schreglmann, K., Hoeche, M., Steinbeiss, S., Reinnicke, S., and Elsner, M. (2013). Carbon and Nitrogen Isotope Analysis of Atrazine and Desethylatrazine at Sub-microgram Per Liter Concentrations in Groundwater. Anal. Bioanal. Chem. 405 (9), 2857–2867. doi:10.1007/s00216-012-6616-0
Schwarzenbach, R., Gschwend, P., and Imboden, D. (1993). Environmental Organic Chemistry Wiley. Hoboken.
Sigman, D. M., Casciotti, K. L., Andreani, M., Barford, C., Galanter, M., and Böhlke, J. K. (2001). A Bacterial Method for the Nitrogen Isotopic Analysis of Nitrate in Seawater and Freshwater. Anal. Chem. 73 (17), 4145–4153. doi:10.1021/ac010088e
Šimunek, J., Van Genuchten, M. T., and Šejna, M. (2012). HYDRUS: Model Use, Calibration, and Validation. Trans. ASABE 55 (4), 1263–1274.
Solomon, K. R., Dalhoff, K., Volz, D., and Van Der Kraak, G. (2013). “Effects of Herbicides on Fish,” in Fish Physiology. Elsevier, 369–409. doi:10.1016/b978-0-12-398254-4.00007-8
Spalding, R. F., Exner, M. E., Snow, D. D., Cassada, D. A., Burbach, M. E., and Monson, S. J. (2003). Herbicides in Ground Water beneath Nebraska's Management Systems Evaluation Area. J. Environ. Qual. 32 (1), 92–99. doi:10.2134/jeq2003.9200
Stayner, L. T., Almberg, K., Jones, R., Graber, J., Pedersen, M., and Turyk, M. (2017). Atrazine and Nitrate in Drinking Water and the Risk of Preterm Delivery and Low Birth Weight in Four Midwestern States. Environ. Res. 152, 294–303. doi:10.1016/j.envres.2016.10.022
Thapinta, A., and Hudak, P. F. (2003). Use of Geographic Information Systems for Assessing Groundwater Pollution Potential by Pesticides in Central Thailand. Environ. Int. 29 (1), 87–93. doi:10.1016/s0160-4120(02)00149-6
Toccalino, P. L., Norman, J. E., and Scott, J. C. (2012). Chemical Mixtures in Untreated Water from Public-Supply Wells in the U.S. - Occurrence, Composition, and Potential Toxicity. Sci. Total Environ. 431, 262–270. doi:10.1016/j.scitotenv.2012.05.044
Tsai, W.-T. (2013). A Review on Environmental Exposure and Health Risks of Herbicide Paraquat. Toxicol. Environ. Chem. 95 (2), 197–206. doi:10.1080/02772248.2012.761999
Vieira, L. A. J., Alves, R. D. F. B., Menezes-Silva, P. E., Mendonça, M. A. C., Silva, M. L. F., Silva, M. C. A. P., et al. (2021). Water Contamination with Atrazine: Is Nitric Oxide Able to Improve Pistia stratiotes Phytoremediation Capacity? Environ. Pollut. 272, 115971. doi:10.1016/j.envpol.2020.115971
Vonberg, D., Vanderborght, J., Cremer, N., Pütz, T., Herbst, M., and Vereecken, H. (2014). 20 Years of Long-Term Atrazine Monitoring in a Shallow Aquifer in Western Germany. Water Res. 50, 294–306. doi:10.1016/j.watres.2013.10.032
Weber, J. B., Wilkerson, G. G., Michael Linker, H., Wilcut, J. W., Leidy, R. B., Senseman, S., et al. (2000). A Proposal to Standardize Soil/solution Herbicide Distribution Coefficients. Weed Sci. 48 (1), 75–88. doi:10.1614/0043-1745(2000)048[0075:aptsss]2.0.co;2
Wisittammasri, W., and Chotpantarat, S. (2016). Isotope Evidence of Rainfall and Groundwater for Tracing Recharge Areas in Kaeng Khoi District, Saraburi Province, Thailand. App. Envi. Res. 38 (3), 49–58. doi:10.35762/aer.2016.38.3.5
Yang, X., Chen, X., and Yang, X. (2019). Effect of Organic Matter on Phosphorus Adsorption and Desorption in a Black Soil from Northeast China. Soil Tillage Res. 187, 85–91. doi:10.1016/j.still.2018.11.016
Yao, Y., Gao, B., Zhang, M., Inyang, M., and Zimmerman, A. R. (2012). Effect of Biochar Amendment on Sorption and Leaching of Nitrate, Ammonium, and Phosphate in a Sandy Soil. Chemosphere 89 (11), 1467–1471. doi:10.1016/j.chemosphere.2012.06.002
Yu, H., Liu, Y., Shu, X., Fang, H., Sun, X., Pan, Y., et al. (2020). Equilibrium, Kinetic and Thermodynamic Studies on the Adsorption of Atrazine in Soils of the Water Fluctuation Zone in the Three-Gorges Reservoir. Environ. Sci. Eur. 32 (1), 1–10. doi:10.1186/s12302-020-00303-y
Yue, G., Jing, M., Ran, J., Xue, L.-q., Tao, C.-J., Li, C.-J., et al. (2013). Impact of Long-Term Atrazine Use on Groundwater Safety in Jilin Province, China. J. Integr. Agric. 12 (2), 305–313. doi:10.1016/S2095-3119(13)60229-4
Yue, L., Ge, C., Feng, D., Yu, H., Deng, H., and Fu, B. (2017). Adsorption-desorption Behavior of Atrazine on Agricultural Soils in China. J. Environ. Sci. 57, 180–189. doi:10.1016/j.jes.2016.11.002
Zhang, C.-Y., Zhang, S., Yin, M.-Y., Ma, L.-N., He, Z., and Ning, Z. (2013). Nitrogen Isotope Studies of Nitrate Contamination of the Thick Vadose Zones in the Wastewater-Irrigated Area. Environ. earth Sci. 68 (5), 1475–1483. doi:10.1007/s12665-012-1878-6
Keywords: attenuation/retardation factor model, atrazine, nitrate, groundwater, adsorption, pesticide and herbicide leaching indicator
Citation: Ratchawang S, Chotpantarat S and Charoenrojying P (2022) Assessment of Atrazine Migration in Soil and Groundwater Using Nitrate as an Indicator in an Intensively Cultivated Sugarcane Field, Suphan Buri Province, Thailand. Front. Earth Sci. 10:855599. doi: 10.3389/feart.2022.855599
Received: 15 January 2022; Accepted: 24 May 2022;
Published: 07 July 2022.
Edited by:
Joginder Singh, Lovely Professional University, IndiaReviewed by:
Sudipta Rakshit, Tennessee State University, United StatesAchouak Arfaoui, Ecole Supérieure d'Ingénieurs de Medjez El Bab, Tunisia
Copyright © 2022 Ratchawang, Chotpantarat and Charoenrojying. This is an open-access article distributed under the terms of the Creative Commons Attribution License (CC BY). The use, distribution or reproduction in other forums is permitted, provided the original author(s) and the copyright owner(s) are credited and that the original publication in this journal is cited, in accordance with accepted academic practice. No use, distribution or reproduction is permitted which does not comply with these terms.
*Correspondence: Srilert Chotpantarat, U3JpbGVydC5DQGNodWxhLmFjLnRo