 Huangqing Zhang1,2
 Rong Liu
94% of researchers rate our articles as excellent or good
Learn more about the work of our research integrity team to safeguard the quality of each article we publish.
Find out more
ORIGINAL RESEARCH article
Front. Earth Sci. , 25 March 2022
Sec. Geohazards and Georisks
Volume 10 - 2022 | https://doi.org/10.3389/feart.2022.855438
This article is part of the Research Topic New Development of Underground Energy Storage Using Mine Space View all 28 articles
Coal dust pollution in fully mechanized excavation faces not only affects the safety production of the coal mine but also threatens the health of workers. In order to reduce coal dust pollution and improve work conditions in mines, the layout of the dedusting-air duct in the dry dust collector and the influence of the duct position on the dust-producing area were studied. In addition, the effects of different cutting positions on dust removal efficiency were also studied. A full-scale model of mine roadway is established by CFD, and the influence of the position of the dedusting-air duct on dust diffusion and the distance between the tunneling head and the dedusting air duct on dust removal efficiency are studied. The results show that the higher the cutting position, the higher the dust concentration, and the longer the dust diffusion time in the coal roadway. When the distance between the dedusting-air duct and the tunneling head is set to 4 or 5 m, the dust removal efficiency is the highest. Moreover, the dust removal efficiency of the dry dust collector with the dedusting air duct arranged on the opposite side of the roadway is higher than that of the collector with the duct in the middle of the roadway.
Although the development of new energy is in the ascendant, coal still occupies the main position of energy utilization (Balat, 2009; Zhang et al., 2017; Song et al., 2018; Li et al., 2019; Song Z. et al., 2021). The large demand for coal has led to the development of mining technology from the aspect of mechanization and automation (Fan et al., 2020c; Liu et al., 2020b; Liu et al., 2020c; Peng et al., 2020; Jiang et al., 2021). Although remarkable achievements have been obtained, the amount of dust generated during mining has surged dramatically (Chen et al., 2019; Xu et al., 2019; Yang et al., 2019; Liu et al., 2021; Ren et al., 2021). A fully mechanized tunneling face is the main dust source, accounting for about 60% of the total amount of coal dust generated in mines, and the remaining dust comes from tunnel construction blasting (Fan et al., 2020a; Fan et al., 2020b; Kang et al., 2020; Ma et al., 2021; Zhang X. et al., 2021). In the absence of dust filtering methods, the coal dust concentration may exceed 3,000 mg/m3 (Wang et al., 2015; Chen et al., 2018; Yin et al., 2019). The threats of coal dust mainly manifest in three aspects. First, the coal dust threatens the physical and mental health of workers by causing pneumoconiosis and other diseases (Jiang et al., 2016; Fan et al., 2019; Tong et al., 2019; Li D. et al., 2021). According to the report of China’s Health Commission (Commission, 2019), more than 20,000 new cases of occupational disease cases were reported annually in China from 2010 to 2018, of which more than 80% of these cases are pneumoconiosis. Second, high coal dust concentration is prone to explosion, which may result in catastrophe, economic losses, and casualties (Cheng et al., 2013; Azam and Mishra, 2019). Third, studies show that the coal dust shortens the equipment’s service life, reduces the visibility of the working face, and pollutes the underground working environment (Strzemecka et al., 2019; Liu R. et al., 2020; Song et al., 2020). Therefore, it is of significant importance to reduce the dust concentration in coal mining, which is necessary to improve workers’ health and work condition and prevent coal dust explosion in the coal mining industry (Knapp and Krautblatter, 2020; Li D.-Y. et al., 2021; Mallios et al., 2021; Qiang et al., 2021; Thivet et al., 2021).
Generally, dust suppression techniques in the mechanized coal excavation mainly include spraying (Nie et al., 2017a; Yu et al., 2018; Wang et al., 2019), ventilation (Toraño et al., 2011; Wang et al., 2017; Cai et al., 2019), coal-seam water injection (Cheng et al., 2012; Wang et al., 2016; Guanhua et al., 2019), and chemical methods for dust suppression (Qin et al., 2017; Wang et al., 2018; Xu et al., 2018) and using an air curtain for dust isolation (Nie et al., 2017b; Geng et al., 2019; Xiao et al., 2019). Currently, ventilation dust suppression techniques are the most widely applied method in mines. In particular, the dry ventilation technique for dust suppression has superior characteristics such as good economic parameters, high efficiency, and a high degree of automation (Li et al., 2017). Zhang et al. explored the effects of downwind and upwind coal cutting on the dust pollution in a fully mechanized mining face using ANSYS-FLUENT software (Zhang et al., 2020). Moreover, Jiang et al. designed an experimental model roadway according to the motion equation of gas–solid two-phase flow to study the distribution of coal dust during mining. Liao et al. adopted a CFD-DPM method to study the dust distribution around the driver (Hu et al., 2019). Hu et al. performed a similar investigation under various velocities (Hu et al., 2020). Wang et al. adopted the Euler-e-Euler model to establish air-solid flow systems in the mine roadway and analyzed the dust flow and dust distribution along the transverse and axial directions (Wang et al., 2015). Geng et al. performed CFD simulations to investigate the dust evolution in the coal roadway under an auxiliary ventilation system (Geng et al., 2020). These studies are from the perspective of ventilation or drivers, and the position of dust production is the whole face. The particle size of the coal dust has also been studied in detail. In this regard, Cai et al. qualitatively analyzed the size range of dust particles in the fully mechanized mining face (Cai et al., 2018). Zhang et al. performed CFD simulations and qualitatively analyzed the size range of dust particles and spatial distribution in different areas of the roadway (Zhang L. et al., 2021). Yu et al. used the CFD-DEM airflow–dust coupled simulation approach and showed that the movement of the dust particles with a diameter range of 2.5–20 μm is dominated by the drag force (Yu et al., 2017). The performed literature survey indicates that the distribution of different particle sizes in the whole roadway has not been reported yet.
Aiming at reducing the threat of pneumoconiosis in coal miners, many investigations have been carried out to reduce dust emission. In this regard, different schemes such as different velocities, optimal airflow rate, and ventilation system have been proposed. Ijaz et al. gathered health data of workers in five different mines of Pakistan and found that the mine with the lowest ventilation volumetric flow rate has the highest dust concentration (Ijaz et al., 2020). Moreover, Gong et al. combined the fluid mechanics, finite element method, and underground measurement and established the double-objective BP prediction model to calculate the dust concentration in mines (Gong et al., 2019). Hua et al. used the CFD method and studied the effect of the position of the suction channel and the exhaust air rate on the dust diffusion and obtained the optimal dust control parameters (Hua et al., 2020). Guo and Song et al. combined the numerical simulation and field measurement to determine the optimal dust-exhausting airflow in the fully mechanized working face (Guo et al., 2020; Song S. et al., 2021). Furthermore, Yin et al. performed CFD simulations to analyze the influence of the distance between the forced air opening and the cutting face (Yin et al., 2020). Reviewing the literature indicates that most investigations in this area have been focused on dust generation, transport, distribution, and controlling the dust by using different ventilation methods, calculating the optimal airflow rate, and utilizing ventilation systems.
In the present study, DPM software and CFD software are adopted to investigate the characteristics of the dust dispersion and flow fields in coal mine roadways. The main objective of this article was to improve the dust removal efficiency of conventional dry dust collectors in the coal mine roadway. Then, the influence of different dust-producing positions on the dust removal efficiency is analyzed. Moreover, the dust reduction performance under different conditions is compared, and the optimal layout of the air duct is obtained. This article is expected to provide a theoretical guideline to design the field tunneling of the tunnel working
Generally, the Reynolds number in the fully mechanized working face exceeds 1×10⁶, so the airflow is a turbulent flow (Yu et al., 2017; Hua et al., 2020; Zhang L. et al., 2021). Considering the complicated geometry of the working environment, the k–ε model is the most widely turbulent model to reflect the characteristics of airflow in coal mines.
The continuous phase control equations that describe the airflow in the fully mechanized excavation face can be expressed in the following form:
The continuity equation (Zhang et al., 2018; Du et al., 2020):
The Navier–Stokes equation (Xiu et al., 2020; Zhang G. et al., 2021):
where
The kinetic energy equation of turbulent fluctuation (also known as k-equation):
The energy dissipation rate equation of the kinetic energy of turbulent fluctuation (also known as ε-equation):
where
In the present study, the discrete phase model/DPM in the Lagrangian coordinate system was used for the diffusion motion of coal dust particles. The interaction and influence between continuous phase airflow and discrete phase coal dust were considered. According to the equilibrium of forces on the coal dust particles, the governing equation of dust particles in the Lagrangian coordinate system can be expressed as follows:
where
The relative Reynolds number Re can be expressed as follows:
Moreover, the drag coefficient CD follows the following expression:
where
According to the conditions of the fully mechanized coal roadway tunneling face in the Shoushan Coal Mine, a 3D full-scale physical model was developed. Figure 1 shows the location of the Shoushan mine. In order to analyze the effect of the duct position on the dust reduction, different physical models were set up. The models consist of a tunnel, a fully mechanized heading machine, a pressing-air duct, and a dedusting-air duct. Figure 2 presents the configuration of the model. The tunnel size is 60 m × 3.5 m × 3.2 m. The simplified fully mechanized heading machine has a total length of 10 m and mainly consists of the machine body and the cutting header. The machine body is a cuboid with a size of 8 m × 2.6 m × 2.2 m, while the cutting header is a 4-m-long cylinder with a diameter of 0.8 m. The diameters of the pressing-air duct and the dedusting-air duct are 0.8 and 0.6 m, respectively. The ducts are 0.2 m away from the nearest tunnel walls, and their central axes are 2.7 m above the ground. The distance between the air outlet of the pressing-air duct and the heading face is 15 m. The air duct inlet is the velocity inlet boundary, the wind speed is 21.6 m/s, the outlet is the outflow boundary, the hydraulic diameter is 0.8 m, the turbulence intensity is 5%, and the outlet of the air duct is the interior boundary. The inlet of the dust duct is the fan boundary, the outlet of the dust duct and the end of the roadway away from the working face are the outflow boundary, and the other boundaries are walls. The dust generation time is set to 100 s, which has been maintained in the whole process of numerical simulation, and the given ventilation conditions are maintained. Table 1 lists the parameters of the second model. In the present study, transient and RNG k–ε solver with the PISO algorithm is used to solve the governing equations of the continuous phase in the flow field. The boundary conditions are summarized in Table 2. It is worth noting that these boundary conditions are obtained from the field measurement of the Shoushan Coal Mine.
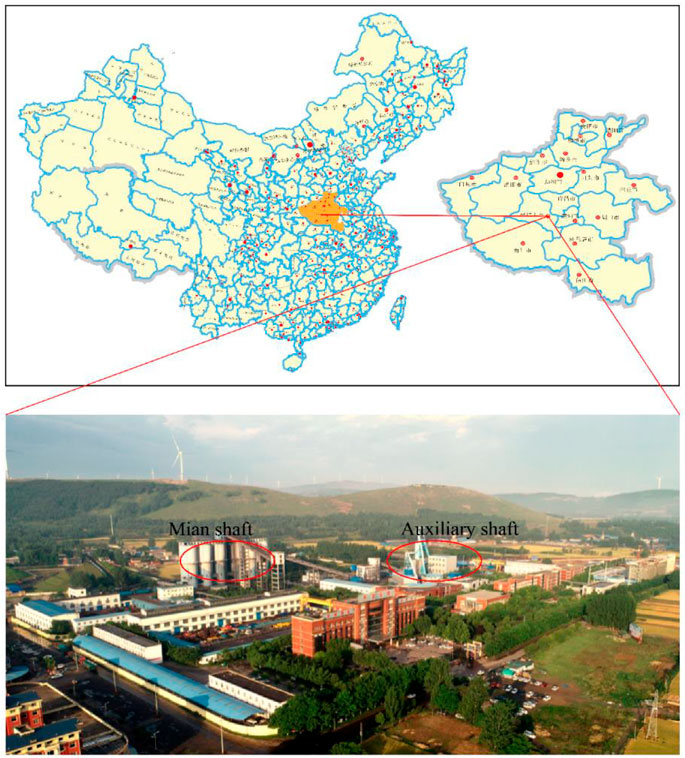
FIGURE 1. Geographical location of the Shoushan mine.
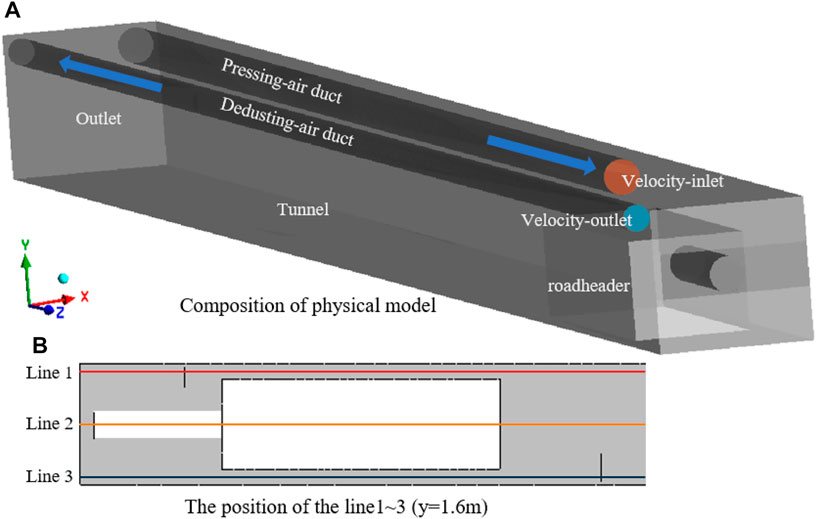
FIGURE 2. Physical model of Shoushan: (A) Composition of physical model; (B) Position of the line 1∼3 (y = 1.6 m).
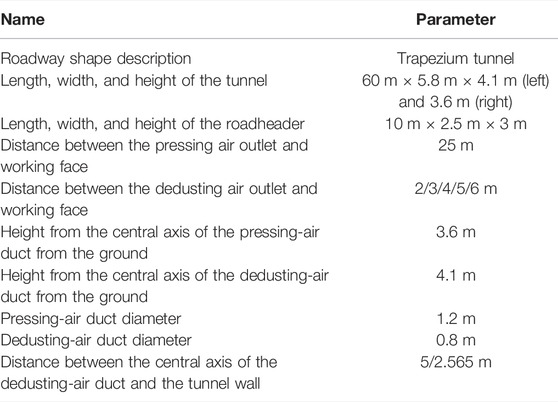
TABLE 1. Physical model parameters of the working face in the Shoushan Coal Mine.
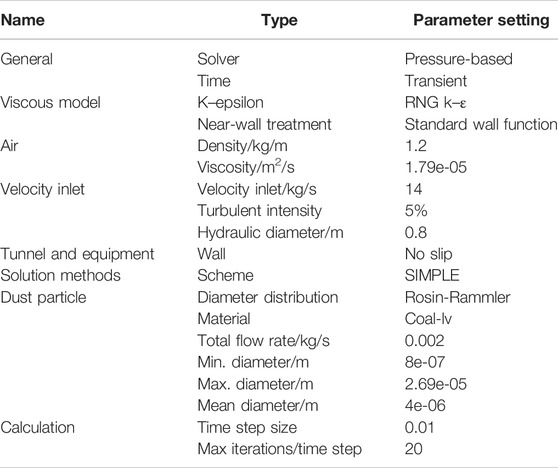
TABLE 2. Information on boundary conditions in numerical simulation.
To explore the results of the different cutting positions, the working face was divided into three parts, as shown in Figure 3. According to the aforementioned boundary conditions and dust source parameters, ANSYS FLUENT software was used to simulate airflow, dust diffusion, and distribution of the dust particle size.
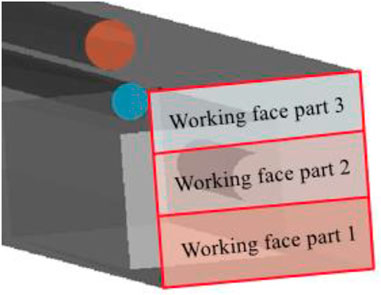
FIGURE 3. Different positions of dust production at the tunneling head.
Figure 4 shows the velocity vector diagram of the airflow. It is observed that the high-velocity airflow mainly appears at the pressing-air outlet and the dedusting-air inlet. There are three obvious zones in the airflow field at the heading face, namely the jet zone, reflux zone, and vortex zone. Moreover, the vortex zone and reflux zone appear before and after the roadheader. Since the pressing-air duct is near the upper part of the roadway, the air velocity in the upper part of the roadway is large, and the wind speed in the lower part is small. High-velocity airflow was jetted from the pressing-air outlet. Affected by the “wall attachment effect,” it sticks to the roadway wall, thereby continuously reducing the speed. Due to the limited space of the tunneling head and the entrainment effect of the jet, the jet continuously entrains the surrounding air forward. Finally, the jet impacts the head-on end face, and airflow appears opposite to the jet direction. This flow is called backflow. The comparison of the velocity vector diagram of horizontal sections at different heights indicates that the farther away from the pressing-air duct, the smaller the jet velocity, resulting in a smaller vortex area and reflux area, which is not conducive to particle transmission.
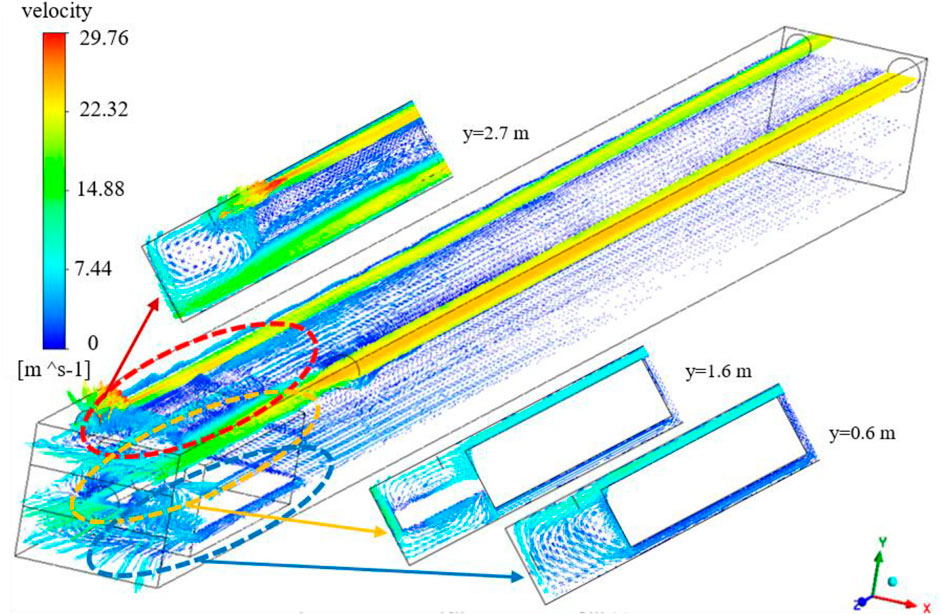
FIGURE 4. Numerical simulation of airflow migration.
The numerical simulation was performed to analyze the particle size of the coal dust in the working face. Figure 5 shows the dust migration from 0 to 100 s. Figures 6–8 present the dust diffusion with a dust concentration nephogram in the different parts of the working face after dry dedusting. The dust concentration changes of red, yellow, and blue balls in Figure 5 correspond to the dust concentration changes of three straight lines Lines 1–3 at the roadway y = 1.6 m in Figure 2, and x = 0 is located at the entrance of the roadway in Figure 5.
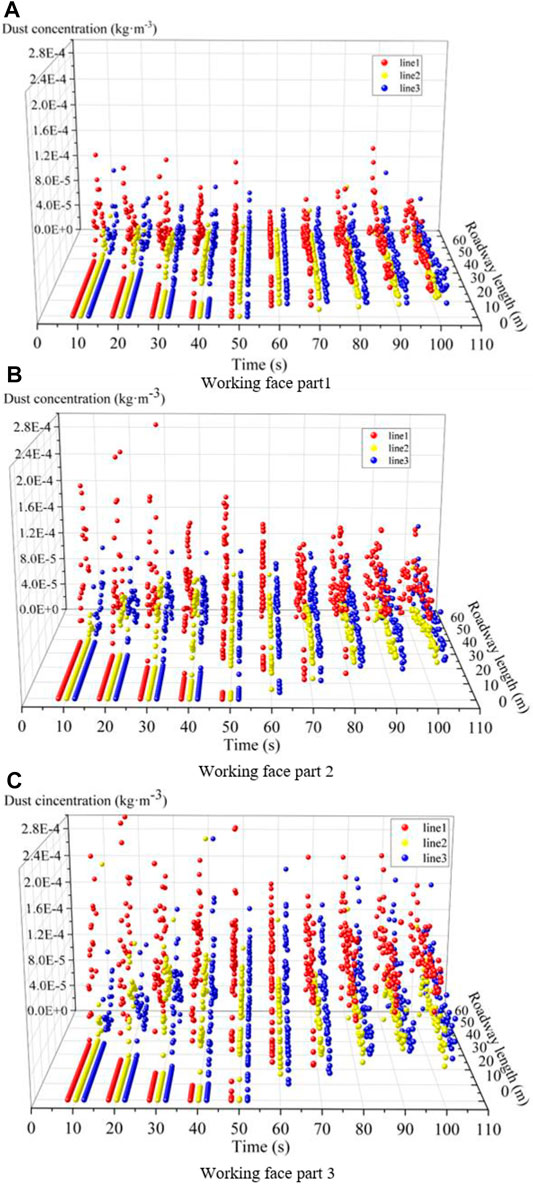
FIGURE 5. Variation of dust concentration along the process: (A) Working face part 1; (B) Working face part 2; (C) Working face part 3.
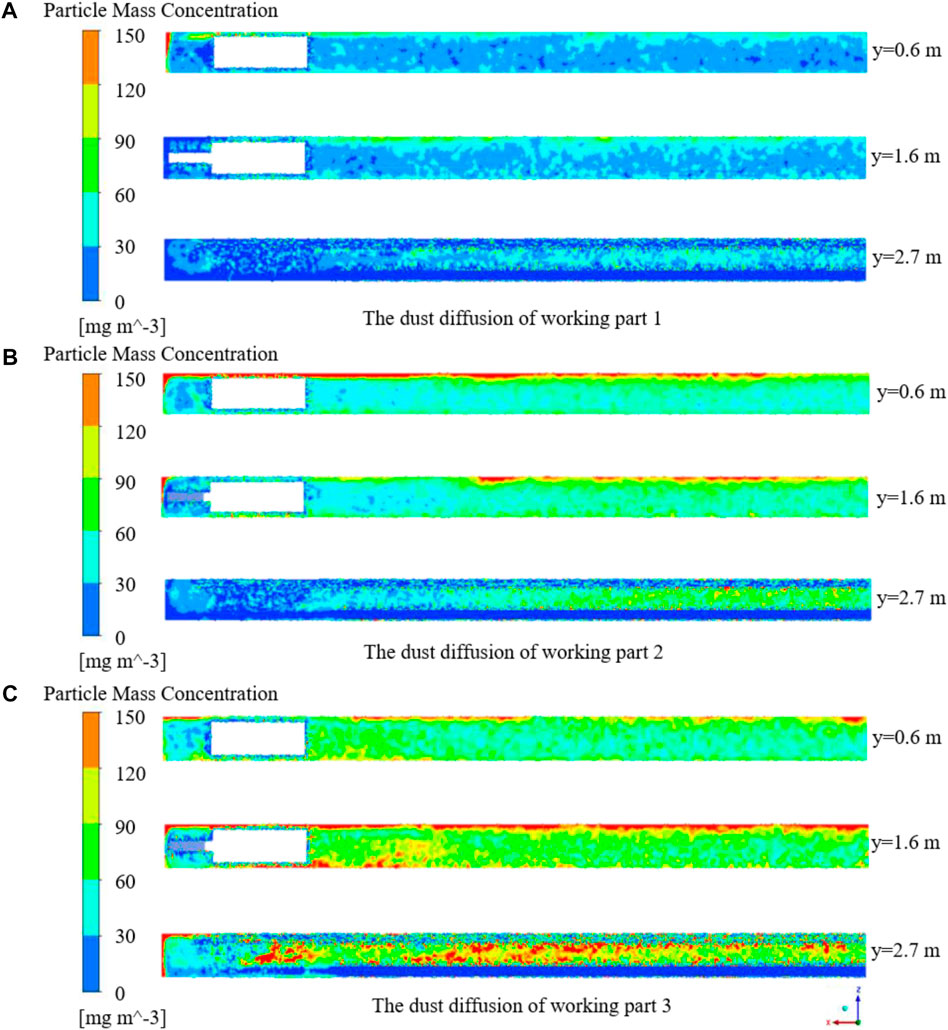
FIGURE 6. Dust diffusion of the working face: (A) Working face part 1; (B) Working face part 2; (C) Working face part 3.
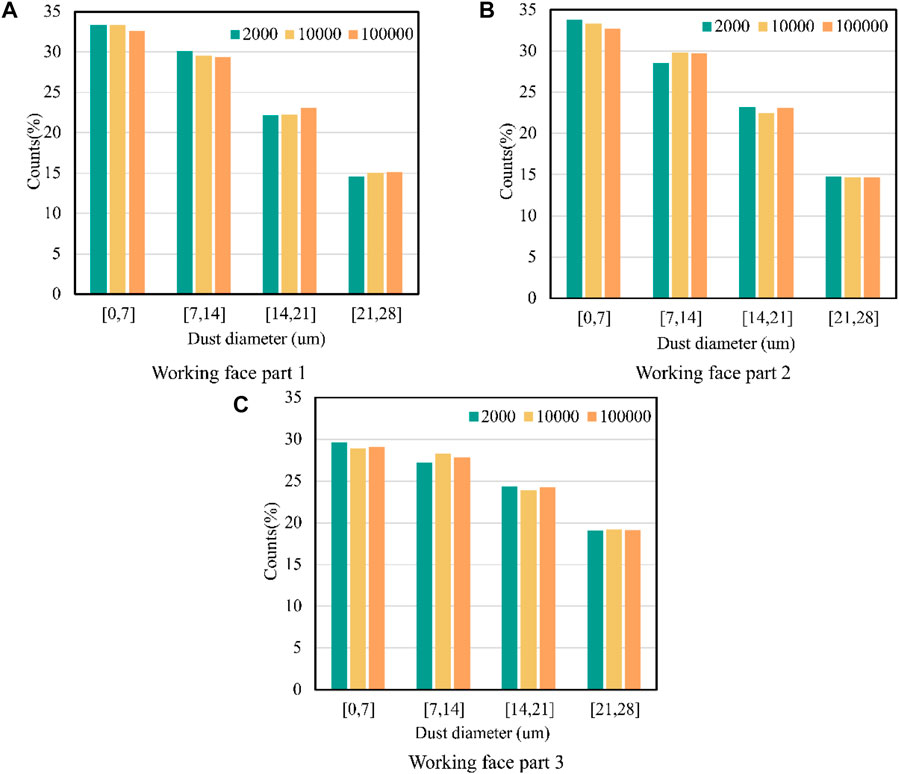
FIGURE 7. Different particle size rates: (A) Working face part 1; (B) Working face part 2; (C) Working face part 3.
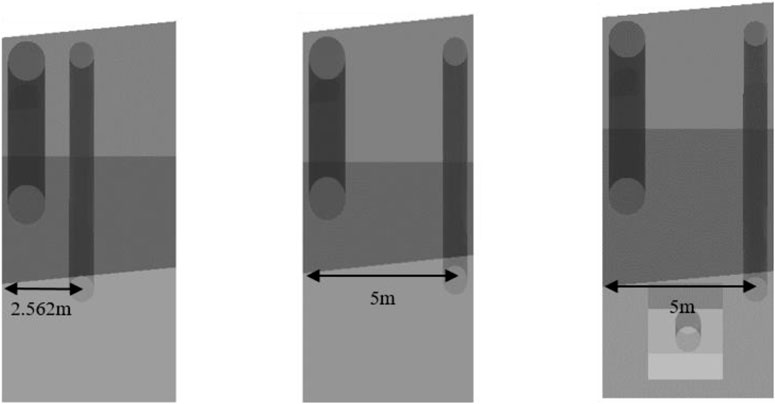
FIGURE 8. Physical model for different dedusting-air duct positions.
Figure 5 indicates that at the first 50 s of the process, the dust diffuses gradually from the working face along the roadway, and the dust concentration decreases gradually as the distance increases. At t = 50 s, the dust completely diffuses to the whole roadway, and in the period 20–30 s, the dust concentration reaches the maximum, and then the dust concentration decreases. It is found that the dust concentration near the dedusting-air duct is always higher than the other two parts, that is, the red sphere is higher than the yellow and blue sphere. This may be attributed to the formation of the jet area at the outlet of the pressing-air duct, which blows the dust to the other side of the roadway. The dust concentrates at the inlet of the dedusting-air duct and discharges outward through the dedusting-air duct.
The analysis of the dust concentration variation diagram of three dust-producing surfaces indicates that the dust concentration of the working face part 1 is significantly lower than that of the other two working faces, and the maximum dust concentration is about 100 mg/m³. This is because the working face part 1 is close to the roadway floor so that the generated dust settles down quickly under the action of gravity. However, the highest dust concentration occurs at the working face part 3, where the maximum dust concentration reaches 280 mg/m³, while the maximum dust concentration of working face part 2 is 220 mg/m³. Moreover, it is found that variations of dust produced at different cutting parts are the same. However, since the working face part 3 is at the same height as the dedusting-air duct inlet, the dust will eventually converge on the dedusting-air duct so that the highest dust concentration appears in working face part 3.
Figure 6 shows the dust concentration contours at y = 0.6, 1.6, and 2.7 m under different working conditions. It is observed that after dry dedusting, the concentration and distribution of the produced dust at different cutting positions are greatly different. However, the highest and lowest dust concentrations occur at the working face parts 3 and 1, respectively. Figure 6A indicates that the highest dust concentration occurs at the working face with y = 0.6 m. This is because the working face part 1 is near the floor, where the dust settles down and accumulates because of gravity. Figure 6B shows that the dust accumulates on the opposite side of the pressing-air duct at y = 0.6 and 1.6 m. That is because a large amount of dust discharges from the dedusting-air duct. Figure 6C reveals that the dust concentration is much higher on the x-z plane with y = 2.7 m. This is because the working face part 3 is close to the roof and has the largest contact with the airflow; the high concentration of dust diffuses to the middle part of the roadway.
In the present study, 2,000, 10,000, and 100,000 particles are considered in the simulation to achieve results independent of the number of particles. Figure 7 presents the obtained results. It is observed that the proportions of different particle sizes in all cases are almost the same. By adding the proportions of the first two particle size ranges, the dust particles with a diameter range of 0–14 μm account for about 60%. Therefore, it is necessary to control this range of particles to control the total dust. Moreover, it is found that the dust particles smaller than 10 μm account for 33% at the working face part 1 and part 2, but the share decreases slightly at face part 3. Compared with face part 1 and part 2, dust particles larger than 21 μm increase at face part 3. This is mainly because the working face part 3 is the main dust-producing surface, thereby increasing the dust concentration of all sizes, and the working face part 3 is the highest from the bottom. The larger the particle size, the higher the particle inertia. Accordingly, the floating time in the tunnel is much longer than that at parts 1 and 2. It is concluded that large particles are of significant importance to reduce the dust pollution in coal mines.
In order to find the appropriate position of dedusting-air duct for effective dust control, numerical simulation was carried out.
In this section, it is necessary to ensure that the distance between the dedusting-air duct and the tunneling head is consistent. To perform a contrastive analysis, the case with no roadheader is simulated. Figure 8 indicates that three working conditions are simulated. In the first case, dedusting-air duct is located in the middle of the roadway, while in the second and third cases, dedusting-air duct is located on the opposite side of the pressing-air duct without and with a roadheader, respectively.
Figure 9A reveals that when the dedusting-air duct is located in the middle of the roadway, the dust area is large, and the dust in the roadway takes a V-shaped distribution. Moreover, it is found that the dust-polluted area on the right side of the roadway is smaller than that on the left side. This arrangement cannot provide adequate fresh air to flow through all areas of the roadway. Accordingly, dust cannot be absorbed well, resulting in high dust pollution in the roadway. In this case, only the dust at the inlet of the dedusting-air duct is inhaled. The dust is pushed into the left side of the roadway by the fresh air, resulting in a large dust-polluted area on the left side. Furthermore, the range of high-concentration dust at the height of 3 m is slightly less than that at the height of 1.6 m. This phenomenon may be attributed to the position of the dedusting-air duct.
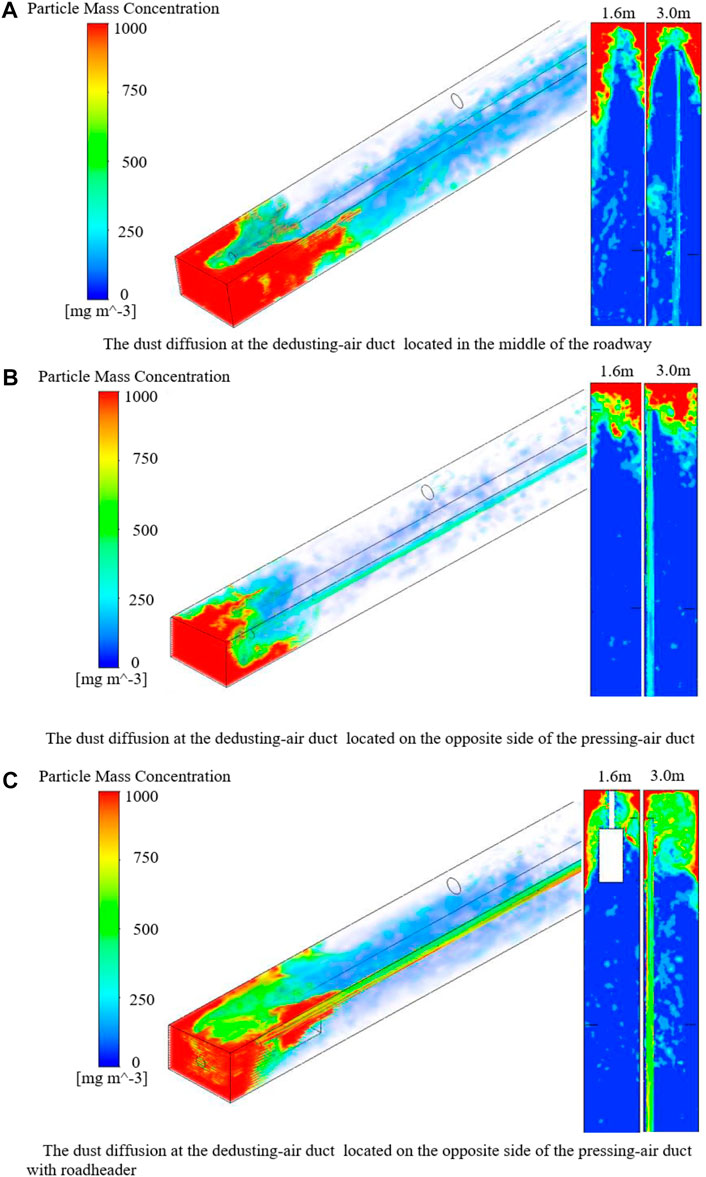
FIGURE 9. Dust diffusion for different dedusting-air duct positions: (A) in the middle of the roadway; (B) on the opposite side of the pressing-air duct; (C) on the opposite side of the pressing-air duct with roadheader.
The comparison of Figure 9A with (b) reveals that there is not a V-shaped distribution. Instead, there is a low concentration on the left and a high concentration on the right. Moreover, it is found that the dust concentration and dust amount in the roadway in Figure 9B are significantly lower than those in Figure 9A, demonstrating that when the dedusting-air duct is arranged on the opposite side of the pressing-air duct, the dust removal effect is higher than that of the case dedusting-air duct in the middle of the roadway.
Figure 9C indicates that under the influence of the roadheader, a high-concentration dust area forms near the wall, and a П-shaped distribution appears. The dust distribution in the roadway can be mainly divided into three areas. The highest concentration occurs in the П-shaped distribution, where the dust concentration can reach 100 mg/m3. Under the action of eddy current in this area, a small amount of dust diffuses to the outside of the roadheader, thereby forming a medium concentration area. Most of the dust in this area is concentrated on the side of the dedusting-air duct and cut off at the rear end of the air inlet duct outlet. Meanwhile, the dust concentration at the rear end of the air inlet and outlet of the air duct decreases rapidly, thereby forming a mild concentration area.
In this section, the influence of the distance between the dedusting-air duct and the tunneling head on the working face dust diffusion is analyzed. Figures 10–13 present the dust distribution in the roadway when the dedusting-air duct is 2, 3, 4, 5, and 6 m away from the tunneling head, respectively. It should be indicated that two planes with intercept heights of 1.6 and 3.0 m were taken in each working condition.
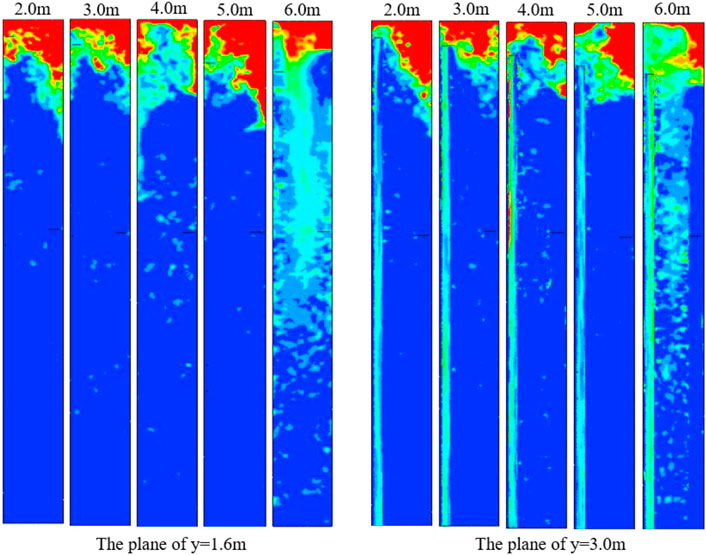
FIGURE 10. Dust diffusion at planes of y = 1.6 and 3.0 m for different dedusting-air duct distances (no roadheader).
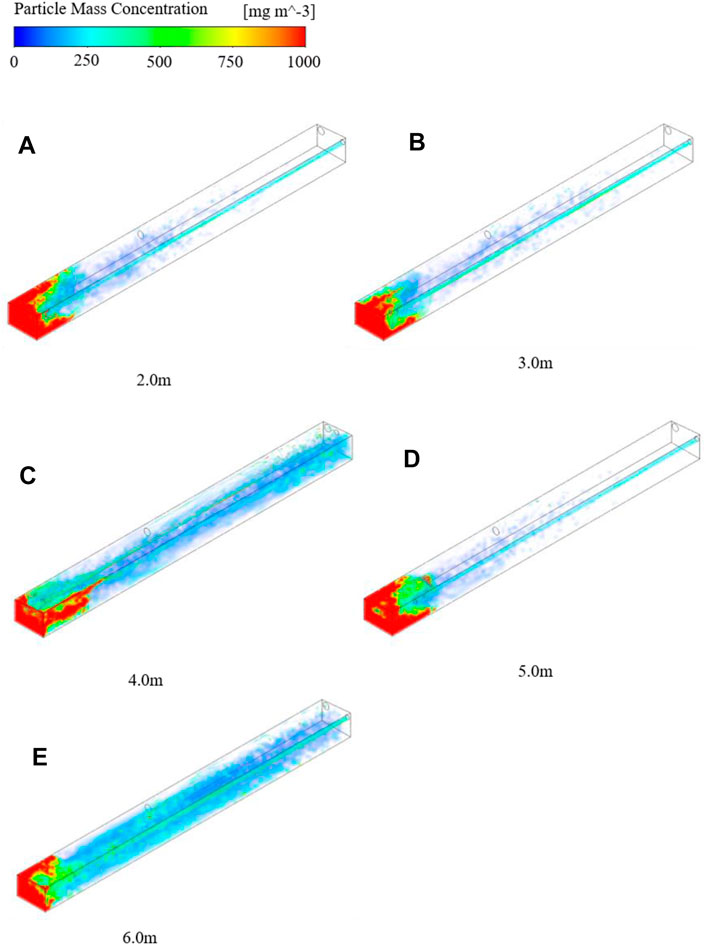
FIGURE 11. Dust diffusion for different dedusting-air duct distances (no road header): (A) 2.0 m; (B) 3.0 m; (C) 4.0 m; (D) 5.0 m; (E) 6.0 m.
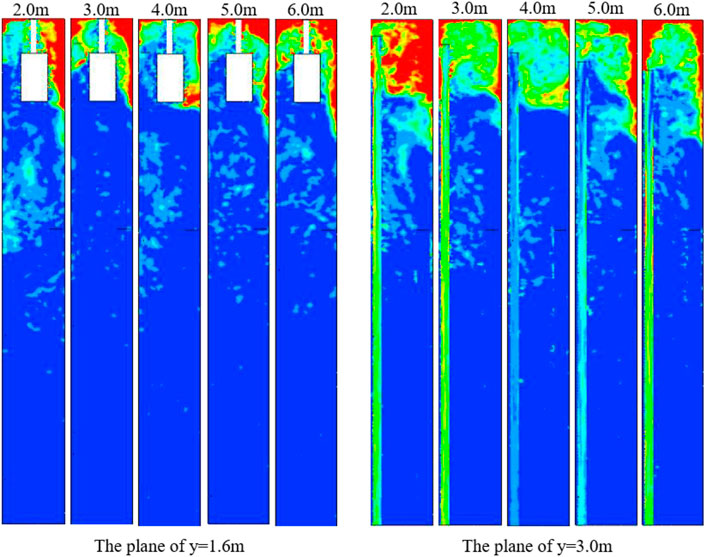
FIGURE 12. Dust diffusion at planes of y = 1.6 and 3.0 m for different dedusting-air duct distances (roadheader).
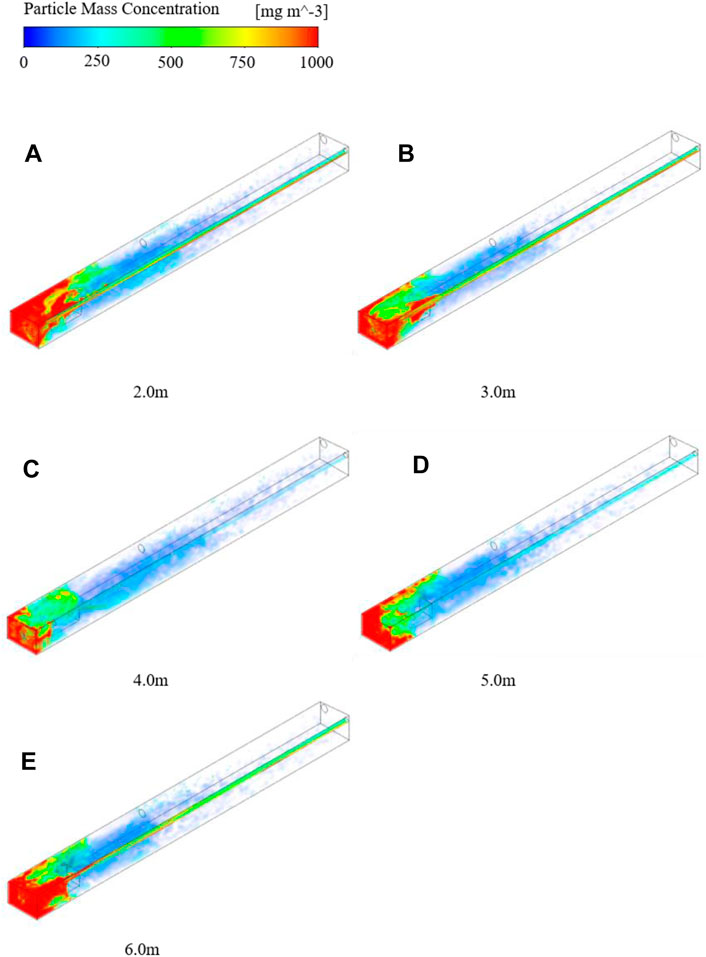
FIGURE 13. Dust diffusion for different dedusting-air duct distances (roadheader): (A) 2.0 m; (B) 3.0 m; (C) 4.0 m; (D) 5.0 m; (E) 6.0 m.
As shown in Figures 10, 11, it is observed that when the inlet of the dedusting-air duct is 6 m away from the tunneling head, the dust removal efficiency is much less than that when the distance is 2–5 m. This may be attributed to insufficient air suction into the dedusting-air duct. When the air inlet of the dedusting-air duct is 2–5 m away from the tunneling head, a similar dust distribution appears in the roadway, and the dust mainly concentrates near the tunneling head, while the dust distribution in the roadway is low. It is inferred that most of the dust can be inhaled into the dust removal fan. However, when the air inlet of the dedusting-air duct is 2 or 5 m away from the tunneling head, the area with a high concentration of dust is greater than 3 or 4 m, respectively. Meanwhile, when the distance is set to 4 m, the area with a high concentration of dust is near the wall, while the middle concentration of dust is evenly distributed within two times the width of the excavation head. However, when the distance is 3 m, the lowest overall dust concentration occurs within two times the width of the excavation head. It is concluded that when there is no roadheader in the roadway, the optimum distance from the air inlet of the dedusting-air duct to the excavation head is 3 m.
When there is a roadheader in the roadway, the dust distribution is affected by the roadheader. In this regard, Figures 12, 13 show the dust distribution in the roadway at 2, 3, 4, 5, and 6 m. It is observed that most of the dust concentrates in the range of the roadheader. Meanwhile, an area of high concentration dust appears on the right side of the roadway. When the dedusting-air duct is 2 m away from the tunneling head, a large amount of dust cannot be sucked into the dedusting-air duct, thereby concentrating near the tunneling head and resulting in the formation of an ultrahigh dust concentration area. When the dedusting-air duct is 6 m away from the tunneling head, the dust concentration is higher, and the influence range is wide. Since the dust concentration on the left side of the roadheader at 3 m is higher than that at 4 and 5 m, it cannot be considered the optimal distance. When the dedusting-air duct is 4 m away from the excavation head, the area with a high concentration of dust in the whole roadway and the diffusion range are minimized. Meanwhile, when the dedusting-air duct is 5 m away from the excavation head, a small low concentration area appears near the air inlet, which is just above the driver. Based on the performed analyses, it is inferred that the highest dust removal efficiency can be obtained when the distance between the dedusting-air duct and the excavation head is set to 4–5 m.
In the present study, the influence of different cutting parts, the position of the dedusting-air duct, and the distance between the dedusting-air duct and the excavation head was investigated on the distribution and diffusion of the dust at the working face. Based on the obtained results, the main conclusions and achievements can be summarized as follows:
1) The highest concentration of cutting dust occurs near the roof. Due to the long contact time, the diffusion of high concentration dust to other parts of the roadway is significant.
2) Compared with an air duct in the middle of the roadway, the dedusting-air duct on the opposite side of the air duct has high dry dust removal efficiency.
3) When there is no roadheader in the roadway, the best dust removal efficiency can be achieved from the air inlet of the dedusting-air duct 3 m away from the excavation head. However, when a roadheader is arranged in the roadway, the highest dust removal efficiency occurs at a distance of 4–5 m.
The raw data supporting the conclusion of this article will be made available by the authors, without undue reservation.
HZ: Methodology; Investigation; Software; Writing-original draft. RL: Methodology; Investigation; Software; Editing the draft. JC: Writing-review; Editing; Supervision. QX: Writing-review; Editing; Supervision. JF: Writing-review; Editing; Supervision; Funding acquisition.
This study was supported by the Fundamental Research Funds for the National Natural Foundation of China (NSFC, grant numbers 51834003, 51904039, 51774057 and 52074048), Chongqing Postdoctoral Science Foundation (cstc2019jcyjbshX0084) and the Special Key Project of Chongqing Technology Innovation and Application Development (cstc2019jscx-tjsbX0015).
Author JC is employed by Guizhou Transportation Planning Survey & Design Academe Co. LTD, and author QX is employed by Shanxi Construction Engineering Group Co. LTD.
The remaining authors declare that the research was conducted in the absence of any commercial or financial relationships that could be construed as a potential conflict of interest.
All claims expressed in this article are solely those of the authors and do not necessarily represent those of their affiliated organizations or those of the publisher, the editors, and the reviewers. Any product that may be evaluated in this article, or claim that may be made by its manufacturer, is not guaranteed or endorsed by the publisher.
Azam, S., and Mishra, D. P. (2019). Effects of Particle Size, Dust Concentration and Dust-Dispersion-Air Pressure on Rock Dust Inertant Requirement for Coal Dust Explosion Suppression in Underground Coal Mines. Process Saf. Environ. Prot. 126, 35–43. doi:10.1016/j.psep.2019.03.030
Balat, M. (2009). Coal in the Global Energy Scene. Energ. Sourc. B: Econ. Plann. Pol. 5 (1), 50–62. doi:10.1080/15567240701758927
Cai, P., Nie, W., Chen, D., Yang, S., and Liu, Z. (2019). Effect of Air Flowrate on Pollutant Dispersion Pattern of Coal Dust Particles at Fully Mechanized Mining Face Based on Numerical Simulation. Fuel 239, 623–635. doi:10.1016/j.fuel.2018.11.030
Cai, P., Nie, W., Hua, Y., Wei, W., and Jin, H. (2018). Diffusion and Pollution of Multi-Source Dusts in a Fully Mechanized Coal Face. Process Saf. Environ. Prot. 118, 93–105. doi:10.1016/j.psep.2018.06.011
Chen, D., Nie, W., Cai, P., and Liu, Z. (2018). The Diffusion of Dust in a Fully-Mechanized Mining Face with a Mining Height of 7 M and the Application of Wet Dust-Collecting Nets. J. Clean. Prod. 205, 463–476. doi:10.1016/j.jclepro.2018.09.009
Chen, L., Ma, G., Liu, G., and Liu, Z. (2019). Effect of Pumping and Spraying Processes on the Rheological Properties and Air Content of Wet-Mix Shotcrete with Various Admixtures. Construction Building Mater. 225, 311–323. doi:10.1016/j.conbuildmat.2019.07.104
Cheng, J., Luo, Y., and Zhou, F. (2013). Explosibility Safety Factor: An Approach to Assess Mine Gas Explosion Risk. Fire Technol. 51 (2), 309–323. doi:10.1007/s10694-013-0324-y
Cheng, W.-m., Nie, W., Zhou, G., Yu, Y., Ma, Y., and Xue, J. (2012). Research and Practice on Fluctuation Water Injection Technology at Low Permeability Coal Seam. Saf. Sci. 50 (4), 851–856. doi:10.1016/j.ssci.2011.08.021
Commission, T.C.H. (2019). Statistical Bulletin of China's Health Development in 2019. Available at: http://www.nhc.gov.cn/guihuaxxs/s10748/202006/ebfe31f24cc145b198dd730603ec4442.shtml.
Du, T., Nie, W., Chen, D., Xiu, Z., Yang, B., Liu, Q., et al. (2020). CFD Modeling of Coal Dust Migration in an 8.8-Meter-High Fully Mechanized Mining Face. Energy 212, 118616. doi:10.1016/j.energy.2020.118616
Fan, J., Jiang, D., Liu, W., Wu, F., Chen, J., and Daemen, J. (2019). Discontinuous Fatigue of Salt Rock with Low-Stress Intervals. Int. J. Rock Mech. Mining Sci. 115, 77–86. doi:10.1016/j.ijrmms.2019.01.013
Fan, J., Liu, P., Li, J., and Jiang, D. (2020a). A Coupled Methane/air Flow Model for Coal Gas Drainage: Model Development and Finite-Difference Solution. Process Saf. Environ. Prot. 141, 288–304. doi:10.1016/j.psep.2020.05.015
Fan, J., Liu, W., Jiang, D., Chen, J., Tiedeu, W. N., and Daemen, J. J. K. (2020b). Time Interval Effect in Triaxial Discontinuous Cyclic Compression Tests and Simulations for the Residual Stress in Rock Salt. Rock Mech. Rock Eng. 53 (9), 4061–4076. doi:10.1007/s00603-020-02150-y
Fan, J., Xie, H., Chen, J., Jiang, D., Li, C., Ngaha Tiedeu, W., et al. (2020c). Preliminary Feasibility Analysis of a Hybrid Pumped-Hydro Energy Storage System Using Abandoned Coal Mine Goafs. Appl. Energ. 258, 114007. doi:10.1016/j.apenergy.2019.114007
Geng, F., Gui, C., Teng, H., Tang, J., Niu, H., Zhou, F., et al. (2020). Dispersion Characteristics of Dust Pollutant in a Typical Coal Roadway under an Auxiliary Ventilation System. J. Clean. Prod. 275, 122889. doi:10.1016/j.jclepro.2020.122889
Geng, F., Gui, C., Wang, Y., Zhou, F., Hu, S., and Luo, G. (2019). Dust Distribution and Control in a Coal Roadway Driven by an Air Curtain System: A Numerical Study. Process Saf. Environ. Prot. 121, 32–42. doi:10.1016/j.psep.2018.09.005
Gong, X., Jia, C., Sun, K., Cui, J., Lei, K., Xue, Y., et al. (2019). Distribution Law and Prediction Model of Dust Concentration under Airflow Adjustment in Fully Mechanized Heading Face. Math. Probl. Eng. 2019, 1–17. doi:10.1155/2019/6210704
Guanhua, N., Kai, D., Shang, L., and Qian, S. (2019). Gas Desorption Characteristics Effected by the Pulsating Hydraulic Fracturing in Coal. Fuel 236, 190–200. doi:10.1016/j.fuel.2018.09.005
Guo, L., Nie, W., Yin, S., Liu, Q., Hua, Y., Cheng, L., et al. (2020). The Dust Diffusion Modeling and Determination of Optimal Airflow Rate for Removing the Dust Generated during Mine Tunneling. Building Environ. 178, 106846. doi:10.1016/j.buildenv.2020.106846
Hu, S., Liao, Q., Feng, G., Huang, Y., Shao, H., Fan, Y., et al. (2019). Numerical Study of Gas-Solid Two-phase Flow Around Road-Header Drivers in a Fully Mechanized Excavation Face. Powder Technol. 344, 959–969. doi:10.1016/j.powtec.2018.12.076
Hu, S., Liao, Q., Feng, G., Huang, Y., Shao, H., Gao, Y., et al. (2020). Influences of Ventilation Velocity on Dust Dispersion in Coal Roadways. Powder Technol. 360, 683–694. doi:10.1016/j.powtec.2019.09.080
Hua, Y., Nie, W., Cai, P., Liu, Y., Peng, H., and Liu, Q. (2018). Pattern Characterization Concerning Spatial and Temporal Evolution of Dust Pollution Associated with Two Typical Ventilation Methods at Fully Mechanized Excavation Faces in Rock Tunnels. Powder Technol. 334, 117–131. doi:10.1016/j.powtec.2018.04.059
Hua, Y., Nie, W., Liu, Q., Yin, S., and Peng, H. (2020). Effect of Wind Curtain on Dust Extraction in Rock Tunnel Working Face: CFD and Field Measurement Analysis. Energy 197, 117214. doi:10.1016/j.energy.2020.117214
Ijaz, M., Akram, M., Ahmad, S., Khan, W., Thygerson, S., and Nadeem, F. (2020). Dust Generation and Respiratory Impact of Underground Coal-Producing Mines in Pakistan. Polish J. Environ. Stud. 29 (5), 3611–3620. doi:10.15244/pjoes/115329
Jiang, D., Fan, J., Chen, J., Li, L., and Cui, Y. (2016). A Mechanism of Fatigue in Salt under Discontinuous Cycle Loading. Int. J. Rock Mech. Mining Sci. 86, 255–260. doi:10.1016/j.ijrmms.2016.05.004
Jiang, D., Li, Z., Liu, W., Ban, F., Chen, J., Wang, Y., et al. (2021). Construction Simulating and Controlling of the two-well-Vertical(TWV) Salt Caverns with Gas Blanket. J. Nat. Gas Sci. Eng. 96, 104291. doi:10.1016/j.jngse.2021.104291
Kang, Y., Fan, J., Jiang, D., and Li, Z. (2020). Influence of Geological and Environmental Factors on the Reconsolidation Behavior of Fine Granular Salt. Nat. Resour. Res. 30 (1), 805–826. doi:10.1007/s11053-020-09732-1
Knapp, S., and Krautblatter, M. (2020). Conceptual Framework of Energy Dissipation during Disintegration in Rock Avalanches. Front. Earth Sci. 8, 263. doi:10.3389/feart.2020.00263
Li, D.-Y., Zheng, D.-F., Wu, H., Shen, Y.-Q., and Nian, T.-k. (2021a). Numerical Simulation on the Longitudinal Breach Process of Landslide Dams Using an Improved Coupled DEM-CFD Method. Front. Earth Sci. 9, 673249. doi:10.3389/feart.2021.673249
Li, D., Liu, W., Jiang, D., Chen, J., Fan, J., and Qiao, W. (2021b). Quantitative Investigation on the Stability of Salt Cavity Gas Storage with Multiple Interlayers above the Cavity Roof. J. Energ. Storage 44, 103298. doi:10.1016/j.est.2021.103298
Li, J., Xie, C., and Long, H. (2019). The Roles of Inter-fuel Substitution and Inter-market Contagion in Driving Energy Prices: Evidences from China's Coal Market. Energ. Econ. 84, 104525. doi:10.1016/j.eneco.2019.104525
Li, S., Zhou, F., Wang, F., and Xie, B. (2017). Application and Research of Dry-type Filtration Dust Collection Technology in Large Tunnel Construction. Adv. Powder Technol. 28 (12), 3213–3221. doi:10.1016/j.apt.2017.10.003
Liu, P., Fan, J., Jiang, D., and Li, J. (2021). Evaluation of Underground Coal Gas Drainage Performance: Mine Site Measurements and Parametric Sensitivity Analysis. Process Saf. Environ. Prot. 148, 711–723. doi:10.1016/j.psep.2021.01.054
Liu, Q., Nie, W., Hua, Y., Peng, H., Ma, H., Yin, S., et al. (2019). Long-duct Forced and Short-Duct Exhaust Ventilation System in Tunnels: Formation and Dust Control Analysis of Pressure Ventilation Air Curtain. Process Saf. Environ. Prot. 132, 367–377. doi:10.1016/j.psep.2019.10.012
Liu, R., He, Y., Zhao, Y., Jiang, X., and Ren, S. (2020a). Tunnel Construction Ventilation Frequency-Control Based on Radial Basis Function Neural Network. Automation in Construction 118, 103293. doi:10.1016/j.autcon.2020.103293
Liu, W., Zhang, X., Fan, J., Zuo, J., Zhang, Z., and Chen, J. (2020b). Study on the Mechanical Properties of Man-Made Salt Rock Samples with Impurities. J. Nat. Gas Sci. Eng. 84, 103683. doi:10.1016/j.jngse.2020.103683
Liu, W., Zhang, Z., Fan, J., Jiang, D., Li, Z., and Chen, J. (2020c). Research on Gas Leakage and Collapse in the Cavern Roof of Underground Natural Gas Storage in Thinly Bedded Salt Rocks. J. Energ. Storage 31, 101669. doi:10.1016/j.est.2020.101669
Ma, L. H., Jiang, X., Chen, J., Zhao, Y. F., Liu, R., and Ren, S. (2021). Analysis of Damages in Layered Surrounding Rocks Induced by Blasting during Tunnel Construction. Int. J. Str. Stab. Dyn. 21 (07), 2150089. doi:10.1142/s0219455421500899
Mallios, S. A., Papangelis, G., Hloupis, G., Papaioannou, A., Daskalopoulou, V., and Amiridis, V. (2021). Modeling of Spherical Dust Particle Charging Due to Ion Attachment. Front. Earth Sci. 9, 709890. doi:10.3389/feart.2021.709890
Nie, W., Liu, Y., Wang, H., Wei, W., Peng, H., Cai, P., et al. (2017a). The Development and Testing of a Novel External-Spraying Injection Dedusting Device for the Heading Machine in a Fully-Mechanized Excavation Face. Process Saf. Environ. Prot. 109, 716–731. doi:10.1016/j.psep.2017.06.002
Nie, W., Wei, W., Ma, X., Liu, Y., Peng, H., and Liu, Q. (2017b). The Effects of Ventilation Parameters on the Migration Behaviors of Head-On Dusts in the Heading Face. Tunnelling Underground Space Technol. 70, 400–408. doi:10.1016/j.tust.2017.09.017
Peng, H., Fan, J., Zhang, X., Chen, J., Li, Z., Jiang, D., et al. (2020). Computed Tomography Analysis on Cyclic Fatigue and Damage Properties of Rock Salt under Gas Pressure. Int. J. Fatigue 134, 105523. doi:10.1016/j.ijfatigue.2020.105523
Qiang, M., Stevens, T., Li, G., Hu, L., Wang, X., Lang, W., et al. (2021). Late Quaternary Dust, Loess and Desert Dynamics in Upwind Areas of the Chinese Loess Plateau. Front. Earth Sci. 9, 661874. doi:10.3389/feart.2021.661874
Qin, B., Dou, G., Wang, Y., Xin, H., Ma, L., and Wang, D. (2017). A Superabsorbent Hydrogel-Ascorbic Acid Composite Inhibitor for the Suppression of Coal Oxidation. Fuel 190, 129–135. doi:10.1016/j.fuel.2016.11.045
Ren, Y., Yuan, Q., Jiang, D., Fan, J., Liu, W., Wei, L., et al. (2021). A Non-darcy Gas Flow Model for Coalbed Methane in Mine Gobs. Phys. Fluids 33 (11), 116601. doi:10.1063/5.0065252
Sasmito, A. P., Birgersson, E., Ly, H. C., and Mujumdar, A. S. (2013). Some Approaches to Improve Ventilation System in Underground Coal Mines Environment - A Computational Fluid Dynamic Study. Tunnelling Underground Space Technol. 34, 82–95. doi:10.1016/j.tust.2012.09.006
Song, S., Zhou, G., Duan, J., Zhang, L., Gao, D., and Sun, B. (2021a). Numerical Simulation Investigation on Optimal Dust-Exhausting Airflow Volume in Fully Mechanized Caving Face of High-Gas Coal Mine. Process Saf. Environ. Prot. 146, 853–866. doi:10.1016/j.psep.2020.11.045
Song, Z., Frühwirt, T., and Konietzky, H. (2020). Inhomogeneous Mechanical Behaviour of concrete Subjected to Monotonic and Cyclic Loading. Int. J. Fatigue 132, 105383. doi:10.1016/j.ijfatigue.2019.105383
Song, Z., Konietzky, H., and Herbst, M. (2018). Bonded-particle Model-Based Simulation of Artificial Rock Subjected to Cyclic Loading. Acta Geotech. 14 (4), 955–971. doi:10.1007/s11440-018-0723-9
Song, Z., Wang, Y., Konietzky, H., and Cai, X. (2021b). Mechanical Behavior of marble Exposed to Freeze-Thaw-Fatigue Loading. Int. J. Rock Mech. Mining Sci. 138, 104648. doi:10.1016/j.ijrmms.2021.104648
Strzemecka, J., Goździewska, M., Skrodziuk, J., Galińska, E., and Lachowski, S. (2019). Factors of Work Environment Hazardous for Health in Opinions of Employees Working Underground in the 'Bogdanka' Coal Mine. Ann. Agric. Environ. Med. 26 (3), 409–414. doi:10.26444/aaem/106224
Thivet, S., Harris, A. J. L., Gurioli, L., Bani, P., Barnie, T., Bombrun, M., et al. (2021). Multi-Parametric Field Experiment Links Explosive Activity and Persistent Degassing at Stromboli. Front. Earth Sci. 9, 669661. doi:10.3389/feart.2021.669661
Tong, R., Cheng, M., Yang, X., Yang, Y., and Shi, M. (2019). Exposure Levels and Health Damage Assessment of Dust in a Coal Mine of Shanxi Province, China. Process Saf. Environ. Prot. 128, 184–192. doi:10.1016/j.psep.2019.05.022
Toraño, J., Torno, S., Menéndez, M., and Gent, M. (2011). Auxiliary Ventilation in Mining Roadways Driven with Roadheaders: Validated CFD Modelling of Dust Behaviour. Tunnelling Underground Space Technol. 26 (1), 201–210. doi:10.1016/j.tust.2010.07.005
Wang, G., Chu, X., and Yang, X. (2016). Numerical Simulation of Gas Flow in Artificial Fracture Coal by Three-Dimensional Reconstruction Based on Computed Tomography. J. Nat. Gas Sci. Eng. 34, 823–831. doi:10.1016/j.jngse.2016.07.039
Wang, H., Du, Y., Wei, X., and He, X. (2019). An Experimental Comparison of the spray Performance of Typical Water-Based Dust Reduction media. Powder Technol. 345, 580–588. doi:10.1016/j.powtec.2019.01.032
Wang, H., He, S., Xie, G., Chen, X., and Qin, B. (2018). Study of the Mechanism by Which Magnetization Reduces Dust Suppressant Usage. Colloids Surf. A: Physicochemical Eng. Aspects 558, 16–22. doi:10.1016/j.colsurfa.2018.08.034
Wang, H., Wang, C., and Wang, D. (2017). The Influence of Forced Ventilation Airflow on Water spray for Dust Suppression on Heading Face in Underground Coal Mine. Powder Technol. 320, 498–510. doi:10.1016/j.powtec.2017.07.069
Wang, Y., Luo, G., Geng, F., Li, Y., and Li, Y. (2015). Numerical Study on Dust Movement and Dust Distribution for Hybrid Ventilation System in a Laneway of Coal Mine. J. Loss Prev. Process Industries 36, 146–157. doi:10.1016/j.jlp.2015.06.003
Xiao, D., Li, X., Yan, W., and Fang, Z. (2019). Experimental Investigation and Numerical Simulation of Small-Volume Transverse-Flow Air Curtain Performances. Powder Technol. 352, 262–272. doi:10.1016/j.powtec.2019.04.063
Xiu, Z., Nie, W., Yan, J., Chen, D., Cai, P., Liu, Q., et al. (2020). Numerical Simulation Study on Dust Pollution Characteristics and Optimal Dust Control Air Flow Rates during Coal Mine Production. J. Clean. Prod. 248, 119197. doi:10.1016/j.jclepro.2019.119197
Xu, C., Nie, W., Liu, Z., Peng, H., Yang, S., and Liu, Q. (2019). Multi-factor Numerical Simulation Study on spray Dust Suppression Device in Coal Mining Process. Energy 182, 544–558. doi:10.1016/j.energy.2019.05.201
Xu, G., Chen, Y., Eksteen, J., and Xu, J. (2018). Surfactant-aided Coal Dust Suppression: A Review of Evaluation Methods and Influencing Factors. Sci. Total Environ. 639, 1060–1076. doi:10.1016/j.scitotenv.2018.05.182
Yang, S., Nie, W., Lv, S., Liu, Z., Peng, H., Ma, X., et al. (2019). Effects of Spraying Pressure and Installation Angle of Nozzles on Atomization Characteristics of External Spraying System at a Fully-Mechanized Mining Face. Powder Technol. 343, 754–764. doi:10.1016/j.powtec.2018.11.042
Yin, S., Nie, W., Guo, L., Liu, Q., Hua, Y., Cai, X., et al. (2020). CFD Simulations of Air Curtain Dust Removal Effect by Ventilation Parameters during Tunneling. Adv. Powder Technol. 31 (6), 2456–2468. doi:10.1016/j.apt.2020.04.008
Yin, W., Zhou, G., and Gao, D. (2019). Simulation Analysis and Engineering Application of Distribution Characteristics about Multi-Stage Atomization Field for Cutting Dust in Fully Mechanized Mining Face. Adv. Powder Technol. 30 (11), 2600–2615. doi:10.1016/j.apt.2019.08.007
Yu, H., Cheng, W., Peng, H., and Xie, Y. (2018). An Investigation of the Nozzle's Atomization Dust Suppression Rules in a Fully-Mechanized Excavation Face Based on the Airflow-Droplet-Dust Three-phase Coupling Model. Adv. Powder Technol. 29 (4), 941–956. doi:10.1016/j.apt.2018.01.012
Yu, H., Cheng, W., Wu, L., Wang, H., and Xie, Y. (2017). Mechanisms of Dust Diffuse Pollution under Forced-Exhaust Ventilation in Fully-Mechanized Excavation Faces by CFD-DEM. Powder Technol. 317, 31–47. doi:10.1016/j.powtec.2017.04.045
Zhang, G., Sun, B., Song, S., Wang, H., and Zhou, G. (2021a). CFD Comparative Analysis on the Pollution Characteristics of Coal Dust under Turbulent Airflow from Coal Cutting in the Fully Mechanized Mining Face. Process Saf. Environ. Prot. 146, 515–530. doi:10.1016/j.psep.2020.11.044
Zhang, G., Zhou, G., Song, S., Zhang, L., and Sun, B. (2020). CFD Investigation on Dust Dispersion Pollution of Down/upwind Coal Cutting and Relevant Countermeasures for Spraying Dustfall in Fully Mechanized Mining Face. Adv. Powder Technol. 31 (8), 3177–3190. doi:10.1016/j.apt.2020.06.009
Zhang, L., Zhou, G., Ma, Y., Jing, B., Sun, B., Han, F., et al. (2021b). Numerical Analysis on Spatial Distribution for Concentration and Particle Size of Particulate Pollutants in Dust Environment at Fully Mechanized Coal Mining Face. Powder Technol. 383, 143–158. doi:10.1016/j.powtec.2021.01.039
Zhang, Q., Zhou, G., Qian, X., Yuan, M., Sun, Y., and Wang, D. (2018). Diffuse Pollution Characteristics of Respirable Dust in Fully-Mechanized Mining Face under Various Velocities Based on CFD Investigation. J. Clean. Prod. 184, 239–250. doi:10.1016/j.jclepro.2018.02.230
Zhang, X., Liu, W., Jiang, D., Qiao, W., Liu, E., Zhang, N., et al. (2021c). Investigation on the Influences of Interlayer Contents on Stability and Usability of Energy Storage Caverns in Bedded Rock Salt. Energy 231, 120968. doi:10.1016/j.energy.2021.120968
Keywords: coal dust, different cutting positions, dedusting-air duct layout, dust migration, CFD
Citation: Zhang H, Liu R, Chun J, Xue Q and Fan J (2022) Study on Optimization of the Dedusting Air Duct Layout in Coal Mine Roadway. Front. Earth Sci. 10:855438. doi: 10.3389/feart.2022.855438
Received: 15 January 2022; Accepted: 23 February 2022;
Published: 25 March 2022.
Edited by:
Alexandre Chemenda, UMR 7329 Géoazur (GEOAZUR), FranceReviewed by:
Yunzhong Jia, Uppsala University, SwedenCopyright © 2022 Zhang, Liu, Chun, Xue and Fan. This is an open-access article distributed under the terms of the Creative Commons Attribution License (CC BY). The use, distribution or reproduction in other forums is permitted, provided the original author(s) and the copyright owner(s) are credited and that the original publication in this journal is cited, in accordance with accepted academic practice. No use, distribution or reproduction is permitted which does not comply with these terms.
*Correspondence: Rong Liu, Y3F1X2xpdXJvbmdAMTYzLmNvbQ==; Jinyang Fan, MTQ5MDI2NjczQHFxLmNvbQ==
Disclaimer: All claims expressed in this article are solely those of the authors and do not necessarily represent those of their affiliated organizations, or those of the publisher, the editors and the reviewers. Any product that may be evaluated in this article or claim that may be made by its manufacturer is not guaranteed or endorsed by the publisher.
Research integrity at Frontiers
Learn more about the work of our research integrity team to safeguard the quality of each article we publish.