 Yuzhong Liao
 Yanguang Liu
 Feng Liu1,2
 Shuaichao Wei
- 1Institute of Hydrogeology and Environmental Geology, Chinese Academy of Geological Sciences, Shijiazhuang, China
- 2Technology Innovation Center for Geothermal and Hot Dry Rock Exploration and Development Ministry of Natural Resources, Shijiazhuang, China
Jinggangshan City, which is located in the southwestern part of Jiangxi Province, is rich in hot springs. However, lack of geothermal studies has limited the exploration and utilization of the geothermal resources in this city. This study estimated the terrestrial heat flow in Jinggangshan City through well logging and analyses of rock thermal conductivity and heat production. Based on this and the surrounding geoscience transect and the Crust 1.0 model, this study constructed a one-dimensional lithospheric thermal structure by solving the steady-state heat conduction equation. Furthermore, the deep temperature distribution in Jinggangshan City was obtained to better understand the geodynamic condition of the geothermal resources in this city. The results show that the heat flow in this city is around 83.52 mW/m2, indicating the high heat background for the formation of geothermal resources. According to the lithospheric thermal structure of Jinggangshan City, the mantle contributes more to the terrestrial heat flow (qm/qc > 1) than the crust. The temperature of the Mohorovicic discontinuity (the Moho) is 671.7°C, which is consistent with that below the Tanlu deep fault (620–690°C). Moreover, the calculated depth of the Curie surface (585°C) is 27 km, which is consistent with the Curie isotherm depth estimated from aeromagnetic data. This consistency verifies the validity of the lithospheric thermal structure of Jinggangshan City constructed in this study. In summary, the high heat background plays an important role in the formation of geothermal resources in Jinggangshan City.
1 Introduction
Lithospheric thermal structure plays a significant role in the potential assessment and exploration of geothermal energy (Sclater et al., 1980; Davies and Davies, 2010; Liu et al., 2016; Li et al., 2017). It integrates information on crustal and mantle heat flow, ground temperature distribution, and thermal conductivity and heat productivity of rocks (Liu et al., 2017; Zhang et al., 2018). Terrestrial heat flow density (also referred to as heat flow) is a key parameter used to constrain the lithospheric thermal structure (Jaupart and Mareschal, 2015; Jiang et al., 2019; Prol-Ledesma and Moran-Zenteno, 2019). It is the heat flux per unit time per unit area flowing from the interior to the surface of the Earth (unit: mW/m2 (Furlong and Chapman, 2013; Wang et al., 2015) and comprises crustal and mantle heat flow (Jaupart and Mareschal, 2015; Liu et al., 2021).
Jiangxi Province, which lies in the geothermal district of Southeast China, is rich in hot springs ((Zhu and Zhu, 1992). The geothermal resources in this province are predominantly controlled by faults and have middle–low temperatures (Xiao et al., 2018; Li, 2019). Since heat flow distribution is closely related to geological structures, previous heat flow values in Jiangxi Province were discussed based on the tectonic setting (Hu et al., 1992; Li et al., 1992; Jiang et al., 2019). For example, the heat flow in deep structural variation zones has a high average of 71.9 (n = 14) mW/m2, whereas that in uplifts of the upper mantle has a similar average of 70.2 mW/m2 but a relatively wide range of 56.4–98.8 mW/m2, and that in depressions of the upper mantle (only that in Xiushui, northeastern Jiangxi Province has been measured) is 57.8 mW/m2 (Figure 1). Therefore, deep structural variation zones have the highest heat flow background, with an average of 71.9 mW/m2, which is higher than that of continental China (60.4 ± 12.3 mW/m2 (Jiang et al., 2019)). On the other hand, the geothermal resources in Jiangxi Province, which mostly consists of uplifts and mountains, are predominantly controlled by the distribution of the NE–NNE-trending faults (Zhang, 2017; Li, 2019). The southeastern part of Jinggangshan City is intersected by the Huang’ao Fault—a deep NE-trending fault (Figure 2). Although Jinggangshan City in southwestern Jiangxi Province is located in the depression of the upper mantle, its location in an NE deep fault indicates high potential of high heat flow background (Li et al., 1992). Thus, the southeastern part of Jinggangshan City has great potential for the formation of geothermal resources (Zhu, 2007; Yang et al., 2018). Furthermore, Huang’ao Fault in Jinggangshan City belongs to Tanlu (Tancheng-Lujiang) deep fault (>3,000 km), extending NE along eastern China (Lin, 1992). The Tanlu fault, which experienced multistage deformation events since the Mesozoic, is inferred to be a channel for the percolation of melt and fluid and controls the lithosphere evolution in eastern China (Deng et al., 2013). As exhibited in Figure 2, massive Yanshanian granite (Mesozoic) is distributed along the Huangao fault in the southern part of Jinggangshan City (Fan et al., 2014). The study of the lithospheric thermal structure in Jinggangshan City, therefore, shed light on the heat flow anomaly led by Tanlu fault and its impact on the formation of geothermal resource.
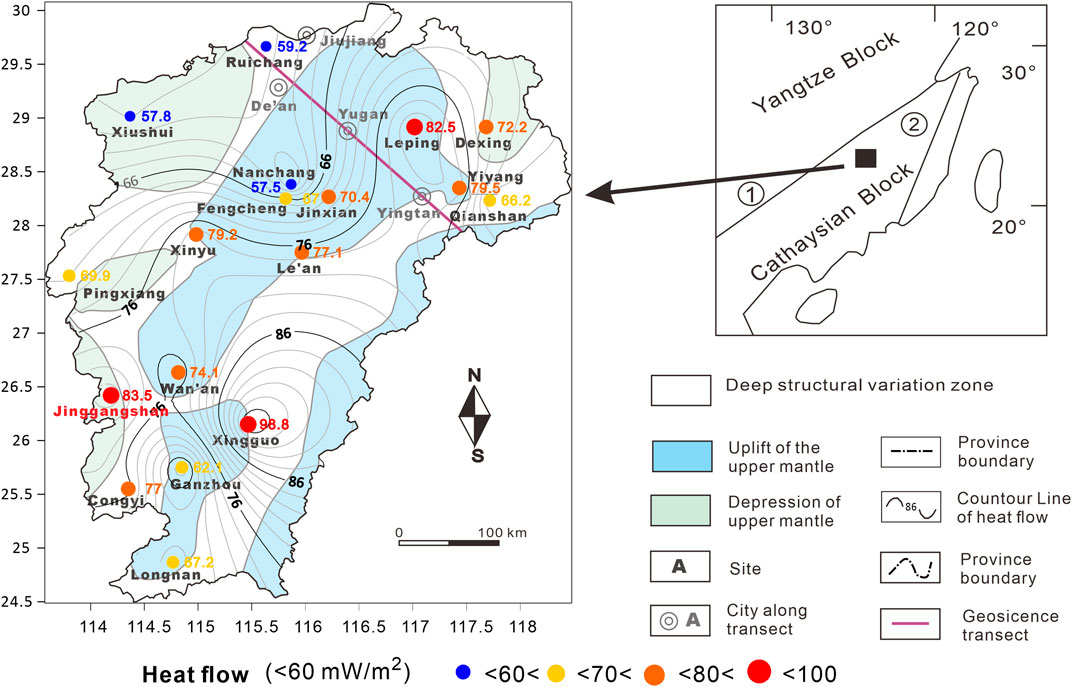
FIGURE 1. Terrestrial heat flow distribution and geotectonic map of Jiangxi Province (modified after Li et al. (1992) and Shen et al. (2009)).
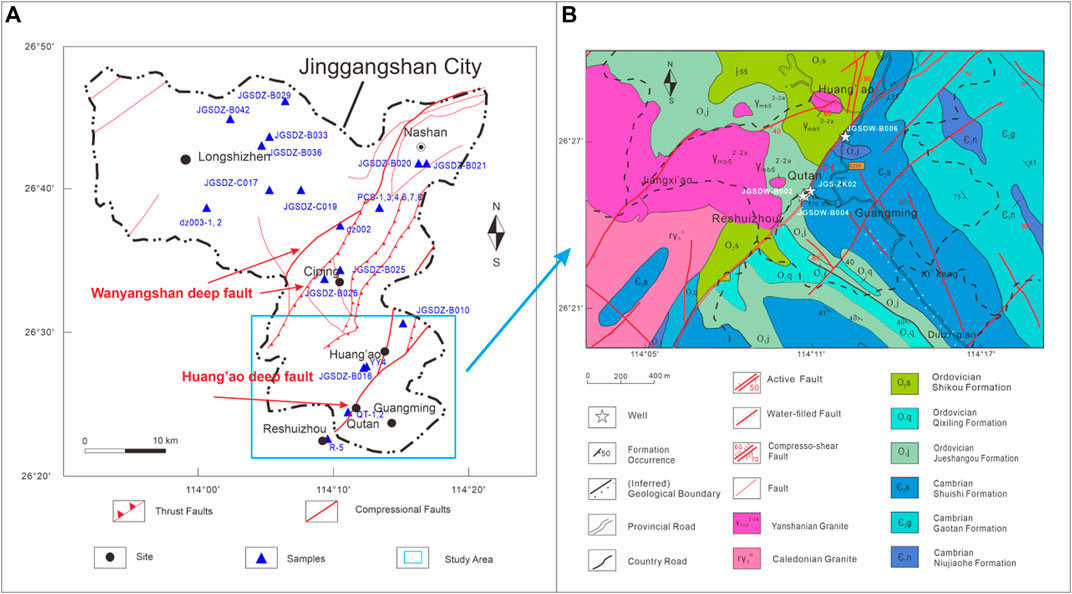
FIGURE 2. Schematic geological map of Jinggangshan area and distribution of sampling locations.
This study focuses on Huang’ao and Qutan villages in the southeastern part of Jinggangshan City. The heat flow in the study area was acquired through well temperature logging and analyses of rock thermal properties and heat generation rates. Furthermore, by combining the geophysical studies of surrounding areas, the crustal thermal structure of Jinggangshan City was analyzed. The results provide insights into the genesis of the geothermal resources and have important implications for geothermal exploration in Jiangxi Province.
2 Geological Setting
Jinggangshan City is located in the middle part of the Caledonian South China orogenic belt bordering the Neoproterozoic Jiangnan Orogenic Belt (Figure 1; Shen et al. (2009)). As shown in Figure 2, Huang’ao and Qutan villages, which are situated in the southeastern part of Jinggangshan City, are intersected by the regional deep Huang’ao fault (Fan et al., 2014; Liu et al., 2018). The Huang’ao deep fault is an NE-trending (∼45°C) compressional fault with a dip angle of 60°. Its width decreases from the southwest (Qutan village) to the northeast (Huang’ao village), as shown in Figure 2. Several types of alteration have extensively developed in this fault zone, including siliconization, schistosity, mylonitization, and brecciation. The Huang’ao deep fault is a geological boundary between the granites on its west side and the metamorphic rocks on its east side. The granites comprise Caledonian and Yanshanian granites (Figure 1). The Caledonian granites are grayish-white, medium-to-fine-grained equigranular biotite granites, containing quartz (∼35 vo1%), plagioclase (∼30 vol%), alkali feldspar (∼25 vo1%), and biotite (∼5 vol%). The Yanshanian granites are grayish-white, fine-grained, equigranular two-mica granites with a mineral composition similar to that of the Caledonian granites. The strata in the study area are dominated by Precambrian and Ordovician metamorphic rocks, which are subjected to strong folding (Zhu, 2007; Yang et al., 2018). The Precambrian strata mainly consist of the Niujiaohe (Є1n), Gaotan (Є2g), and Shuishi (Є3s) formations. The Niujiaohe formation comprises feldspar–quartz sandy slates, metamorphic sandstones, lamellate silicalites, and organic carbon-bearing phyllites. The Gaotan formation comprisesmedium-to-fine-grained sandy slates and carbonaceous phyllites. The Shuishi formation mostly comprises interbeds consisting of metamorphic feldspar–quartz slates and metamorphic sandstones, with some lenticular limestones at the top. Ordovician strata include the Jueshangou, Qixiling, and Shikou formations. The Jueshangou formation comprises metamorphosed (sandy-silt) slates, the Qixiling formation consists of sericite-slate and feldspar–quartz sandstones, and the Shikou formation includes metamorphic slates and sandstones.
3 Methods
3.1 Measurement of the Terrestrial Heat Flow
Instead of direct measurement, the surface terrestrial heat flow was calculated by multiplying the geothermal gradient by the thermal conductivity of corresponding rocks (Jaupart and Mareschal, 2015; Wang et al., 2015).
3.1.1 Temperature Measurement of Well
The temperature of well JGS-ZK02 was measured using the well logging system (PSJ-2) equipped with a well temperature probe PS2512, which has a measurement range of 0–65°C and an accuracy of 0.1°C. The temperature was measured according to the Chinese industrial standard DZ/T0080-2010 Coal Geophysical Logging Specification. To ensure that the well temperature was in a (quasi-) steady state, the well temperature was repeatedly logged at a time interval of 12 h after its deviation was less than 0.5°C following the completion of drilling.
The temperature measurement of wells in Qutan and Huang’ao villages was carried out using WD-016A-embedded sensors and TD-016C data acquisition instruments. The embedded sensors have a temperature measurement range of -50–100°C and an accuracy of 0.1°C at 0–80 and 0.5°C at 50–0°C and 81–125°C. These temperature sensors (diameter: 11 mm) were implanted into a PVC cable (diameter: 12 mm) at an interval of 5 m (distance 0–50 m) or 10 m (>50 m).
3.1.2 Thermal Conductivity
Thermal conductivity (unit: W/(mK)) is a measure of a given material’s ability to transfer heat, representing the transferred heat per unit area at per unit time when the temperature gradient is 1°C per unit length (Wang et al., 2015). The thermal conductivities of the rock samples were measured using thermal conductivity scanning (TCS) in the East China University of Technology, with a measurement range of 0.2–25 W/(mK) and an accuracy of 3%.
Anand et al. (1973) suggested that thermal conductivity would increase with a decrease in temperature. The temperature at the burial depth of rocks before sampling was probably different from room temperature (25°C), at which the thermal conductivity was measured. Therefore, the measured thermal conductivity at room temperature should be corrected according to the in situ temperature.
Regarding exposed rocks or rocks buried at a relatively shallow depth that could be obtained by drilling, the measured temperatures should be corrected according to their in situ temperature using the following empirical formulas (Sass et al., 1992):
where T denotes the in situ temperature of rock samples and K (0), K (25), and K(T) denote the thermal conductivity values of rock samples at 0°C, 25°C, and the in situ temperature, respectively.
For the rocks buried at a depth that could not be acquired through drilling, their thermal conductivity was corrected using the following formula (Cermak et al., 1990; Zang et al., 2002; Xu et al., 2011):
where k0 is the thermal conductivity at the top surface of each rock stratum; c is 0.0015; z is the depth of each rock stratum; and b is 0.0015, 0.0001, and 0.0001 for the upper, middle, and lower crust, respectively.
3.2 Lithospheric Thermal Structure
3.2.1 Lithospheric Thermal Structure
The crust is generally divided into four layers: a sedimentary layer, and an upper, middle, and lower crust. Its lower boundary—the Moho—is the contact surface between the lower crust and the mantle.
As the primary seismic wave (P wave, Vp) is distinct in each layer due to different geophysical characteristics, the distribution of Vp in the crust provides evidence of the contact surface between adjacent crust layers and crust structure. In the case where no geophysical analysis of an area has been conducted, the model of Crust 1.0 (Laske et al., 2013) is effective in establishing the crust structure in the area (Liu et al., 2021). Crust 1.0 is a global crustal model specified on a 1 × 1 degree grid and can be used for compiling global artificial seismic data. It provides the crustal structure and related parameters of each crust layer, such as Vp, density and boundary depths.
Since no geophysical study has been carried out in Jinggangshan City, Crust 1.0 is an effective tool for establishing the crust structure of the city. Nevertheless, the Crust 1.0 model has low resolution. To better constrain the crust structure, the geophysical information from a surrounding geoscience transect was collected. The geoscience transect from Menyuan in Qinghang Province to Ningde in Fujian Province (perpendicular distance: ∼340 km) is similar to that of Jinggangshan City (Editorial Committee of Geoscience Transect, 1994; Wang et al., 1995). Though this geoscience transect is a little far away from the study area, it provides more accurate geophysical information.
3.2.2 Vertical Distribution of Heat Flow
The surface heat flow (q0), which is calculated according to the thermal gradient and thermal conductivity (as mentioned in Section 3.1), consists of the crustal heat flow (qc) and mantle heat flow (qm).
The crustal heat flow is the sum of the radioactive heat generated by the heat production elements in the crust (U, Th, and K). The layer-stripping method is usually used to quantitatively estimate the radioactive heat generated in each crust layer and the whole crustal heat flow. The calculation formulas are as follows:
where qi is the radioactive heat flow in each crust layer; Di is the thickness of each crust layer; Ai is the heat production rate of each crust layer; and qc is the crustal heat flow.
The heat production rate (A) is traditionally calculated based on the U, Th, and K concentrations of representative rock samples using the following formula (Rybach and Buntebarth, 1981; Artemieva et al., 2017):
where A is the heat production rate (μW/m3); ρ is rock density (g/cm3); and CU (ppm), CK (ppm), and CTh (ppm) are the concentrations of U, Th, and K, respectively.
The U, Th, and K contents of rock samples were determined by the Changsha Uranium Geology Research Institute. The K content was measured using a flame atomic absorption spectrophotometer, with a lower detection limit of 0.17%, and the U and Th contents were analyzed using the LA-ICP-MS method, with lower detection limits of 0.003 ug/g and 0.8 ug/g, respectively.
However, this method is not suitable for rocks at depths that are difficult to acquire through drilling. The heat production rate of these rocks can be estimated based on the functional relationship between Vp and Ai (Rybach and Buntebarth, 1984):
where A is the heat production rate (μW/m3) and Vp is the primary seismic wave (P wave). In this formula, the in situ seismic velocities should be corrected according to laboratory conditions (100 MPa, room temperature) using the method proposed by Rybach and Buntebarth (1984).
The surface heat flow (q0) minus the crustal heat flow (qi) is the mantle heat flow (qm). The mantle heat flow and the qi/qm ratio are important for understanding deep geodynamic processes (Wang et al., 2015; Zhang et al., 2018).
3.2.3 Deep Temperature Distribution
Well logging can be used to directly measure the temperature of shallow strata that can be unearthed by boreholes. By contrast, the temperature of deep strata should be calculated using the following one-dimensional steady-state heat conduction formula (Lachenbruch, 1970; Liu et al., 2021):
where Tz (°C) is the temperature at depth z (m); T0 and q are the temperature and heat flow (mW/m2) at the top of each crust layer, respectively; and D, k (W/(mK)), and A are the thickness (km), thermal conductivity (µW·m−3), and heat production rate of each crust layer, respectively.
4 Results and Discussion
4.1 Terrestrial Heat Flow
4.1.1 Temperature Measurement and Geothermal Gradient
Temperature logging has been conducted for wells JGSDW-B006 and JGS-ZK02 in Huang’ao village and wells JGSDW-B002 and JGSDW-B004 in Qutan village (Table 1). The results are shown in Figure 2. Data fitting was completed using the linear least-squares regression method. The slope of the fitting line was numerically equal to the corresponding temperature gradient (Figure 3 and Table 2). Well JGSDW-B006 had the highest thermal gradient of 26°C·km−1, while well JGS-ZK02 had the lowest thermal gradient of 7.3°C·km−1. The geothermal gradients of the two wells in Qutan village were 9.3°C·km−1 and 13.1°C·km−1.

FIGURE 3. Temperature–depth profiles for the wells in Huang’ao and Qutan villages.
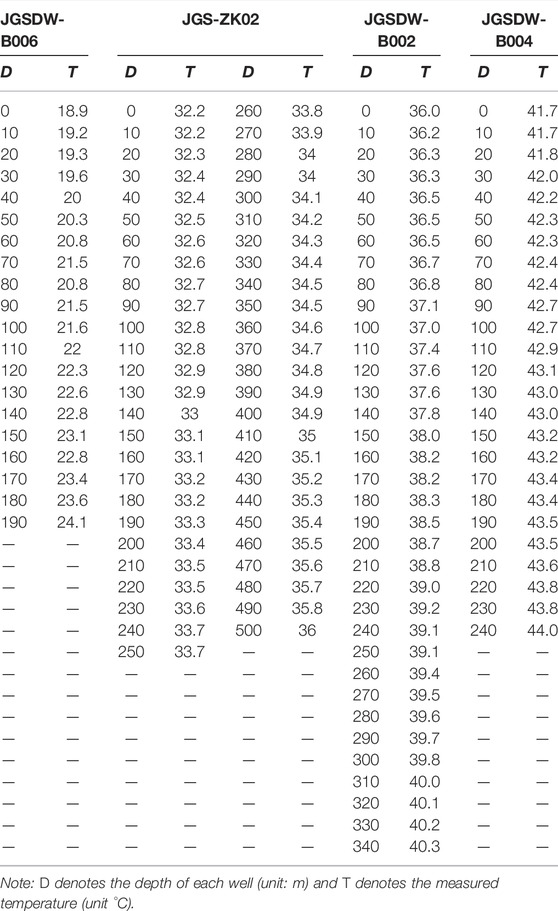
TABLE 1. Temperature logging of geothermal wells in the study area.
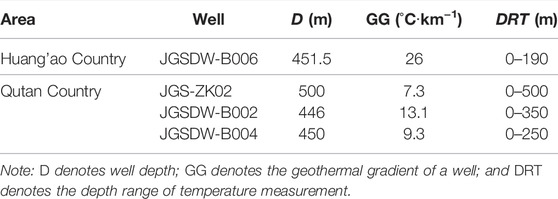
TABLE 2. Geothermal gradients and their depth ranges of temperature measurement.
4.1.2 Thermal Conductivity
Five rock samples were collected in total to analyze thermal conductivity. These samples consisted of granites, metamorphic sandstones, slates, limestones, and quartz sandstones (Figure 3).
As shown in Table 3, the metamorphic sandstones had the highest thermal conductivity of 2.75–3.53 W/(mK) (average: 3.79 W/(mK)). Compared with metamorphic sandstones, the thermal conductivity of the Caledonian granites had a similar average of 3.42 W/(mK) but a relatively wider range of 2.06–5.15 W/(mK). The Yanshanian granites had the lowest thermal conductivity, with an average of 2.68 W/(mK). The limestones, sandstones, and slates had approximate thermal conductivity, with an average of 2.77 W/(mK), 2.86 W/(mK), and 2.72 W/(mK), respectively.
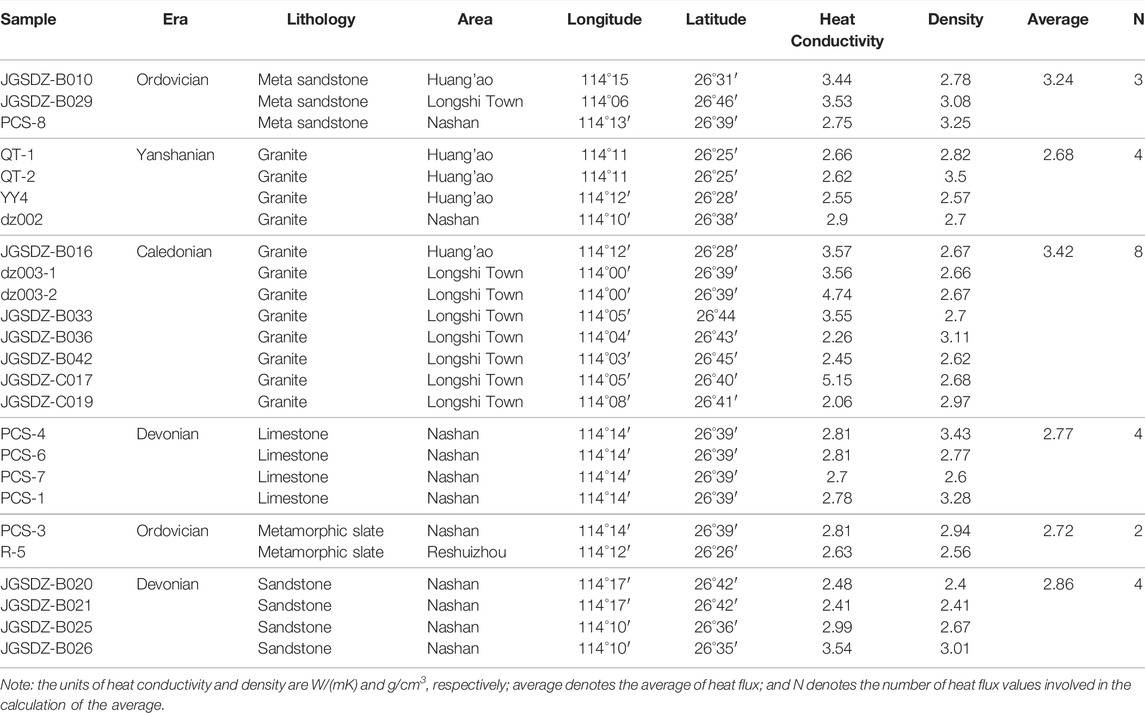
TABLE 3. Heat conductivity of rocks in the study area.
4.1.3 Surface Heat Flow
The heat flow was calculated based on the thermal gradient and thermal conductivity of the representative rocks (Table 4).
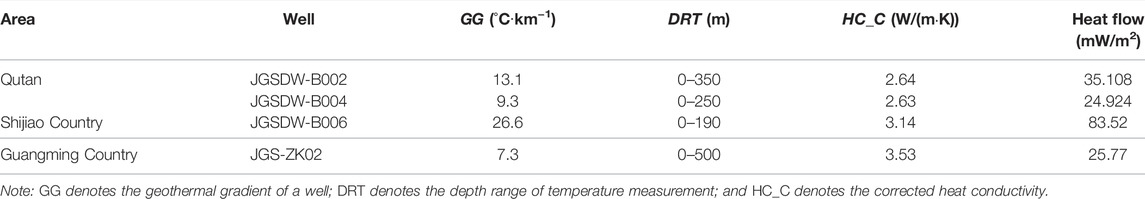
TABLE 4. Calculated heat flow of each well in the study area.
As presented in Figure 3 and Table 4, the strata at valid depths of 0–190 m mainly consisted of metamorphic sandstones and slates, whose corrected thermal conductivity determined using formulas (1) and (2) was 3.8 W/(mK) and 2.73 W/(mK), respectively. By combining their thicknesses, their weighted thermal conductivity was estimated to be 3.57 W/(mK). The surface heat flow of well JGSDW-B006, which equaled the product of the geothermal gradient (26°C·km−1) and the weighted thermal conductivity, was calculated to be 83.52 mW/m2. This surface heat flow is much higher than the average heat flow (60.4 ± 12.3 mW/m2) of continental China. This finding indicates a high geothermal background in the study area, which is genetically associated to the formation of geothermal resources. In addition, the surface heat flow of wells JGSDW-B002, JGSDW-B004, and JGS-ZK02 was all low (24.9–35.1 mW/m2), which was attributable to the disturbance of vertical water movement (Fan et al., 2014; Wang et al., 2015).
The surface heat flow value of well JGSDW-B006 (83.52 mW/m2) is plotted in Figure 1, with the others in Jiangxi province. As shown in Figure 1, Jinggangshan City is located in the depression of the upper mantle where the heat flow background is expected to be low; however, the measured heat flow value (83.52 mW/m2) there ranks second in all the measured values in Jiangxi Province. It is suggested that Huang’ao deep fault (NE trending) plays a key role in the high heat flow background. This deep fault is probably a channel of heat transfer from the heat source at a depth.
4.2 Crustal and Mantle Heat Flow
4.2.1 Boundaries of the Lithospheric Thermal Structure
The geoscience transect from the Menyuan area in Qinghai Province to the Ningde area in Fujian Province is shown in Figure 4. Jinggangshan City is located to the east of the Tanlu (Tancheng-Lujiang) deep fault, where the boundaries of the upper and the middle crusts have blurred due to the strong thrusting process (Editorial Committee of Geoscience Transect C E a E, 1994; Wang et al., 1995). Therefore, the crust was divided into a sedimentary layer and an upper–middle and lower layer. Based on the distribution of the Vp as shown in Figure 4, the depth of the interface between the middle and lower crusts in the study area was determined to be 20.97 km (Table 5). Similarly, the depth of the Moho was 31.97 km, and the lower boundary of the sedimentary layer was 0.62 km.
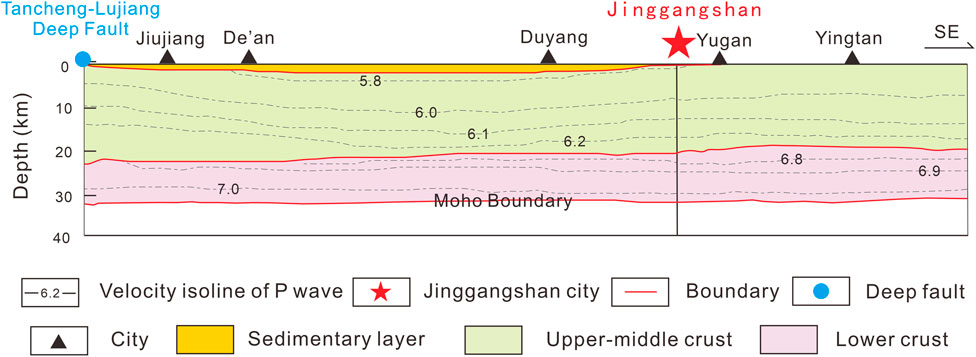
FIGURE 4. Distribution of P-wave velocity in the geological transect from Menyuan to Ningde Zuoyi (modified after the Editorial Committee of Geoscience Transect C E a E, (1994); Wang et al. (1995); the location of the section line is defined in Figure 1).
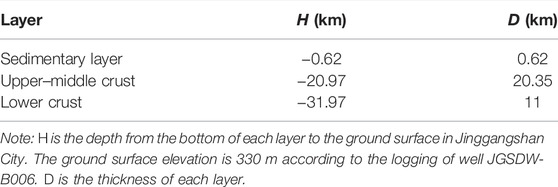
TABLE 5. Geothermal structure in Jinggangshan City.
Based on the Crust 1.0 model, the depth of the interface between the middle and lower crusts was 22.06 km and the Moho depth was 32.9 km. By averaging the results calculated based on the Vp distribution and the Crust 1.0 model, the final depth of the interface between the middle and lower crusts was 21.52 km and the final depth of the Moho surface was 32.44 km (Table 7).
4.2.2 Layer-Stripping Calculation of Heat Flow
As mentioned in Section 3.2.2, the layer-stripping method can be used to calculate the crustal and mantle heat flow. The three layers of the crust (i.e., the sedimentary layer, the upper-middle crust, and the lower crust) were further divided into several portions according to the well logging (Figure 3) and the isolines of P-wave velocity (Vp; Figure 4). The thickness (Di) represents the vertical distance between the top and bottom isolines of Vp.
For the sedimentary layer (thickness: 620 m), the well logging of well JGSDW-B006 (depth: 500 m) showed that this layer mainly consisted of slates and metamorphic sandstones (Fan et al., 2014), with the former located at a depth of < 62 m and the latter distributed at a depth of >62 m. Therefore, the sedimentary layer was subdivided into a slate layer and a metamorphic sandstone layer. The heat production rates (Ai) of these two sublayers were obtained based on the U, Th, and K contents of rock samples. Eleven samples were collected using a hammer to analyze the thermal conductivity (Table 6). The average heat production of the metamorphic slates and metamorphic sandstones was 3.63 μW/m3 and 4.17 μW/m3, respectively.
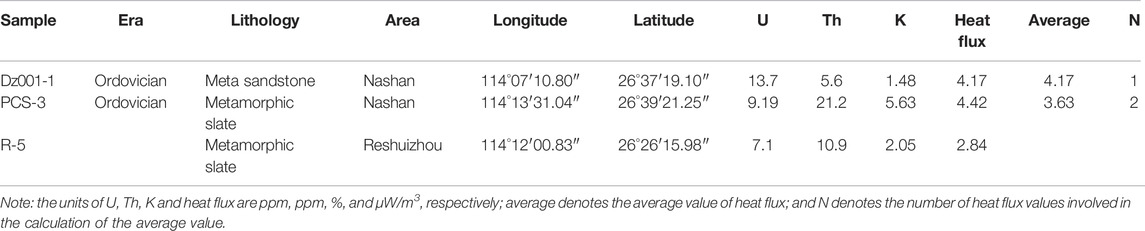
TABLE 6. Heat production of rocks in the study area.
Regarding the upper–middle crust and the lower crust, Vp-layer was the average velocity of the top and bottom isolines of Vp (Table 7). The heat flow on the top surface of each layer was calculated using formulas (4), (5), and (7). It is noteworthy that the Vp-layer of the middle and lower crust was corrected by multiplying the correction factor of 1.01 according to the laboratory conditions (Rybach and Buntebarth, 1984). The heat flow of the mantle and crust was 45.63 mW/m2 and 37.89 mW/m2, respectively. Therefore, the qc/qm ratio was less than 1 (0.83), suggesting a hot-mantle–cold-crust type of lithospheric thermal structure. In other words, the heat flow mainly originated from the heat contribution of the mantle. Based on Table 7, a conceptual model is constructed for the lithospheric thermal structure in the study area (Figure 5). As shown in this model, the values of heat flow and heat production rate in each layer could be easily identified and their changes between each other. The heat production and heat flow values in the upper–middle crust is obviously higher than those of the lower crust. Their values have a decreasing trend with increasing depth.

TABLE 7. Geoscience transect around the study area.
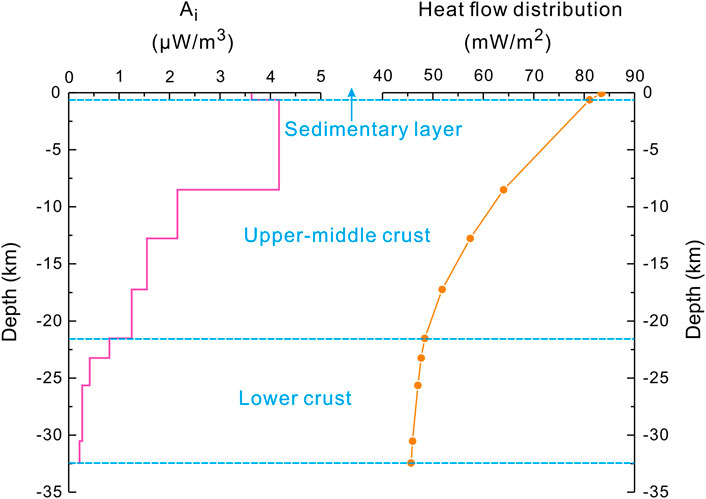
FIGURE 5. Conceptual model constructed for the lithospheric thermal structure in the study area.
4.2.3 Deep Temperature Distribution
According to Fan et al. (2014), the constant temperature zone in Jinggangshan City (depth: 20 m) has a temperature of 15°C. The temperature below the constant temperature zone was thereby calculated using formulas (1), (2), (3), and (8). As shown in Table 7, the crust was divided into 10 layers to estimate the deep temperature distribution. The calculated temperature of the Moho was 671.7°C, which is consistent with the estimated temperature of the Moho below the Tanlu deep fault (620–690°C (He et al., 2006)).
The Curie temperature isotherm is the basal surface of the magnetite crust consisting of magnetitic minerals and corresponds to the temperature at which magnetic minerals become paramagnetic (Xiong et al., 2016; Yu-fei et al., 2021). Ilmenites and pyrrhotites lose their ferromagnetism at a temperature of 300–350°C. The demagnetized temperature of magnetite is 585°C (Ross et al., 2006), while that of Co–Ni–Fe–bearing minerals is up to 760–800°C. The Curie temperature isotherm is an important parameter of the lithospheric thermal structure since it can be used to estimate the temperature at a depth (Mayhew, 1985; Ross et al., 2006; Yang, 2015). It is a supplement to heat flow in constructing the lithospheric thermal structure. The Curie point isotherm in China (Xiong et al., 2016) shows that the Curie surface in the study area is at a depth of 19–30 km. Based on the deep temperature distribution of the lithospheric thermal structure listed in Table 7, the Curie surface depth corresponding to the demagnetized temperature of magnetite (585°C) was estimated to be 27 km using the interpolation method. The consistency of the Curie surface depth further dominates the validity of the lithospheric thermal structure and deep temperature distribution in Jinggangshan City.
5 Conclusion
This study is the first comprehensive investigation of the lithospheric thermal structure in Jinggangshan City, contributing to a better understanding of the genesis and exploitation potential of the geothermal resources therein. Based on the abovementioned analyses, the following conclusions can be drawn:
1) The heat flow of Jinggangshan City is 83.52 mW/m2, which is much higher than the average heat flow (60.4 ± 12.3 mW/m2) of continental China. The high heat flow indicates a high geothermal background in the study area.
2) As estimated from the lithospheric thermal structure of Jinggangshan City, qc and qm are 37.89 mW/m2 and 45.63 mW/m2, respectively. Therefore, the qc/qm ratio is less than 1, indicating that the terrestrial heat flow in Jinggangshan City mainly originates from the mantle.
3) As shown in the deep temperature distribution calculated using the one-dimensional steady-state equation, the temperature of the Moho in Jinggangshan City is 671.7°C, which is consistent with the temperature of the Moho below the Tanlu deep fault. Furthermore, the calculated depth of the Curie temperature isotherm in Jinggangshan City is 27 km, which is consistent with the depth estimated based on aeromagnetic data. The consistency verifies the validity of the lithospheric thermal structure established in this study.
4) The high heat flow background, which mainly originates from the heat supply of the mantle, contributes significantly to the formation of the geothermal resources in Jinggangshan City.
Data Availability Statement
The original contributions presented in the study are included in the article/Supplementary Material, further inquiries can be directed to the corresponding author.
Author Contributions
YL: ideas, field investigation, data analysis, picture drawing, creation of models, manuscript writing, and revision; YL: ideas, field investigation, review, and financial support; FL: field investigation, review, and financial support; SW: field investigation; and HD: picture drawing.
Funding
This work was financially supported by the China Geological Survey Project (DD20190128, 20190505, and DD20160190), the Basal Science Research Fund from the Institute of Hydrogeology and Environmental Geology (Grant Nos. SK202008 and SK202104), the S&T Program of Hebei China (No. 20374201D), and the Natural Science Foundation of Hebei Province China (No. D2019330003).
Conflict of Interest
The authors declare that the research was conducted in the absence of any commercial or financial relationships that could be construed as a potential conflict of interest.
Publisher’s Note
All claims expressed in this article are solely those of the authors and do not necessarily represent those of their affiliated organizations, or those of the publisher, the editors, and the reviewers. Any product that may be evaluated in this article, or claim that may be made by its manufacturer, is not guaranteed or endorsed by the publisher.
Acknowledgments
The authors would like to thank Xiaoxue Yan, Haonan Gan, Lingxia Liu, Ruoxi, Yuan, Liu Tao, and Ronghua Hu for their assistance in field work.
References
Anand, J., Somerton, W. H., and Gomaa, E. (1973). Predicting Thermal Conductivities of Formations from Other Known Properties. Soc. Petroleum Eng. J. 13, 267–273. doi:10.2118/4171-PA
Artemieva, I. M., Thybo, H., Jakobsen, K., Sørensen, N. K., and Nielsen, L. S. K. (2017). Heat Production in Granitic Rocks: Global Analysis Based on a New Data Compilation Granite2017. Earth-Science Rev. 172, 1–26. doi:10.1016/j.earscirev.2017.07.003
Cermak, V., Bodri, L., Rybach, L., and Buntebarth, G. (1990). Relationship between Seismic Velocity and Heat Production: Comparison of Two Sets of Data and Test of Validity. Earth Planet. Sci. Lett. 99 (1), 48–57. doi:10.1016/0012-821X(90)90069-A
Davies, J. H., and Davies, D. R. (2010). Earth's Surface Heat Flux. Solid earth. 1 (1), 5–24. doi:10.5194/se-1-5-2010
Deng, Y., Fan, W., Zhang, Z., and Badal, J. (2013). Geophysical Evidence on Segmentation of the Tancheng-Lujiang Fault and its Implications on the Lithosphere Evolution in East China. J. Asian. Earth. Sci. 78 ,263-276. doi:10.1016/j.jseaes.2012.11.006
Editorial Committee of Geoscience Transect C E a E (1994). Geoscience Transect from Menyuan, Qinghai Province to Ningde, Fujian Province: Seismological press.
Fan, B., Liu, X., Ye, H., Xv, L., and Yu, S. (2014). Geothermal Water Survey Report in Qutan, Xiaqi Country, Jinggangshan City, Jiangxi Province. Nanchang: Jiangxi Institute of Geo-Environment Monitoring.
Furlong, K. P., and Chapman, D. S. (2013). Heat Flow, Heat Generation, and the Thermal State of the Lithosphere. Annu. Rev. Earth Planet. Sci. 41 (1), 385–410. doi:10.1146/annurev.earth.031208.100051
He, L., Hu, S., Yang, W., Wang, J., Yang, S., Yuan, Y., and Cheng, Z. (2006). Heating Generation Model for the Continental Crust Based on the Main Hole of the Chinese Continental Scientific Drilling Project. Acta Petrol. Sin. 22 (11), 7
Hu, S. B., Xiong, L. P., Wang, J. Y., Shen, J. Y., and Li, J. L (1992). The First Group of Heat Flow Data from Jiangxi Province. Chin. Sci. Bull. 19, 1791.
Jaupart, C., and Mareschal, J. C. (2015). “6.05 - Heat Flow and Thermal Structure of the Lithosphere.” in Treatise on Geophysics. Editors G. Schubert (Amsterdam: Elsevier), 217–251
Jiang, G., Hu, S., Shi, Y., Zhang, C., Wang, Z., and Hu, D. (2019). Terrestrial Heat Flow of Continental China: Updated Dataset and Tectonic Implications. Tectonophysics 753, 36–48. doi:10.1016/j.tecto.2019.01.006
Lachenbruch, A. H. (1970). Crustal Temperature and Heat Production: Implications of the Linear Heat-Flow Relation. J. Geophys. Res. 75 (17), 3291–3300. doi:10.1029/JB075i017p03291
Laske, G., Masters, G., Ma, Z., and Pasyanos, M. E. (2013). Update on Crust1.0 - a 1-Degree Global Model of Earth's Crust. United States: Jolla
Li, J. (2019). A Discussion on the Symbolic Role of Secondary Fault Structure in Geothermal Prospecting in Southern Mountainous Areas - to Take the Longgui Mountain Geothermal Field in Ningdu County, Jiangxi Province as an Example. J. Geol. Hazards Environ. Preserv. 030 (4), 85
Li, X., Shi, X., Zhou, W., Sun, Z., Zhang, W., Niu, X., et al. (1992). Terrestrial Heat Flow in Jiangxi Province. Sci. Geol. Sin. A12, 383
Li, Z., Zuo, Y., Qiu, N., and Gao, J. (2017). Meso-Cenozoic Lithospheric Thermal Structure in the Bohai Bay Basin, Eastern North China Craton. Geosci. Front. 8 (5), 977–987. doi:10.1016/j.gsf.2016.09.003
Lin, Z. (1992). Geological Transects from Menyuan in Qinghang to Ningde in Fujian. Beijing: Seismological Press.
Liu, C., Chen, L., and Wang, Z. (2018). Geological Characteristics of Yangkeng Tungsten Ore Deposit in Jinggangshan City, Jiangxi Province. Min. Eng. 16 (6), 9
Liu, F., Lang, X., Lu, C., Lin, W., Tong, J., and Wang, G. (2017). Thermophysical Parameters and Lithospheric Thermal Structure in Guide Basin, Northeast Qinghai-Tibet Plateau. Environ. Earth Sci. 76 (5), 199. doi:10.1007/s12665-017-6503-2
Liu, F., Wang, A., Wang, G., Zhang, W., Liao, Y., and Tong, J. (2021). Characteristics of Terrestrial Heat Flow and Lithospheric Thermal Structure in Typical Intermountain Basin at the Eastern Foot of Yanshan Mountain, North China. Front. Earth Sci. 9, 758605. doi:10.3389/feart.2021.758605
Liu, Q., Zhang, L., Zhang, C., and He, L. (2016). Lithospheric Thermal Structure of the North China Craton and its Geodynamic Implications. J. Geodyn. 102, 139–150. doi:10.1016/j.jog.2016.09.005
Mayhew, M. A. (1985). Curie Isotherm Surfaces Inferred from High-Altitude Magnetic Anomaly Data. J. Geophys. Res. 90 (B3), 2647–2654. doi:10.1029/JB090iB03p02647
Prol-Ledesma, R. M., and Morán-Zenteno, D. J. (2019). Heat Flow and Geothermal Provinces in Mexico. Geothermics 78 (MAR.), 183–200. doi:10.1016/j.geothermics.2018.12.009
Ross, H. E., Blakely, R. J., and Zoback, M. D. (2006). Testing the Use of Aeromagnetic Data for the Determination of Curie Depth in California. Geophysics 71 (5), L51–L59. doi:10.1190/1.2335572
Rybach, L., and Buntebarth, G. (1984). The Variation of Heat Generation, Density and Seismic Velocity with Rock Type in the Continental Lithosphere. Tectonophysics 103 (1-4), 335–344. doi:10.1016/0040-1951(84)90095-7
Rybach, L., and Buntebarth, G. (1981). Heat-Generating Radioelements in Granitic Magmas. J. Volcanol. Geotherm. Res. 10 (4), 395–404. doi:10.1016/0377-0273(81)90088-3
Sass, J. H., Lachenbruch, A. H., Moses, T. H., and Morgan, P. (1992). Heat Flow from a Scientific Research Well at Cajon Pass, California. J. Geophys. Res. 97, 5017–5030. doi:10.1029/91JB01504
Sclater, J. G., Jaupart, C., and Galson, D. (1980). The Heat Flow through Oceanic and Continental Crust and the Heat Loss of the Earth. Rev. Geophys. 18 (1), 269–311. doi:10.1029/RG018i001p00269
Shen, W., Ling, H., Shu, L., Zhang, F., and Xiang, L. (2009). Sm-Nd Isotopic Compositions of Cambrian-Ordovician Strata at the Jinggangshan Area in Jiangxi Province: Tectonic Implications. Sci. Bull. 54 (010), 1750–1758. doi:10.1007/s11434-009-0214-3
Wang, C. Y., Lin, Z. Y., and Chen, X. B. (1995). Comprehensive Study of Geophysics on Geoscience Transect from Menyuan, Qinghai Province, to Ningde, Fujian Province, China. Chin. J. Geophys.14, 58
Wang, J., Pang, Z., Hu, S., He, L., Huang, S., and Qiu, N. (2015). Geothermics and its Application. Zealand: Supports open access
Xiao, Z., Wang, J., and Hou, H. (2018). Analysis of Characteristics and Causes of Geothermal Water in the East of Southern Jiangxi Province. J. East China Univ. Technol. 41 (3), 58
Xiong, S., Yang, H., Ding, Y., and Li, Z. (2016). Characteristics of Chinese Continent Curie Point Isotherm. Chin. J. Geophys. 59 (10), 14. doi:10.6038/cjg20161008
Xu, M., Zhu, C., Rao, S., and Hu, S. (2011). Difference of Thermal Structure between Eastern Edge of Tibet Plateau and Weasten Sichuan Basin. Chin. J. Geol. 46 (1), 203–212. doi:10.1007/s11769-011-0451-7
Yang, H. (2015). Characteristics of Chinese Continental Curie Point Isotherm. Sichuan, Chengdu: Chengdu University of Technology
Yang, L., Zhou, Y., Yu, Y., and Yang, W. (2018). Analysis on Genesis and Hydrochemical Characteristics of Geothermal Water in Qutan Area,Jinggangshan,Jiangxi Province. Sci. Technol. Eng. 18 (23), 13–18. doi:10.1007/s12665-021-09577-8
Yu-Fei -, X., Ya-Bo -, Z., and Yuen, - D. (2021). Geothermal Structure Revealed by Curie Isothermal Surface under Guangdong Province, China. J. Groundw. Sci. Eng. 9, 114. doi:10.19637/j.cnki.2305-7068.2021.02.003
Zang, S., Liu, Y., and Ning, J. (2002). Thermal Structure of the Lithosphere in North China. Chin. J. Geophys. 45 (1), 56–66. doi:10.1002/cjg2.216
Zhang, C., Jiang, G., Shi, Y., Wang, Z., Wang, Y., Li, S., Jia, x., and Hu, S., (2018). Terrestrial Heat Flow and Crustal Thermal Structure of the Gonghe-Guide Area, Northeastern Qinghai-Tibetan Plateau. Geothermics 72, 182–192. doi:10.1016/j.geothermics.2017.11.011
Zhang, Z. (2017). Hydrogeochemistry of Nitric Hot Springs in Southern Jiangxi Province. Fuzhou, China: East China University of Technology
Zhu, B., and Zhu, L. (1992). Geochemical Exploration of Geothermal Fields. Bath, UK: Geological Publishing House.doi:10.1016/S0375-6505(97)00012-6
Keywords: Jinggangshan City, geothermal gradient, heat flow, lithospheric thermal structure, moho temperature
Citation: Liao Y, Liu Y, Liu F, Wei S and Duan H (2022) Lithospheric Thermal Structure in Jinggangshan City: Implications for High Geothermal Background. Front. Earth Sci. 10:854232. doi: 10.3389/feart.2022.854232
Received: 13 January 2022; Accepted: 13 April 2022;
Published: 08 June 2022.
Edited by:
Dawei Hu, Institute of Rock and Soil Mechanics, (CAS), ChinaReviewed by:
Xianchun Tang, Chinese Academy of Geological Science, ChinaFunda Bilim, Cumhuriyet University, Turkey
Copyright © 2022 Liao, Liu, Liu, Wei and Duan. This is an open-access article distributed under the terms of the Creative Commons Attribution License (CC BY). The use, distribution or reproduction in other forums is permitted, provided the original author(s) and the copyright owner(s) are credited and that the original publication in this journal is cited, in accordance with accepted academic practice. No use, distribution or reproduction is permitted which does not comply with these terms.
*Correspondence: Yanguang Liu, Z2FveXVhbnpoaXhpbmdAMTYzLmNvbQ==