 Yanan Miao1
 Xin Li
- 1China National Oil and Gas Exploration and Development Company Ltd., Beijing, China
- 2PetroChina Jidong Oilfield Company, Tangshan, China
- 3CNOOC Research Institute Co., Ltd., Beijing, China
Both Lower Cambrian and Lower Silurian shale are typical of oil-prone kerogen and siliceous composition, but differ in thermal maturities with 3.56% Ro and 2.31% Ro, respectively. In this paper, pore characteristics were explored between these two shales. All samples were studied by a combination of organic geochemistry, x-ray diffraction, N2 adsorption, helium porosity, and focused ion beam milling and scanning electron microscopy. In particular, N2 adsorption of isolated OM was conducted to compare physical properties of OM-hosted pores, and fractal dimension was exploited to analyze morphologic characteristics of pores. N2 adsorption indicated that the Lower Silurian shale presented superior pore characteristics than the Lower Cambrian shale, in terms of pore volume (PV), pore surface area (PSA), and pore diameter. FIB-SEM manifested that pinhole OM-hosted pores and open-ended dissolved pores were primarily in the Lower Cambrian shale, while cellular OM-hosted pores were dominant in the Lower Silurian shale. Statistical and fractal analysis demonstrated that OM, rather than minerals, played a dominant role in pore development in marine shales at late diagenetic or metamorphic epoch. Furthermore, OM-hosted pores were not increased monotonously with increasing thermal maturity, but presented a unimodal trend, peaking at 2.8% Ro. PV (PSA) of isolated OM in the Lower Silurian shale was approximately 6.6 (4.3) times higher than that in the Lower Cambrian shale. With similar matrix basics and distinctive pore features, a comparison of these two marine shales markedly emphasizes the impact of thermal maturity on the state of OM-hosted pores.
Introduction
Shale gas is a vital target for modern resource exploration, with recoverable reserves of 214.55 × 10¹² m3 (Zou et al., 2016). Gas-bearing shales are widely distributed in North America, South America, Asia, and North Africa (Hill et al., 2007; Jarvie et al., 2007; Xu et al., 2022). As a typical unconventional reservoir, it is both a source and a reservoir of gaseous hydrocarbon, with thermal, biological, and mixed origins (Ross and Bustin, 2009; Hao and Zou, 2013).
In general, shales exhibit low porosity and ultralow permeability (Curtis et al., 2012a; 2012b). Gas in free state is stored in microfractures and macropores, while gas in adsorbed state is mainly absorbed on surfaces of OM (Yang et al., 2016). The gas content partly depends on the capacity of porosity, and the gas yield almost relies on the connectivity of the pore system (Sun et al., 2017; Myshakin et al., 2019). Thus, pore features exert vital functions on controlling properties of gas occurrence, content, and percolation (Zhang et al., 2012; Chalmers and Bustin, 2013).
During the last decade, considerable studies have been conducted on pore features of gas-bearing shales. Experimental techniques for characterizing pore structures can mainly be divided into three main categories, namely microscopic observation (e.g., atomic force microscopy and scanning electron microscopy) (Loucks et al., 2009, 2012; Emmanuel et al., 2016), substance invasion (e.g., helium pycnometer, mercury intrusion, and gas adsorption) (Chalmers and Bustin, 2013; Tian et al., 2013; Yang et al., 2016; Gao and Hu, 2018), and radiation detection (e.g., nuclear magnetic resonance and small-angle neutron scattering) (Clarkson et al., 2013; Yang et al., 2017). By the methods mentioned above, pores are spatially classified and defined as interparticle pores, intraparticle pores, and OM-hosted pores (Loucks et al., 2009, 2012). Pore parameters can be obtained including PV, PSA, pore size distribution, and porosity/permeability (Clarkson et al., 2013; Tian et al., 2013; Yang et al., 2016; Yang et al., 2017).
Subsequently, various shale reservoirs can be compared and discussed qualitatively and quantitatively (Dong et al., 2010; Zheng et al., 2013; Zhou et al., 2016). Studies have shown that constraints, including thermal maturity, OM abundance, mineral composition, fabrics, and textures, can lead to differences in pore features among shales with different geological backgrounds (Loucks et al., 2009, 2012; Chalmers and Bustin, 2013; Tian et al., 2013; Emmanuel et al., 2016). Precisely, suitable thermal degree, abundant OM, and rich siliceous component are favorable factors for pore development and preservation (Zheng et al., 2013; Milliken et al., 2014; Yang et al., 2016; Zhou et al., 2016).
As a signature feature of shale gas reservoirs, OM-hosted pores have been attracting a lot of attention. Under FIB-SEM observation, OM-hosted pores appear as honeycombs or pinholes, which are small, numerous, and interconnected (Jarvie et al., 2007; Curtis et al., 2012a, 2012b). Surface porosity of OM-hosted pores can reach 40% and connectivity can reach 67% (Mathia et al., 2016; Curtis et al., 2012a, 2012b), which illustrates the excellent porosity and connectivity of OM.
Currently, several fields in South China show industrial capacity and commercial exploitation, which are all located in the Lower Silurian shale, such as Fuling, Fushun-Yongchuan, Changning-Weiyuan, and Zhaotong blocks (Zhao et al., 2016). Nonetheless, drilling results in the Lower Cambrian shale are unsatisfactory (Zhao et al., 2016). This discrepancy may be caused by different reservoir properties between the two shales. The Lower Silurian shale presents more suitable pore parameters in terms of PV, PSA, and porosity/permeability than the Lower Cambrian shale (Wang et al., 2016a; Tang et al., 2016; Zhao et al., 2017).
Marine shales underwent intense diagenesis during the late diagenetic or metamorphic stage in South China (Ji et al., 2016; Yang et al., 2016; Zhou et al., 2016; Zhao et al., 2017). Secondary pores (OM-hosted pores mainly) contribute to the main pore space, while primary pores rarely exist after compaction and cementation (Loucks et al., 2012; Milliken et al., 2014). A detailed understanding of pore properties associated with OM, rather than the entire pore characteristics, is imperative and effective for excavating constraints of different porosities of the two marine shales.
Geological Setting and Samples
The Upper Yangtze area has good conditions for shale gas accumulation and has undergone multiple structural evolutions, namely, the Tongwan, Caledonian, Hercynian, Indosinian, and Himalayan movements (Zhu et al., 2007; Li et al., 2015) (Figure 1). During the Early Paleozoic, the transgression of the sea occurred due to the melting glaciers. In this anoxic environment, the Lower Cambrian formation was deposited with sufficient OM generation and preservation (Zhou et al., 2016). Thereafter, the water column became progressively shallower as the sea level dropped. Until the end of the Hernanite period, then the sea level rose rapidly again. The deepening of the water column and hydrostatic conditions provided a suitable environment for the development and preservation of OM. At the early stage of the Lower Silurian Formation, a set of black-gray shale was deposited. Afterward, the sea level began to decline, and the supply of terrigenous materials increased (Zhou et al., 2016).
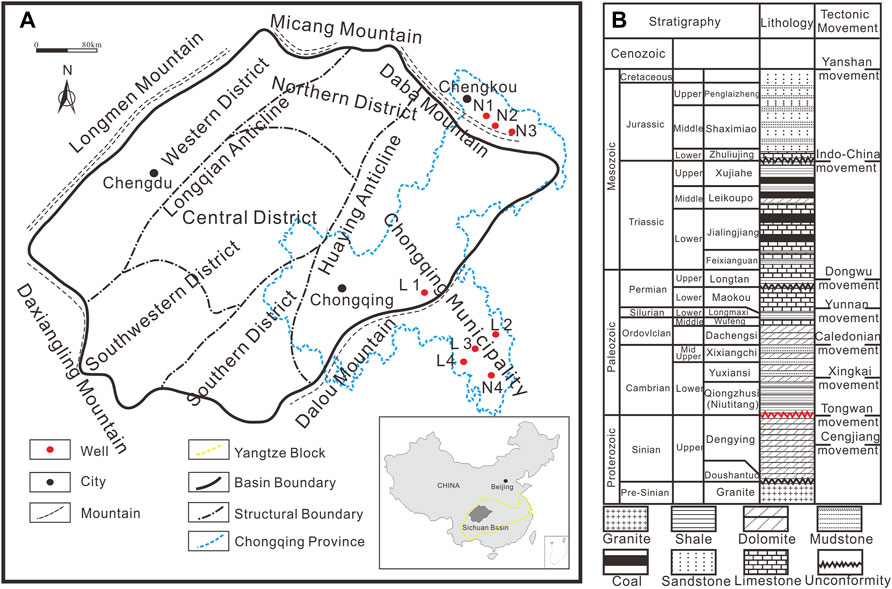
FIGURE 1. (A) Geologic map of the research area and well locations (red points) of the Lower Cambrian shale (N1, N2, N3, N4) and the Lower Silurian shale (L1, L2, L3, L4) and (B) stratigraphic sequences of the Sichuan Basin.
Generally, the Lower Cambrian Formation distributed stably in the horizon with a thickness ranging from 70 to 90 m, and the Lower Silurian Formation distributed stably with a maximum thickness of more than 100 m. Due to the abundance of aquatic organisms, either the Lower Cambrian shale or Lower Silurian shale is dominated by amorphous maceral (type I/II1 kerogen) (Dai et al., 2016). Additionally, both the two shales are characterized by being organic rich. Nonetheless, the thermal degree of the Lower Cambrian shale (>3.0% Ro) is generally higher than that of the Lower Silurian shale (2.0%–3.0% Ro) (Wang et al., 2013; Wang et al., 2016a, 2016b; Zhao et al., 2016; Zhang et al., 2020).
In this paper, shales were selected from the Lower Cambrian Formation and Lower Silurian Formation at the margin of the Sichuan Basin, in the Upper Yangtze area (Figure 1). Samples (10) of the Lower Cambrian shale were selected from wells N1, N2, N3, and N4, and samples (10) of the Lower Silurian shale were selected from wells L1, L2, L3, and L4 (Table 1). All samples were investigated by a combination of organic geochemistry, x-ray diffraction, N2 adsorption, helium porosity, and FIB-SEM. Especially, in particular, N2 adsorption was performed on isolated OM to compare pore features of OM individually, and fractal dimension was used to analyze the morphologic characteristics between the two shales. Finally, constraints on pore development in marine shales are discussed.
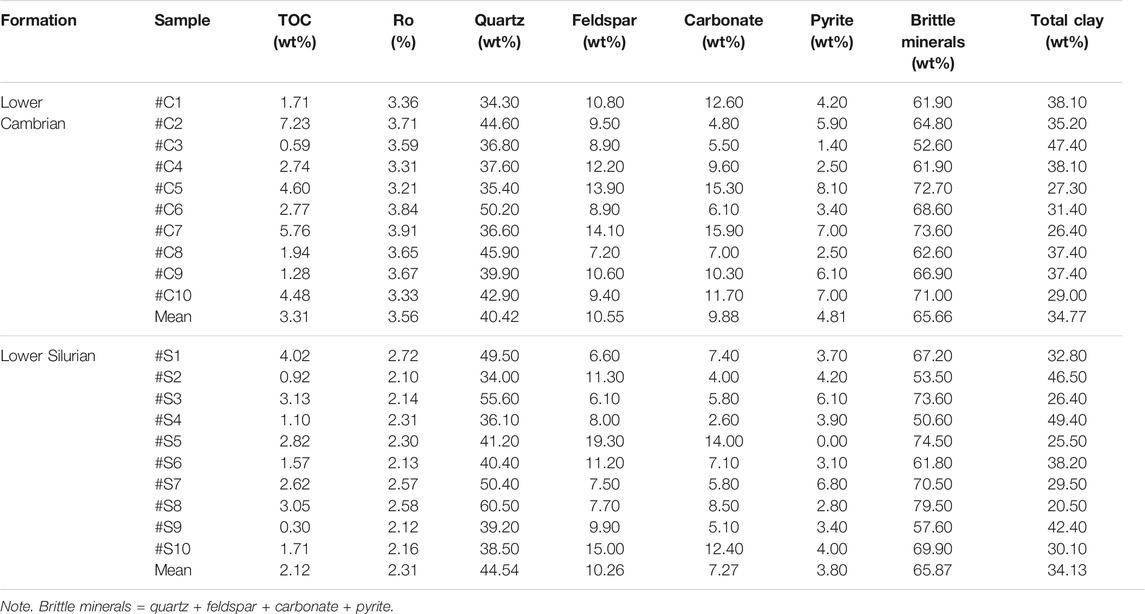
TABLE 1. Basic geochemical and petrologic parameters of the investigated samples.
Experimental Procedures
Organic Geochemistry
A Leco CS230 carbon/sulfur analyzer was used to perform organic abundance measurements. Initially, samples were grounded into fragments with sizes of 80 mesh, and hydrochloric acid was used to remove carbonate composition. Afterward, samples were washed with distilled water and pyrolyzed at 540°C to measure TOC. Thermal maturity was represented by the reflection of solid bitumen (Rb), and the equivalent vitrinite reflectance (Ro) can be obtained by the linear regression equation proposed by Jacob (1989): Ro = 0.618Rb + 0.4.
OM Isolation
Samples were grounded into fragments with sizes of 80 mesh and soaked in distilled water to expand fully. The upper clear liquid was removed after ∼2–4 h. Hydrochloric acid (6 mol/L) and hydrofluoric acid (40%) were added sequentially under stirring to remove the carbonate minerals. After complete decomposition of the carbonate minerals, samples were washed with distilled water to remove the acids. Furthermore, samples were mixed with hydrogen fluoride for 12 h to remove silicate minerals. Sodium hydroxide (0.5 mol/L) was taken and stirred continuously for 30 min to remove the alkali solution. Afterward, samples were washed to neutral. Hydrochloric acid (6 mol/L) and arsenic-free zinc granules were added to remove pyrite. After washing, freezing, and drying, isolated OM was obtained for the next measurement.
X-Ray Diffraction
A Bruker D8 DISCOVER diffractometer, with a Cu x-ray tube and a Sol-X solid-state detector, was used to measure mineral compositions. The temperature of the laboratory environment was 24°C, and the humidity was 35%. Samples (5 g of each) were powdered and screened, and selected with a size of about 300 mesh. Slides were required for the experiment and coated with a solution of the sample mixed with ethanol. The equipment was operated at 45 kV. The scanning frequency was kept at the 20 s/0.02° step. Finally, mineral components can be obtained according to the principle of Kα-radiation.
FIB-SEM
Before microscopic observation, samples were needed to be prepared via mechanical grind and argon ion polish. Both matrix components and nanoscale pores can be observed by Merlin Zeiss at a theoretical resolution of 2.0 nm. Matrix features, in terms of crystal orientations, grain boundaries, and microtextures, were searched by backscattered electrons (BSE) at an accelerating voltage of 1 kV. Nanoscale pore topographies were observed by secondary electrons (SE) at 20 kV.
N2 Adsorption
Micromeritics Tristar II 3020 SA analyzer was performed for N2 adsorption. Samples were needed to be crushed to 60–80 mesh sizes before the experiment. Constant temperature (77 k) and low pressure (<0.127 Mpa) should be maintained throughout the operation. With relative pressure increasing and decreasing, N2 amount of adsorption and desorption were recorded, respectively. Pore properties, such as PV, PSA, and pore diameter, were obtained based on the amount of liquid nitrogen with different pore sizes at different relative pressures.
Helium Porosity
For this process, cylindrical core samples are required, which was conducted via a TAW-1000 triaxial rock-testing machine. Porosity was measured by using a helium expansion method. An Ultrapure-200A helium porosimeter was utilized at 1,025 hPa, 50% relative humidity, and 23°C room temperature. The porosity was calculated according to the following equation:
Fractal Analysis
Fractal dimension (ranging from 2 to 3) is a feasible indicator to illustrate geometric and structural properties of solids (Ji et al., 2016; Liu et al., 2019). The geometric and structural features of solids can be represented by D fractal dimension (2–3). With the value of 2, the D fractal dimension suggests a homogenous structure or a smooth surface. With the value of 3, the D fractal dimension indicates an inhomogeneous structure or an irregular surface. The D fractal dimension was calculated by the Frenkel–Halsey–Hill (FHH) equation as follow:
where V is the adsorbed volume (cm3/g) at equilibrium pressure P (MPa), D is the fractal dimension, P0 (MPa) is the vapor saturation pressure, and C is a constant.
In the process of fractal analysis, the two distinctive linear segments of N2 adsorption were considered separately. It is because the mechanisms of gas adsorption are different in the range of 0–0.5P0/P (Van der Waals forces) and 0.5–1.0P0/P (capillary condensation). D1 suggests the surface feature at low relative pressure, while D2 indicates the structure feature at high relative pressure.
Results
Characteristics of OM and Mineral Components
Both the Lower Cambrian shale and Lower Silurian shale were rich in OM (Figure 2A), with TOC>2wt% accounting for 72% (Figure 2B) and 43% (Figure 2C), respectively. Moreover, the proportion of TOC > 4wt% was higher in the Lower Cambrian shale (sharing 25%) than in the Lower Silurian shale (sharing 16%) (Figures 2B, C). With regard to thermal maturity, both the two shales were at the overthermal maturity stage. The Lower Cambrian shale (averaging 3.56% Ro) experienced higher temperature and pressure degrees than the Lower Silurian shale (averaging 2.31% Ro) (Table 1).
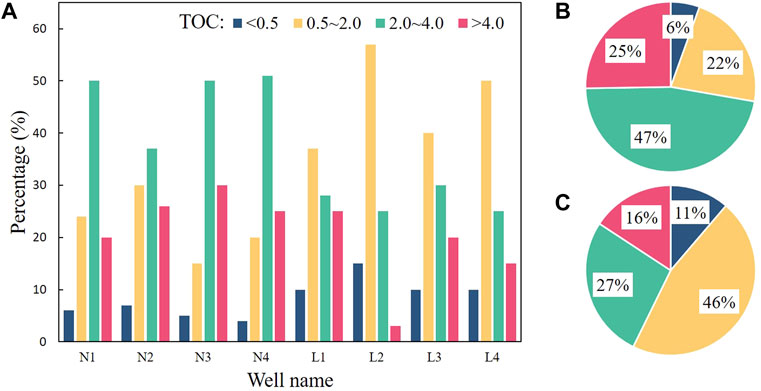
FIGURE 2. (A) TOC distribution from both the Lower Cambrian shale samples (N1, N2, N3, N4) and the Lower Silurian shale samples (L1, L2, L3, L4), (B) pie chart of TOC in the Lower Cambrian shales, and (C) pie chart of TOC in the Lower Silurian shales.
Either the Lower Cambrian shale or Lower Silurian shale was rich in siliceous minerals, and was rare in calcareous minerals (Table 1 and Figure 3). In addition, samples were featured with rich silica and abundant OM synchronously (Figure 3). In the Lower Cambrian shale, the content of quartz and feldspar ranged from 45.10 to 59.10 wt%, with an average of 50.97 wt%. The content of clay mineral was in the range of 27.3–38.10 wt%, with an average of 34.77 wt%. Carbonate mineral was rare, accounting for 9.88 wt% of the total. In contrast, the content of quartz and feldspar in the Lower Silurian shale ranged from 45.30 to 68.20 wt%, with an average of 54.80 wt%. The content of clay mineral was in the range of 26.40–49.40wt%, with an average of 34.13 wt%. Carbonate mineral was rare, sharing 7.27 wt% of the total. Additionally, a small amount of pyrite was found in either the Lower Cambrian shale or Lower Silurian shale, accounting for 4.81 and 3.80 wt%, respectively (Table 1).
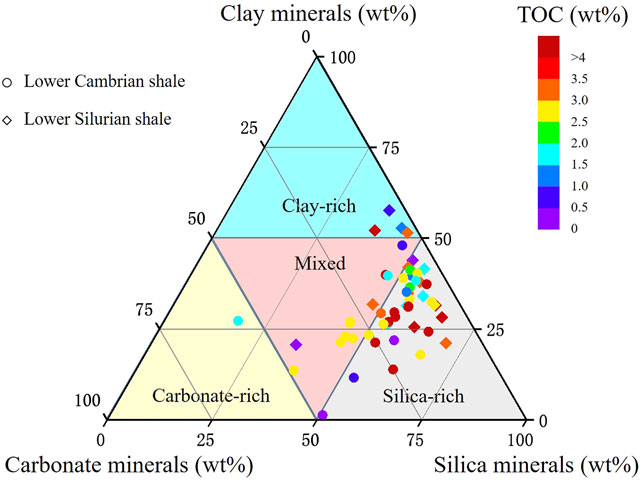
FIGURE 3. Mineralogical ternary plot: the Lower Cambrian shales are represented by circles, the Lower Silurian shales are represented by diamonds, and TOCs are represented by a color bar.
Pore Properties Based on N2 Adsorption
For the Lower Cambrian shale, PVs ranged from 0.005 to 0.011 ml/g, with a mean value of 0.008 ml/g (Figure 4 and Table 2). PSAs ranged from 3.26 to 12.73 m2/g, with an average value of 7.99 m2/g (Figure 4 and Table 2). APDs were in the range of 4.68–8.12 nm, with a mean value of 5.93 nm (Table 2). Pore size distributions presented two or three peaks with low amplitudes (Figure 4).
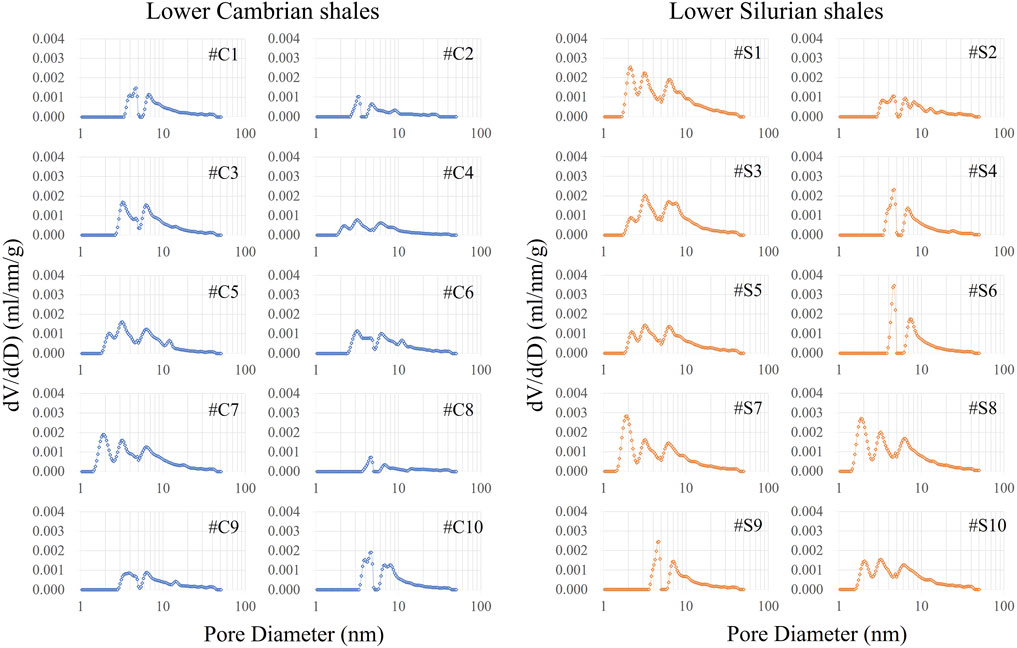
FIGURE 4. Relationships between pore volumes and pore diameters of the Lower Cambrian shales and Lower Silurian shales.

TABLE 2. Pore parameters of isolated OMs and the corresponding bulk samples.
For the Lower Silurian shale, PVs ranged from 0.010 to 0.022 ml/g, with an average value of 0.015 ml/g (Figure 5 and Table 2). PSAs ranged from 5.62 to 15.78 m2/g, with a mean value of 10.53 m2/g (Figure 5 and Table 2). APDs were in the range of 15.58–22.55 nm, averaging 18.60 nm (Table 2). Pore size distributions presented two or three peaks with high amplitudes (Figure 5).
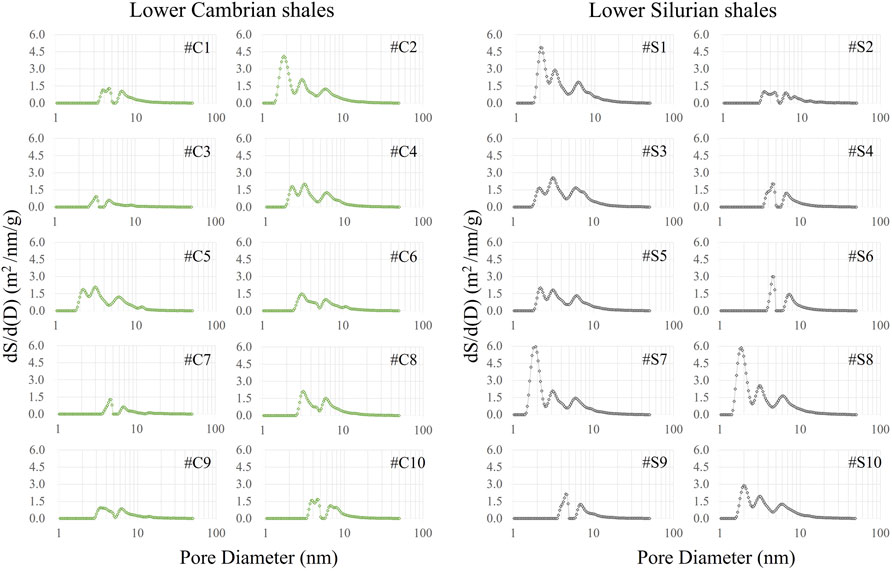
FIGURE 5. Relationships between pore surface areas and pore diameters of the Lower Cambrian shales and Lower Silurian shales.
Pore properties of the Lower Silurian shale were superior to those of the Lower Cambrian shale, in terms of PV, PSA, and averaging pore diameter (APD) (Figures 4 and 5, Table 2). Meanwhile, the correlation between helium porosity and N2 adsorption PV (Figure 6) depicted a strong positive relationship (R2 = 0.77), which implied that N2 adsorption can characterize the pore system of shales.
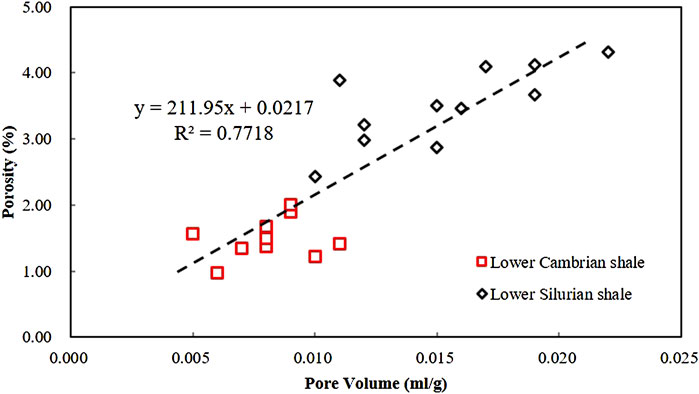
FIGURE 6. Correlation between helium porosity and N2 adsorption pore volume (PV).
Shales with different TOCs were selected for OM isolation and N2 adsorption. Results demonstrated that pore properties of the two shales showed different trends, while in one shale, the distribution was close (Figure 7). Comparatively, PVs (PSAs) of isolated OM in the Lower Silurian shale were 6.6 times (4.3 times) than those in the Lower Cambrian shale (Figure 7 and Table 2). For Lower Cambrian shale, PVs (PSAs) of isolated OM were approximately 1.9 times (2.0 times) higher than those of corresponding shales (Figure 7 and Table 2). Pore size distributions of isolated OM showed two peaks in the range of 2∼4 nm (main peak) and 6–10 nm (subsidiary peak) (Figure 7). For Lower Silurian shale, PVs (PSAs) of isolated OM were about 6.6 times (6.5 times) higher than those of corresponding shales (Figure 7 and Table 2). Pore size distributions of isolated OM showed three major peaks with irregular distributions (Figure 7).
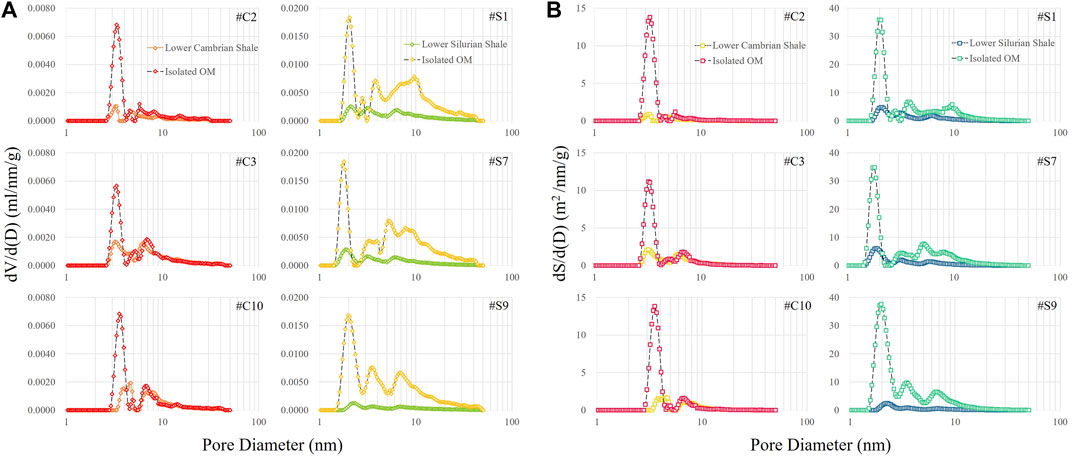
FIGURE 7. (A) Relationships between pore volumes and pore size distributions of isolated OMs and corresponding bulk samples from the Lower Cambrian shales (#C2, #C3 and #C10) and the Lower Silurian shales (#S1, #S7 and #S9). (B) Relationships between pore surface areas and pore size distribution of isolated OMs and corresponding bulk samples from the Lower Cambrian shales (#C2, #C3 and #C10) and Lower Silurian shales (#S1, #S7 and #S9).
Fractal Dimensions
Correlation coefficients (R2 > 0.9) indicated that the fitting results were credible (Table 3). Thus, the morphological nature of matrix-related pores can be well implied by fractal dimensions. Comparatively, fractal dimensions (D1 and D2) were slightly lower in the Lower Cambrian shale than those in the Lower Silurian shale. In the Lower Cambrian shale, D1 fractal dimensions distributed in the range of 2.11–2.66, with an average of 2.34 (Table 3), and D2 fractal dimensions distributed in the range of 2.59–2.84, with an average of 2.74 (Table 3). In the Lower Silurian shale, D1 fractal dimensions distributed in the range of 2.11–2.49, with an average of 2.36 (Table 3). D2 fractal dimensions distributed in the range of 2.79–2.88, with an average of 2.84 (Table 3).
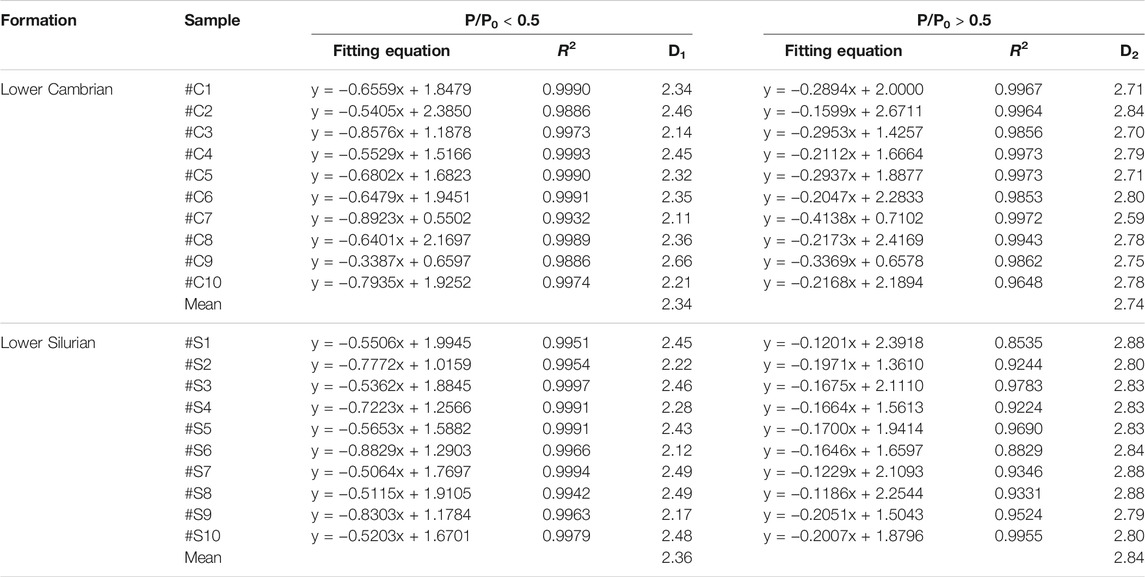
TABLE 3. Fractal dimensions calculated by the fractal Frenkel–Halsey–Hill (FHH) model and derived from N2 adsorption isotherms.
Pore Features Based on FIB-SEM
In the Lower Cambrian shale, OM was shaped as stripes and wisps mixed within matrixes (Figure 8), and distributed widely among the particles, such as quartz, feldspars, and calcite/dolomite (Figures 8A–E). In addition, OM can be searched between clay flakes (kaolinite in Figure 8B and illite/smectite in Figure 8F). OM presents amorphous state and visible OM-hosted pores can hardly be identified by FIB-SEM (Figures 8D–F). Voids in matrixes are mainly occupied by OM and rare voids can be searched in the Lower Cambrian shale (Figure 8). Intraparticle pores can be detected inside pyrite framboids, and deformed pyrite microcrystals indicate compaction and cementation (Figure 8G). Dissolved pores can be detected on surfaces of grains, which are generally associated with calcite/dolomite and present as isolated points with circles or irregular shapes (Figures 8H, I).
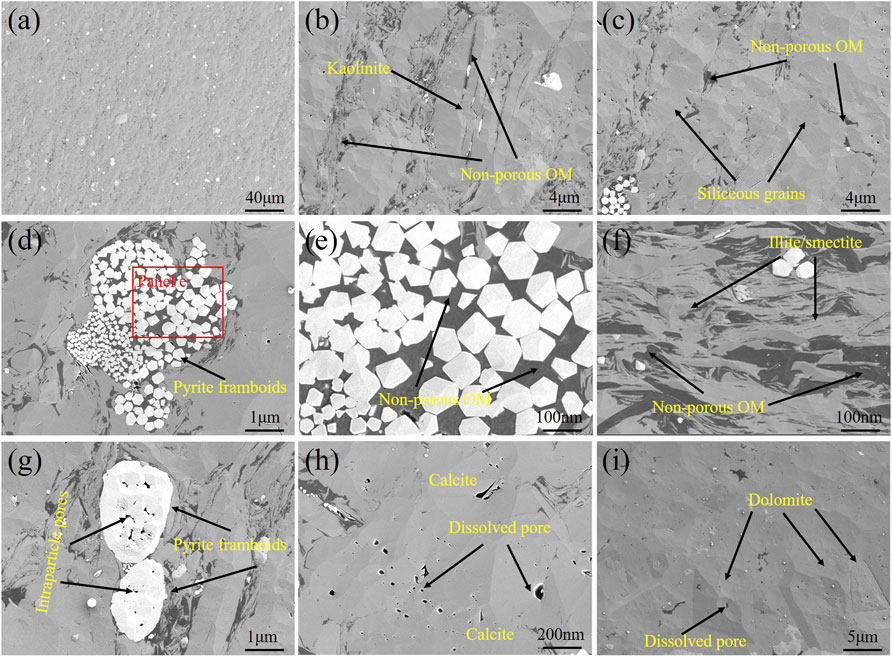
FIGURE 8. FIB-SEM images of the Lower Cambrian shales. (A–C) OM mixed with matrixes as stripes and wisp (#C1), (D,E) nonporous OM inside of pyrite framboids (#C4), (F) aggregates of OM and illite/smectite (#C5), (G) intraparticle pores inside pyrite framboids (#C4), (H,I) dissolved pores on the surface of calcite (#C7), and dolomite (#C8).
In the Lower Silurian shale, either OM or its related pores exhibit extremely heterogeneous (Figure 9). OM varied in shapes, being massive, striated, and sparked, and was distributed among detrital grains, secondary minerals, and clay flakes (Figures 9A–F). On surfaces of OM particles, OM-hosted pores distribute uniformly with various diameters (Figures 9D–F). In addition, large OM-hosted pores are combined with small pores and present various morphological features, with cellular and sponge shapes (Figure 9F). In the case of mineral-related pores, voids are rarely searched due to OM migration and occupation. A few dissolved pores appear as isolated points (Figure 9G), and dissolved rims on edges of grains can be searched (Figure 9H). Pyrite framboids maintain the automorphic form with OM injection (Figure 9D), while some are cemented without OM injection (Figure 9H). Some fissures can be observed inside grain fragments (Figure 9I) and whether they occurred in situ or developed via sample preparation cannot be judged by FIB-SEM imaging only.
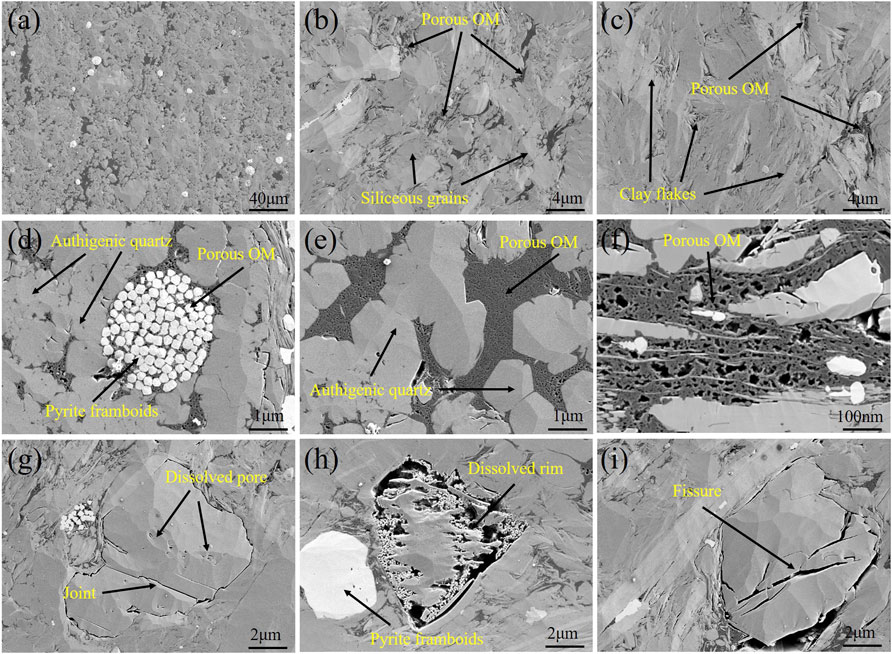
FIGURE 9. FIB-SEM images of the Lower Silurian shales. (A–C) OM mixed with matrixes as stripes and wisp (#S3), (D,E) porous OM inside of pyrite framboids or mixed with authigenic quartz (#S4 and #S5), (F) porous OM with cellular shapes (#S6), (G) dissolved pores as isolated points (#S4), (H) dissolved rim on the surface of feldspar (#S7), and (I) fissures inside grain fragments (#S8).
Discussion
Influences of Organic Matter on Pore Properties
Positive relationships between PV (PSA) and TOC can be detected in the two shales (Figures 10A,B), suggesting that OM functions as a significant contributor to PV (PSA). Moreover, there is no difference in PVs (PSAs) of isolated OM in the same shale (Figures 7, 8), implying that pore capacity of OM is parallel to the same thermal maturity. Nonetheless, properties of porous OMs are different between the two shales. In the case of pore contribution, OM is more competent in the the Lower Silurian shale than in the Lower Cambrian shale (Figure 7 and Table 2).
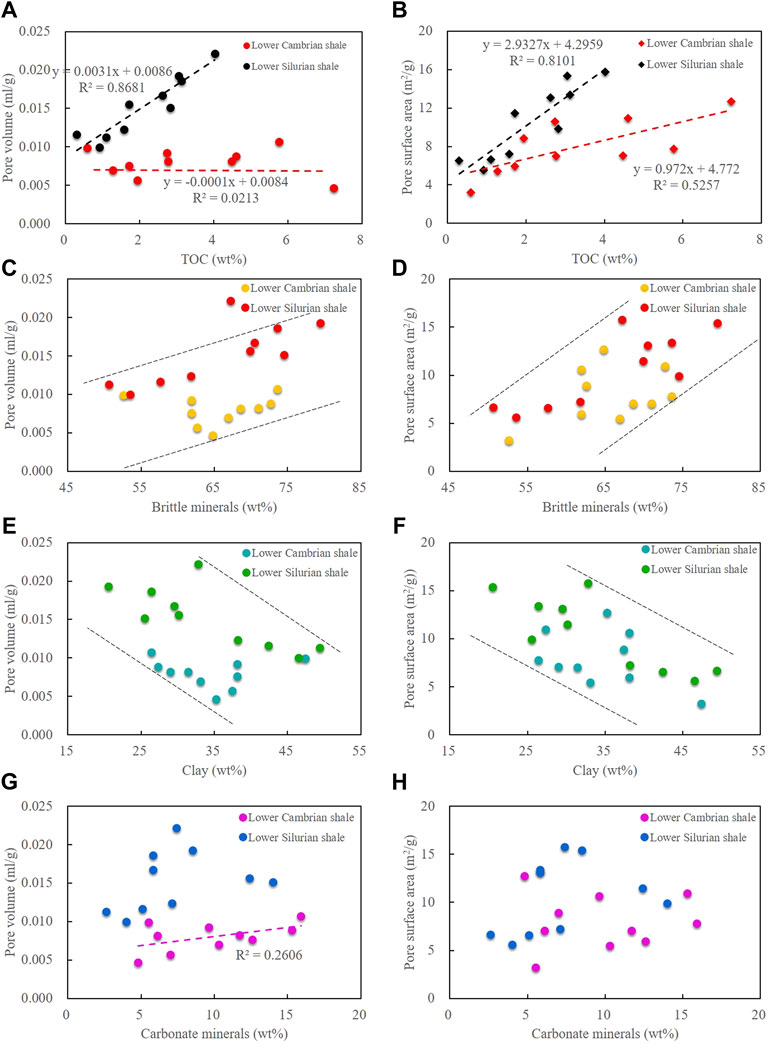
FIGURE 10. Plots of pore volumes and pore surface areas vs. TOC (A,B) and brittle mineral content (C,D), clay mineral content (E,F), and carbonate mineral content (G,H).
In the Lower Cambrian shale, the correlation between PV and TOC is weak (Figure 10A), suggesting that OM-hosted pores cannot provide the main pore space. Nevertheless, the correlation between PSA and TOC is strong (Figure 10B), indicating that OM-hosted pores contribute significantly to the surface area. It has been noted that PV is controlled by large pores, and PSA is charged by small pores (Wang et al., 2016b; Ji et al., 2016). Thus, the Lower Cambrian shale possesses OM-hosted pores with relatively small diameters, although no visible OM-hosted pores can be detected by FIB-SEM (Figures 8A–F). Additionally, PVs (PSAs) of isolated OMs were merely 1.9 times (2.0 times) higher than those of corresponding shales (Table 2), and no apparent similarity in pore size distribution can be detected between isolated OMs and their corresponding shales (Figure 7). This implies that OM-hosted pore is not the only type in the Lower Cambrian shale, which is corresponding to the statistical analysis (Figures 10A,B).
In contrast, both PV and PSA present strong positive relationships with TOC in the Lower Silurian shale (Figures 10A,B), suggesting that OM is the dominant contributor to pore spaces and surface areas. FIB-SEM images illustrate that OM-hosted pores generally present network-like shapes, with large diameters and complex structures (Figure 9F). Moreover, PVs (PSAs) of isolated OMs were approximately 6.6 times (6.5 times) higher than those of corresponding shales, and similar trends in pore size distributions can also be searched between isolated OMs and their corresponding shales (Figure 8). Corresponding to the statistical analysis (Figures 10A,B), it indicates that OM-hosted pore is the dominant type in the Lower Silurian shale.
Effects of Mineral Components on Pore Properties
Slightly positive correlations between PVs (PSAs) and brittle minerals can be observed in both the two shales (Figures 10C, D). Nonetheless, brittle minerals are not the main contributor of pore space in both the two shales, even if there are statistical correlations. First, pores related to brittle minerals are large and scarce based on FIB-SEM observation (Figures 8, 9), which is inconsistent with the analysis of pore size distribution by N2 adsorption (Figures 4, 5). Second, pores associated with brittle minerals, if existing in situ, are too large to provide adsorbing sites (PSA). Moreover, given that small pore spaces are generally occupied by migrated OM (Figures 8, 9), these large voids cannot survive from OM injection. Last, morphologies of these voids can imply an artificial cause (Figure 9I), mainly due to sample preparation (particles fragmentation and grains detachment).
In contrast, slightly negative correlations between PVs (PSAs) and clay (ductile minerals) can be detected in both the two shales (Figures 10E,F). This implies that clay is not the major contributor to PV (PSA), which can also be supported by FIB-SEM (Figures 8B,F and 9C,F). Voids confined by clay flakes are generally injected by migrated OM. Moreover, due to ductile nature of clay, pores associated with clay flakes cannot survive from intense compaction.
Correlations between PVs (PSAs) and carbonate minerals are ambiguous (Figures 10G,H). This infers that carbonate minerals are not the primary provider of pore space in both two shales. Due to the chemical cementation, interparticle voids among calcite/dolomite are generally cemented by microcrystal calcite or overgrowth dolomite (Figures 8H,I). Only dissolved pores can exist as isolated circles on surfaces of calcite particles. A slight positive correlation between PV and carbonate minerals can be seen in the Lower Cambrian shale (Figure 10G), suggesting that dissolved pore is one constituent part of the pore system. Nonetheless, the relationship between PV and carbonate minerals in the Lower Silurian shale is irregular (Figure 10G). This is because, in the Lower Silurian shale, OM-hosted pores are prosperous and can overprint the effect of dissolved pores, unlike in the Lower Cambrian shale.
Fractal Significances of Pore Morphology
A strong correlation can be searched between D1 and PSA, while the relationship between D1 and PV is ambiguous (Figures 11A, C). Therefore, PSA can be better illustrated by D1. Positive relationships can be seen between D1 and PSA in both the two shales (Figure 11A). It is because that a larger D1 indicates a more irregular surface, which can contribute to a larger PSA with more absorbing sites for methane (absorbing occurrence). Moreover, the Lower Silurian shale possesses larger D1 than the Lower Cambrian shale (Table 3). This means that pores of the Lower Silurian shale possess relatively more irregular surfaces compared with those of the Lower Cambrian shale.
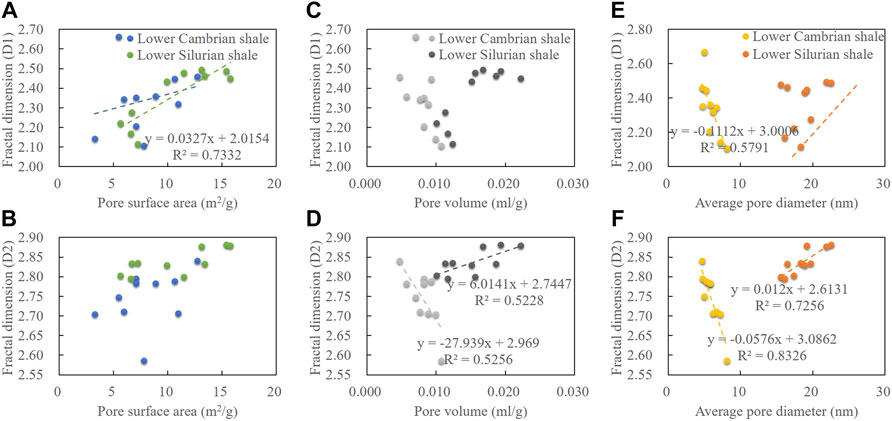
FIGURE 11. Correlations between fractal dimension and pore surface area (A,B), pore volume (C,D), and average pore diameter (E,F).
On the other hand, a strong correlation can be searched between D2 and PV (Figure 11D), while the relationship between D2 and PSA is ambiguous (Figure 11B). Therefore, PV can be better illustrated by D2. A disparate phenomenon can be seen in relationships of D2 and PV between the two shales (Figure 11D). The negative trend of D2 and PV indicates that pore spaces are provided by pores with regular structures in the Lower Cambrian shale, while the positive trend of D2 and PV suggests that pore spaces are provided by pores with irregular structures in the Lower Silurian shale (Figure 11D). Moreover, the Lower Silurian shale possesses larger D2 than the Lower Cambrian shale (Table 3). This means that pores of the Lower Silurian shale possess relatively more inhomogeneous structures compared with those of the Lower Cambrian shale.
A disparate phenomenon can be seen in relationships of fractal dimensions (D1 and D2) and APD between the two shales. Negative correlations can be searched between fractal dimensions (D1 and D2) and APD in the Lower Cambrian shale (Figures 11E,F), suggesting that surface roughness and pore structure tend to be more complicated as pore size decreases. In contrast, fractal dimensions (D1 and D2) increase with increasing APD in the Lower Silurian shale (Figures 11E,F), which indicates that surface roughness and pore structure tend to be more complicated as pore size increases.
The two shales present inconsistent fractal characteristics and pore morphologies, indicating that the two shales possess different pore types (consistent with the analysis in Influences of organic matter on pore properties and Effects of mineral components on pore properties sections above). In the Lower Cambrian shale, OM-hosted pores and dissolved pores are the main types. Pores tend to be smooth faced and structure regular with decreasing PSA, increasing PV and increasing APD (Figure 11). This means that pores with regular morphologies (dissolved pores) contribute less PSA and more PV than pores with irregular morphologies (OM-hosted pores). In addition, pores with regular morphologies (dissolved pores) possess larger pore diameters than pores with irregular morphologies (OM-hosted pores), corresponding to the FIB-SEM images (Figure 8). In contrast, in the Lower Silurian shale, pores tend to be smooth faced and structure regular with decreasing PSA, decreasing PV and decreasing pore sizes (Figure 9). Additionally, corresponding to the FIB-SEM images (Figures 9A–F), OM-hosted pores in the Lower Silurian shale present network-like shapes with large diameters and complex surfaces, which can contribute to PV and PSA synchronously. It indicates that pores with irregular morphologies (OM-hosted pores) dominate in the Lower Silurian shale.
Different Diagenetic Stages of Matrix-Related Pores in the Two Shales
The Lower Cambrian and Lower Silurian shales are both typical of oil-prone kerogen and siliceous composition, but different in thermal maturities with 3.56% Ro and 2.31% Ro, respectively. Distinctive pore characteristics between the two shales, in terms of pore types (Figures 8 and 9), PV and PSA (Figures 4 and 5, and Table 2), can be caused by different diagenetic degrees.
In the case of marine shales, oil-prone kerogen is dominant and thermally alterable (Ungerer et al., 2014), implying that the aliphatic branch is prosperous and active with increasing temperature and pressure. Given that the two OM-rich shales have experienced the late diagenesis or metamorphic epoch, the spread of OM obstructs the preexisting spaces, such as interparticle pores among mineral grains and intraparticle pores inside pyrite framboids or clay flakes (Figures 8A–F and 9A–F). Petrological evidence of OM migration is prevalent in both the two shales.
Besides compaction and cementation, residues of mineral-related pores need to meet three demands: low thermal degree before OM migration, low OM abundance without sufficient OM migration, and tiny pore throats preventing OM migration. As mentioned above, no apparent correlations between PV (PSA) and mineral components can be detected in both the two shales (Figures 8C–H), and mineral-related pores are scare without effective function on porosity. Therefore, differences in pore properties may be controlled by different features of OM-hosted pores in both the two shales.
Based on statistics of porosities with a wide range of thermal maturities (Figure 12), no correlation can be searched between porosity and thermal maturity (Ro < 1.5%). Possibly, mineral-related pores dominate the pore system, and various lithofacies of shales may result in different porosities (pore features). As thermal maturity increases (Ro > 1.5%), porosity first increases and then decreases, peaking at 2.8% Ro (Figure 12). Without enough statistical data, it cannot be judged that 2.8% Ro is the most suitable thermal degree for OM-hosted pore development. Still, it can be speculated that OM-hosted pores will be destroyed or extinct at overhigh maturity stage [3.5% Ro stated by Chen and Xiao (2014)]. This regular relationship (Figures 8A,B) can demonstrate that the main pore type (OM-hosted pores) is sensitive to thermal maturity and controls reservoir properties after the dry gas window (Ro > 1.5%).
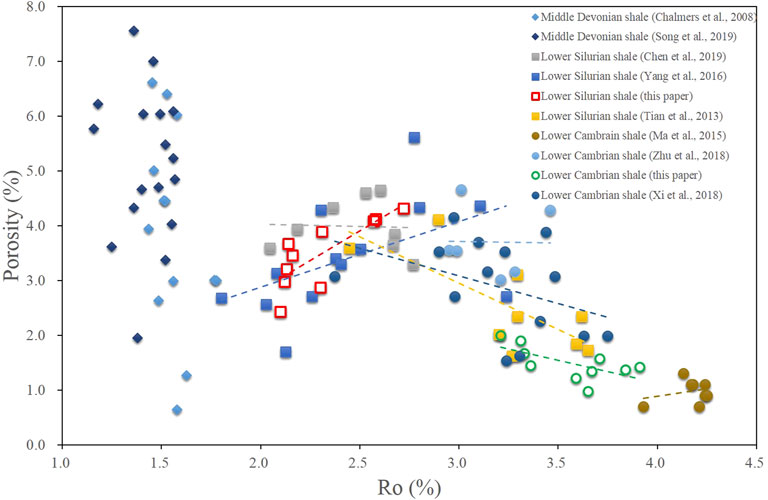
FIGURE 12. Porosity distribution of marine shales in a wide range of thermal maturities; data collected from previous research and this paper.
The huge gap in pore features associated with isolated OM (Figure 7 and Table 2) can directly mirror the differences in OM-hosted pore between the Lower Silurian shale and Lower Cambrian shale. In the Lower Silurian shale, with almost 2.31% Ro in the dry gas window, the ability of gas generation remains, and OM-hosted pores develop and merge with cellular constructs (Figure 9F). Nonetheless, in the Lower Cambrian shale with excessive thermal maturity (3.56% Ro), both gas generation ability and the microregion gas content are reduced (gas escapes through the connecting channel of preexisting OM-mineral networks). The pregenerated pores destroy and collapse with pinhole shapes or even nonpore features. Therefore, pore discrepancies between the two marine shales markedly emphasize the impact of thermal maturity on the state of OM-hosted pores.
Conclusion
Both the Lower Silurian shale (2.31% Ro) and Lower Cambrian shale (3.56% Ro) were marine shales, and were typical of oil-prone kerogen and siliceous component. Nonetheless, the Lower Silurian shale presented superior pore characteristics than the Lower Cambrian shale. OM played a dominant role in pore development of the two shales at late diagenetic or metamorphic epoch. Pinhole OM-hosted pores were primary in the Lower Cambrian shale, while honeycomb OM-hosted pores were dominated in the Lower Silurian shale. Besides different morphologies, PV (PSA) of isolated OM in the Lower Silurian shale was approximately 6.6 (4.3) times higher than that in the Lower Cambrian shale. With increasing thermal maturity, OM-hosted pores were not increased monotonously, but presented as a unimodal trend with a peak at 2.8% Ro. With similar matrix basics and distinctive pore features, a comparison of the two marine shales markedly emphasizes the impact of thermal maturity on the state of OM-hosted pores.
Data Availability Statement
The original contributions presented in the study are included in the article/Supplementary Material, further inquiries can be directed to the corresponding author.
Author Contributions
YM: conceptualization, data curation, formal analysis, methodology, resources, rsftware, supervision, investigation, and writing—original draft and reviewing and editing. FZ: supervision, investigation, resources, and methodology. SW: resources, methodology, formal analysis, and investigation. FW: supervision, methodology, data curation, resources, and writing-review and editing. XL: supervision, resources, methodology, formal analysis, investigation, and manuscript reviewing and editing.
Funding
This research is supported by the China Postdoctoral Science Foundation (No. 2021M693543) and Natural Science Foundation of China (No. 42130803 and No. 42072174).
Conflict of Interest
YM was employed by the China National Oil and Gas Exploration and Development Company. FZ was employed by PetroChina Jidong Oilfield Company. SW, FW, and XL are employed by the China National Offshore Oil Corporation.
Publisher’s Note
All claims expressed in this article are solely those of the authors and do not necessarily represent those of their affiliated organizations, or those of the publisher, the editors, and the reviewers. Any product that may be evaluated in this article, or claim that may be made by its manufacturer, is not guaranteed or endorsed by the publisher.
References
Chalmers, G. R. L., and Bustin, R. M. (2013). Geological Evaluation of Halfway- DoigMontney Hybrid Gas Shale-Tight Gas Reservoir, Northeastern British Columbia. Mar. Petrol. Geol. 38, 53–72. doi:10.1016/j.marpetgeo.2012.08.004
Chen, J., and Xiao, X. (2014). Evolution of Nanoporosity in Organic-Rich Shales during thermal Maturation. Fuel 129, 173–181. doi:10.1016/j.fuel.2014.03.058
Clarkson, C. R., Solano, N., Bustin, R. M., Bustin, A. M. M., Chalmers, G. R. L., He, L., et al. (2013). Pore Structure Characterization of North American Shale Gas Reservoirs Using USANS/SANS, Gas Adsorption, and Mercury Intrusion. Fuel 103, 606–616. doi:10.1016/j.fuel.2012.06.119
Curtis, M. E., Cardott, B. J., Sondergeld, C. H., and Rai, C. S. (2012a). Development of Organic Porosity in the Woodford Shale with Increasing thermal Maturity. Int. J. Coal Geology. 103, 26–31. doi:10.1016/j.coal.2012.08.004
Curtis, M. E., Sondergeld, C. H., Ambrose, R. J., and Rai, C. S. (2012b). Microstructural Investigation of Gas Shales in Two and Three Dimensions Using Nanometer-Scale Resolution Imaging. Bulletin 96, 665–677. doi:10.1306/08151110188
Dai, J., Zou, C., Dong, D., Ni, Y., Wu, W., Gong, D., et al. (2016). Geochemical Characteristics of marine and Terrestrial Shale Gas in China. Mar. Pet. Geology. 76, 444–463. doi:10.1016/j.marpetgeo.2016.04.027
Dong, D., Cheng, K., Wang, Y., Li, X. J., Wang, S., and Huang, J. L. (2010). Forming Conditions and Characteristics of Shale Gas in the Lower Paleozoic of the Upper Yangtze Region, China. Oil Gas Geology. 31 (3), 288–299. doi:10.11743/ogg20100304
Emmanuel, S., Eliyahu, M., Day-Stirrat, R. J., Hofmann, R., and Macaulay, C. I. (2016). Impact of thermal Maturation on Nano-Scale Elastic Properties of Organic Matter in Shales. Mar. Pet. Geology. 70, 175–184. doi:10.1016/j.marpetgeo.2015.12.001
Gao, Z., and Hu, Q. (2018). Pore Structure and Spontaneous Imbibition Characteristics of marine and continental Shales in China. Bulletin 102 (10), 1941–1961. doi:10.1306/03291817297
Hao, F., and Zou, H. (2013). Cause of Shale Gas Geochemical Anomalies and Mechanisms for Gas Enrichment and Depletion in High-Maturity Shales. Mar. Pet. Geology. 44, 1–12. doi:10.1016/j.marpetgeo.2013.03.005
Hill, R. J., Jarvie, D. M., Zumberge, J., Henry, M., and Pollastro, R. M. (2007). Oil and Gas Geochemistry and Petroleum Systems of the Fort Worth Basin. Bulletin 91, 445–473. doi:10.1306/11030606014
Jacob, H. (1989). Classification, Structure, Genesis and Practical Importance of Natural Solid Oil Bitumen (“migrabitumen”). Int. J. Coal Geology. 11, 65–79. doi:10.1016/0166-5162(89)90113-4
Jarvie, D. M., Hill, R. J., Ruble, T. E., and Pollastro, R. M. (2007). Unconventional Shale-Gas Systems: The Mississippian Barnett Shale of north-central Texas as One Model for Thermogenic Shale-Gas Assessment. Bulletin 91 (4), 475–499. doi:10.1306/12190606068
Ji, W., Song, Y., Jiang, Z., Meng, M., Liu, Q., Chen, L., et al. (2016). Fractal Characteristics of Nano-Pores in the Lower Silurian Longmaxi Shales from the Upper Yangtze Platform, south China. Mar. Pet. Geology. 78, 88–98. doi:10.1016/j.marpetgeo.2016.08.023
Li, W., Hu, G., and Zhou, J. (2015). Asphalt Features and Gas Accumulation Mechanism of Sinian Reservoirs in the Tongwan Palaeo-Uplift, Sichuan Basin. Nat. Gas Industry B 2 (4), 314–322. doi:10.1016/j.ngib.2015.09.004
Liu, B., Jin, L., and Hu, C. (2019). Fractal Characterization of Silty Beds/laminae and its Implications for the Prediction of Shale Oil Reservoir in Qingshankou Formation of Northern Songliao Basin, Northeast China. Fractals 27, 1–12. doi:10.1142/s0218348x19400097
Loucks, R. G., Reed, R. M., Ruppel, S. C., and Hammes, U. (2012). Spectrum of Pore Types and Networks in Mudrocks and a Descriptive Classification for Matrix-Related Mudrock Pores. Bulletin 96, 1071–1098. doi:10.1306/08171111061
Loucks, R. G., Reed, R. M., Ruppel, S. C., and Jarvie, D. M. (2009). Morphology, Genesis, and Distribution of Nanometer-Scale Pores in Siliceous Mudstones of the Mississippian Barnett Shale. J. Sediment. Res. 79, 848–861. doi:10.2110/jsr.2009.092
Mathia, E. J., Bowen, L., ThomasAplim, K. M. A. C., and Aplin, A. C. (2016). Evolution of Porosity and Pore Types in Organic-Rich, Calcareous, Lower Toarcian Posidonia Shale. Mar. Pet. Geology. 75, 117–139. doi:10.1016/j.marpetgeo.2016.04.009
Milliken, K. L., Ko, L. T., Pommer, M., and Marsaglia, K. M. (2014). SEM Petrography of Eastern Mediterranean Sapropels: Analogue Data for Assessing Organic Matter in Oil and Gas Shales. J. Sediment. Res. 84 (11), 961–974. doi:10.2110/jsr.2014.75
Myshakin, E. M., Singh, H., Sanguinito, S., Bromhal, G., and Goodman, A. L. (2019). Flow Regimes and Storage Efficiency of CO2 Injected into Depleted Shale Reservoirs. Fuel 246, 169–177. doi:10.1016/j.fuel.2019.02.095
Ross, D. J. K., and Marc Bustin, R. (2009). The Importance of Shale Composition and Pore Structure upon Gas Storage Potential of Shale Gas Reservoirs. Mar. Pet. Geology. 26, 916–927. doi:10.1016/j.marpetgeo.2008.06.004
Sun, M., Yu, B., Hu, Q., Yang, R., Zhang, Y., and Li, B. (2017). Pore Connectivity and Tracer Migration of Typical Shales in south China. Fuel 203, 32–46. doi:10.1016/j.fuel.2017.04.086
Tang, X., Jiang, Z., Jiang, S., and Li, Z. (2016). Heterogeneous Nanoporosity of the Silurian Longmaxi Formation Shale Gas Reservoir in the Sichuan Basin Using the QEMSCAN, FIB-SEM, and Nano-CT Methods. Mar. Pet. Geology. 78, 99–109. doi:10.1016/j.marpetgeo.2016.09.010
Tian, H., Pan, L., Xiao, X., Wilkins, R. W. T., Meng, Z., and Huang, B. (2013). A Preliminary Study on the Pore Characterization of Lower Silurian Black Shales in the Chuandong Thrust Fold Belt, Southwestern China Using Low Pressure N2 Adsorption and FE-SEM Methods. Mar. Pet. Geology. 48 (48), 8–19. doi:10.1016/j.marpetgeo.2013.07.008
Ungerer, P., Collell, J., and Yiannourakou, M. (2014). Molecular Modeling of the Volumetric and Thermodynamic Properties of Kerogen: Influence of Organic Type and Maturity. Energy Fuels 29 (1), 91–105. doi:10.1021/ef502154k
Wang, P., Jiang, Z., Chen, L., Yin, L., Li, Z., Zhang, C., et al. (2016b). Pore Structure Characterization for the Longmaxi and Niutitang Shales in the Upper Yangtze Platform, South China: Evidence from Focused Ion Beam-He Ion Microscopy, Nano-Computerized Tomography and Gas Adsorption Analysis. Mar. Pet. Geology. 77, 1323–1337. doi:10.1016/j.marpetgeo.2016.09.001
Wang, P., Jiang, Z., Ji, W., Zhang, C., Yuan, Y., Chen, L., et al. (2016a). Heterogeneity of Intergranular, Intraparticle and Organic Pores in Longmaxi Shale in Sichuan Basin, South China: Evidence from SEM Digital Images and Fractal and Multifractal Geometries. Mar. Pet. Geology. 72, 122–138. doi:10.1016/j.marpetgeo.2016.01.020
Wang, Y., Zhao, C., Wang, H., Wang, Z., and Wang, Z. (2013). Origins of Natural Gases from marine Strata in Northeastern Sichuan Basin (China) from Carbon Molecular Moieties and Isotopic Data. J. Asian Earth Sci. 65, 13–20. doi:10.1016/j.jseaes.2012.09.015
Xu, Z., Wang, Y., Jiang, S., Fang, C., Liu, L., Wu, K., et al. (2022). Impact of Input, Preservation and Dilution on Organic Matter Enrichment in Lacustrine Rift basin: A Case Study of Lacustrine Shale in Dehui Depression of Songliao Basin, NE China. Mar. Pet. Geology. 135, 105386. doi:10.1016/j.marpetgeo.2021.105386
Yang, F., Ning, Z., Wang, Q., and Liu, H. (2016). Pore Structure of Cambrian Shales from the Sichuan Basin in China and Implications to Gas Storage. Mar. Pet. Geology. 70, 14–26. doi:10.1016/j.marpetgeo.2015.11.001
Yang, R., He, S., Hu, Q., Sun, M., Hu, D., and Yi, J. (2017). Applying SANS Technique to Characterize Nano-Scale Pore Structure of Longmaxi Shale, Sichuan Basin (China). Fuel 197, 91–99. doi:10.1016/j.fuel.2017.02.005
Zhang, K., Jia, C., Song, Y., Jiang, S., Jiang, Z., Wen, M., et al. (2020). Analysis of Lower Cambrian Shale Gas Composition, Source and Accumulation Pattern in Different Tectonic Backgrounds: A Case Study of Weiyuan Block in the Upper Yangtze Region and Xiuwu Basin in the Lower Yangtze Region. Fuel 263, 115978. doi:10.1016/j.fuel.2019.115978
Zhang, T., Ellis, G. S., Ruppel, S. C., Milliken, K., and Yang, R. (2012). Effect of Organic-Matter Type and thermal Maturity on Methane Adsorption in Shale-Gas Systems. Org. Geochem. 47, 120–131. doi:10.1016/j.orggeochem.2012.03.012
Zhao, J., Jin, Z., Jin, Z., Hu, Q., Hu, Z., Du, W., et al. (2017). Mineral Types and Organic Matters of the Ordovician-Silurian Wufeng and Longmaxi Shale in the Sichuan Basin, China: Implications for Pore Systems, Diagenetic Pathways, and Reservoir Quality in fine-grained Sedimentary Rocks. Mar. Pet. Geology. 86, 655–674. doi:10.1016/j.marpetgeo.2017.06.031
Zhao, W., Li, J., Yang, T., Wang, S., and Huang, J. (2016). Geological Difference and its Significance of marine Shale Gases in South China. Pet. Exploration Dev. 43 (4), 547–559. doi:10.1016/s1876-3804(16)30065-9
Zheng, H., Gao, B., Peng, Y., Nie, H., and Yang, F. (2013). Sedimentary Evolution and Shale Gas Exploration Direction of the Lower Silurian in Middle-Upper Yangtze Area. J. Palaeogeogr. 15 (5), 645–656.
Zhou, W., Xu, H., Yu, Q., Xie, R., and Deng, K. (2016). Shale Gas-Bearing Property Differences and Their Genesis between Wufeng-Longmaxi Formation and Qiongzhusi Formation in Sichuan Basin and Surrounding Areas. Lithologic reservoirs 28 (5), 18–25.
Zhu, Y., Hao, F., Zou, H., Cai, X., and Luo, Y. (2007). Jurassic Oils in the central Sichuan basin, Southwest China: Unusual Biomarker Distribution and Possible Origin. Org. Geochem. 38, 1884–1896. doi:10.1016/j.orggeochem.2007.06.016
Keywords: OM isolation, OM-hosted pore, pore properties, thermal maturity, marine shales, South China
Citation: Miao Y, Zhang F, Wang S, Wu F and Li X (2022) Constraints on Pore Development in Marine Shales of the Upper Yangtze Area, South China: A Comparative Case of Lower Cambrian and Lower Silurian Formations. Front. Earth Sci. 10:854129. doi: 10.3389/feart.2022.854129
Received: 13 January 2022; Accepted: 24 January 2022;
Published: 17 March 2022.
Edited by:
Kun Zhang, Southwest Petroleum University, ChinaReviewed by:
Tingwei Li, Guangzhou Marine Geological Survey, ChinaZhengjian Xu, Chongqing University of Science and Technology, China
Pengfei Wang, China Geological Survey, China
Copyright © 2022 Miao, Zhang, Wang, Wu and Li. This is an open-access article distributed under the terms of the Creative Commons Attribution License (CC BY). The use, distribution or reproduction in other forums is permitted, provided the original author(s) and the copyright owner(s) are credited and that the original publication in this journal is cited, in accordance with accepted academic practice. No use, distribution or reproduction is permitted which does not comply with these terms.
*Correspondence: Xin Li, bGl4aW5fMjY4NkAxMjYuY29t