 Sheqiang Miao
 Yongsheng Zhou*
94% of researchers rate our articles as excellent or good
Learn more about the work of our research integrity team to safeguard the quality of each article we publish.
Find out more
ORIGINAL RESEARCH article
Front. Earth Sci., 18 March 2022
Sec. Solid Earth Geophysics
Volume 10 - 2022 | https://doi.org/10.3389/feart.2022.853474
This article is part of the Research TopicHigh-pressure Physical Behavior of Minerals and Rocks: Mineralogy, Petrology and GeochemistryView all 16 articles
The P-wave velocities of typical rocks in the Anninghe fault zone under pressures of 50–600 MPa were systematically measured. The P-wave velocities of the felsic, intermediate, and mafic rock types under atmospheric pressure were 5.86, 6.06, and 6.50 km/s, respectively, with pressure coefficients of 2.19 × 10–, 3.80 × 10⁻⁴, and 4.03 × 10⁻⁴ km/s/MPa, respectively. The results were combined with deep-imaging seismic data to establish crustal rock composition models at different depths in the study area. The composition of the Anninghe crust is very different in the horizontal and vertical directions. The most notable feature in the vertical direction is that the lithologic compositional change is gradual rather than abrupt with increasing depth. In the middle and upper crust, shallower than 25 km, the lithologic difference between the southern and northern sections of the Anninghe fault zone is primarily that the rocks in the southern section (Xichang) are more felsic than those in the northern section (Shimian).
The Anninghe fault zone is located in Western Sichuan on the eastern edge of the Qinghai–Tibet Plateau. It has a total length of 150 km, starting from Shimian in the north and passing through Mianning to Xichang in the south, as shown in Figure 1. It inclines to the east, with an inclination ranging from 50° to 80°. The Anninghe fault zone forms the eastern boundary of the Sichuan–Yunnan block, together with three other sinistral strike-slip fault zones—Xianshuihe in the northwest and Zemuhe and Xiaojiang in the south. It is the fault zone with the most frequent seismic activity in Southwest China (Zhang, 2008). Previous studies suggested that the Anninghe fault was divided into two segments around Mianning, the northern segment of the fault is located from Shimian to Mianning and the southern segment of the fault is located from Mianning to Xichang. The observed fault activity indicates that the activity rates of the northern and southern sections are approximately 2.8–3.7 and 5–8 mm/a, respectively. Six of the eight recorded earthquakes with Ms > 6.0 occurred in the southern segment (Ran et al., 2008). The Anninghe fault zone is the main area of strain accumulation in the Sichuan–Yunnan region. There are some gaps or sparse sections of small earthquake activity along the fault zone, and attention should be paid to the potential for medium- and long-term strong earthquakes in this area (Wen et al., 2008).
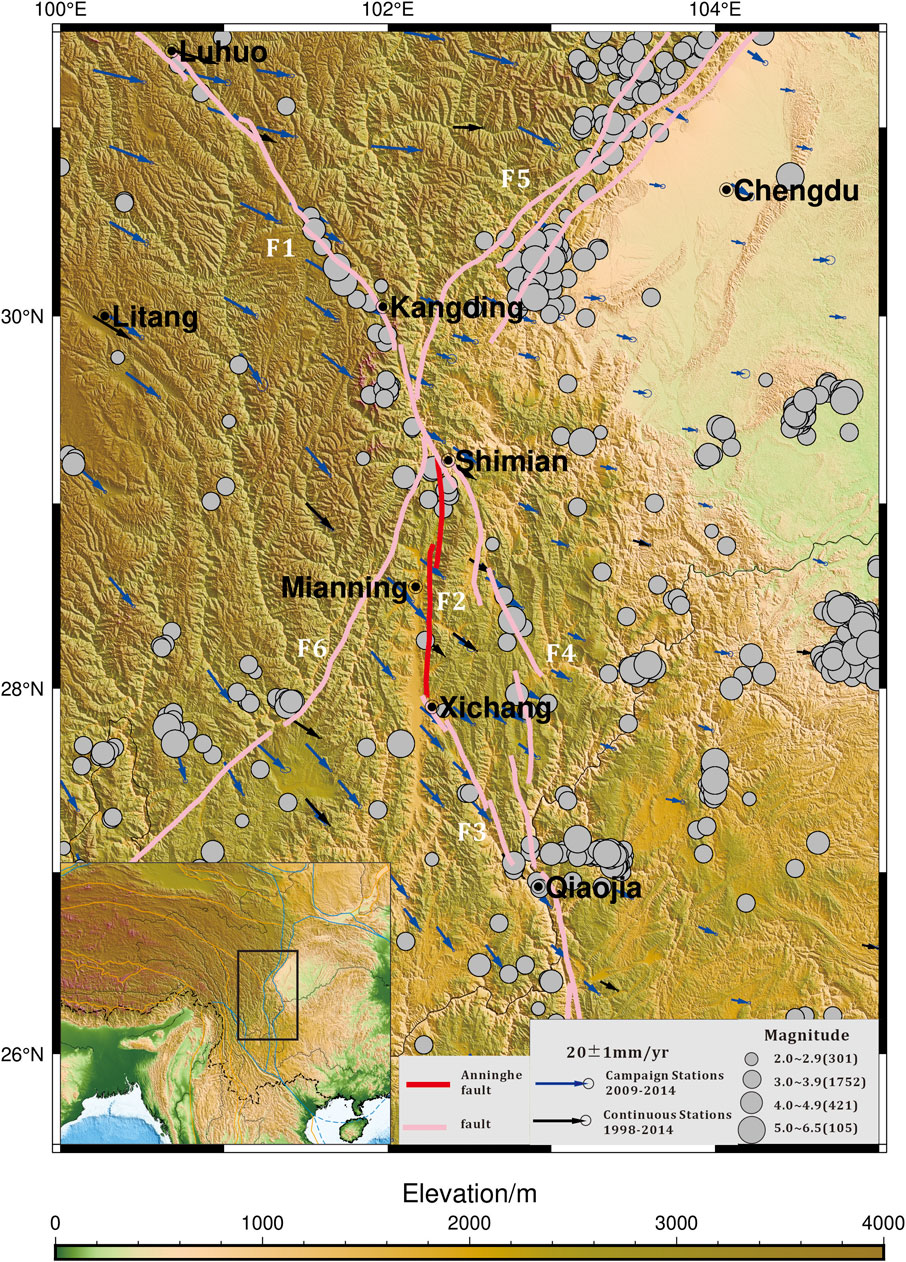
FIGURE 1. Tectonic and topographicmap of eastern margin of the Tibetan Plateau. F1: Xianshuihe fault, F2: Aninghe fault, F3: Zemuhe fault, F4: Daliangshan fault, F5: Longmenshan fault, F6: Lijiang-Xiaojinhe fault. Blue and black vectors show GPS velocity field of crustal motion in eastern margin of the Tibetan Plateau relative to the stable Eurasia. Gray small circles show epicenters of earlier documented historical earthquakes (2012–2021).
Lithologic structure models of the fault zone form a basis for establishing the rheological structure and strength of the fault, which is significant for assessing and forecasting earthquake hazards (Christensen and Fountain, 1975; Sun et al., 2012).
Here, we report measurements of the P-wave velocities of various exposed rock types in the Anninghe fault zone up to pressures of 600 MPa. The data are compared with the crustal P-wave velocity to estimate the crustal mineral compositions and lithologic structures in Shimian, Mianning, and Xichang, which are important nodes in the study area.
Representative samples of basement and intrusive rocks in the study area (Indosinian and Jinning granitoids, Indosinian diorites, Jinning and Hercynian mafic rocks, and Precambrian rocks) were systematically collected along the Anninghe fault zone and included granite, granodiorite, granodiorite mylonite, anorthosite, diorite, mafic granulite, gabbro, diabase, and pyroxenite. The samples used in the experiments were fresh, complete, and dense, with porosities of less than 0.5%. The chemical compositions and densities of the samples are shown in Table 1. Principal element analyses were completed using X-ray fluorescence spectroscopy at the Institute of Geology and Geophysics, Chinese Academy of Sciences, and the densities were obtained using the immersion method.
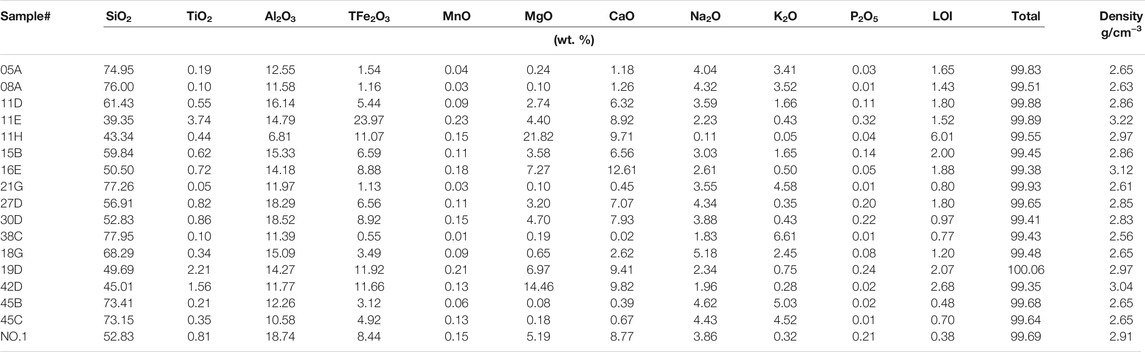
TABLE 1. Chemical compositions and densities of the rock samples.
The samples were cylinders with a diameter of 20 cm and a height of 40 cm. For the anisotropic samples, the wave velocities in the directions perpendicular and parallel to the foliation were measured. The high-pressure wave velocity experiments were completed at the State Key Laboratory of Earthquake Dynamics, Institute of Geology, China Earthquake Administration, using ultrasonic pulse transmission technology, as shown in Figure 2 (Yang X et al., 2014). The ultrasonic transducer was 1.0-MHz LiNbO3, the ultrasonic sampling accuracy was 12 bits, the maximum sampling rate was 100 MHz, and the measurement accuracy was better than 1.0% (p > 20 MPa). The experiments were performed at room temperature and at pressures of 10–600 MPa. Because the wave velocity increased nonlinearly and rapidly with pressure under low pressures, the measurement interval was 25 MPa below 200 and 50 MPa above 200 MPa (Yang Y et al., 2014).
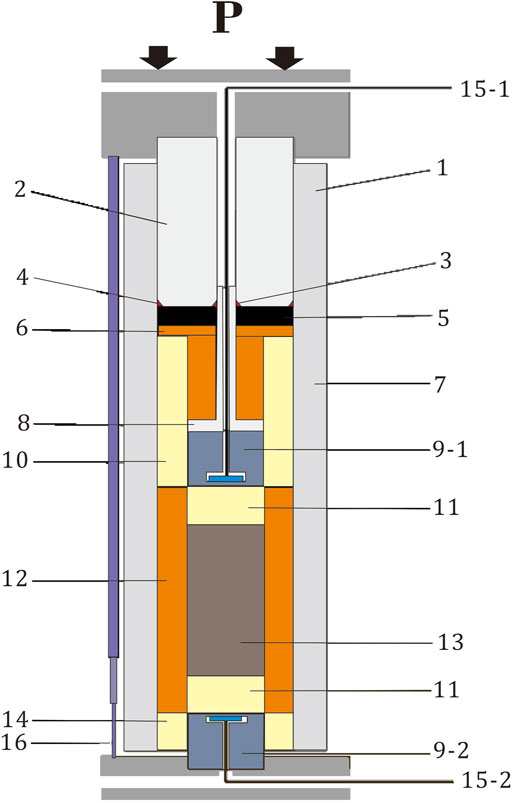
FIGURE 2. Schematic of the sample assembly and layout of the ultrasonic transducer: (1) tungsten carbide sample chamber; (2) tungsten carbide piston indenter; (3) inner copper triangular seal ring; (4) outer copper triangular seal ring; (5) lead pad; (6) pyrophyllite pad; (7) pyrophyllite column; (8) T-shaped steel pipe; (9-1) and (9-2) upper and lower ultrasonic transducers, respectively; (10) alumina jacket; (11-1) and (11-2) upper and lower corundum pillars; (12) pyrophyllite coat; (13) samples; (14) alumina jacket; (15-1) and (15-2) ultrasonic transducer leads; and (16) displacement sensor.
Natural rocks may have elastic anisotropy resulting from compositional stratification, lattice-preferred orientations, and shape-preferred orientations. The arithmetic mean value of the wave velocities in different directions can be close to the wave velocity value of an isotropic rock (Ji et al., 2014; Kern et al., 2015). In this study, the P-wave velocities of 20 samples were measured. Figure 3 summarizes the wave velocity measurement results. Figure 4A shows the dependence of the wave velocities of various rocks on the SiO2 content at 500 MPa, and Figure 4B shows the dependence of the wave velocities and densities of various rocks at 500 MPa. Figure 4C shows wave velocities of felsic, intermediate, and mafic rocks as a function of the pressure.
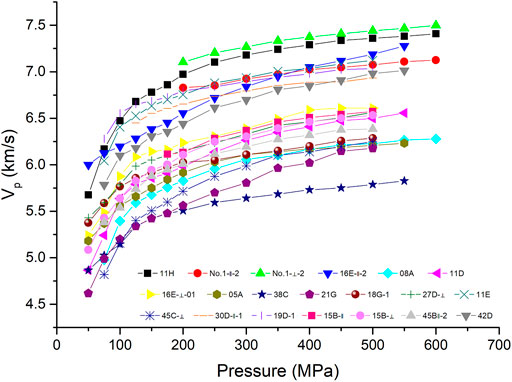
FIGURE 3. Pressure dependence of the P-wave velocities, where ∥ indicates the wave velocity parallel to the foliation direction and ⊥ indicates the wave velocity perpendicular to the foliation direction.
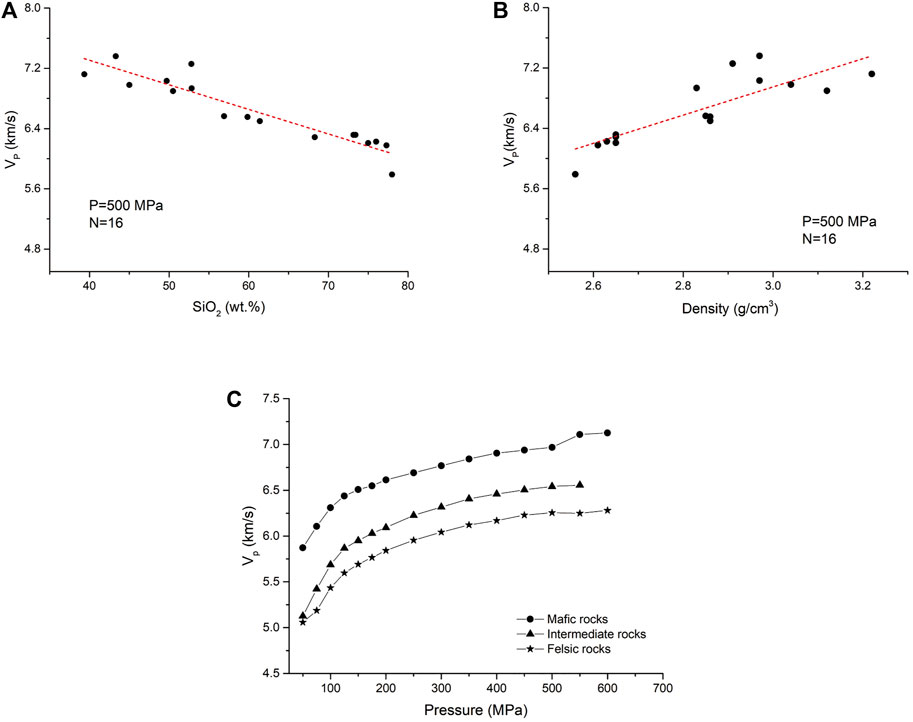
FIGURE 4. (A) Relationship between the wave velocity and the SiO2 content under a pressure of 500 MPa (for anisotropic samples, the values are averaged in two directions). (B) Relationship between the wave velocity and the density under a pressure of 500 MPa. (C) Wave velocities of felsic, intermediate, and mafic rocks as a function of the pressure.
The experimental P-wave velocities of the rocks in the study area had the following characteristics. 1) With increasing pressure, the P-wave velocities of all rock types increased rapidly and nonlinearly in the range of 0–300 MPa. In the range of 300–600 MPa, even though the P-wave velocities increased, the increase rate slowed and the relationship between the P-wave velocity and the pressure was approximately linear. This indicates that the microcracks in the rocks were essentially closed at 300 MPa and that the P-wave velocity value in the range of 300–600 MPa reflects the intrinsic characteristics of the rocks. 2) The P-wave velocity of the rocks had an inverse correlation with the SiO2 content and a positive correlation with the density. These laws are mafically consistent with the results obtained by multiple previous researchers (Christensen and Mooney, 1995; Ji et al., 2002). The P-wave velocities of the felsic, intermediate, and mafic rock types under atmospheric pressure were 5.86, 6.06, and 6.50 km/s, respectively, with pressure coefficients of 2.19 × 10⁻⁴, 3.80 × 10⁻⁴, and 4.03 × 10⁻⁴ km/s/MPa, respectively.
Deep-imaging seismic data along the Anninghe fault are shown in Figure 5A (Wu Jianping, personal communication). The P-wave velocity experimental results for the basement rocks were corrected to the pressure (P) and temperature (T) conditions of the middle and lower crust using the following equation:
where Z is the depth, V0 is the extrapolated zero pressure wave velocity, D is the pressure derivative of the wave velocity, P is the lithostatic pressure, and dV/dT is the temperature reciprocal of the wave velocity, which is assumed to be 3.5 × 10⁻⁴ km/s/°C here. The temperature–depth profile for the Anninghe fault zone was calculated based on the surface heat flow of 55 mW/m2 (Hu et al., 2001). The results are shown in Figure 5B.
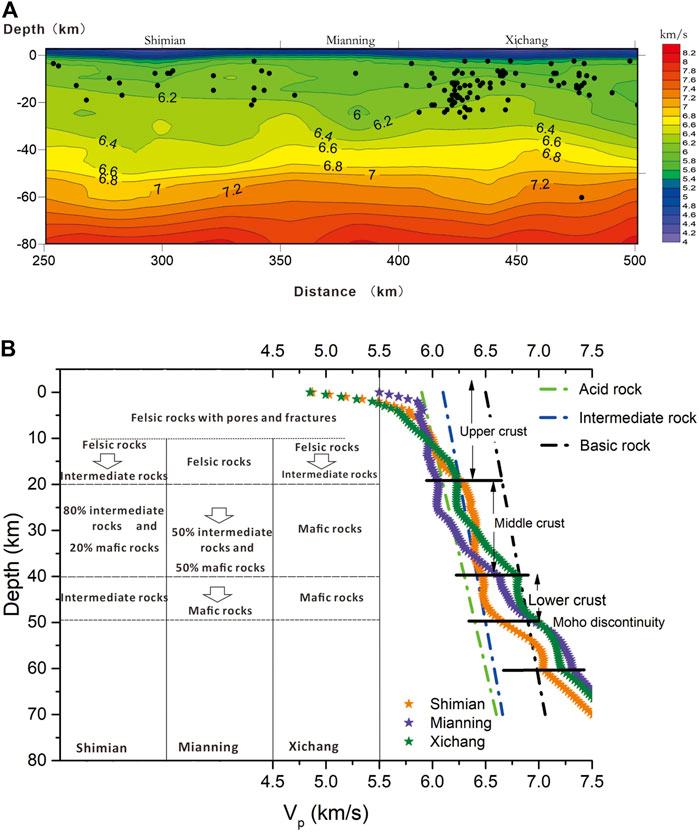
FIGURE 5. (A) Deep-imaging seismic data along the Anninghe fault. Black small circles show hypocenters of earlier documented historical earthquakes (2008–2021). (B) Comparison between the experimental data and the deep-imaging seismic data shown alongside the crustal rock composition model.
In general, the crust along the Anninghe fault zone is divided into upper, middle, and lower layers. The thicknesses of the upper, middle, and lower crust are 20 km, 20 km, and approximately 10 km, respectively (Li et al., 2016; Zhu et al., 2017). Comparing the experimental data with the deep-imaging seismic data indicates that the lithospheric composition in the study area is very different in the transverse and longitudinal directions and that the wave velocity of each layer does not correspond to a single felsic or mafic rock type because the wave velocity obviously falls between those of the two rock types. In this case, the proportion of each lithology was calculated according to the Voigt–Reuss–Hill model (Sun et al., 2012).
The estimations of the crustal lithologic compositions in Shimian, Mianning, and Xichang are shown in Figure 5B. At depths of 0–10 km, the wave velocity gradually increases from 5.5 to 6.0 km/s, corresponding to the gradual closure of the pores and fractures of the felsic rocks.
Within the middle crust, the change rate of the wave velocity with depth in Mianning and Xichang is significantly greater than those of the felsic or mafic rock types obtained in the laboratory; therefore, there is an obvious compositional change with depth. The most notable feature in the vertical direction is that the lithologic compositional change is gradual rather than abrupt with increasing depth.
In the middle and upper crust, shallower than 25 km, that is, at the lower limit of the main seismogenic depth for earthquakes, the lithological difference between the southern and northern sections of the Anninghe fault zone is primarily that the rocks in the southern section (Xichang) are more felsic than those in the northern section (Shimian). Whether this lithologic difference leads to the rapid slip rate in the south section, where most of the large earthquakes above 6.0 occur, is worthy of further investigation.
The P-wave velocities of various rock types in the Anninghe fault zone under pressures of 0–600 MPa were systematically measured. The results were combined with deep-imaging seismic data to establish crustal rock composition models at different depths in the study area. At depths of 0–10 km, the wave velocity gradually increases from 5.5 to 6.0 km/s, corresponding to the gradual closure of the pores and fractures in felsic rocks. With increasing depth, the composition changes significantly, with the lithology gradually changing from felsic rocks to a mixture of intermediate and mafic rocks at the bottom of the middle crust. In the middle and upper crust, shallower than 25 km, the rocks in the southern section (Xichang) of the Anninghe fault zone are more felsic than those in the northern section (Shimian).
The original contributions presented in the study are included in the article/supplementary material, further inquiries can be directed to the corresponding author.
ZY contributed to conception and design of this study. SM conducted the experiments and wrote the first draft of the manuscript. All authors contributed to manuscript revision, read, and approved the submitted version.
This study was supported by the National Key Research and Development Program of China (Grant 2018YFC1503400) and the Basic Research Fund of the Institute of Geology, China Earthquake Administration (IGCEA1912).
The authors declare that the research was conducted in the absence of any commercial or financial relationships that could be construed as a potential conflict of interest.
All claims expressed in this article are solely those of the authors and do not necessarily represent those of their affiliated organizations, or those of the publisher, the editors and the reviewers. Any product that may be evaluated in this article, or claim that may be made by its manufacturer, is not guaranteed or endorsed by the publisher.
We thank Prof. Lidong Dai for his kind invitation, Prof. Xiaosong Yang and Wenbo Qi for their valuable technical support during the experimental phase, Prof. Jianping Wu for providing the deep-imaging seismic data, Wenming Yao for providing assistance with the sample preparation, and Tongbin Shao for his valuable suggestions which significantly improved the manuscript.
Christensen, N. I., and Fountain, D. M. (1975). Constitution of the Lower Continental Crust Based on Experimental Studies of Seismic Velocities in Granulite. Geol. Soc. America Bull. 86, 227–236. doi:10.1130/0016-7606(1975)86<227:cotlcc>2.0.co;2
Christensen, N. I., and Mooney, W. D. (1995). Seismic Velocity Structure and Composition of the continental Crust: A Global View. J. Geophys. Res. 100, 9761–9788. doi:10.1029/95jb00259
Hu, S. B., He, L. J., and Wang, J. Y. (2001). Compilation of Heat Flow Data in the China continental Area (3rd Edition). Chinj. Geophys. 44 (5), 611–626. (in Chinese with English abstract). doi:10.1002/cjg2.180
Ji, S., Shao, T., Salisbury, M. H., Sun, S., Michibayashi, K., Zhao, W., et al. (2014). Plagioclase Preferred Orientation and Induced Seismic Anisotropy in Mafic Igneous Rocks. J. Geophys. Res. Solid Earth 119, 8064–8088. doi:10.1002/2014jb011352
Ji, S., Wang, Q., and Xia, B. (2002). Handbook of Seismic Properties of Minerals, Rocks and Ores. Presses inter Polytechnique.
Kern, H., Lokajicek, T., Svitek, T., and Wenk, H. R. (2015). Seismic Anisotropy of Serpentinite from Val Malenco, Italy. J. Geophys. Res. Solid Earth 120, 4113–4129. doi:10.1002/2015jb012030
Li, M., Zhang, S., Wang, F., Wu, T., and Qin, W. (2016). Crustal and Upper-Mantle Structure of the southeastern Tibetan Plateau from Joint Analysis of Surface Wave Dispersion and Receiver Functions. J. Asian Earth Sci. 117, 52–63. doi:10.1016/j.jseaes.2015.12.002
Ran, Y., Chen, L., Cheng, J., and Gong, H. (2008). Late Quaternary Surface Deformation and Rupture Behavior of strong Earthquake on the Segment north of Mianning of the Anninghe Fault. Sci. China Ser. D-earth Sci. 51, 1224–1237. doi:10.1007/s11430-008-0104-6
Sun, S., Ji, S., Wang, Q., Wang, H., Long, C., and Salisbury, M. (2012). Seismic Properties of the Longmen Shan Complex: Implications for the Moment Magnitude of the Great 2008 Wenchuan Earthquake in China. Tectonophysics 564-565, 68–82. doi:10.1016/j.tecto.2012.06.018
Wen, X., Fan, J., Yi, G., Deng, Y., and Long, F. (2008). A Seismic gap on the Anninghe Fault in Western Sichuan, China. Sci. China Ser. D-earth Sci. 51, 1375–1387. doi:10.1007/s11430-008-0114-4
Yang, X., Yang, Y., and Chen, J. (2014). Pressure Dependence of Density, Porosity, Compressional Wave Velocity of Fault Rocks from the Ruptures of the 2008 Wenchuan Earthquake, China. Tectonophysics 619-620, 133–142. doi:10.1016/j.tecto.2013.09.012
Yang, Y., Chen, J. Y., and Yang, X. S. (2014). Experimental Studies on Relationship between P-Wave Velocity and Porosity of Fault Rocks from the Rupture of the 2008 Wenchuan Earthquake. Chin. J. Geophys. 57, 1883–1890. (in Chinese with English abstract).
Zhang, P. Z. (2008). Present Tectonic Deformation, Strain Distribution and Deep Dynamic Process in Western Sichuan on the Eastern Margin of Qinghai –Tibet Plateau. Sci. China: Earth Sci., 1041–1056.
Keywords: P-wave velocity, high-pressure experiment, lithologic structure, Anninghe fault zone, crust
Citation: Miao S, Zhou Y, Ma X and Dang J (2022) Lithologic Structure of the Anninghe Fault Zone: Constraints From High-Pressure Wave Velocity Experiments. Front. Earth Sci. 10:853474. doi: 10.3389/feart.2022.853474
Received: 12 January 2022; Accepted: 31 January 2022;
Published: 18 March 2022.
Edited by:
Lidong Dai, Institute of geochemistry (CAS), ChinaReviewed by:
Lin Wu, Institute of Geology and Geophysics (CAS), ChinaCopyright © 2022 Miao, Zhou, Ma and Dang. This is an open-access article distributed under the terms of the Creative Commons Attribution License (CC BY). The use, distribution or reproduction in other forums is permitted, provided the original author(s) and the copyright owner(s) are credited and that the original publication in this journal is cited, in accordance with accepted academic practice. No use, distribution or reproduction is permitted which does not comply with these terms.
*Correspondence: Yongsheng Zhou, emhvdXlzaEBpZXMuYWMuY24=
Disclaimer: All claims expressed in this article are solely those of the authors and do not necessarily represent those of their affiliated organizations, or those of the publisher, the editors and the reviewers. Any product that may be evaluated in this article or claim that may be made by its manufacturer is not guaranteed or endorsed by the publisher.
Research integrity at Frontiers
Learn more about the work of our research integrity team to safeguard the quality of each article we publish.