 Haidong Lian1,2,3
 Zhaojun Sun
94% of researchers rate our articles as excellent or good
Learn more about the work of our research integrity team to safeguard the quality of each article we publish.
Find out more
ORIGINAL RESEARCH article
Front. Earth Sci., 20 April 2022
Sec. Hydrosphere
Volume 10 - 2022 | https://doi.org/10.3389/feart.2022.852485
This article is part of the Research TopicHydrological Processes in Agricultural LandsView all 8 articles
Long periods of surface water irrigation and water and salt movement have slow and continuous influence on the evolution of soil salinization in a closed hydrogeological unit of arid irrigation areas. It is of more application value to study the evolution process of soil salinization from the perspective of regional medium and long terms in the regional scale for the sustainable development of irrigated areas. In this study, the spatial–temporal evolution of soil salinization and dominant factors for soil salination, and the relationship between soil salination and the groundwater buried depth were studied through spatial interpolation and statistical analysis with long-time observed data of a closed hydrogeological unit in the Jingtaichuan Electric-Lifting Irrigation Area in Gansu Province, China. The results showed that from 2001 to 2016, the soil salt content, the groundwater mineralization, and the surface irrigated water amount in the study area enhanced slowly, while the groundwater buried depth decreased; the salinization degree in the study area was increasing slowly; there was a positive correlation between the soil salt content and the groundwater mineralization, while a negative correlation existed between the soil salt content and either the surface irrigated water amount or the groundwater buried depth; the groundwater buried depth had the strongest impact on the spatial distribution of the soil salt content; the increase rate of the soil salt content lowered as the groundwater buried depth increased, which met the logarithmic relationship; soil salination was actively developed in regions with a low groundwater buried depth below 2.5 m, and soil salinization became evident in regions with a groundwater buried depth below 5 m; 15.0 m was a critical groundwater buried depth that caused the increase or the decrease in the soil salt content. The research results provide a new way to predict the development trend of soil salinization in the medium and long terms and provide a theoretical basis for the development of salinization prevention and control measures in irrigated areas, which is of great significance to maintaining a harmonious soil and water environment in irrigated areas.
Affected by global climate change and human activities, soil salination is one of the main problems hindering the sustainable development of agriculture in irrigation areas nowadays (Wang et al., 2012; Cassel et al., 2015; Bless et al., 2018; Su et al., 2020; Chen et al., 2021). In arid and semiarid irrigation areas in particular, little rainfall and strong evaporation, high groundwater mineralization, and long-term poor irrigation cause the decrease in the groundwater buried depth and the continuous development of soil salination, which becomes the main factor limiting crop growth (Khan et al., 2005; Wang et al., 2018; Zhang et al., 2019). According to statistics, the global saline–alkaline soil area is about 830 million hm2, and it is still in a growing trend (Letey et al., 2011; Bless et al., 2018). Salination poses a major threat to the sustainable utilization of land resources and agricultural production; meanwhile, it causes continuous deterioration of the regional ecological environment (Bouksila et al., 2013; Ren et al., 2019; Semendyaeva et al., 2019). The long-term monitoring of soil salination is of great significance for agricultural development and the improvement of water and the soil environment in irrigation areas. For closed hydrogeological units in arid areas, the spatial and temporal distribution of regional water and salt elements varies slowly due to the specific long-term hydrological cycles and soil water and salt differentiation processes, during which groundwater plays an extremely important role (Wu et al., 2014; Haj-Amor et al., 2017; Nie et al., 2021). To understand in time the spatial and temporal distribution characteristics of regional soil water and salt elements, analyzing the impact of the groundwater buried depth on the soil salt content and identifying the development of soil salination can provide an important scientific basis for regional soil salinization control.
Scholars have conducted many research studies and achieved many research results on the relationship between soil moisture and salinity (Zhao et al., 2020; Zhao T. et al., 2021). It mainly includes the movement of water and salt in different irrigation modes (Li et al., 2019), the movement process of water and salt in different irrigation systems (Zeng et al., 2014; Ning et al., 2021), and numerical simulation analysis of the movement of water and salt in the soil during the irrigation cycle (Lu et al., 2019). These achievements have basically clarified the law and characteristics of water and salt migration in the soil at the microscale and field scale. The distribution of soil water and salt is highly spatially variable, and the spatial–temporal evolution of regional soil water and salt is more complex (Zalibekov et al., 2010; Yang et al., 2011). Limited by the number of sampling sites, it is usually difficult to represent regional or long-term soil salt characteristics. Scholars often use geostatistical methods to study the spatial and temporal distribution of regional soil water and salt elements and soil salinization evolution, and many achievements have been made in terms of explaining and predicting the change of soil salt and analyzing soil salination risks (Yu et al., 2013; Xu et al., 2019; Shaddad et al., 2020). However, there are also disadvantages, such as poor universality, poor time effectiveness, and low accuracy (Lobell et al., 2010; Guo et al., 2018; Wang B. et al., 2021). In particular, the study on the evolution process of soil water and salt elements at the regional scale and long-time cycle needs to be further strengthened.
The formation and evolution of soil salination in irrigation areas are affected by natural conditions, such as terrains, climate, and hydrological conditions. Human activities like land farming, irrigation, and drainage aggravate the development of soil salination (Kaman et al., 2017; Mastrocicco et al., 2020). Most of the studies on influencing factors for soil salination are qualitative; there is a positive correlation between the soil salt content and the groundwater mineralization, and a negative correlation exists between the groundwater buried depth and either the soil salt content or the groundwater mineralization (Seeboonruang, 2013; Ren et al., 2019). But the correlation may change under different soil depths, regions, or scales, so there are few quantitative studies on the relationship between soil salinization and groundwater depth. The groundwater buried depth and the groundwater mineralization are the key factors for soil salt accumulation. At the same soil depth, the soil salt content decreases as the groundwater buried depth increases, and the quantitative relationship between them is complicated (Zhou and Li, 2013; Wang G. et al., 2020; Liu et al., 2020; Li et al., 2021). It is complicated to influence soil salinization by controlling the groundwater buried depth because crops, the soil matrix, climate, and other factors must be considered at the same time. Scholars have obtained different critical groundwater buried depths (Fan et al., 2011; Zhou and Li, 2013), but further study on the regional scale is needed.
Studies on the relationship between soil water and soil salt mostly focus on changes in terms of soil water, the groundwater buried depth, and the soil salt content during the growth cycle of field-scale crops, but these studies fail to take the effect of the dynamic change of the groundwater buried depth and the groundwater mineralization on regional or long-term soil salination into full consideration. Few studies have analyzed the changed rules and the relationship between the soil salt content and the groundwater buried depth or the groundwater mineralization with large-scale data (Du et al., 2010; Zhao X. et al., 2021; Ma et al., 2021; Miao et al., 2022). In this study, the spatial and temporal distribution characteristics and dominant factors for soil salination and the relationship between soil salination and the groundwater buried depth were studied through spatial interpolation, statistical analysis, and regression analysis with the long-time observed data of a closed hydrogeological unit in the Jingtaichuan Electric-Lifting Irrigation Area in Gansu Province, China, so as to provide a theoretical basis for soil salinization control and sustainable development in arid and semiarid irrigation areas.
Jingtaichuan Electric-Lifting Irrigation Area (Phase I) is located in the central part of Jingtai County, Gansu Province, China (between 103°20’∼104°04′E and 37°26’∼38°41′N). Surrounded by Laohu Mountain in the southwest, Qingshidong Mountain in the northwest, Machang Mountain in the southeast, and Mijia Mountain in the east, the area terrain of low mountains and hills slopes from west to east with three intermontane basins, that is, Caowotan Basin, Luyang Basin, and Xingquan Basin. Agricultural production in the area relies on water lifting irrigation from the Yellow River. Affected by the arid climate, the low-lying closed terrain, poor irrigation, and drainage, soil salination shows a continuously increasing trend. In 2015, the total area of the saline–alkaline land distributed in the closed hydrogeological units in the irrigation area was 4,500 hm2, accounting for 21.75% of the total area of cultivated land. The study area, located in the eastern part of the irrigation area, is a closed hydrogeological unit consisting of three intermontane basins: Caowotan Basin, Luyang Basin, and Xingquan Basin. The terrain is high in the northwest and low in the southeast with a slope of 1/50–1/200. The study area is about 32 km long from south to north, 20 km wide from east to west, covering an area of about 32,000 hm2. The geographical location of the study area is shown in Figure 1.
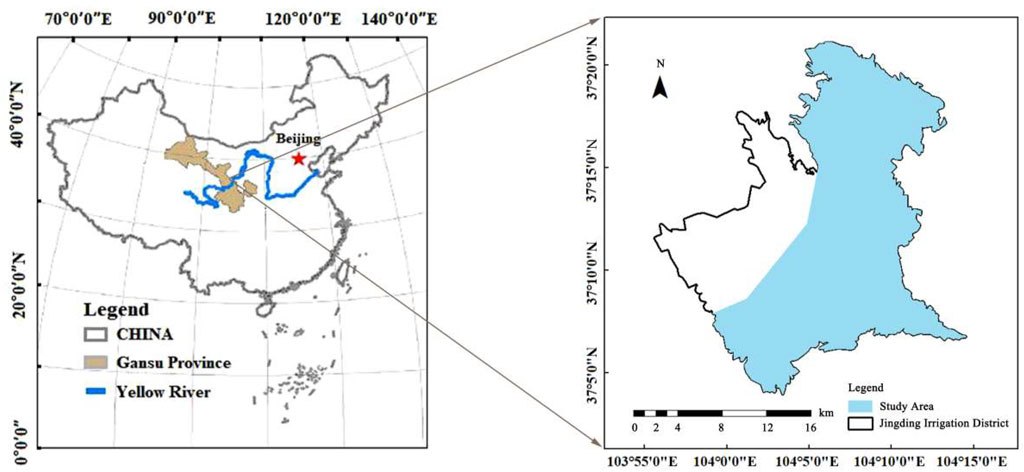
FIGURE 1. Geographical location diagrams of the study area.
The study area has a typical temperate continental climate with little rainfall and strong evaporation (Li J. et al., 2020). The annual average precipitation is 185.7 mm, and the annual average evaporation is 2,433.7 mm, with most precipitation during June-September. The annual sunshine duration is 2,714 h, the frost-free season lasts for 190 days, and the annual average temperature is 8.5°C, with a large temperature difference of (37.3°C ∼ -27.3°C) between summer and winter. The soil surface in the study area is cracked and porous with strong decomposition of organic matter. The soluble salt in the soil matrix is prone to be transported to the surface and is accumulated on the surface due to the strong evaporation, which forms surface salt accumulation and saline–alkaline soil.
The main influencing factors for the soil salt content in the study area which reflects the degree of soil salinization include the groundwater buried depth, the groundwater mineralization, and the surface irrigated water amount. The monitoring data of the soil salt content, the groundwater mineralization, the groundwater buried depth, and the surface irrigated water amount from different spatial points in 2001, 2006, 2011, and 2016 were selected. The sampling sites were scattered in the study area, and different types of land were selected for collection and monitoring to ensure the representation of distribution characteristics of water and salt in the study area. Figure 2 shows the distribution of each monitoring point.
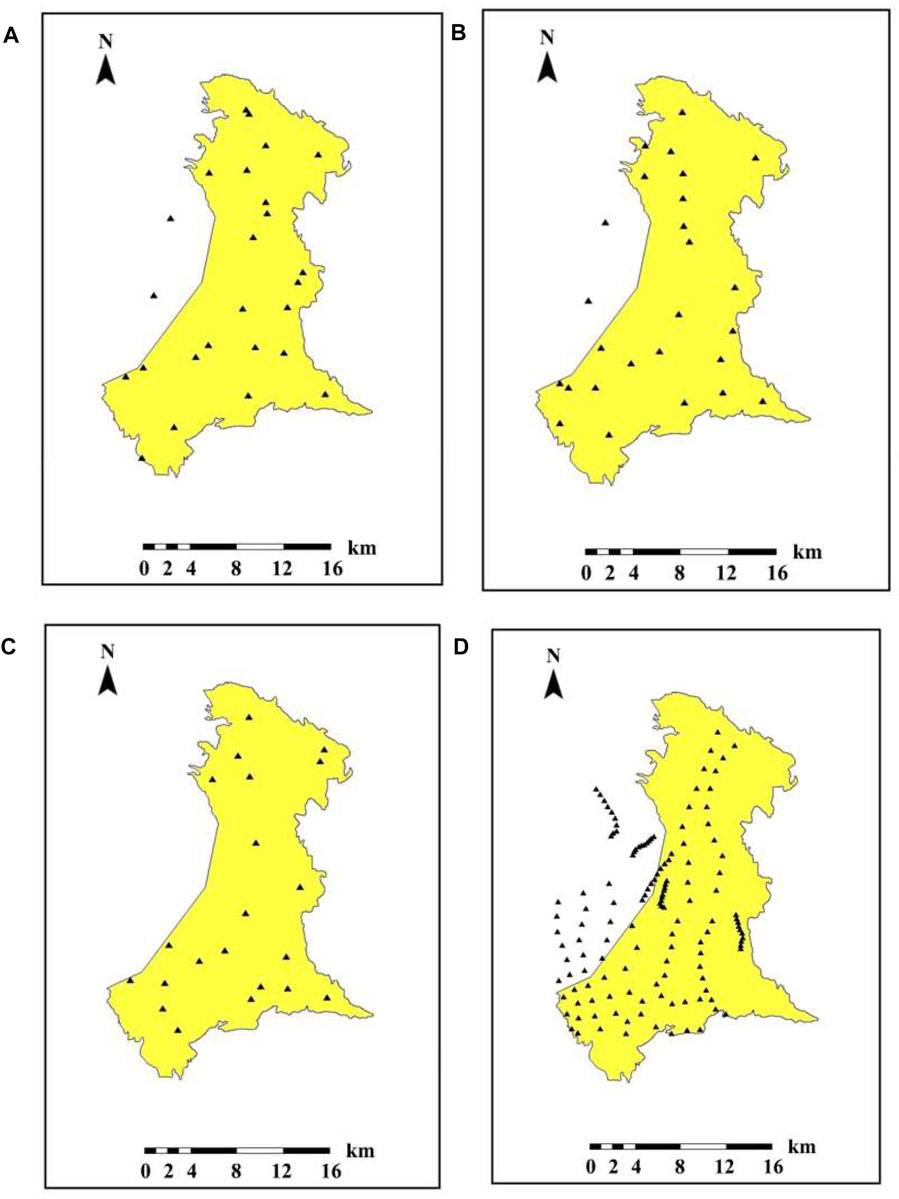
FIGURE 2. Distribution map of interpolation points of each element [(A) soil salt content; (B) groundwater mineralization; (C) groundwater buried depth; (D) surface irrigated water amount].
The data in 2001 and 2006 were derived from the Jingtaichuan Electric-Lifting Irrigation Area Authority of Gansu Province, including the Technical Design Report for Jingtaichuan Electric-Lifting Irrigation Project Phase I (1971), Land Survey Report for Jingtaichuan Electric-Lifting Irrigation Area (1971–2016), Report on Wasteland Resources and the Exploitation and Utilization in Jingtai County of Gansu Province (1971–2016), Statistics of Water Consumption in Water Diversion for Jingtaichuan Electric-Lifting Irrigation Project Phase I (1972–2016), and Hexi Corridor Hydrogeological Survey/Census Report (2015). The data in 2011 and 2016 were collected by the research group in mid-October. Soil salt content: soil samples at 0–20 cm, 20–40 cm, 40–60 cm, 60–80 cm, and 80–100 cm below the ground were collected by soil drill. After natural air drying, the soil samples were selected with a 2-mm sieve, and then the solution with a soil-to-water mass ratio of 1:5 was prepared according to the soil layer. After ultrasonic treatment, oscillation, centrifugation, and filtration, the filtrate was extracted as the sample. The soluble ion content of the filtrate was tested using an ion chromatograph. The ion content of each soil layer was superposing to obtain the soil salt content of 0–100 cm soil layers which was required for the study. Groundwater mineralization: Groundwater samples were extracted from the sampling sites of the groundwater monitoring wells in the study area. After ultrasonic treatment, centrifugation, and filtration, the groundwater samples were extracted, and the mineralization was tested using an ion chromatograph. Groundwater depth: The Jingtaichuan Electric-Lifting Irrigation Area Authority takes monthly records of the water level of the groundwater monitoring well in the irrigation area, and the annual average groundwater buried depth was used in this study. Surface irrigated water amount: The surface irrigated water amount was obtained from the measurement equipment at the canal head of each branch canal in the irrigation area. In order to facilitate the interpolation and ensure accuracy, 10 points were evenly selected on each branch canal, and the water amount of each point was 1/10 of the surface irrigated water amount of the canal head. Table 1 shows the characteristic values of monitoring data of water and salt elements.
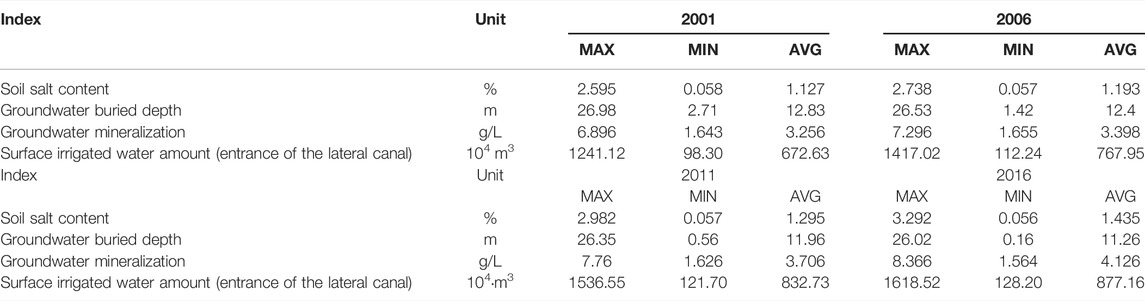
TABLE 1. Characteristic values of monitoring data of water and salt elements from 2001 to 2016.
The study of the spatial and temporal distribution of soil water and salt elements in the irrigation area required the continuously changing spatial distribution of various regional soil water and salt elements. It was impossible to collect detailed data on countless points in the study area by field measurement. The collected points were arranged irregularly; thus, appropriate spatial interpolation method was necessary to calculate the values of other unknown points according to the values of the existing points. The inverse distance weight method, spline function method, and the Kriging method are common spatial interpolation methods. The interpolation accuracy of different spatial interpolation methods has been compared. According to Table 2, the Kriging interpolation method has a high precision difference and can simultaneously take into account the soil salt content, groundwater mineralization, groundwater buried depth, and other indicators.

TABLE 2. Evaluation table of interpolation accuracy for different spatial interpolation methods.
Kriging interpolation performs optimal unbiased estimations of unknown attribute points by means of finite variable variation features, which has a strong spatial trend effect (Huang et al., 2016). The characteristic attribute quantity of the unknown point Z is obtained by the weighted sum of the attribute quantity of its neighboring known feature points, and the weight certainty rule is obtained according to the spatial variation characteristics of the variable:
where
The interpolation results of the soil water and salt elements were evaluated by cross-validation to evaluate their accuracy. The accuracy of the interpolation results was evaluated through MAE (mean absolute error), MRE (mean relative error), and RMSE (root mean squared error). The fitting degree of the regression results was evaluated by R2 (coefficient of determination). The closer MAE, MRE, and RMSE were to 0, the higher the accuracy of the interpolation results would be. The closer R2 was to 1, the better the model (function) could capture the change of the measured values. The water and salt elements were analyzed by SPSS and R, and the relationship between the soil salt content and the groundwater buried depth was fitted by Origin.
where Pei is the interpolation result of the No. i monitoring point; Pai is the attribute value of the No. i monitoring point; n is the number of the monitoring points; yi is the measured value of the No. i monitoring point;
Considering the point and the application of spatial interpolation of water and salt elements in the study area, the interpolation was performed with the data in 2016, and cross-validation of the interpolation results was conducted. The analysis results of interpolation error are shown in Table 3. The MAE, MRE, and RMSE of the interpolation results of water and salt elements in the 4 years were low, and the accuracy of the interpolation results met the research requirements. Therefore, the Kriging interpolation can be used for data processing and study on the development trend of regional soil salinization.
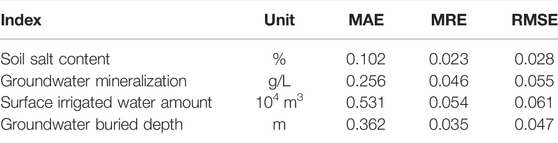
TABLE 3. Analysis table of interpolation accuracy of different water and salt elements.
The spatial interpolation of water and salt elements in 2001, 2006, 2011, and 2016 was conducted, respectively, and the spatial interpolation diagrams of the soil salt content, the groundwater mineralization, the groundwater buried depth, and the surface irrigated water amount in the study area were obtained as shown in Figure 3.
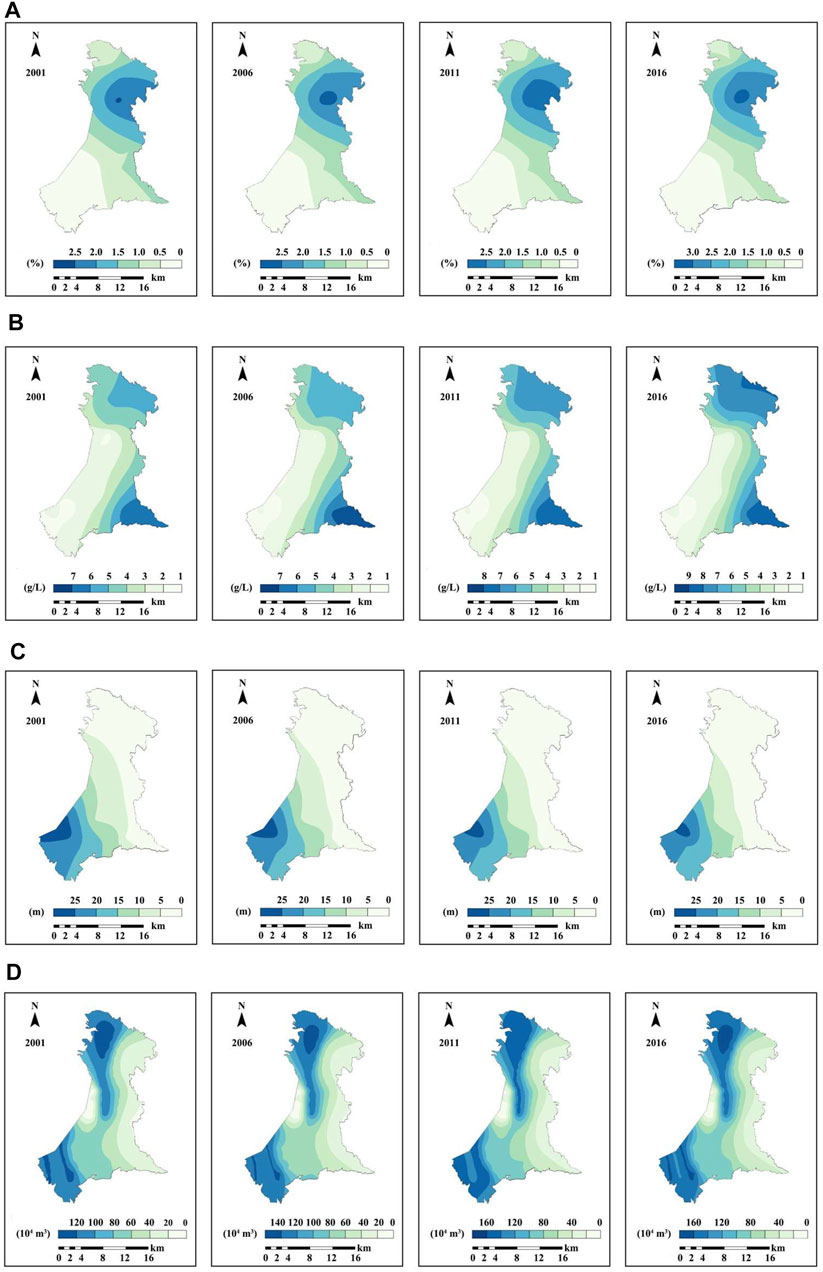
FIGURE 3. Spatial interpolation diagram of each element in different years [(A) soil salt content (unit: %); (B) groundwater mineralization (unit: g/L); (C) groundwater buried depth (unit: m); (D) surface irrigated water amount (unit: 104 m3)]
According to Figure 3A, on the spatial distribution, a large area mainly in the southwest, northwest, and central regions of the study area had a soil salt content less than 1.5%. The soil salt content increased from southwest to northeast, and regions of a soil salt content greater than 1.5%, especially greater than 2.5%, expanded to the surrounding areas. From 2001 to 2016, the soil salt content in the southwest regions was less than 0.5%; the western regions with a low soil salt content did not change significantly in area, but these areas’ soil salt contents decreased; by extracting the eigenvalues of each year, it was found that the minimum soil salt content lowered from 0.051% in 2001 to 0.043% in 2016, which showed a slightly desalting trend; the soil salt content in the central part of the northeast regions increased and exceeded 3.0% in 2016; the area with a high soil salt content increased year by year; the soil salt gradually concentrated in the central part of the northeast regions over time which was in a state of salt accumulation; the average value of the soil salt content increased from 0.972 to 1.205%. There is a large amount of surface water irrigation in the southwest, irrigation water has a certain leaching effect on soil salt, and part of soil salt infiltrates into groundwater. Affected by topography, groundwater continues to move toward the northeast, and salt accumulates in the region along with the movement of groundwater. In addition, the shallow depth of groundwater causes salt migration to the soil, leading to the desalting trend in the southwest and salt accumulation in the northeast of the study area. This process also indicates that the change of soil salinity is driven by water movement in soil and groundwater.
According to Figure 3B, in the spatial distribution, the groundwater mineralization in the study area increased from west to east, and it was low in the central and western regions, while high in the southeast and northeast regions. The northeast and southeast regions with groundwater mineralization over 6 g/L expanded to the surrounding areas. From 2001 to 2016, the area with groundwater mineralization of 1–3 g/L remained unchanged; the minimum degree of groundwater mineralization kept changing, and it showed a trend of increasing first and then decreasing; groundwater mineralization in the north and southeast regions continued to intensify and gradually expanded from the central part to the surrounding areas; influenced by closed hydrogeological units, groundwater in southwest moves to the east as a whole, and the migration rate of salt with groundwater movement is faster than that of soil salt in this area, so the groundwater mineralization in the southwest has a decreasing trend. As the groundwater moves to the north and southeast, salt is enriched with the stay of groundwater due to poor drainage channels in the irrigated area. The groundwater with high salinity is stored here, and the groundwater mineralization has an increasing trend. By extracting the eigenvalues of each year, it was found that the groundwater mineralization in both the north regions with groundwater mineralization of 4–6 g/L and the southeast regions with groundwater mineralization of 5–7 g/L increased by 2–3 g/L, and the maximum degree of groundwater mineralization increased from 6.876 g/L to 8.327 g/L; the average degree of groundwater mineralization increased from 3.913 g/L to 5.213 g/L over time.
According to Figure 3C, in the spatial distribution, the groundwater buried depth in the study area decreased from west to east, and it was above 25 m in the southwest regions, while below 5 m in the eastern regions. By extracting the eigenvalues of each year, it was found that from 2001 to 2016, the northeast regions with a groundwater buried depth of 0–5 m constantly shifted to the southwest, with the minimum groundwater buried depth decreasing from 2.541 m in 2001 to 0.163 m in 2016; for the central regions with a groundwater buried depth of 5–20 m, the depth decreased by different degrees; for the western regions with a groundwater buried depth over 20 m, the depth decreased significantly between 2001 and 2011, and it tended to be stable thereafter with the maximum groundwater depth decreasing from 26.904 to 25.874 m; the average groundwater depth decreased from 8.783 to 7.565 m over time.
According to Figure 3D, the surface irrigated water amount in the study area spread along the branches to their two flanks in strips, and the surface irrigated water mostly concentrated in the southwest and northwest regions. From 2001 to 2016, the surface irrigated water amount in the southwest and northwest regions constantly increased with the maximum surface irrigated water amount increasing from 1,275,410 m3 in 2001 to 1,663,230 m3; regions with a surface irrigated water amount above 1 million m3 slowly expanded to the central part as the surface irrigated water amount increased; the eastern regions with a surface irrigated water amount below 600,000 m3 constantly decreased with the minimum surface irrigated water amount increasing from 76,470 m3 to 100,020 m3; the south regions with a surface irrigated water amount of 0.8–1 million m3 increased significantly and expanded to the surrounding areas; the average surface irrigated water amount constantly increased from 644,370 m3 to 853,350 m3 over time.
Some scholars take the actual situation into consideration and divide the saline–alkaline soil into six categories (Wang, 2017): non-alkali soil (soil salt content less than 0.4%), saline–alkaline soil (soil salt content of 0.4–1.5%), mild saline–alkaline soil (soil salt content of 1.5–3.0%), medium saline–alkaline soil (soil salt content of 3.0–6.0%), heavy saline–alkaline soil (soil salt content of 6.0–12.0%), and extra-heavy saline–alkaline soil (soil salt content greater than 12.0%). According to the aforementioned classification standards for saline soil, samples of different types of saline soil in the study area in each year were extracted, and the area proportions and distributions were obtained, as shown in Table 4; Figure 4. From 2001 to 2016, the area of non-alkali soil remained unchanged, which was about 26%; the area of saline–alkaline soil decreased by 8.191%, the area of mild saline–alkaline soil continued to expand to the surrounding areas and increased from 32.569 to 39.395%; the area of medium saline–alkaline soil which appeared in the central area of the northeast regions in 2016 accounted for 1.181% of the total study area. Although the area of soil salinization in the study area did not expand, the degree of soil salinization aggravated from the central part to the periphery over time.
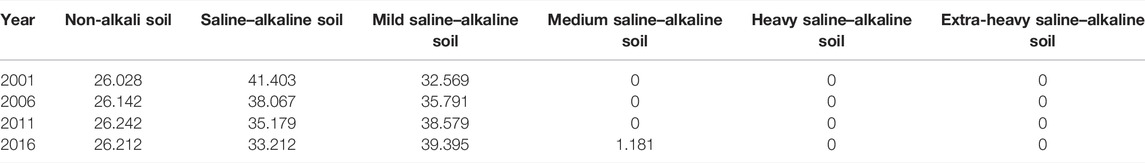
TABLE 4. Proportion of soil area with different degrees of salinization from 2001 to 2016 (unit: %).
FIGURE 4. Spatial distribution of saline–alkaline soil in different years [(A) 2001; (B) 2006; (C) 2011; (D) 2016].
With point contrast, the data of water and salt elements at 33 test points evenly distributed in the study area in 2001, 2006, 2011, and 2016 were obtained on the interpolation results, and the Pearson coefficient, the Spearman coefficient, and the Kendall coefficient were calculated, respectively, as shown in Figure 5. There was a positive correlation between the soil salt content and the groundwater mineralization, and a negative correlation existed between the soil salt content and either the surface irrigated water amount or the groundwater buried depth. In particular, there was a significant negative correlation between the soil salt content and the groundwater buried depth, with a Pearson coefficient of −0.798, a Spearman coefficient of −0.855, and a Kendall coefficient of −0.700 (p < 0.01). There was a significant negative correlation between the groundwater buried depth and the groundwater mineralization, with a Pearson coefficient of −0.702, the Kendall coefficient of −0.622, and the Spearman coefficient of −0.807; there was a weak correlation between the soil salt content and other factors. Therefore, the groundwater buried depth was the dominant factor for the regional soil salination.
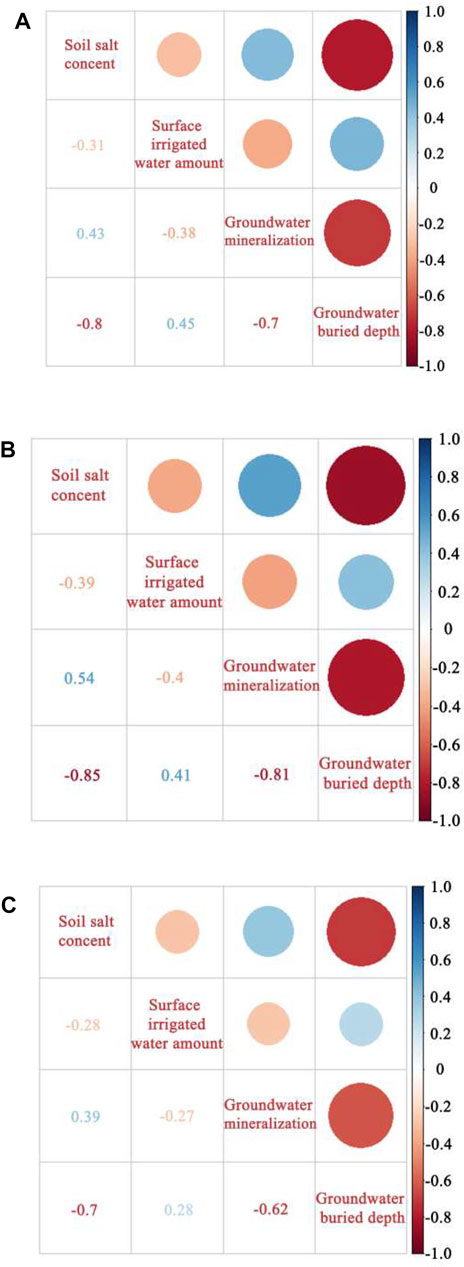
FIGURE 5. Correlation coefficient diagram of various elements of soil salinization under different evaluation methods [(A) Pearson; (B) Spearman; (C) Kendall].
Affected by the topographic and geological conditions, long-term artificial irrigation, and water and salt transport, the unique distribution and increased rules for the soil salt content of hydrogeological unit were developed. The correlation analysis showed that there was a significant correlation between the soil salt content and the groundwater buried depth. To find out the specific relationship between the increased rate of the soil salt content and the groundwater buried depth was of great significance to predict the evolution of soil salination in the future study area. Data of the soil salt content and the corresponding groundwater buried depth at 33 test points in 2001, 2006, 2011, and 2016 were extracted and fitted, and it was found that there was a logarithmic negative correlation between the increased rate of the soil salt content in different intervals of years and the CCC Figure 6. EqFormulas 6ormulas –Formulas 8 were used for the specific function relationships.
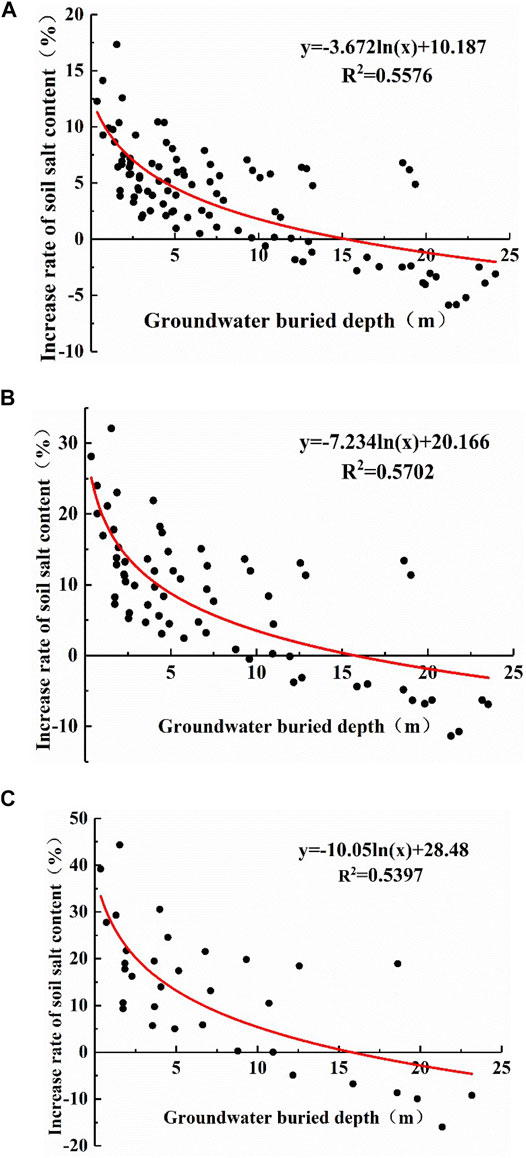
FIGURE 6. Relationship between the increase rate of the soil salt content and the groundwater buried depth at different years intervals [(A) five yeas interval; (B) ten years interval; (C) fifteen years interval].
Five-year interval:
Ten-year interval:
Fifteen-year interval:
where y is the increase rate of the soil salt content indicated by %; x was the average groundwater depth in the current year, and its unit is m.
To verify the relationship between the increase rate of the soil salt content and the groundwater buried depth obtained by fitting, the values of groundwater buried depths at the measured points in the study area were substituted into Formulas 6ormulas –Formulas 8 to obtain the increase rates of the soil salt contents at the measured points, which were then compared with the increasing rates of the soil salt contents of the corresponding periods. MAE, MRE, RMSE, and R2 were calculated, respectively, as shown in Table 5. The results showed that R2 was above 0.8 by calculating the increase rate of the soil salt content by the formula obtained by fitting, suggesting a reasonable relationship between the increase rate of the soil salt content and the groundwater buried depth. If the groundwater buried depth in the future study area is known, the increase rate of the soil salt content can be obtained by formula, which can then be used to estimate the future soil salt content in different intervals of years so as to realize the prediction of soil salinization.
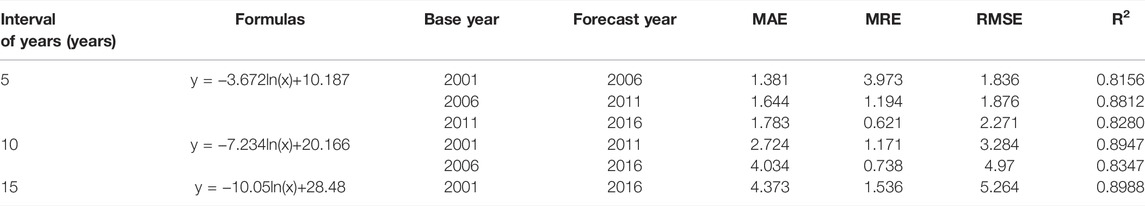
TABLE 5. Error analysis table of the relationship between increase rate of the soil salt content and the groundwater buried depth.
Accurate results were obtained on the spatial distribution of regional water and salt elements through the Kriging interpolation, which showed that the Kriging interpolation could well predict the distribution of regional soil water and salt elements (Fu et al., 2021). The salinization degree in the study area was low, and the salinization regions were mainly saline–alkaline soil and mild saline–alkaline soil with saline–alkaline soil evolving to mild saline–alkaline soil, which showed a ladder-like increase trend from southwest to northeast. This is consistent with the previous research conclusions in the irrigation area based on the cloud theory and remote sensing interpretation (Xu et al., 2017). The spatial distribution of the soil salt content in the irrigation area was significantly affected by the groundwater buried depth. As it is shown in Figures 3A,C, regions with big groundwater buried depth had a low soil salt content and a low degree of salinization, while regions with small groundwater buried depth (e.g., below 5 m) had a high soil salt content and a high degree of salinization. The results were slightly higher than those found in other irrigation areas (Qureshi and Al-Falahi, 2015; Li X. et al., 2020; Wang Y. et al., 2020). This may be caused by a large study area, the strong variability in the groundwater buried depth, and a big average groundwater buried depth. However, the results are consistent with the conclusion that the regions with a small groundwater buried depth had a high degree of salinization.
The southwest regions with low groundwater mineralization which were mostly non-alkaline soil had a low soil salt content and a low degree of salinization; the southeast regions with groundwater mineralization above 7 g/L did not have the highest soil salt content, which occurred in the northeast regions. This suggested the impact of groundwater mineralization on the soil salt content weakened with the increase in the groundwater buried depth, which showed a dynamic correlation and a nonlinear interaction (Su et al., 2020). The spatial distribution of water in the closed hydrogeological unit was affected by the topographic and geological conditions. The irrigation water was converted into groundwater through infiltration, and the increase in the irrigation water amount year by year caused the growth of the groundwater buried depth, leading to a gradual movement of groundwater towards low-lying basins. As it is shown in Figures 3A,D, an increase in the soil salt content in the northeast regions may be related to poor irrigation and drainage. The infiltration of irrigation water could wash salt to maintain the soil salt content at a low level, but an excessively large amount of irrigation water caused the decrease in the groundwater buried depth. In oasis irrigation areas that mainly rely on long-term irrigation, an appropriate irrigation and drainage ratio have a significant impact on the soil salt content (Wang D. et al., 2021).
As it is shown in Figure 6, when the groundwater depth was 0–2.5 m, the growth rate of the soil salt content increased rapidly with the decrease in the groundwater buried depth. This indicated that soil salination was more actively developed in regions with a low groundwater buried depth, which may be related to salt being transported from the lower soil layer to the upper soil layer by shallow groundwater (Zhou and Li, 2013). According to the curve of the increase rate of the soil salt content in different intervals of years in Figure 6, the annual soil salt content in regions with a groundwater buried depth over 5.0 m increased by less than 1%, and these regions had slow soil salination; eastern regions with a groundwater buried depth below 5.0 m had a large increase rate in the soil salt content and fast soil salination because of the terrain and poor irrigation and drainage (Xu et al., 2017). It was recommended that the groundwater buried depth should be controlled below 5.0 m by irrigation. When the groundwater buried depth was below 15.0 m, the soil salt content had a positive increase rate, which continued to increase; when the groundwater buried depth was above 15.0 m, the soil salt content had a negative increase rate and the soil was in a desalting state. According to the distribution of groundwater buried depth in Figure 3C, soil salt contents in the southeast and northeast regions continued to increase over the years, while those in the western regions decreased. Therefore, a groundwater buried depth of 15.0 m may be the critical groundwater depth that caused soil salt content to increase or decrease in the area, and more research is needed (Guan et al., 2012).
As it is shown in Figure 6, as the groundwater buried depth increased, there was a logarithmic relationship between the increased rate of the soil salt content and the groundwater buried depth. According to the study on the Inner Mongolia autonomous region, there was an exponential relationship between the increase rate of the soil salt content of the cultivated land and the groundwater buried depth, and a linear relationship existed between the increase rate of the soil salt content of wasteland and the groundwater buried depth (Dou et al., 2019). The long-term dynamic evolution of groundwater buried depth slowly influenced the development trend of regional soil salinization. The soil salt content increased as a result of the groundwater buried depth maintained at a certain level for a long time. The exponential relationship reflected the spatial distribution changes of the soil salt content as the groundwater buried depth varied. The logarithmic relationship in this study reflected the dynamic development trend of soil salinization over time. The change of groundwater buried depth was closely related to the long-term agricultural irrigation and drainage in the irrigation area, and there was a slow change process. Therefore, irrigation area managers should pay attention to the long-term development trend of the groundwater buried depth in the irrigation area and improve irrigation and drainage to ensure the sustainable development of the irrigation area.
Based on long-time observed data of a closed hydrogeological unit in the Jingtaichuan Electric-Lifting Irrigation Area in Gansu Province, China, spatial and temporal distribution characteristics and their interaction relationship of regional soil water and salt were studied through spatial interpolation and statistical analysis. The results showed that from 2001 to 2016, the area of soil salinization in the study area did not increase significantly, and the salinization regions were mainly saline–alkaline soil and mild saline–alkaline soil, but the degree of salinization tends to increase, which showed a ladder-like increase from southwest to northeast. In the closed hydrogeological unit, long-term surface water irrigation and fixed movement of groundwater lead to the continuous decrease in groundwater buried depth and increase in groundwater mineralization in local areas and then affect the distribution of soil salt content. The increase in the soil salt content slowed down as the groundwater buried depth increased, which met the logarithmic relationship, and the soil salt content increased as a result of the groundwater buried depth being maintained at a certain depth for a long time. The decrease in the groundwater buried depth caused by the closed terrain, the increased irrigation water amount, and poor drainage were the dominant factors for the development of regional soil salination. The irrigation and drainage design and soil salination control in irrigation areas should be considered at the regional scale, and the overall evolution trend of water and the soil environment in irrigated areas should be taken into account.
The original contributions presented in the study are included in the article/Supplementary Material, further inquiries can be directed to the corresponding author.
HL and ZS contributed to conception and design of the study. CX organized the database. FG performed the statistical analysis. HL wrote the first draft of the manuscript. ZS, CX and FG wrote sections of the manuscript. All authors contributed to manuscript revision, and read and approved the submitted version.
The study was supported by the National Key Research and Development Program of China (Nos: 2021YFC3201202 and 2019YFC1904303); the National Natural Science Foundation of China (No: 51579102); the Zhongyuan Science and Technology Innovation Leading Talent Support Program of Henan, China (No: 204200510048); the Key Technologies R&D and Promotion Program of Henan Province (No: 212102310273); and the Science and Technology Assistance Program for Developing Countries (No: KY201904010).
The authors declare that the research was conducted in the absence of any commercial or financial relationships that could be construed as a potential conflict of interest.
All claims expressed in this article are solely those of the authors and do not necessarily represent those of their affiliated organizations, or those of the publisher, the editors, and the reviewers. Any product that may be evaluated in this article, or claim that may be made by its manufacturer, is not guaranteed or endorsed by the publisher.
Bless, A. E., Colin, F., Crabit, A., Devaux, N., Philippon, O., and Follain, S. (2018). Landscape Evolution and Agricultural Land Salinization in Coastal Area: A Conceptual Model. Sci. Total Environ. 625, 647–656. doi:10.1016/j.scitotenv.2017.12.083
Bouksila, F., Bahri, A., Berndtsson, R., Persson, M., Rozema, J., and Van der Zee, S. E. A. T. M. (2013). Assessment of Soil Salinization Risks under Irrigation with Brackish Water in Semiarid Tunisia. Environ. Exp. Bot. 92, 176–185. doi:10.1016/j.envexpbot.2012.06.002
Cassel, F., Goorahoo, D., and Sharmasarkar, S. (2015). Salinization and Yield Potential of a Salt-Laden Californian Soil: An In Situ Geophysical Analysis. Water Air Soil Pollut. 226 (12), 442. doi:10.1007/s11270-015-2682-1
Chen, X., Quan, Q., Zhang, K., and Wei, J. (2021). Spatiotemporal Characteristics and Attribution of Dry/wet Conditions in the Weihe River Basin within a Typical Monsoon Transition Zone of East Asia over the Recent 547 Years. Environ. Model. Softw. 143, 105116. doi:10.1016/j.envsoft.2021.105116
Dou, X., Shi, H. B., Miao, Q. F., Tian, F., Yu, D., Zhou, L., et al. (2019). Temporal and Spatial Variability Analysis of Soil Water and Salt and the Influence of Groundwater Depth on Salt in saline Irrigation Area. J. Soil Water Conservation 33 (3), 246–253.
Du, J., Yang, P., Li, Y., Ren, S., Zhang, J., Hou, Z., et al. (2010). Analysis of Spatial and Temporal Variations of Groundwater Level and its Salinity in Hetao Irrigation District. Trans. Chin. Soc. Agric. Eng. 26 (7), 26–31.
Fan, Y., Zhang, G. X., Yin, X. R., Liu, Z. J., and Huang, Z. G. (2011). Study on Capillary Rise from Shallow Groundwater and Critical Water Table Depth of a saline-sodic Soil in Western Songnen plain of China. Environ. Earth Sci. 64 (8), 2119–2126.
Fu, T., Gao, H., and Liu, J. (2021). Comparison of Different Interpolation Methods for Prediction of Soil Salinity in Arid Irrigation Region in Northern China. Agronomy 11 (8), 1535. doi:10.3390/agronomy11081535
Guan, X., Wang, S., Gao, Z., Lv, Y., and Fu, X. (2012). Spatio-temporal Variability of Soil Salinity and its Relationship with the Depth to Groundwater in Salinization Irrigation District. Acta Ecologica Sinica 32 (4), 198–206. doi:10.5846/stxb201012281863
Guo, S., Ruan, B., Chen, H., Guan, X., Wang, S., Xu, N., et al. (2018). Characterizing the Spatiotemporal Evolution of Soil Salinization in Hetao Irrigation District (China) Using a Remote Sensing Approach. Int. J. Remote Sensing 39 (20), 6805–6825. doi:10.1080/01431161.2018.1466076
Haj-Amor, Z., Hashemi, H., and Bouri, S. (2017). Soil Salinization and Critical Shallow Groundwater Depth under saline Irrigation Condition in a Saharan Irrigated Land. Arab J. Geosci. 10 (14), 301. doi:10.1007/s12517-017-3093-y
Huang, J., Prochazka, M. J., and Triantafilis, J. (2016). Irrigation Salinity hazard Assessment and Risk Mapping in the Lower Macintyre Valley, Australia. Sci. Total Environ. 551-552 (1), 460–473. doi:10.1016/j.scitotenv.2016.01.200
Kaman, H., Kurunc, A., and Cetin, M. (2017). Soil Salinity Appraisal in Large-Irrigation Areas by Using EM38 Technique. Fresenius Environ. Bull. 26 (6), 4222–4226.
Khan, N. M., Rastoskuev, V. V., Sato, Y., and Shiozawa, S. (2005). Assessment of Hydrosaline Land Degradation by Using a Simple Approach of Remote Sensing Indicators. Agric. Water Manage. 77 (1-3), 96–109. doi:10.1016/j.agwat.2004.09.038
Letey, J., Hoffman, G. J., Hopmans, J. W., Grattan, S. R., Suarez, D., Corwin, D. L., et al. (2011). Evaluation of Soil Salinity Leaching Requirement Guidelines. Agric. Water Manage. 98 (4), 502–506. doi:10.1016/j.agwat.2010.08.009
Li, J., Fei, L., Li, S., Xue, C., Shi, Z., and Hinkelmann, R. (2020a). Development of "Water-Suitable" Agriculture Based on a Statistical Analysis of Factors Affecting Irrigation Water Demand. Sci. Total Environ. 744, 140986. doi:10.1016/j.scitotenv.2020.140986
Li, K., Liu, H., He, X., and Li, X. (2019). Simulation of Water and Salt Transport in Soil under Pipe Drainage and Drip Irrigation Conditions in Xinjiang. Water 11 (12), 2456. doi:10.3390/w11122456
Li, X., Zhang, C., and Huo, Z. (2020b). Optimizing Irrigation and Drainage by Considering Agricultural Hydrological Process in Arid farmland with Shallow Groundwater. J. Hydrol. 585 (2), 124785. doi:10.1016/j.jhydrol.2020.124785
Li, X., Zhang, C., Zhang, B., Wu, D., Zhu, D., Zhang, W., et al. (2021). Nitrogen Deposition and Increased Precipitation Interact to Affect fine Root Production and Biomass in a Temperate forest: Implications for Carbon Cycling. Sci. Total Environ. 765, 144497. doi:10.1016/j.scitotenv.2020.144497
Liu, Y., Zhang, K., Li, Z., Liu, Z., Wang, J., and Huang, P. (2020). A Hybrid Runoff Generation Modelling Framework Based on Spatial Combination of Three Runoff Generation Schemes for Semi-humid and Semi-arid Watersheds. J. Hydrol. 590, 125440. doi:10.1016/j.jhydrol.2020.125440
Lobell, D. B., Lesch, S. M., Corwin, D. L., Ulmer, M. G., Anderson, K. A., Potts, D. J., et al. (2010). Regional-scale Assessment of Soil Salinity in the Red River Valley Using Multi-Year MODIS EVI and NDVI. J. Environ. Qual. 39 (1), 35–41. doi:10.2134/jeq2009.0140
Lu, X., Li, R., Shi, H., Liang, J., Miao, Q., and Fan, L. (2019). Successive Simulations of Soil Water-Heat-Salt Transport in One Whole Year of Agriculture after Different Mulching Treatments and Autumn Irrigation. Geoderma 344, 99–107. doi:10.1016/j.geoderma.2019.03.006
Ma, G., Qu, Z., Wang, L., Jia, Y., and Liu, Z. (2021). Research on Soil Water and Salt Movement and Groundwater Dynamics in Hetao Irrigation District Based on ArcGIS Spatial Interpolation. J. Soil Water Conservation 35 (04), 208–216.
Mastrocicco, M., Gervasio, M. P., Busico, G., and Colombani, N. (2020). Natural and Anthropogenic Factors Driving Groundwater Resources Salinization for Agriculture Use in the Campania plains (Southern Italy). Sci. Total Environ. 758, 144033.
Miao, R., Liu, Y., Wu, L., Wang, D., Liu, Y., Miao, Y., et al. (2022). Effects of Long-Term Grazing Exclusion on Plant and Soil Properties Vary with Position in Dune Systems in the Horqin Sandy Land. Catena 209 (2), 105860. doi:10.1016/j.catena.2021.105860
Nie, S., Bian, J., and Zhou, Y. (2021). Estimating the Spatial Distribution of Soil Salinitywith Geographically Weighted Regression Krigingand its Relationship to Groundwaterin the Western Jilin Irrigation Area, Northeast China. Polish J. Environ. Stud. 30 (1), 283–294.
Ning, S., Zhou, B., Shi, J., and Wang, Q. (2021). Soil Water/salt Balance and Water Productivity of Typical Irrigation Schedules for Cotton under Film Mulched Drip Irrigation in Northern Xinjiang. Agric. Water Manage. 245, 106651. doi:10.1016/j.agwat.2020.106651
Qureshi, A. S., and Al-Falahi, A. A. (2015). Modeling the Effects of Different Irrigation Schedules and drain Depths for Soil Salinity Management: A Case Study from Southern Iraq. Afr. J. Agric. Res. 10 (32), 3178–3188.
Ren, D., Wei, B., Xu, X., Engel, B., Li, G., Huang, Q., et al. (2019). Analyzing Spatiotemporal Characteristics of Soil Salinity in Arid Irrigated Agro-Ecosystems Using Integrated Approaches. Geoderma 356, 113935. doi:10.1016/j.geoderma.2019.113935
Seeboonruang, U. (2013). Relationship between Groundwater Properties and Soil Salinity at the Lower Nam Kam River Basin in Thailand. Environ. Earth Sci. 69 (6), 1803–1812. doi:10.1007/s12665-012-2012-5
Semendyaeva, N. V., Dobrotvorskaya, N. I., and Elizarov, N. V. (2019). Secondary Salinization of Reclaimed Solonetzes and its Aftereffect. Eurasian Soil Sc. 52 (11), 1429–1438. doi:10.1134/s1064229319110097
Shaddad, S. M., Buttafuoco, G., and Castrignanò, A. (2020). Assessment and Mapping of Soil Salinization Risk in an Egyptian Field Using a Probabilistic Approach. Agronomy 10 (1), 85. doi:10.3390/agronomy10010085
Su, Y., Li, T., Cheng, S., and Wang, X. (2020). Spatial Distribution Exploration and Driving Factor Identification for Soil Salinisation Based on Geodetector Models in Coastal Area. Ecol. Eng. 156, 105961. doi:10.1016/j.ecoleng.2020.105961
Wang, B., Dong, X., Wang, Z., and Qin, G. (2021a). Characterizing Spatiotemporal Variations of Soil Salinization and its Relationship with Eco-Hydrological Parameters at the Regional Scale in the Kashi Area of Xinjiang, China from 2000 to 2017. Water 13 (8), 1075. doi:10.3390/w13081075
Wang, D., Zhao, C., Zheng, J., Zhu, J., Gui, Z., and Yu, Z. (2021b). Evolution of Soil Salinity and the Critical Ratio of Drainage to Irrigation (CRDI) in the Weigan Oasis in the Tarim Basin. Catena 201, 105210. doi:10.1016/j.catena.2021.105210
Wang, G., Shi, H., Li, X., Guo, J., Wang, W., and Wu, D. (2020a). Estimation of Salt Transport and Relationship with Groundwater Depth in Different Land Types in Hetao Irrigation Area. Trans. Chin. Soc. Agric. Machinery 51 (08), 255–269.
Wang, R., Kang, Y., Wan, S., Hu, W., Liu, S., Jiang, S., et al. (2012). Influence of Different Amounts of Irrigation Water on Salt Leaching and Cotton Growth under Drip Irrigation in an Arid and saline Area. Agric. Water Manage. 110, 109–117. doi:10.1016/j.agwat.2012.04.005
Wang, R. (2017). Study of the Characteristics of Soil Salinization and Law of Water-Salt Transport in JingDian Irrigation District. Zhengzhou: North China University of Water Resources and Electric Power, 12–13.
Wang, Y., Chen, M., Yan, L., Yang, G., Ma, J., and Deng, W. (2020b). Quantifying Threshold Water Tables for Ecological Restoration in Arid Northwestern China. Groundwater 58 (1), 132–142. doi:10.1111/gwat.12934
Wang, Y., Deng, C., Liu, Y., Niu, Z., and Li, Y. (2018). Identifying Change in Spatial Accumulation of Soil Salinity in an Inland River Watershed, China. Sci. Total Environ. 621 (15), 177–185. doi:10.1016/j.scitotenv.2017.11.222
Wu, J., Li, P., Qian, H., and Fang, Y. (2014). Assessment of Soil Salinization Based on a Low-Cost Method and its Influencing Factors in a Semi-arid Agricultural Area, Northwest China. Environ. Earth Sci. 71 (8), 3465–3475. doi:10.1007/s12665-013-2736-x
Xu, C., Cheng, H., Wang, Y., Wang, R., Liu, L., and Zhang, R. (2017). Improved Multi-Level Fuzzy Evaluation Model Based on Cloud Theory for Evaluation of Soil Salinization Degree. Trans. Chin. Soc. Agric. Eng. 33 (24), 88–95.
Xu, L., Du, H., and Zhang, X. (2019). Spatial Distribution Characteristics of Soil Salinity and Moisture and its Influence on Agricultural Irrigation in the Ili River Valley, China. Sustainability 11 (24), 7142. doi:10.3390/su11247142
Yang, F., Zhang, G., Yin, X., and Liu, Z. (2011). Field-scale Spatial Variation of saline-sodic Soil and its Relation with Environmental Factors in Western Songnen Plain of China. Int. J. Environ. Res. Public Health 8 (2), 374–387. doi:10.3390/ijerph8020374
Yu, J., Li, Y., Han, G., Zhou, D., Fu, Y., Guan, B., et al. (2013). The Spatial Distribution Characteristics of Soil Salinity in Coastal Zone of the Yellow River Delta. Environ. Earth Sci. 72 (2), 589–599. doi:10.1007/s12665-013-2980-0
Zalibekov, Z. G., Paizulaeva, R. M., Biibolatova, Z. D., Zalibekova, M. Z., and Biarslanov, A. B. (2010). Spatial Variability of Soils and Salinization Processes in the Coastal Zone of the Terek-Kuma Lowland. Eurasian Soil Sc. 43 (4), 390–400. doi:10.1134/s1064229310040046
Zeng, W., Xu, C., Wu, J., and Huang, J. (2014). Soil Salt Leaching under Different Irrigation Regimes: HYDRUS-1D Modelling and Analysis. J. Arid Land 6 (1), 44–58. doi:10.1007/s40333-013-0176-9
Zhang, K., Ali, A., Antonarakis, A., Moghaddam, M., Saatchi, S., Tabatabaeenejad, A., et al. (2019). The Sensitivity of North American Terrestrial Carbon Fluxes to Spatial and Temporal Variation in Soil Moisture: An Analysis Using Radar‐Derived Estimates of Root‐Zone Soil Moisture. J. Geophys. Res. Biogeosci. 124 (11), 3208–3231. doi:10.1029/2018jg004589
Zhao, T., Shi, J., Entekhabi, D., Jackson, T. J., Hu, L., Peng, Z., et al. (2021a). Retrievals of Soil Moisture and Vegetation Optical Depth Using a Multi-Channel Collaborative Algorithm. Remote sensing Environ. 257, 112321. doi:10.1016/j.rse.2021.112321
Zhao, T., Shi, J., Lv, L., Xu, H., Chen, D., Cui, Q., et al. (2020). Soil Moisture experiment in the Luan River Supporting New Satellite mission Opportunities. Remote Sensing Environ. 240, 111680. doi:10.1016/j.rse.2020.111680
Zhao, X., Xia, H., Pan, L., Song, H., Niu, W., Wang, R., et al. (2021b). Drought Monitoring over Yellow River Basin from 2003-2019 Using Reconstructed MODIS Land Surface Temperature in Google Earth Engine. Remote Sensing 13 (18), 3748. doi:10.3390/rs13183748
Keywords: soil salination, soil salt content, groundwater buried depth, groundwater mineralization, irrigation water amount
Citation: Lian H, Sun Z, Xu C and Gu F (2022) The Relationship Between the Distribution of Water and Salt Elements in Arid Irrigation Areas and Soil Salination Evolution. Front. Earth Sci. 10:852485. doi: 10.3389/feart.2022.852485
Received: 11 January 2022; Accepted: 22 March 2022;
Published: 20 April 2022.
Edited by:
Shailesh Kumar Singh, National Institute of Water and Atmospheric Research (NIWA), New ZealandReviewed by:
Rajesh Maddu, International Institute of Information Technology, Hyderabad, IndiaCopyright © 2022 Lian, Sun, Xu and Gu. This is an open-access article distributed under the terms of the Creative Commons Attribution License (CC BY). The use, distribution or reproduction in other forums is permitted, provided the original author(s) and the copyright owner(s) are credited and that the original publication in this journal is cited, in accordance with accepted academic practice. No use, distribution or reproduction is permitted which does not comply with these terms.
*Correspondence: Zhaojun Sun, c3Vuemhhb2p1bnl4QDEyNi5jb20=
Disclaimer: All claims expressed in this article are solely those of the authors and do not necessarily represent those of their affiliated organizations, or those of the publisher, the editors and the reviewers. Any product that may be evaluated in this article or claim that may be made by its manufacturer is not guaranteed or endorsed by the publisher.
Research integrity at Frontiers
Learn more about the work of our research integrity team to safeguard the quality of each article we publish.