 Sun Changxin
 Zhang Yumin*
- College of Geosciences and Engineering, North China University of Water Resources and Electric Power, Zhengzhou, China
The force chain method is a powerful tool to analyze the pressure arch of a tunnel, which has important influence on the seismic stability of tunnel structures. The force distribution around the tunnel before and after an earthquake was observed with numerical simulation and shaking table test, and then some parameters related to the pressure arch around the tunnel were analyzed. The discrete element method software PFC was used to numerically simulate the variation of shape and height of pressure arch with tunnel depth before and after an earthquake. The effect of tunnel depth, span, section shape, lining stiffness, seismic spectrum, and seismic amplitude on the shape and height of pressure arch was numerically simulated. The numerical results show that the tunnel depth, span, section shape, and seismic amplitude have great effect on the pressure arch shape, while the lining stiffness and seismic spectrum has little effect on the pressure arch shape. In addition, the shaking table tests were conducted to observe the pressure arch shape before and after an earthquake, and the experimental results were applied to verify the numerical simulation results.
Introduction
A great number of tunnels are planned, are under construction, and have been built all over the world (Feng et al., 2015; Feng et al., 2022; Yu et al., 2022). For example, there are 20 tunnels that are greater than 15 km long and 12 potential focal regions along the under-construction Sichuan–Tibet Railway in China, and the seismic intensity is partly up to 0.3 g (Peng et al., 2020). Therefore, seismic tunnel disasters are increasingly observed, and, for example, 40 of 59 investigated tunnels suffered from the 2008 Wenchuan earthquake in China, among which 19 tunnels were seriously damaged (Zang, 2017). As a consequence, much attention is paid to the seismic stability of tunnel structures. The pressure arch, which exists widely in most tunnels, has a direct effect on the bearing capacity of tunnels.
Much achievement has been obtained in pressure arch research. In 1884, Roberst firstly provided the concept of “granary effect,” namely, the “pressure arch effect,” by observing the phenomenon in which the pressure at the granary bottom will be constant when the grain accumulation height is greater than a given value. Terzaghi testified the existence of pressure arch with the trap-door experiment (Terzaghi, 1936). Inst Min Eng (IME) considered that the pressure arch resulted from the stress redistribution and exists at every excavation cavern (IEM, 1936). Handy described the pressure arch with the path of minor principal stress which is approximately like a catenary (Handy, 1985). Tien analyzed the arching mechanism in terms of the micro-level by photo-elasticity modeling (Tien, 2001). Song Yuxiang numerically simulated the formation process of pressure arches in terms of principal stress around tunnels and analyzed various factors influencing the pressure arch (Song et al., 2017). Zeng Xinping used numerical simulation to explore the formation mechanism of deeply buried tunnels and the distribution of vertical Earth pressure (Zeng, 2018). Shang Bin et al. numerically simulated the internal and external boundaries of pressure arches and provided the formula for the surrounding rock pressure with linear regression analysis (Shang et al., 2020). In addition, they considered that the surrounding rock pressures are basically affected by tunnel depth H, span B, internal friction angle φ, and rock unit weight γ.
The pressure arch is traditionally considered as a shield for the tunnel, and hence the evolution of the pressure arch under the earthquake may have great effect on the seismic stability of the tunnel. However, little attention has been paid to the research in the pressure arch under earthquakes.
After tunnel excavation, the initial stress field is disturbed, and the surrounding rock moves due to unbalanced force. When the new balance state is reached, the surrounding rock within a certain scope is in the unidirectional compression state, just like an arch, which is defined as the pressure arch. The formation and shape of the pressure arch is closely related to the microscopic motion of rock particles.
A force chain is defined as a line segment that supports a compressive force (Socolar et al., 2002), which is a powerful tool to analyze the microscopic displacement and motion of rock particles. The pressure arch may be considered to consist of one or more strong force chains, and thus the shape and stability of the pressure arch can be analyzed by the force chain method.
Many scholars have carried out in-depth research on the force chain. Dantu observed the tree-pattern structure of the force chain with photo-elasticity method (Dantu, 1957). Sanfratello et al. firstly obtained the structure of the force chain within a dense 3D granular assembly by observing the internal force chain structure with magnetic resonance elastography technique (Sanfratello et al., 2009). Oda observed the microstructure in shear band with micro-focus X-ray computed tomography and found that the local dilatation in a shear band is inevitably related to the extensive rotation of particles (Oda et al., 2004). Miao Tiande observed the contact force at the bottom of 3D ordered granular arrays jointly by the aluminum-plastic board and carbon paper techniques and found that all arrays have obvious arching effect and the force distribution depends largely on the crystal structure (Miao et al., 2007). Sun Qicheng numerically simulated the force chain pattern and stress distribution of 12,000 static sand grains by 2D discrete element method (DEM) based on strict contact theory and found that the friction coefficient of particles has great effect on the force chain behavior (Sun and Wang, 2008). Majmudar used PFC2D to analyze the tangential and normal grain-scale forces inside 2D photo-elastic disks subject to pure shear and isotropic compression (Majmudar and Behringer, 2005). Iwashita analyzed the force chain by slightly modified DEM and found that the applied stress is basically transferred by the force chain which is parallel to the principal stress, and the force chain varies with stress (Iwashita and Oda, 2000).
Therefore, it is feasible to study the shape and influential factors of a pressure arch with force chain due to its successful development.
Numerical Simulation
The Particle Flow Code (PFC) was developed by Itasca Consulting Group, Inc., in America to analyze the mechanical properties and behavior of granular and solid materials in terms of a microscope, and PFC consists basically of variably sized rigid spherical particles. The conventional macroscopic constitutive relation and its corresponding parameters can be automatically determined in PFC, and only the geometric and mechanical parameters of rigid particles and their contact need be defined. The motion of each particle arising from the contact and body forces acting upon it is determined by Newton's second law, while the contact forces arising from the relative motion at each contact is updated by the force-displacement law. Thus, PFC may well simulate the mechanical behavior of inherently loose granular materials such as soil. In addition, PFC is especially suitable for the simulation of large deformation problems such as fracturing, and therefore it has been widely used in the tunnel and underground engineering.
The force chain pattern around the tunnel before and after an earthquake were numerically simulated by the DEM software of PFC and then was used to analyze the shape and influential factors of a pressure arch under an earthquake.
The microscopic parameters of soil and lining for numerical simulation were determined by adjusting them in a numerical triaxial model until the macroscopic behavior of the numerical model was almost identical to the experimental counterparts (Badakhshan et al., 2020; Chen et al., 2022; Wang and Zhao, 2022). Finally, the parameters were obtained, as listed in Tables 1 and 2 (Chang-nü et al., 2021; Hu et al., 2021; Zhou et al., 2022).

TABLE 1. Microscopic parameters of soil.

TABLE 2. Microscopic parameters of tunnel lining.
The particles in PFC2D are generally formed by generating non-overlapping sets of balls with the ball generate command or by distributing overlapping balls to match a specified size distribution with the ball distribute command. The two particle generation methods are greatly different from each other. In this paper, the particles were formed by the ball generate command which generates non-overlapping balls. This process stops when the number of attempts to place balls without overlap is achieved or when the target number of balls is created. By default, the ball positions and radii are drawn from uniform distributions throughout the model domain. Therefore, the set of balls is greatly affected by the state of the random-number generator. The optional range is applied to each ball upon generation, and, if the ball does not fall within the range, it is not added to the model and does not affect the stopping criteria.
Various contact models are provided in PFC2D, and the linear parallel bond model, which has constant normal and shear stiffness at the contact point and permits some tension between the contact, was applied in this paper. According to the force-displacement law for the linear parallel bond model, the contact force and moment are updated by
where
where
The balls were appropriately scaled up during model generation for the purpose of higher computation efficiency. A total of 35,762 particles were formed, and the established model is shown in Figure 1.
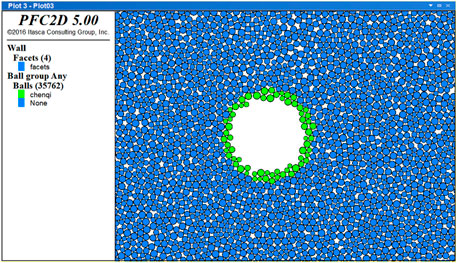
FIGURE 1. 2D PFC model of tunnel.
The pressure arch shapes before and after an earthquake were firstly simulated based on force chain pattern, and then the effects of tunnel depth, span, section shape, lining stiffness, seismic spectrum, and seismic amplitude on the pressure arch shape were analyzed.
Effect of Tunnel Depth
The magnitude of contact force between particles can be represented in terms of the thickness of force chain. The thicker the force chain, the larger the contact force, and vice versa (Chen-Peng, 2021; Deng et al., 2021; Wang et al., 2022). The force chain patterns of 15 and 25 m deep tunnels before and after an earthquake are shown in Figures 2 and 3, respectively.

FIGURE 2. Force chain pattern of 15 m deep tunnel. (A) Before earthquake. (B) After earthquake.
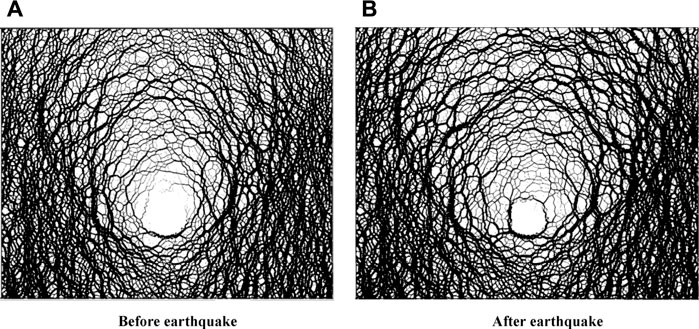
FIGURE 3. Force chain pattern of 25 m deep tunnel. (A) Before earthquake. (B) After earthquake.
Figure 2 shows that the force chain around a shallow tunnel before an earthquake is thick, with obvious pressure arch structure, indicating that the stress within the surrounding rock is large. In addition, the upper pressure arch is relatively weak in structure. When the shallow tunnel suffers from the horizontal earthquake, the force chain around the tunnel becomes thin, indicating that the stress within the surrounding rock decreases, and the lining deforms largely due to the increasing stress of lining structure. The results demonstrate that the pressure arch may be weakened to some extent when the tunnel is subject to seismic load.
Figure 3 shows that the pressure arch exists for deep tunnel before an earthquake, with strong structures at the left and right sides and weak structures above the tunnel. After the horizontal earthquake is applied, the force chain around the tunnel becomes thick, and the pressure arch expands and moves away from the tunnel, with little change in tunnel deformation. It is inferred that the seismic load may damage the original pressure arch around the deep tunnel and cause the surrounding rock to be denser. Thus, a new stronger pressure arch forms, with some change in shape and position.
Therefore, the tunnel depth has a large effect on the pressure arch under an earthquake. For a shallow tunnel, seismic load may totally or partly damage the original pressure arch, and no new pressure arch forms. For a deep tunnel, seismic load may change the shape and position of the original pressure arch, and a new stronger one forms. Because the vertical load applied on the tunnel depends largely on the height of the pressure arch above the tunnel, the heights of the pressure arch before and after an earthquake are listed in Table 3.

TABLE 3. Factors influencing the height of pressure arch above tunnel.
Effect of Tunnel Span
The force chain patterns of circular tunnels with diameters of 4, 8, and 12 m were numerically simulated under the same horizontal seismic acceleration, respectively, as shown in Figure 4.
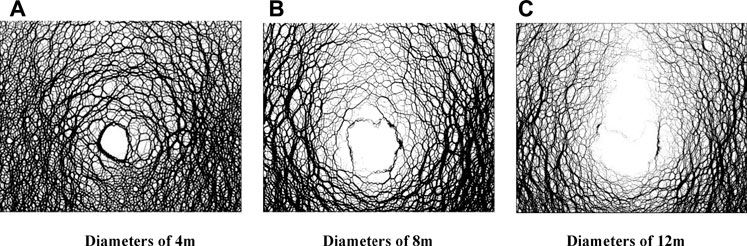
FIGURE 4. Force chain patterns of circular tunnel with diameters of 4, 8, and 12 m after earthquake. (A) Diameters of 4 m. (B) Diameters of 8 m. (C) Diameters of 12 m.
Figure 4 shows that when the tunnel span is small, the force chain around the tunnel is thick and continuous, with small lining deformation, indicating that a complete pressure arch exists and the tunnel lining is stable. When the tunnel span is moderately large, the force chain above the tunnel is thin while those at the two sides are thick, with relatively large lining deformation, demonstrating that the pressure arch above the tunnel tends to fail and the left and right sides of lining are subject to large stress. When the tunnel span is large, the force chain above the tunnel disappears and those at the two sides become thin, with large lining deformation, which indicates that the pressure arch fails and the tunnel lining is not stable. Therefore, under the same horizontal seismic acceleration, the small-span tunnel may be stale. As the tunnel span increases, the pressure arch above the tunnel firstly fails, then the other pressure arch, and the seismic stability tends to decrease rapidly. The height of the pressure arch under various span conditions before and after an earthquake are listed in Table 3.
Effect of Section Shape
The force chain patterns of circular and rectangular tunnels with identical span and lining structure were numerically simulated under the same horizontal seismic acceleration, respectively, as shown in Figure 5.
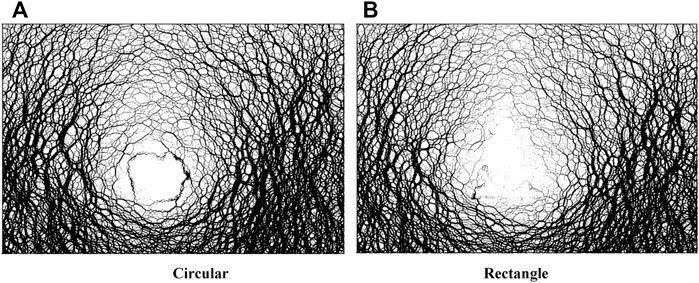
FIGURE 5. Force chain patterns of circular and rectangular tunnels after earthquake. (A) Circular. (B) Rectangular.
Figure 5 shows that the force chain of a circular tunnel is thick and complete, indicating that the pressure arch is continuous and the lining is stable, while the force chain of a rectangular tunnel is thin above the tunnel and thick on the two sides of the tunnel, indicating that the upper force chain tends to fail and the lining may become unstable due to the large applied stress. Therefore, the circular tunnel has better seismic stability than the rectangular tunnel. The height of the pressure arch of circular and rectangular tunnels before and after an earthquake are listed in Table 3.
Effect of Lining Stiffness
The force chain patterns of circular tunnels with lining stiffness of 1e10, 5e10, and 10e10 N/m (the selected value is close to the actual project) were numerically simulated under the same horizontal seismic acceleration, respectively, as shown in Figure 6.
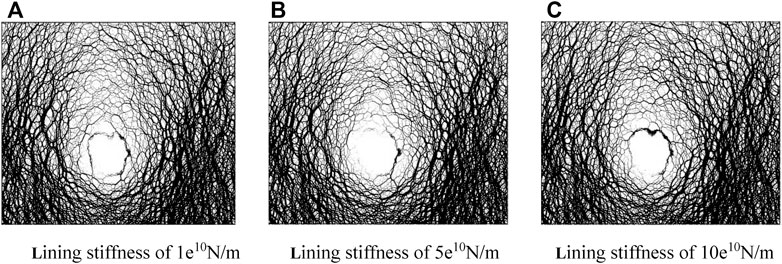
FIGURE 6. Force chain patterns of circular tunnels with various lining stiffness after earthquake. (A) Lining stiffness of 1e10N/m. (B) Lining stiffness of 5e10N/m. (C) Lining stiffness of 10e10N/m.
Figure 6 shows that, as the lining stiffness increases, the force chain of a circular tunnel changes a little, and the lining deformation decreases, indicating that the lining stiffness has little effect on the shape of the pressure arch. In addition, the increase in lining stiffness can reduce the lining deformation and improve the seismic stability of the tunnel. The height of the pressure arch of tunnels with various stiffness before and after an earthquake are listed in Table 3.
Effect of Seismic Spectrum
The El Centro earthquake, Kobe earthquake, and Wenchuan earthquake have different seismic spectra and were selected to numerically simulate force chain patterns of circular tunnels under the same horizontal seismic acceleration. Three seismic waves of various types are shown in the Figure 7.
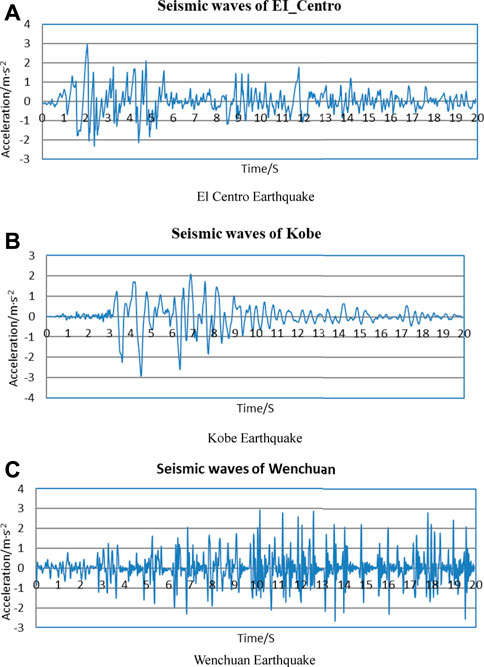
FIGURE 7. Three seismic waves of various types. (A) El Centro earthquake. (B) Kobe earthquake. (C) Wenchuan earthquake.
The numerical results are shown in Figure 8.
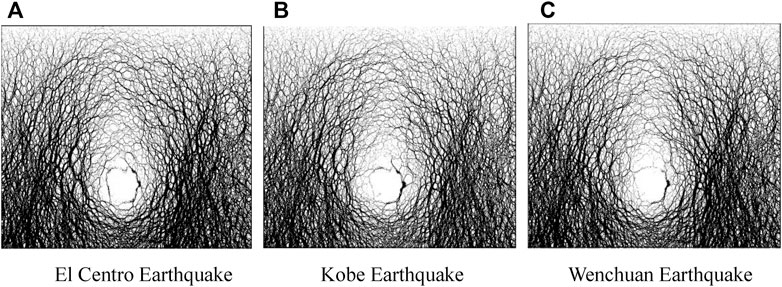
FIGURE 8. Force chain patterns of circular tunnels under earthquake of various spectra. (A) El Centro earthquake. (B) Kobe earthquake. (C) Wenchuan earthquake.
Figure 8 shows that the force chain patterns are almost identical under three various earthquakes, indicating that the seismic spectrum has little effect on the pressure arch. The height of pressure arch of tunnels before and after earthquakes of various spectra are listed in Table 3.
Effect of Seismic Amplitude
The force chain patterns of circular tunnels with seismic amplitudes of 0.1, 0.2, and 0.3 g were numerically simulated under the El Centro earthquake, respectively, as shown in Figure 9.
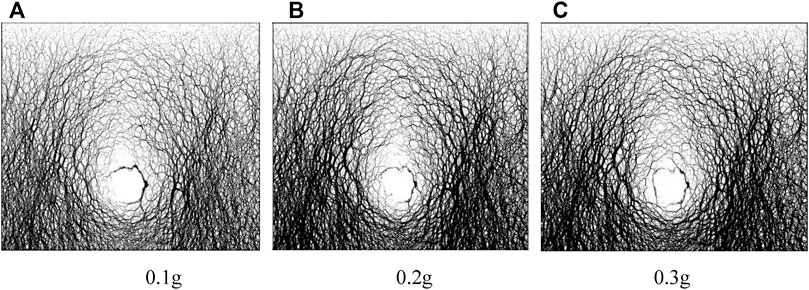
FIGURE 9. Force chain patterns of circular tunnels under earthquake of various amplitudes. (A) 0.1 g. (B) 0.2 g. (C) 0.3 g.
Figure 9 shows that, as the seismic amplitude increases, the force chain around the tunnel becomes thick, especially on the two sides, and the lining deformation increases greatly due to the increasing stress, indicating that the lining structure may suffer great deformation or even failure under the large horizontal seismic amplitude. In addition, the pressure arch around the tunnel may become thick if the seismic amplitude increases. The height of the pressure arch of tunnels before and after the El Centro earthquake of various amplitudes are listed in Table 3.
Table 3 shows that the tunnel depth has the largest effect on the shape of the pressure arch; the span, section shape, seismic amplitude, and lining stiffness have moderate effect, and the seismic spectrum has little effect. The factor sensitivity after the earthquake is greater than that before the earthquake, and the reason is as follows: before the earthquake, it is a static problem, and after the earthquake, it is a wave dynamic problem. The six influencing factors have different mechanisms for static and dynamic effects, so their sensitivities are also different. In addition, only the values about the pressure arch above the tunnel are listed in Table 3, and the values about the pressure arch under and on the two sides of the tunnel differ from the values in Table 3.
Shaking Table Test
The shaking table test was conducted to verify the numerical results about the force chain and pressure arch around the tunnel under an earthquake.
The device for the test is the hydraulic ES-5 shaking table system, which was manufactured by the Suzhou Sushi Testing Instrument Co., Ltd, China, and consists mainly of the platform, power amplifier, sensors, and controller, with maximum acceleration of 40 m/s2, maximum load of 1,500 kg, and rated excitation force of 50 kN. The model has a scale of 1:50, as shown in Figure 10.
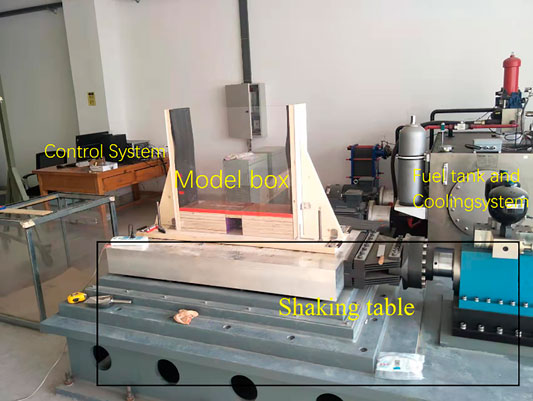
FIGURE 10. Shaking table and model box.
The grid was notched on the glass window of a model box to observe the shape variation of the pressure arch, and some foam board was installed to reduce the boundary effect (Wen-guang et al., 2005). The lining materials are usually made of waterproof sponge, latex, molded polystyrene foam, and rubber. The friction along the contact surface may be simulated by means of a thin layer of polystyrene foam on the inner lining surface. According the laboratory equipment conditions and testing requirements, an about 22.5 cm thick layer of molded polystyrene foam was chosen as the shock absorption structure on the inner lining surface, as shown in Figure 11.
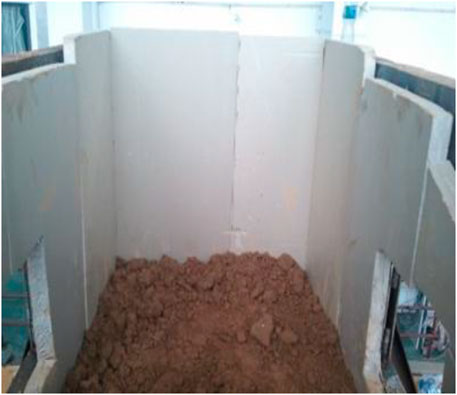
FIGURE 11. Shock absorption structure of molded polystyrene foam for shaking table test
The surrounding rock for the shaking table test was made by a mixture of river sand, laundry liquid, and sawdust. The river sand was selected as the aggregate because it not only matches well the general requirements of aggregate similarity but also has better simulation on the discreteness of the surrounding rock due to the great variability of its grain size. Additionally, the water content of the mixture was kept almost constant because the river sand has low moisture content, ensuring good stability in the physical and mechanical properties of the mixture. The sawdust was used to adjust the unit weight of the mixture and enhance the stabilization in the mixture properties because the sawdust can absorb much water and cementation material. The laundry liquid has low cementation and thus reduces the mixture strength to better simulate the mechanical behavior of surrounding rock. Furthermore, the three different materials did not react chemically with each other after mixing, so the physical and mechanical properties of the mixture was very stable. The major mechanical parameters of the original surrounding rock and the mixture materials are listed in Table 4.
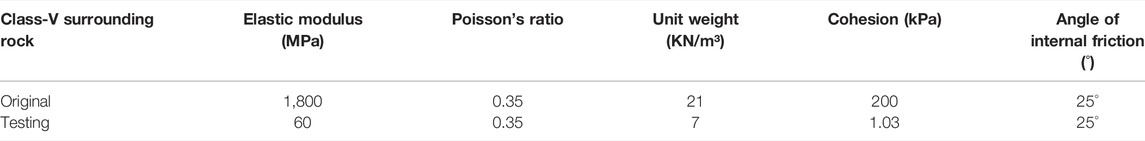
TABLE 4. Major mechanical parameters of original surrounding rock and mixture materials.
The mixture ratio of the simulated Class-V surrounding rock for the shaking table test was finally determined by a series of trial tests, as listed in Table 5.
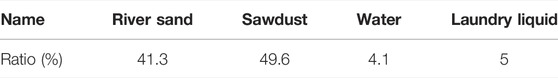
TABLE 5. Mixture ratio of simulated Class-V surrounding rock.
The tunnel excavation was simulated with a special device by the aeration and deflation of a balloon. This device is basically made with two layers of rubber acting as the tunnel and lining, respectively. The tunnel layer is divided into two parts, one over the tunnel axis and another beneath the tunnel axis. The upper part and arch support jointly form an arch area. Each aeration bag has one inlet and one outlet. The outside of the arch support is attached with several strain gauges or connected to a pressure gauge. When the aeration bag is fully aerated through the inlet, the arch-shaped bag and the lining can be tightly joined. When the air in the aeration bag is drained through the outlet, the stress change in the arch support can be measured by the strain gauges or pressure gauge. Thus, the tunnel excavation processes can be judged.
The fully aerated bag embedded in the soil is used to simulate the tunnel excavation. The pressure gauge connected to the aeration bag is used to simulate the stress release of tunnel excavation by releasing air to some extent and therefore the effect of excavation method on the formation and variation of the pressure arch and the seismic performance of the tunnel structure. To gain the goals above, the fully aerated bag is firstly embedded in the soil to simulate the tunnel conditions before excavation, and then some air is released with the pressure gauge to simulate the tunnel excavation. Thirdly, the outside bag is aerated to simulate the tunnel reinforcement by controlling the pressure gauge. Finally, various seismic waves are exerted on the model bottom. The formation of the pressure arch and the variation of soil particles before and after the earthquake were recorded with a camera. Thus, the shapes of the pressure arch can be compared with these photos and numerical results.
In terms of tunnel depth, seismic spectrum, and seismic amplitude, a total of 12 testing situations were schemed for the shaking table test, as listed in Table 6.
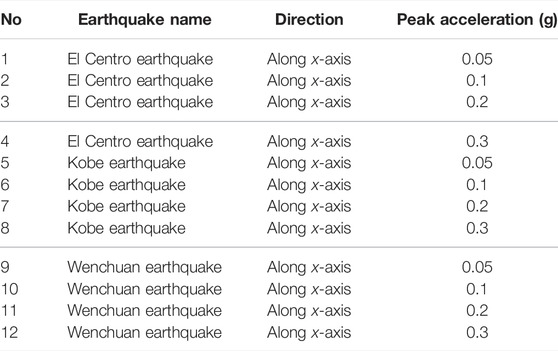
TABLE 6. Seismic loading scheme for shaking table test.
According to the testing scheme in Table 6, the El Centro earthquake, Kobe earthquake, and Wenchuan earthquake were separately applied on the model in terms of the tunnel depth, seismic spectrum, and seismic amplitude. The experimental and numerical results are shown in Figures 12–14 for comparative purposes.
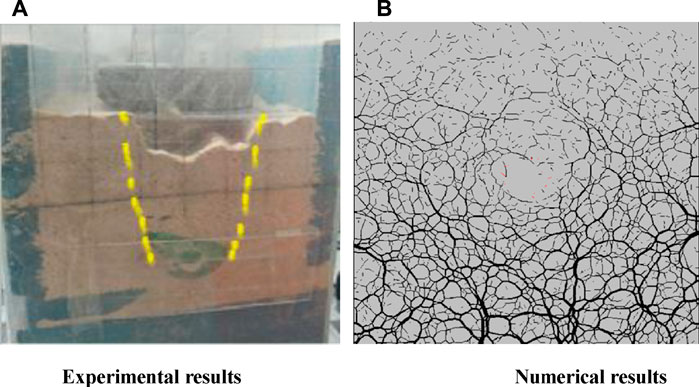
FIGURE 12. Experimental and numerical results of 15 m deep tunnel after earthquake. (A) Experimental results. (B) Numerical results.
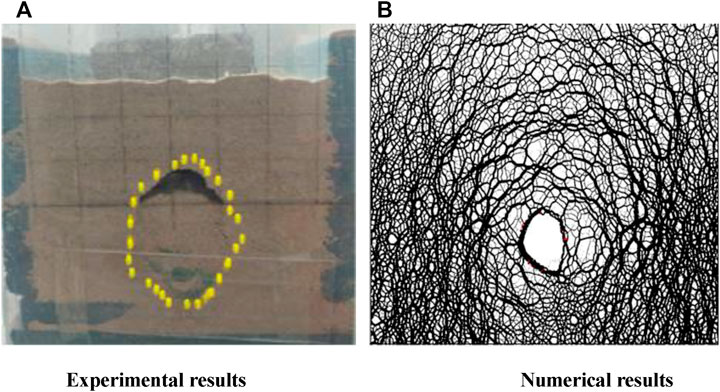
FIGURE 13. Experimental and numerical results of 20 m deep tunnel after earthquake. (A) Experimental results. (B) Numerical results.
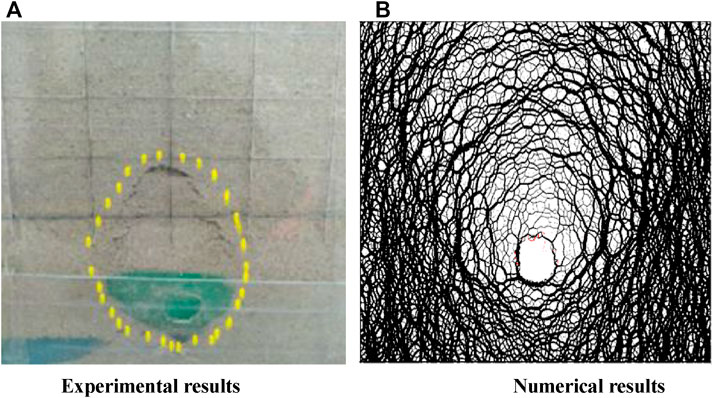
FIGURE 14. Experimental and numerical results of 25 m deep tunnel after earthquake. (A) Experimental results. (B) Numerical results.
Figures 12–14 show that the shape of the pressure arch by the shaking table test is basically identical to that by numerical simulation. When the tunnel is shallow, the failure plane extends to the ground surface, and thus no pressure arch is formed. The soil pressure around the tunnel decreases gradually with the tunnel depth, indicating that the pressure applied on the tunnel also decreases gradually with tunnel depth. In addition, the collapse degree of the pressure arch under the earthquake reduces obviously with the tunnel depth, which demonstrates that it is feasible to use the force chain to analyze the shape of the pressure arch.
Conclusion
In this paper, the force chain was used to analyze the shape of the pressure arch around the tunnel before and after an earthquake, and the effect of some factors on the shape of the pressure arch was studied. In addition, the shaking table test was carried out to verify the numerical results. Some preliminary conclusions were obtained as follows:
1) The shape of the pressure arch can be well represented by some easily visible indexes such as the thickness, integrity, and density of the force chain. Thus, the force chain is a powerful tool for the study on pressure arches around a tunnel.
2) The area of the pressure arch decreases gradually with the tunnel depth, indicating that the smaller the area of the pressure arch, the less surrounding rock that the tunnel self-stabilization needs, the more stable the tunnel, and the better the seismic stability of the tunnel. When the tunnel depth reaches a given value, the tunnel depth has little effect on the seismic stability of the tunnel.
3) As the tunnel span increases, the area of the pressure arch increases, and the tunnel becomes less stable. Therefore, the larger the tunnel span, the less the seismic stability of the tunnel. The rectangular tunnel has a larger area of pressure arch than the circular tunnel, and thus it is less stable than the circular tunnel. The lining of a rectangular tunnel suffers from large deformation after an earthquake. The lining stiffness has little effect on the shape of the pressure arch. However, the lining stiffness has a direct effect on the seismic stability of the tunnel. The larger the lining stiffness, the better the seismic stability of the tunnel.
4) The seismic spectrum has little effect on the shape of the pressure arch because the tunnel has less self-vibration characteristics than the on-ground buildings. As the seismic amplitude decreases, the tunnel deformation and pressure arch height decrease gradually. Therefore, the smaller the seismic amplitude, the more stable the tunnel.
5) This paper mainly calculates and analyzes the change law of the pressure arch shape around the circular tunnel lining structure; it has similar conclusions under the conditions of other lining shapes (horseshoe and rectangle).
Generally, it is suitable to analyze the variation of pressure arch shape by means of the force chain. This paper is an attempt to study the pressure arch through the force chain, and the next step needs to be combined with theoretical methods to conduct in-depth research. Only the 2D numerical simulation was conducted in this paper, and the 3D visualization study on the force chain may be carried out by transparent soil model test in the next stage. The research results of this paper can be used for seismic calculation and design of tunnel and underground engineering.
Data Availability Statement
The original contributions presented in the study are included in the article/supplementary material; further inquiries can be directed to the corresponding authors.
Author Contributions
SC and ZY contributed to conception and design of the study. GL organized the database. ZL and PJ performed the statistical analysis. SC wrote the first draft of the manuscript. All authors contributed to manuscript revision and read and approved the submitted version.
Funding
This work was funded by the National Natural Science Foundation of China No:51408222.
Conflict of Interest
The authors declare that the research was conducted in the absence of any commercial or financial relationships that could be construed as a potential conflict of interest.
Publisher’s Note
All claims expressed in this article are solely those of the authors and do not necessarily represent those of their affiliated organizations or those of the publisher, the editors, and the reviewers. Any product that may be evaluated in this article, or claim that may be made by its manufacturer, is not guaranteed or endorsed by the publisher.
References
Badakhshan, E., Noorzad, A., Bouazza, A., Zameni, S., and King, L. (2020). A 3D-DEM Investigation of the Mechanism of Arching within Geosynthetic-Reinforced Piled Embankment. Int. J. Sol. Structures 187, 58–74. doi:10.1016/j.ijsolstr.2019.03.035
Chang-nü, Z., Xin, L., Fan, L., and Bin, Z. (2021). Experimental Study and Numerical Simulation Analysis on Influencing Factors of Vertical Pressure at the Bottom of Stored Grain[J]. J. Henan Univ. Technology(Nat. Sci. Edition) 42 (6), 96–104. doi:10.16433/j.1673-2383.2021.06.013
Chen, X-B., Zhao-Sheng, Y., Zhou, Y-Q., Zhang, J-S., and Qian, Y. (2022). Prediction Model of Desiccation Shrinkage Fracture Depth and Spacing of Argillaceous Cement in Red Mudstone. Rock Soil Mech. 43 (4), 1–11. doi:10.16285/j.rsm.2021.1084
Chen-Peng, S. (2021). Discrete Element Simulation of the Effects of Intergranular Rolling Resistance on the Sand Compression Characteristics[J]. J. Water Resour. Architectural Eng. 19 (06), 70–75. doi:10.3969/j.issn.1672-1144.2021.06.011
Dantu, P. (1957). “A Contribution to the Mechanical and Geometrical Study of Non-cohesive Masses[C],” in Proceedings of the 4th International Conference on Soil Mechanics and Foundations Engineering (London: Butterworths Scientific Publications), 144–148.
Deng, J., Liang, A., and Wang, S-N. (2021). Microcosmic Analysis on Loess at Different Intake Orientation Sections and Dynamic Triaxial Simulation by Particle Flow Code [J]. J. Southeast Univ. (Natural Sci. Edition) 51 (05), 833–840. doi:10.3969/j.issn.1001-0505.2021.05.015
Feng, G.-L., Chen, B.-R., Xiao, Y.-X., Jiang, Q., Li, P.-X., Zheng, H., et al. (2022). Microseismic Characteristics of Rockburst Development in Deep TBM Tunnels with Alternating Soft-Hard Strata and Application to Rockburst Warning: A Case Study of the Neelum-Jhelum Hydropower Project. Tunnelling Underground Space Technol. 122, 104398. doi:10.1016/j.tust.2022.104398
Feng, G.-L., Feng, X.-T., Chen, B.-R., Xiao, Y.-X., and Yu, Y. (2015). A Microseismic Method for Dynamic Warning of Rockburst Development Processes in Tunnels. Rock Mech. Rock Eng. 48 (5), 2061–2076. doi:10.1007/s00603-014-0689-3
Handy, R. L. (1985). The Arch in Soil Arching. J. Geotechnical Eng. 111 (3), 302–318. doi:10.1061/(asce)0733-9410(1985)111:3(302)
Hu, S-X., Xiao-guang, J., Guo-dong, S., Han-lin, L., and Zi-heng, N. (2021). Triaxial Test and PFC-FLAC Coupling Simulation Study on Material Parameters and Deformation Characteristics of Soil-Rock Mixture[J]. Chin. J. Rock Mech. Eng. 40 (Suppl. 2), 3344–3356. doi:10.13722/j.cnki.jrme.2021.0019
IEM (1936). Third Progress Report of Investigation into Causes of Falls and Accidents Due to Falls in Bord and Pillar Whole Workings-Roof-Fracture Control in Bords. Trans. Inst. Min. Eng. 90 (4), 241–242.
Iwashita, K., and Oda, M. (2000). Micro-Deformation Mechanism of Shear Banding Process Based on Modified Distinct Elementmethod[J]. Powder Technol. 109 (1), 192–205. doi:10.1016/s0032-5910(99)00236-3
Majmudar, T. S., and Behringer, R. P. (2005). Contact Force Measurements and Stress-Induced Anisotropy in Granular Materials. Nature 435 (23), 1079–1082. doi:10.1038/nature03805
Miao, T., Yi, C., Qi, Y., Qing-Song, M., and Yuan, L. (2007). Force Transmission in Three-Dimensional Hexagonal-Close-Packed Granular Arrays Submitted to a Point Load. Acta Phys. Sin. 56 (8), 4713–4721. doi:10.7498/aps.56.4713
Oda, M., Takemura, T., and Takahashi, M. (2004). Microstructure in Shear Band Observed by Microfocus X-ray Computed Tomography. Géotechnique 54 (8), 539–542. doi:10.1680/geot.2004.54.8.539
Peng, J., Cui, P., and Zhuang, J. (2020). Challenges to Engineering Geology of Sichuan-Tibet Railway. Chin. J. Rock Mech. Eng. 39 (12), 2377–2389. (in Chinese). doi:10.13722/j.cnki.jrme.2020.0446
Sanfratello, L., Fukushima, E., and Behringer, R. P. (2009). Using MR Elastography to Image the 3D Force Chain Structure of a Quasi-Static Granular Assembly. Granular Matter 11 (1), 1–6. doi:10.1007/s10035-008-0112-4
Shang, B., Jin, X., Ao, G., Chen, Q., and Qiu, Q. (2020). Calculation of Surrounding Rock Pressure of Undercut Subway Station Based on Multi-Factor Affecting Pressure Arch Theory. Engineering 12, 59–70. doi:10.4236/eng.2020.122006
Socolar, J. E. S., Schaeffer, D. G. D. G., and Claudin, P. (2002). Directed Force Chain Networks and Stress Response in Static Granular Materials. Eur. Phys. J. E 7, 353–370. doi:10.1140/epje/i2002-10011-7
Song, Y., Zhang, Y., and Liu, Y. (2017). Calculation of the Surrounding Rock Pressure Based on Pressure Arch Theory. J. Disaster Prev. Reduction 33 (2), 45–51. doi:10.13693/j.cnki.cn21-1573.2017.02.008
Sun, Q., and Wang, G. (2008). Force Distribution in Static Granular Matter in Two Dimensions. Acta Physica Sinica 57 (008), 4667–4674. doi:10.7498/aps.57.4667
Terzaghi, K. (1936). “Stress Distribution in Dry and in Saturated Sand above a Yielding Trap-Door,” in Proceedings of 1st Conference of Soil Mechanics and Foundation Engineering, Boston, 307–316.
Tien, H-J. S. (2001). The Arching Mechanism on the Micro Level Utilizing Photoelasticity Modeling. United States: Massachusetts Lowell University.
Wang, Y-W., Liu, R., Sun, R-H., and Xu, Z-W. (2022). Correlation of Microscopic and Macroscopical of Granular Materials Based on Rolling Resistance Linear Contact Model. Rock Soil Mech. 43 (4), 1–13. doi:10.16285/j.rsm.2021.0918
Wang, Z-C., and Zhao, X-Y. (2022). Mesoscopic Study on Mechanical Properties of Metakaolin-Based Geopolymer Reinforced by Fine Sand[J]. J. Dalian Jiaotong Univ. 43 (1), 82–87. doi:10.13291/j.cnki.djdxac.2022.01.016
Wen-guang, L., Bei-shu, F., He, W-F., Hao, X., and Miyama, T. (2005). Study on Dynamic Response and Shaking Table Test of Isolated Structure with Isolation Bearing Arranged along Curved Surface[J]. J. Building Structures 435 (23), 1079–1082. doi:10.14006/j.jzjgxb.2020.0270
Yu, Y., Feng, G-L., Xu, C-J., Chen, B-R., Geng, D-X., and Zhu, B-T. (2022). Quantitative Threshold of Energy Fractal Dimension for Immediate Rock-Burst Warning in Deep Tunnel: a Case Study. Lithosphere 2021, 1699273. doi:10.2113/2021/1699273
Zang, W. (2017). Damage to Highway Tunnels Caused by the Wenchuan Earthquake. Mod. Tunneling Technol. 54 (2), 17–25. (in Chinese). doi:10.13807/j.cnki.mtt.2017.02.003
Zeng, X. (2018). Numerical Analysis of the Effects of Soil Arching and Earth Pressure Acting Modes in Metro Tunnels. Shanxi Architecture 44 (17), 186–187. (in Chinese). doi:10.13719/j.cnki.cn14-1279/tu.2018.17.098
Zhou, Y-Q., Qin, M., Xiao-yang, Z., Zhi-yuan, Z., Hao, L., and De-zhong, M. (2022). Experimental and Simulation Researchon the Influencing Factors of Particlevelocity[J]. Phys. Eng. 32 (1), 123–129. Available at: https://kns.cnki.net/kcms/detail/11.4483.o3.20211223.1723.006.html.
Keywords: force chain, pressure arch, earthquake action, shaking table test, influential factors
Citation: Changxin S, Yumin Z, Lei G, Liye Z and Jiafeng P (2022) Force-Chain-Based Analysis of Factors Influencing Pressure Arch Around Tunnel Under Earthquake. Front. Earth Sci. 10:851285. doi: 10.3389/feart.2022.851285
Received: 09 January 2022; Accepted: 18 February 2022;
Published: 30 March 2022.
Edited by:
Guang-Liang Feng, Institute of Rock and Soil Mechanics (CAS), ChinaReviewed by:
Li Liang Ying, Lanzhou Jiaotong University, ChinaQinglai Fan, Ludong University, China
Shizhong Liu, Taiyuan University of Science and Technology, China
Shuqian Duan, Zhengzhou University, China
Copyright © 2022 Changxin, Yumin, Lei, Liye and Jiafeng. This is an open-access article distributed under the terms of the Creative Commons Attribution License (CC BY). The use, distribution or reproduction in other forums is permitted, provided the original author(s) and the copyright owner(s) are credited and that the original publication in this journal is cited, in accordance with accepted academic practice. No use, distribution or reproduction is permitted which does not comply with these terms.
*Correspondence: Sun Changxin, c2NoeDgwQHNvaHUuY29t; Zhang Yumin, emhhbmd5dW1pbkBuY3d1LmVkdS5jbg==