95% of researchers rate our articles as excellent or good
Learn more about the work of our research integrity team to safeguard the quality of each article we publish.
Find out more
ORIGINAL RESEARCH article
Front. Earth Sci., 01 June 2022
Sec. Marine Geoscience
Volume 10 - 2022 | https://doi.org/10.3389/feart.2022.850652
This article is part of the Research TopicThe Lifetime of Methane Bubbles Through Sediment and Water ColumnView all 14 articles
Methane ebullition from lakes is an important contributor to atmospheric greenhouse gases. However, ebullition is typically sampled at intervals greater than the duration of ebullition events, limiting our understanding of the factors controlling this flux. Here, we present high-frequency ebullition data from a single site in a boreal pit lake during the open-water season between June 24 and 21 October 2018. We record ebullition every 30 min for the first 2 months, and then every minute for the next 2 months. During the 4-month period, 24 ebullition events were recorded. These events generally lasted 2–4 days in response to low atmospheric pressure systems. The peaks in ebullition corresponded to troughs in atmospheric pressure. We provide empirical equations that incorporate a pressure threshold to model the time-series of ebullition events. Minor and gradual variations in mud temperature had no apparent effect on the observed ebullition events.
Methane ebullition (bubbling) from lakes is an important contributor to atmospheric greenhouse gases (Bastviken et al., 2004; DelSontro et al., 2016; Rosentreter et al., 2021). However, ebullition is not often measured, adding uncertainty to estimated global lake emissions (DelSontro et al., 2018). Furthermore, given that ebullition is highly heterogenous in space and time, measurements of ebullition are not always representative (Ostrovsky, 2003). Ebullition events typically have a duration of 4 days or less (Varadharajan and Hemond, 2012; Zhao et al., 2021). However, longer sampling intervals have often been used, e.g., bi-weekly (Praetzel et al., 2021) or monthly (DelSontro et al., 2016), introducing uncertainties in the estimated ebullitive flux and our understanding of the driving factors (Varadharajan et al., 2010).
Methane ebullition from sediments is controlled by a complex sequence of processes. Biological and thermogenic processes generate methane (Etiope and Klusman, 2002). When methane concentrations exceed pore water solubility, bubbles form (Judd et al., 2002). Once these bubbles grow sufficiently large, they can migrate through the sediments by creating fracture paths, or making use of existing paths (Boudreau, 2012). Sediment temperature changes can affect methane production, solubility and bubble volume, and consequently affect ebullition (Fechner-Levy and Hemond, 1996; DelSontro et al., 2016). Ebullition can also be affected by pressure variations, which influence porewater solubility, bubble volume and bubble rise (Tokida et al., 2007; Boudreau, 2012).
In lakes, temperature variations (Wik et al., 2013; Natchimuthu et al., 2016; Praetzel et al., 2021), atmospheric pressure fluctuations (Mattson and Likens, 1990; Zhao et al., 2021), water level changes (Chanton et al., 1989; Harrison et al., 2017) or the combined effects of atmospheric pressure and water level (Varadharajan and Hemond, 2012; Delwiche and Hemond, 2017) have been shown to affect ebullition. However, the impact of these factors on ebullition varies from lake to lake. For example, Praetzel et al. (2021) studied ebullition in a small and shallow temperate lake (maximum depth 1.5 m). They concluded that temporal changes in ebullition were controlled by sediment temperature, and did not find a relationship between ebullition and pressure variations. Varadharajan and Hemond (2012) investigated ebullition in a dimictic lake (mean depth 15 m) and reported that ebullition was mostly regulated by hydrostatic pressure changes.
The impacts of different environmental factors on ebullition can be different in the open-water season from the ice-cover season. During open-water, changes in water and sediment temperature, wind speed, water level, and atmospheric pressure can simultaneously affect ebullition (McClure et al., 2020), whereas during ice-cover, the impacts of temperature, water-level, and wind speed are minimal. Zhao et al. (2021) have shown that during ice cover in Base Mine Lake, a boreal pit lake in Alberta, Canada, ebullition occurred almost exclusively when atmospheric pressure dropped below a pressure threshold; and when the pressure rose above the threshold, ebullition ceased.
The focus of the present study is ebullition during the open water season in Base Mine Lake. In Section 2, we describe the study site and our data collection methods. In Section 3, we show the time series of atmospheric pressure, water level, ebullition, water and mud temperature. We also present a pressure-driven ebullition model. In Section 4, we discuss the effect of pressure and mud temperature on ebullition in Base Mine Lake. We give our conclusions in Section 5.
Base Mine Lake is located at

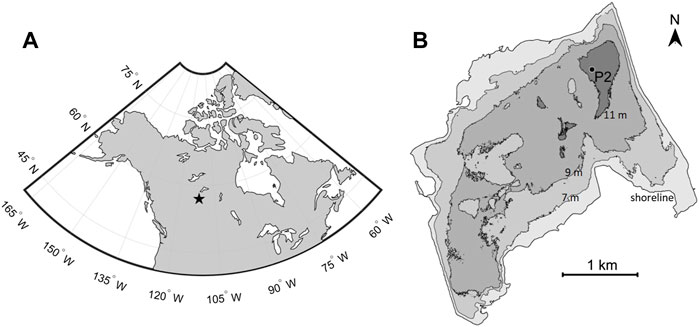
FIGURE 1. Base Mine Lake (A) location, (B) bathymetry. Water temperature, mud temperature, and acoustic ebullition data are collected at Platform P2.
The degeneration of residual hydrocarbon inside the tailings (mud) layer produces methane. Clark et al. (2021) measured a median methane flux of 10 mg m−2 h−1 between 2017 and 2019 using an eddy covariance system. Francis et al. (2022) have measured dissolved methane concentration inside the porewater that reaches 90–110% saturation 1–3 m below the mud-water interface. Bubbles have been observed to rise through the water column using echo sounding (Lawrence et al., 2016; Zhao et al., 2021). In their modelling of methane dynamics in Base Mine Lake, Slater et al. (2021) have assumed that the rising bubbles were: “composed either entirely of methane, or of 75% methane and 25% nitrogen (by volume), based on the results of the preliminary gas analyses (unpublished data)”.
Ebullition was measured using a downward facing, single beam 400 kHz echosounder (Echologger EA400), which is capable of autonomously logging high-frequency acoustic data over an extended period. We deployed the echosounder three times during the open-water season between June 24 and October 21. The settings for these deployments were a burst of 100 pings over 50 s once every 30 min between June 24 and August 15, a burst of 50 pings over 25 s once every minute between August 16 and September 18 and between September 20 and 21 October 2018.
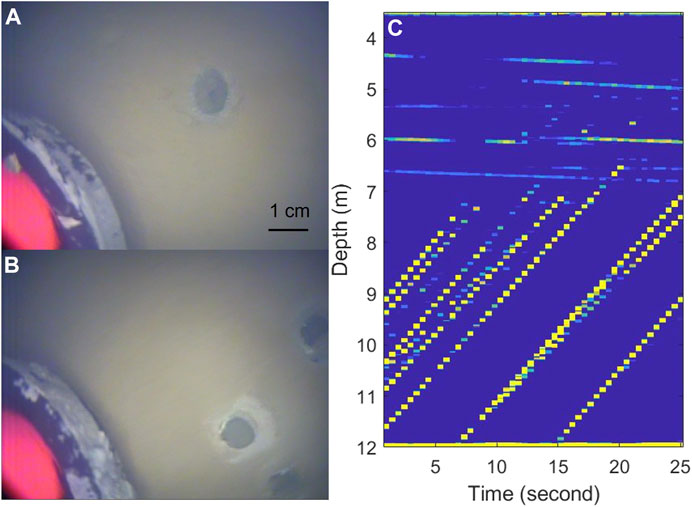
Rising bubbles emerged from pockmarks at the lakebed (Figures 2A,B). These rising bubbles were recorded by an echosounder, that was attached to Platform P2 and was suspended 8.5 m above the lakebed. With a 5° beam angle, the echosounder monitored an area of 0.7 m radius if it stays stationary. However, the platform can drift under the impacts of wind and waves. Therefore, the area monitored by the echosounder shifted with the movement of the platform.

FIGURE 2. Pockmarks and rising bubbles. (A,B) show two images of pockmarks in the lakebed. Bubbles emerge from these pockmarks. The red and black instrument on the left bottom corner of each image is a RBR Concerto data logger, which is partially covered by mud. (C) shows a sample echogram obtained by the echosounder over a 25-s burst at 13:25, 11 October 2018 (Mountain Standard Time). The diagonal lines are bubbles rising at a speed of approximately 25 cm/s.
A sample echogram is shown in Figure 2C. The diagonal lines show the backscatter intensity of rising bubbles, whereas the nearly horizontal lines are the result of unknown reflectors. The backscatter intensity is a unitless measure equivalent to the strength of the reflected signals. To estimate ebullition intensity, the nearly horizontal lines are filtered out, and then the backscatter intensity between 6.8 and 10.7 m depth is averaged over each 25-s burst. The ebullition intensity represented by Figure 2C is marked as a red dot in Figure 3A.

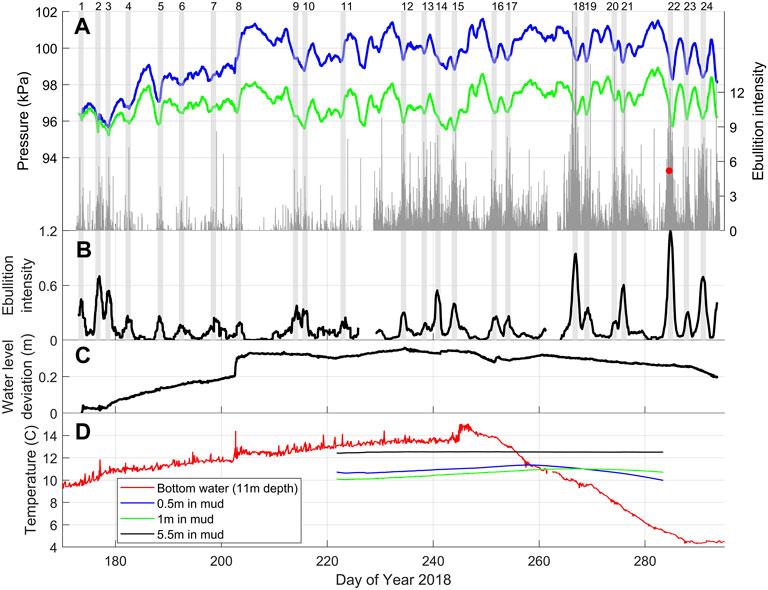
FIGURE 3. (A) atmospheric pressure variations (green line), total pressure variations (blue line) and ebullition intensity (grey lines). The total pressure variation is the atmospheric pressure plus the pressure variation caused by water level changes. The vertical grey lines show the instantaneous ebullition intensity, obtained from each burst of echo-sounding. The red dot represents the instantaneous ebullition intensity obtained from Figure 2C. The width of each shaded area is 1 day. (B) shows the smoothed ebullition intensity, which is obtained by applying a 24-h moving average to the instantaneous ebullition intensity. (C) shows the water level variations, where a 0.1 m change in water level is equivalent to a 0.98 kPa pressure change. (D) shows the temperature measured at the 11 m depth in the water column, 0.5 m into the mud beneath lakebed, 1 m into the mud and 5.5 m into the mud. The lake is around 12 m deep at the location (Platform P2) of temperature measurements.
Compared to manually examined bubble traps or acoustic instruments that require external power, the advantage of our echosounder (Echologger EA400) is that it continuously monitors ebullition at a high frequency. Low ebullition intensity indicates low volumetric flux, and stronger ebullition intensity indicates higher volumetric flux. The single-beam echosounder provides the opportunity to directly observe ebullition at high-frequency over extended periods.
To analyze the physical factors that affect ebullition, water level, atmospheric pressure, water temperature and mud temperature data were collected. The atmospheric pressure data were collected at nearby Fort McMurray Airport (47 km away). The variations in atmospheric pressure at the lake and the airport are almost identical (Zhao et al., 2021).
Water temperature and mud temperature were measured at Platform P2. Bottom-water temperature was measured at 11 m depth using an RBRsolo logger. Note, the lake was 12 m deep at Platform P2. The mud temperature was also measured at 0.5, 1, and 5 m depths beneath the lakebed by Francis et al. (2022) using 3001 L T Levelogger Edge M30 and HOBO Water Temperature Pro V2 sensors.
Variations in atmospheric pressure, water level, total hydrostatic pressure (atmospheric pressure plus water level) and ebullition intensity are presented in Figures 3A–C. Over the 4-month period, 24 ebullition events were identified. These ebullition events were caused by hydrostatic pressure variations and had a duration of 2–4 days. Of the 24 observed ebullition events, 22 peaked when hydrostatic pressure was at a local trough. The other 2 events (9 and 14) peaked while the pressure was decreasing. Even though the water level varied by 0.36 m (corresponding to 3.5 kPa) during the period of record, the rate of pressure change caused by water level fluctuations was generally much less than the rate of change in atmospheric pressure (Figures 3A,C). Consequently, the ebullition events were primarily caused by the passage of low atmospheric pressure systems of duration of 2–4 days.
The close correspondence between ebullition peaks and pressure troughs suggests that pressure variations are strong predictors for ebullition events. However, assuming a linear relationship between ebullition intensity and hydrostatic pressure over our 4-month study period yields a low correlation coefficient (R2 = 0.13). Varadharajan and Hemond (2012) and Zhao et al. (2021) observed that ebullition generally occurred when pressure dropped below a threshold. Zhao et al. (2021) proposed that during ice cover ebullition could be modelled using
where,
Applying Equation 1 with a constant pressure threshold, Zhao et al. (2021) were able to model the magnitude and timing of major ebullition events in Base Mine Lake during ice cover. However, the history of ebullition events can affect the pressure threshold. For example, when a low-pressure event causes a significant ebullition event, the storage of methane in the mud decreases. In order to trigger the next ebullition event a lower pressure needs to be reached, i.e., the pressure threshold is reduced. On the other hand, when the pressure remains high, the storage of methane in the mud increases. Consequently, the next ebullition event is triggered at a higher pressure, i.e., the pressure threshold is increased. In the present study, this is the case between Day 204 and Day 209 after a sudden increase in water level and atmospheric pressure (Figures 3A,C). To model the effects of the past pressure on methane storage, we use a varying pressure threshold
where
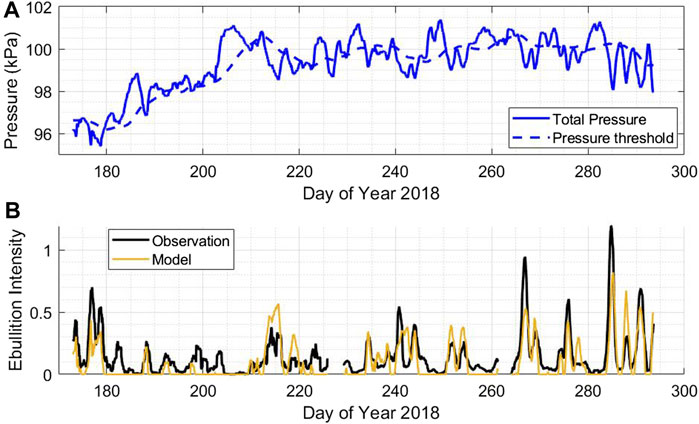
Despite the simplicity of the above model, the timing and magnitude of major ebullition events are well captured, as shown in Figure 4. The model parameters are obtained by minimizing the root mean square error (RMSE) between the observations and predictions:
where

FIGURE 4. Comparisons between model results and field observations. (A) shows the total pressure variations and the varying pressure threshold. (B) shows the comparison between model results and field observations.
Although the model performs well, it has limitations. Firstly, the amount of methane that is stored within the mud layer and released during ebullition events is likely to be affected by the in-situ mud characteristics. Therefore,
The close correspondence between ebullition and pressure observed during ice cover in Base Mine Lake (Zhao et al., 2021) is also observed during the open-water season (Figure 3). Using a simple relationship (Eq. 1), where ebullition internsity is proportional to the pressure deficit below a threshold, we find that the predicted ebullition agrees well with our field observations (Figure 4). Our results are consistent with the observations in Upper Mystic Lake in Massachusetts by Varadharajan and Hemond (2012). In these studies, ebullition was sampled at high frequency (1–30 min samping intervals), sufficient to capture the response of ebullition to rapid atmospheric pressure variations.
However, when sampling intervals increase to weekly (Casper et al., 2000; Matthews et al., 2005), bi-weekly (Praetzel et al., 2021; Natchimuthu et al., 2016) or monthly (DelSontro et al., 2016; Descloux et al., 2017), the chances of omitting ebullition peaks increase. For example, Natchimuthu et al. (2016) who sampled ebullition once every 2 weeks state: “Importantly, although this study is extensive in its temporal coverage, compared with most previous studies, the measurements still just covered 7% of the time during the 2 yr study period. Thereby many low pressure induced flux events were likely missed …". Note that, if the objective of any field campaign is to better understand the response of ebullition to low atmospheric pressure events (typically 2–4 days), then ebullition needs to be sampled at least once per day.
Increased sediment temperature decreases methane solubility, increases bubble volume, and enhances the methane production rate; all of which can lead to increased ebullitive flux (Fechner-Levy and Hemond, 1996). In shallow lakes, temperature variations have been shown to affect ebullition by Wik et al. (2013), Natchimuthu et al. (2016), and Praetzel et al. (2021). Praetzel et al. (2021) measured sediment temperatures between 3.5 and 23.2 C over an 18-month period in a shallow temperate lake (Lake Windsborn), and concluded that temporal variations in ebullition were strongly controlled by these sediment temperature variations.
In Base Mine Lake, during the period of our record (Day 222–283, August 10th - October 10th), the mud temperature varied by less than 1.5 C (Figure 3D). These fluctuations in mud temperature had no apparent effect on ebullition. The correlation coefficient (linear regression) between ebullition intensity and mud temperature is R2 = 0.01 at 0.5 m, R2 = 0.02 at 1 m, and R2 = 0.00 at 5.5 m. An important difference between Base Mine Lake and Lake Windsborn is that the average depth of Base Mine Lake is 10 m (12 m deep at measurement site), whereas the maximum depth of Lake Windsborn is 1.5 m. Base Mine Lake is sufficiently deep that it is strongly thermally stratified in summer (Tedford et al., 2019) such that the bottom water temperature is nearly constant and the heat flux into the sediments is minimal. Also, in fall the water column in Base Mine Lake cools less than Lake Windsborn, as do the sediments.
Using continuous high-frequency acoustic data, we show the strong effects of atmospheric pressure variations on ebullition in Base Mine Lake. Over a 4-month period, 24 peaks in ebullition were observed, of which 22 peaks corresponded to local troughs in atmospheric pressure. These intense ebullition events generally had a duration of 2–4 days, corresponding to the passage of low atmospheric pressure systems. Despite the strong correspondence between ebullition peaks and pressure troughs, a simple linear correlation does not yield high correlation coefficients (R2 = 0.13) between pressure and ebullition. Incorporating the concept of a pressure threshold, we developed a two-parameter model of the time-series of ebullition events. This model yields R2 = 0.56 for our 4-month dataset.
The raw data supporting the conclusions of this article will be made available by the authors, without undue reservation.
KZ analyzed the data and wrote the manuscript. ET led the field data collection. GL and ET made extensive revisions to the manuscript.
The authors declare that the research was conducted in the absence of any commercial or financial relationships that could be construed as a potential conflict of interest.
All claims expressed in this article are solely those of the authors and do not necessarily represent those of their affiliated organizations, or those of the publisher, the editors and the reviewers. Any product that may be evaluated in this article, or claim that may be made by its manufacturer, is not guaranteed or endorsed by the publisher.
The authors thank the support of a Collaborative Research and Development Grant from the Natural Sciences and Engineering Research Council of Canada [CRDPJ 484628 - 15] and Syncrude Canada Ltd. The authors also thank Daniel Francis, Lee Barbour, and Matthew Lindsay for providing the mud temperature data.
Bastviken, D., Cole, J., Pace, M., and Tranvik, L. (2004). Methane Emissions from Lakes: Dependence of Lake Characteristics, Two Regional Assessments, and a Global Estimate. Glob. Biogeochem. Cycles 18 (4), 238. doi:10.1029/2004gb002238
Boudreau, B. P. (2012). The Physics of Bubbles in Surficial, Soft, Cohesive Sediments. Mar. Petroleum Geol. 38 (1), 1–18. doi:10.1016/j.marpetgeo.2012.07.002
Casper, P., Maberly, S. C., Hall, G. H., and Finlay, B. J. (2000). Fluxes of Methane and Carbon Dioxide from a Small Productive Lake to the Atmosphere. Biogeochemistry 49 (1), 1–19. doi:10.1023/a:1006269900174
Chanton, J. P., Martens, C. S., and Kelley, C. A. (1989). Gas Transport from Methane-Saturated, Tidal Freshwater and Wetland Sediments. Limnol. Oceanogr. 34 (5), 807–819. doi:10.4319/lo.1989.34.5.0807
Clark, M. G., Drewitt, G. B., and Carey, S. K. (2021). Energy and Carbon Fluxes from an Oil Sands Pit Lake. Sci. Total Environ. 752, 141966. doi:10.1016/j.scitotenv.2020.141966
DelSontro, T., Beaulieu, J. J., and Downing, J. A. (2018). Greenhouse Gas Emissions from Lakes and Impoundments: Upscaling in the Face of Global Change. Limnol. Oceanogr. Lett. 3 (3), 64–75. doi:10.1002/lol2.10073
DelSontro, T., Boutet, L., St-Pierre, A., del Giorgio, P. A., and Prairie, Y. T. (2016). Methane Ebullition and Diffusion from Northern Ponds and Lakes Regulated by the Interaction between Temperature and System Productivity. Limnol. Oceanogr. 61 (S1), S62–S77. doi:10.1002/lno.10335
Delwiche, K. B., and Hemond, H. F. (2017). Methane Bubble Size Distributions, Flux, and Dissolution in a Freshwater Lake. Environ. Sci. Technol. 51 (23), 13733–13739. doi:10.1021/acs.est.7b04243
Descloux, S., Chanudet, V., Serça, D., and Guérin, F. (2017). Methane and Nitrous Oxide Annual Emissions from an Old Eutrophic Temperate Reservoir. Sci. Total Environ. 598, 959–972. doi:10.1016/j.scitotenv.2017.04.066
Dompierre, K. A., and Barbour, S. L. (2016). Characterization of Physical Mass Transport through Oil Sands Fluid Fine Tailings in an End Pit Lake: a Multi-Tracer Study. J. Contam. Hydrology 189, 12–26. doi:10.1016/j.jconhyd.2016.03.006
Etiope, G., and Klusman, R. W. (2002). Geologic Emissions of Methane to the Atmosphere. Chemosphere 49 (8), 777–789. doi:10.1016/s0045-6535(02)00380-6
Fechner-Levy, E. J., and Hemond, H. F. (1996). Trapped Methane Volume and Potential Effects on Methane Ebullition in a Northern Peatland. Limnol. Oceanogr. 41 (7), 1375–1383. doi:10.4319/lo.1996.41.7.1375
Francis, D. J., Barbour, S. L., and Lindsay, M. B. (2022). Ebullition Enhances Chemical Mass Transport across the Tailings-Water Interface of Oil Sands Pit Lakes. J. Contam. Hydrology 245, 103938. doi:10.1016/j.jconhyd.2021.103938
Harrison, J. A., Deemer, B. R., Birchfield, M. K., and O’Malley, M. T. (2017). Reservoir Water-Level Drawdowns Accelerate and Amplify Methane Emission. Environ. Sci. Technol. 51 (3), 1267–1277. doi:10.1021/acs.est.6b03185
Judd, A. G., Hovland, M., Dimitrov, L. I., Garcia Gil, S., and Jukes, V. (2002). The Geological Methane Budget at Continental Margins and its Influence on Climate Change. Geofluids 2 (2), 109–126. doi:10.1046/j.1468-8123.2002.00027.x
Lawrence, G. A., Tedford, E. W., and Pieters, R. (2016). Suspended Solids in an End Pit Lake: Potential Mixing Mechanisms. Can. J. Civ. Eng. 43 (3), 211–217. doi:10.1139/cjce-2015-0381
Matthews, C. J. D., Joyce, E. M., Louis, V. L. S., Schiff, S. L., Venkiteswaran, J. J., Hall, B. D., et al. (2005). Carbon Dioxide and Methane Production in Small Reservoirs Flooding Upland Boreal Forest. Ecosystems 8 (3), 267–285. doi:10.1007/s10021-005-0005-x
Mattson, M. D., and Likens, G. E. (1990). Air Pressure and Methane Fluxes. Nature 347 (6295), 718–719. doi:10.1038/347718b0
McClure, R. P., Lofton, M. E., Chen, S., Krueger, K. M., Little, J. C., and Carey, C. C. (2020). The Magnitude and Drivers of Methane Ebullition and Diffusion Vary on a Longitudinal Gradient in a Small Freshwater Reservoir. J. Geophys. Res. Biogeosciences 125 (3), e2019JG005205. doi:10.1029/2019jg005205
Natchimuthu, S., Sundgren, I., Gålfalk, M., Klemedtsson, L., Crill, P., Danielsson, Å., et al. (2016). Spatio-temporal Variability of Lake CH4 Fluxes and its Influence on Annual Whole Lake Emission Estimates. Limnol. Oceanogr. 61 (S1), S13–S26. doi:10.1002/lno.10222
Ostrovsky, I. (2003). Methane Bubbles in Lake Kinneret: Quantification and Temporal and Spatial Heterogeneity. Limnol. Oceanogr. 48 (3), 1030–1036. doi:10.4319/lo.2003.48.3.1030
Praetzel, L. S. E., Schmiedeskamp, M., and Knorr, K. H. (2021). Temperature and Sediment Properties Drive Spatiotemporal Variability of Methane Ebullition in a Small and Shallow Temperate Lake. Limnol. Oceanogr. 66, 2598–2610. doi:10.1002/lno.11775
Rosentreter, J. A., Borges, A. V., Deemer, B. R., Holgerson, M. A., Liu, S., Song, C., et al. (2021). Half of Global Methane Emissions Come from Highly Variable Aquatic Ecosystem Sources. Nat. Geosci. 14 (4), 225–230. doi:10.1038/s41561-021-00715-2
Slater, G. F., Goad, C. A., Lindsay, M. B. J., Mumford, K. G., Colenbrander Nelson, T. E., Brady, A. L., et al. (2021). Isotopic and Chemical Assessment of the Dynamics of Methane Sources and Microbial Cycling during Early Development of an Oil Sands Pit Lake. Microorganisms 9 (12), 2509. doi:10.3390/microorganisms9122509
Tedford, E., Halferdahl, G., Pieters, R., and Lawrence, G. A. (2019). Temporal Variations in Turbidity in an Oil Sands Pit Lake. Environ. Fluid Mech. 19 (2), 457–473. doi:10.1007/s10652-018-9632-6
Tokida, T., Miyazaki, T., Mizoguchi, M., Nagata, O., Takakai, F., Kagemoto, A., et al. (2007). Falling Atmospheric Pressure as a Trigger for Methane Ebullition from Peatland. Glob. Biogeochem. Cycles 21 (2). doi:10.1029/2006gb002790
Varadharajan, C., and Hemond, H. F. (2012). Time‐series Analysis of High‐resolution Ebullition Fluxes from a Stratified, Freshwater Lake. J. Geophys. Res. Biogeosciences 117 (G2). doi:10.1029/2011jg001866
Varadharajan, C., Hermosillo, R., and Hemond, H. F. (2010). A Low-Cost Automated Trap to Measure Bubbling Gas Fluxes. Limnol. Oceanogr. Methods 8 (7), 363–375. doi:10.4319/lom.2010.8.363
Wik, M., Crill, P. M., Varner, R. K., and Bastviken, D. (2013). Multiyear Measurements of Ebullitive Methane Flux from Three Subarctic Lakes. J. Geophys. Res. Biogeosci. 118 (3), 1307–1321. doi:10.1002/jgrg.20103
Keywords: methane ebullition, atmospheric pressure, temperature, timescales, high-frequency sampling, water level, lakes
Citation: Zhao K, Tedford EW and Lawrence GA (2022) Ebullition Regulated by Pressure Variations in a Boreal Pit Lake. Front. Earth Sci. 10:850652. doi: 10.3389/feart.2022.850652
Received: 08 January 2022; Accepted: 16 May 2022;
Published: 01 June 2022.
Edited by:
Andreas Lorke, University of Koblenz and Landau, GermanyReviewed by:
Ingeborg Bussmann, Alfred Wegener Institute Helmholtz Centre for Polar and Marine Research, GermanyCopyright © 2022 Zhao, Tedford and Lawrence. This is an open-access article distributed under the terms of the Creative Commons Attribution License (CC BY). The use, distribution or reproduction in other forums is permitted, provided the original author(s) and the copyright owner(s) are credited and that the original publication in this journal is cited, in accordance with accepted academic practice. No use, distribution or reproduction is permitted which does not comply with these terms.
*Correspondence: Kai Zhao, emhhb2sxQHN0dWRlbnQudWJjLmNh
Disclaimer: All claims expressed in this article are solely those of the authors and do not necessarily represent those of their affiliated organizations, or those of the publisher, the editors and the reviewers. Any product that may be evaluated in this article or claim that may be made by its manufacturer is not guaranteed or endorsed by the publisher.
Research integrity at Frontiers

Learn more about the work of our research integrity team to safeguard the quality of each article we publish.