 Zhenyang Wang
 Xin Nie
 Chong Zhang1,2
- 1Cooperative Innovation Center of Unconventional Oil and Gas, Yangtze University (Ministry of Education & Hubei Province), Wuhan, China
- 2Key Laboratory of Exploration Technologies for Oil and Gas Resources (Yangtze University), Wuhan, China
- 3Institute of Mud Logging Technology and Engineering, Yangtze University, Jingzhou, China
- 4Golder Associates, Atlanta, GA, United States
Tight gas makes up a significant portion of the natural gas resources. There are tight gas reservoirs with great reserve and economic potential in the west Sichuan Basin, China. Due to the complex mineral component and heterogeneity of the thick tight sand formations, the reservoir parameters are challenging to evaluate from well logs using conventional methods, even the fundamental porosity. The mineral components must be considered. In this study, based on the analysis of different logging responses of varying lithologies, we introduced the complex reservoir analysis (CRA) method. CRA is always used in the carbonate reservoirs to calculate the different rock component volume fractions and can be used to classify the lithology and calculate the porosity simultaneously. By analyzing the component, a new equivalent component method (CRAE) is proposed based on the CRA method in this paper. In this method, the AC-CNL equation-calculated porosity is calibrated according to the core porosity data to set the rock components’ physical parameters. After calibration, the rock component fractions and porosity can be calculated accurately. Also, according to the relationship between the grain size and natural gamma-ray, a granularity median model was established. Six lithology types, including coarse-grained quartz sandstone and coarse-grained lithic sandstone, are distinguished, and the porosity is estimated in the study area. The identification results are compared with the mud logging data and other methods. It shows that this method is very well adequate in the tight sandstone gas reservoirs in the study area.
Introduction
Unconventional reservoirs have become the research hotspot (Gao et al., 2018; Cong et al., 2022). As an essential source of unconventional natural gas, the tight sandstone reservoirs have attracted extensive attention (Bai et al., 2013; He et al., 2020). These reservoirs in China have excellent resource potential and are characterized by low porosity, low permeability, and complex pore structure (Li et al., 2017). Stratigraphic lithology classification and identification are essential for evaluating fine modeling reservoir parameters (Li and Li, 2013; Alzubaidi et al., 2021). Accurate evaluation of reservoir properties such as lithology identification and porosity calculation is the basis of exploration and development, as well as the basis for calculation of reservoir parameters (Yuan et al., 2018; Zhou et al., 2018). Their accuracy is very important for predicting, exploring, and developing rich areas of oil and gas resources. However, typical characteristics such as complex lithology, low maturity of sandstone, strong diagenesis, and substantial heterogeneity bring difficulties and challenges to the accurate identification of the lithologic zone and become the main constraints for practical exploration of this type of reservoir (Pang et al., 2019; Xiong et al., 2020; Bai et al., 2021; Wei et al., 2021).
Previous research mainly focused on improving the identification accuracy of lithologic types by using logging curves by various methods (Tan et al., 2017; Liu et al., 2020). Traditional lithologic identification methods include debris logging, core logging, and cross plot (Zhao and Gao, 2003). Gupta et al. (2012) used natural gamma-ray logging, high-resolution resistivity logging, lithologic density logging, and other logging data cross-mapping techniques to evaluate the lithologic and physical property parameters of the reservoir profile from two wells of fractured basalt. Cheng et al. (2016) established the cross-plot method and logging curve calculation method to identify sandstone, siltstone, etc. Zhou et al. (2017) proposed a lithologic classification method based on thin sections, logging curves, and core physical property data. Das and Chatterjee (2018) identified gas sand, saltwater sand, carbonate rock, and shales by analyzing vertical and horizontal impedance diagrams. Khamees et al. (2021) used neutron-density cross plot, acoustic-density cross plot, M−N cross plot, etc. The results show that they are well applied in lithology identification of Jeribe formation in a field in northern Iraq. For the unique strata with strong heterogeneity and complex structure, the traditional lithology identification method is challenging to ensure identification accuracy (Sun et al., 2019).
With the re-emergence of deep learning in recent years, many machine learning methods have been applied to lithology identification using logging data. The combination of machine learning algorithm and lithological classification model mainly includes support vector machine (Sebtosheikh and Salehi, 2015), neural network (Han et al., 2018), and decision tree (Duan et al., 2016). Sebtosheikh et al. (2015) adopted the support vector machine (SVM) classification method to predict the lithology of a heterogeneous carbonate reservoir in Iran based on core analysis data. Zhao et al. (2017) proposed a multivariate membership function discriminant method, which regarded lithology identification as a linear model in the fuzzy domain and obtained target results by establishing a multivariate membership function. Wang et al. (2018) proposed a KNN clustering optimization method based on weighted cosine distance to fit the lithologic model better. Xiang et al. (2020) presented the application of deep learning to establish a deep trust network (DBN) based on logging data in lithology. However, the combination of machine learning methods with geological data is less, and the results may not conform to the general geological laws, resulting in unsatisfactory identification results. Also, most of these methods are limited to lithology identification and rarely combine with reservoir physical property data. Moreover, machine learning methods may be affected by drilling fluid (Chen et al., 2020).
Based on the geological data of the target interval, we classify the lithology of the reservoir by integrating the thin-section information, core analysis data, and well logging data in this paper. The lithology of these reservoirs is mainly coarse-, medium-, and fine-grained quartz sandstone and lithic sandstone. By analyzing the relationship between rock compositions, reservoir parameters, and logging response, we proposed a new method based on the complex reservoir analysis method (CRA) with equivalent components (CRAE). We used the acoustic transit time (AC) log and compensated neutron porosity log (CNL) to estimate formation porosity and set the parameters of the matrix components to make the results agree with the core data. Then, the fractions of the mineral components are calculated. Also, we used the natural gamma-ray log (GR) to calculate the granularity median. By combining the component fractions and granularity median, we can accurately identify the formation lithology of the Xu 2 Member tight gas reservoir in CX depression, West Sichuan Basin. The second part of this article gives the geological background. The third part introduces the data and methods of the study. The fourth and fifth present the application results and comparison and discuss the effect. Finally, conclusions are drawn in the sixth section.
Geological Settings
The West Sichuan Depression is located west in the Sichuan Basin, east to the Longmenshan orogenic belt, and northwest to the Yangtze block. It is a part of the western Sichuan foreland basin (Figure 1), and the area is about 3.1 × 10⁴ km2. It was formed during the transition from the marine cratonic basin to the continental basin in the Sichuan Basin in the Late Triassic. There is a set of the coal-bearing clastic rock group from bottom to top from marine facies to continental facies and dominated by continental facies. The thickness of this set of formations does not change much, with a slight decrease from west to east. CX depression is a part of the west Sichuan Depression. From bottom to top, it includes Xu 1, Xu 2, Xu 3, Xu 4, and Xu 5. The section of interest of this study is Xu 2.
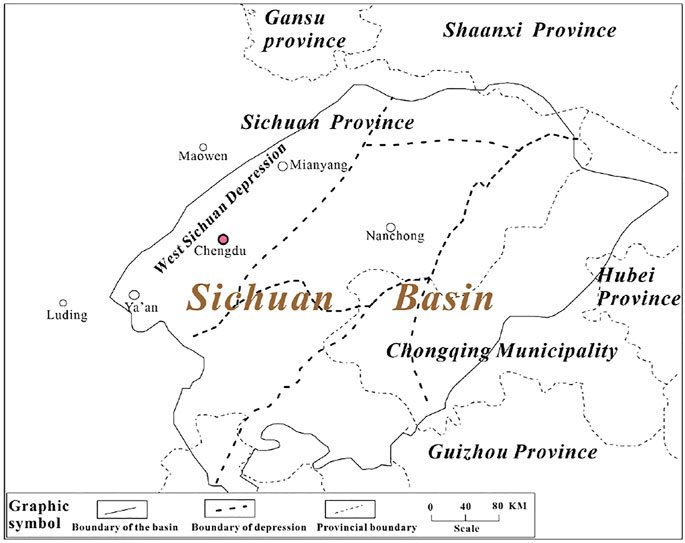
FIGURE 1. Location of the West Sichuan depression.
The Xu 2 member in the boreholes of the research area has a depth of 4,300–6,000 m and a thickness of about 400–500 m. It is dominated by gas-bearing lithic sandstone and lithic quartz sandstone. There are primarily argillaceous siltstone and black silty shale, interbedded with different thicknesses and with carbonaceous shale and coal lines. Detrital materials, mostly sedimentary and metamorphic debris with a small number of volcanic debris, are abundant. The reservoirs generally contain clay minerals and calcareous minerals such as calcite and dolomite. They are dense. The porosity distribution of the reservoir is shown in Figure 2, with an average porosity of 3.7% and a permeability of less than 0.1 micro-Darcy (mD). The reservoirs are affected by multiple structures, formation temperature, pressure, and cemented calcium and mud. The frontal sedimentary subfacies of the braided river delta are relatively developed. The porosity is low, and the lithology is complicated, making it challenging to identify the lithology and calculate the porosity accurately.
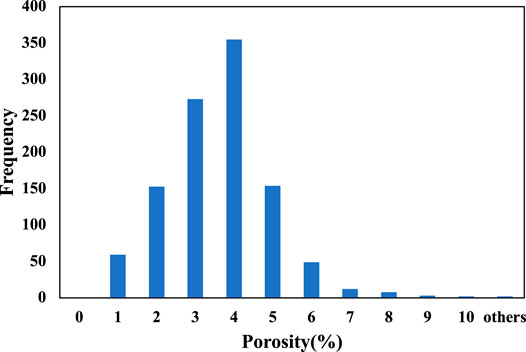
FIGURE 2. Porosity distribution histogram.
Methodology and Data
CRA Method
Usually, the CRA method is used to analyze the lithological composition of carbonate formations and allows porosity calculation. The interpreter can specify the number and attributes of the mineral components according to geological conditions, but to no more than four minerals. According to the cross-plot diagram of two porosity logs (Figure 3), C1, C2, C3, and C4 are the porosity log intersections of four minerals set according to the analysis requirements of stratigraphic components. The junction of the framework values of each two adjacent minerals can form a lithological triangle with the water point. According to their position on the intersection diagram, the triangles from top to bottom are called the first, second, and third triangles. If the data point falls into a particular triangle, it is considered a rock composed of the two minerals forming this triangle. The interpreter can set the minerals according to the formation component analysis results from the thin casting sections. Then, a combination of any two porosity logging response equations of AC, CNL, or density log (DEN) can be used for lithology analysis (Yong and Zhang, 2002). The calculation steps are as follows:
1) Calculation of shale content by using GR or SP. Generally, we choose GR to calculate the shale content. The equations are as follows (Nie et al., 2017):
where the SH is the original shale content;
2) The bulk model of the formations is Eqn. 3, and the log response equations are Eqn. 4–6:
where ∅ is the porosity;
3) The volume content of each mineral is calculated with these equations, and an optimum formation lithologic result is found which contains shale and one or two mineral components.

FIGURE 3. Triangle diagram of the CRA Method.
CRAE Parameter Analysis
There are quartz, feldspar, rock debris, and less mud content in the formations of the study area identified from the thin casting section data. Since the feldspar content in the XC area is basically below 10% and the physical properties are unstable, we choose to ignore it in the bulk model. We only consider quartz, the physical properties of which are stable, and a large number of metamorphic rocks and igneous rocks in the debris with low AC value are treated as an equivalent component. Also, because the DEN log is greatly affected by the borehole enlargement, we choose the AC-CNL cross plot to calculate the lithology profile. Therefore, the formations are considered to consist of shale, quartz, and rock debris, and GR, AC, and CNL logs are used. According to the abovementioned analysis, due to the limitation of research lithology types, the CRA method is not applicable in this study; we can simplify the CRA model and propose the CRAE model as follows:
We used the AC-CNL ensemble average value to calculate the porosity. Taking the triangle formed by quartz and rock debris as an example, reference for relevant equation derivation (Yong and Zhang, 2002), the calculation equation is as follows:
1) Calculation of triangle coefficients:
We make
It is solved as
where
2) Shale correction for porosity log data:
According to the following equation, the shale correction is performed on the porosity log.
where
3) Mineral volume content and porosity calculation:
According to Equations 16–18, the data points are solved with triangles, respectively, and the mineral volume and porosity of the layer where the data points are located.
Median Grain Size Model
The median grain size, namely, MD (∅50), refers to the abscissa value corresponding to the frequency of 50% on the cumulative frequency curve of the grain diameters. It represents the grain diameter size in the middle of the population and is always represented by the ∅-value size (Table 1). The median particle size can indicate the size of the grains in a clastic formation.
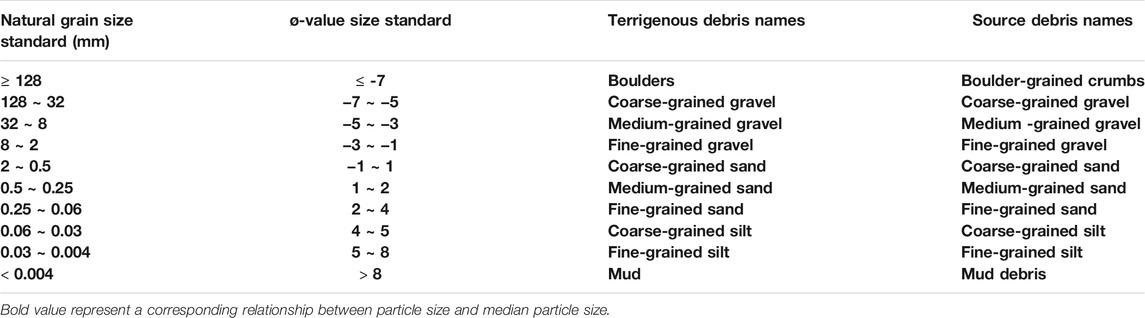
TABLE 1. Correspondence between median grain size and ∅-value size.
The natural gamma-ray is a reflection of radioactive materials, and its morphological changes are effected by the content of mud and other radioactive materials in the formation. The smaller the particle size, the stronger the adsorption performance for radioactive materials; from the perspective of the natural gamma baseline deviation from large to small, it can reflect the change in particle size from coarse to fine (Song et al., 2009). Therefore, the natural gamma-ray can reflect the relative instability of the shale content in the clastic rock formation and the change of the clastic grain size. From a geological point of view, the higher the rock mud content, the smaller the particle size. These two have a good corresponding relationship, and the natural gamma is less disturbed by other factors. Therefore, the continuous longitudinal characteristics of the ΔGR defined as Eqn. 22 can be used to predict the MD (Sima et al., 2017).
Data Collection
In this study, we collected the conventional well logging data, core casting thin-section analysis data, and ΔGR value of 184 samples of 46 wells. Most of these wells have lithological logs including the spontaneous potential (SP), GR, wellbore caliper (CAL), the dual lateral resistivity logs including deep resistivity (LLD) and shallow resistivity (LLS), and the porosity logs, including CNL, DEN, and AC. Also, the casting thin-section analysis data provide the volume content of the shale, quartz, rock debris, and feldspar.
Analysis of Logging Response Characteristics and Parameter Setting
Due to the known complexity of the rock components, we introduced the porosity log cross plots, which are used to determine the lithology in Figure 4. Figure 4A is the AC-CNL cross plot. It shows most of the logging data points are under the sandstone line, which means some components are with very low AC in the formations. Also, Figure 4B is the DEN-CNL cross plot. It also reveals that there are high-density components. Those components with relatively low AC and high DEN might be the volcanic or metamorphic debris, which have calcium minerals or other elements with high density and wave speed. Therefore, we introduced the CRA method to this study.
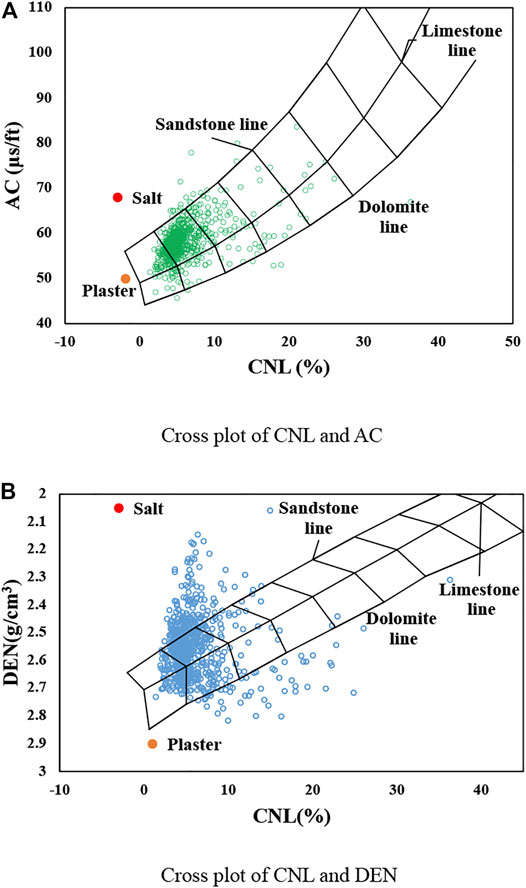
FIGURE 4. Cross plot of porosity log. (A) Cross plot of CNL and AC. (B) Cross plot of CNL and DEN.
The median particle size and ΔGR value of 184 samples were statistically analyzed, as shown in Figure 5. The result indicates that the MD and ΔGR are with an exponential relationship, shown as follows:
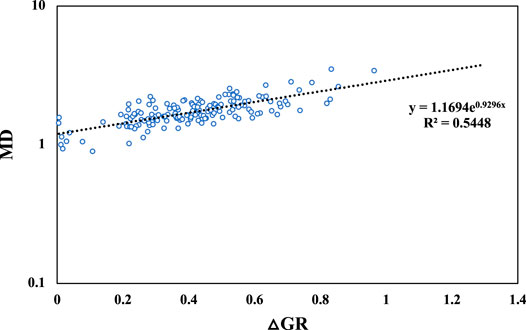
FIGURE 5. Cross plot of Δ GR and median grain size.
According to the abovementioned cross-plot analysis, we can conclude that the formations contain calcite, dolomite, and other calcareous minerals and siliceous materials. Meanwhile, in the well section with more rock debris, AC is lower, and CNL is higher than sandstone, indicating that the rock debris has lower AC and relatively high CNL. The AC of this debris is 43–49 μs/ft. Under the action of calcareous cementation, the AC is reduced.
The Xu2 member is dominated by tight sandstone. The AC is smaller than that of the more porous rocks. One reason for this is the heavy mineral components. In addition, the depth of burial also affects the response value of AC. As the depth increases, the overburden pressure on the rock layer increases, which changes the particle density, elastic modulus, and fluid density in the pores of the rock. More importantly, the porosity of the rock formation decreases regularly with the increase in the depth of the overlying rock layer, which increases the acoustic velocity of the rock formation. The AC of the same lithology formation decreases (Zhang et al., 2009).
We tried to find the best parameters for the CNL and AC of shale, quartz, and rock debris by calculating the formation’s porosity with different parameters and comparing it with the core analysis result. When the calculated porosity agrees well with the core data, the parameters are adequate. Different from the previous quartz parameter CNL and AC which are −2%, 55 μs/ft, we adjusted the quartz’s parameter to −2%, 50 μs/ft, and the rock debris was adjusted to 0% and 43 μs/ft for CNL and AC, respectively. At the same time, we set up the AC-CNL physical parameters required for the equations to calculate porosity and lithological components. The process of lithology identification and porosity estimation is shown in Figure 6.
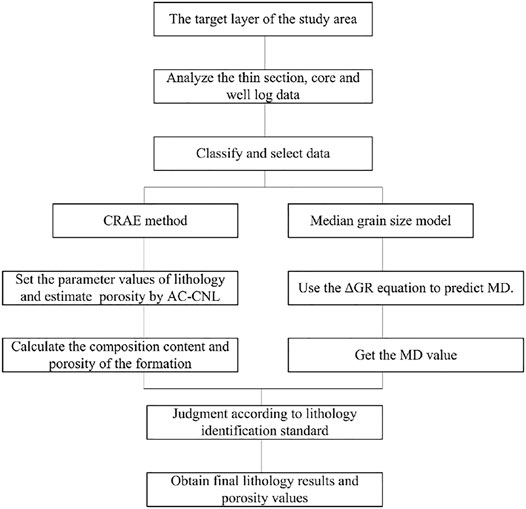
FIGURE 6. Flowchart of lithology identification and porosity estimation.
Application Results
According to the abovementioned analysis, applications were carried out in the study area. The application results in well 1 are shown in Figure 7. In Figure 7, the first three tracks are the original conventional logs, and the fourth track is the depth track. The fifth track is the lithological component profile we calculated by using the CRAE workflow. The sixth track is the lithological profile from mud logging. The right four tracks are the calculated porosity, quartz, rock debris, and so-called shale content. The black horizontal lines are the core analysis results. It can be seen that the porosity calculated by AC-CNL is consistent with the core porosity. Also, in the last three tracks, the component content of quartz, rock debris, and shale content calculated by the response equation is compared with the thin-section analysis results. It reveals that the calculated quartz content is in good agreement with the core thin-section data. The total volume fraction of the calculated shale content and rock debris is consistent with the rock debris from the core analysis result. Also, the computed shale content corresponds to the composition of sedimentary debris from the core thin-section data. This means there are tiny silty debris and clay minerals in the sedimentary debris, and this part contributes most of the GR radiation. The calculation and discrimination results confirm the correctness of the profile calculated.
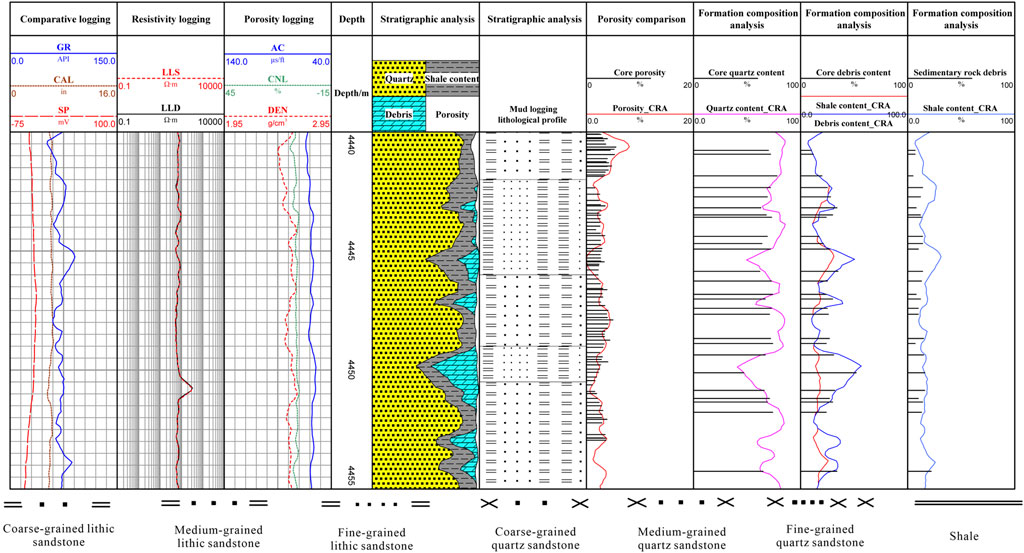
FIGURE 7. Comparison of the lithological profile and formation composition of 4,440–4,455 m in well 1.
According to the sandstone classification standard shown in Table 2, the geological survey and lithologic composition of the study area were classified. The final lithological classification result can be obtained after adding the MD calculation result into the lithology component profile. The MD was calculated by using the ΔGR model. A classification result is shown in Figure 8. The final classification results are compared with the Fisher discriminant and the mud logging results. The last four tracks in this figure are the mud logging, the Fisher discriminant and the calculated lithological profile, and the calculated MD. From the figure, we can see the lithological results of this well are consistent with the lithology in the mud logging profile and more refined. The correct rate is 89.96% of the calculated lithological profile by the CRAE method, and it is higher than the Fisher discriminant (it is 78.62%), which shows that this workflow has applicability in the study area.
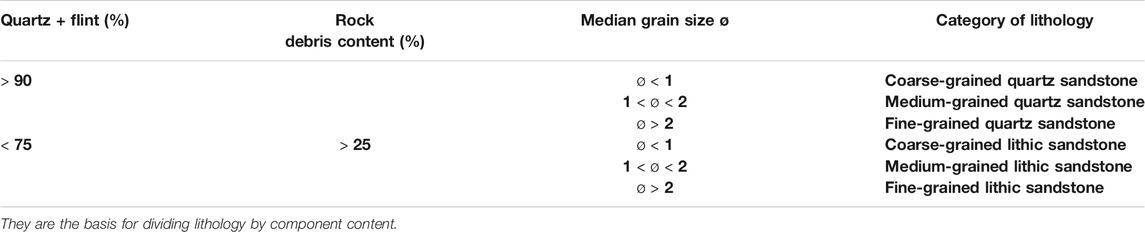
TABLE 2. Lithologic classification standard.
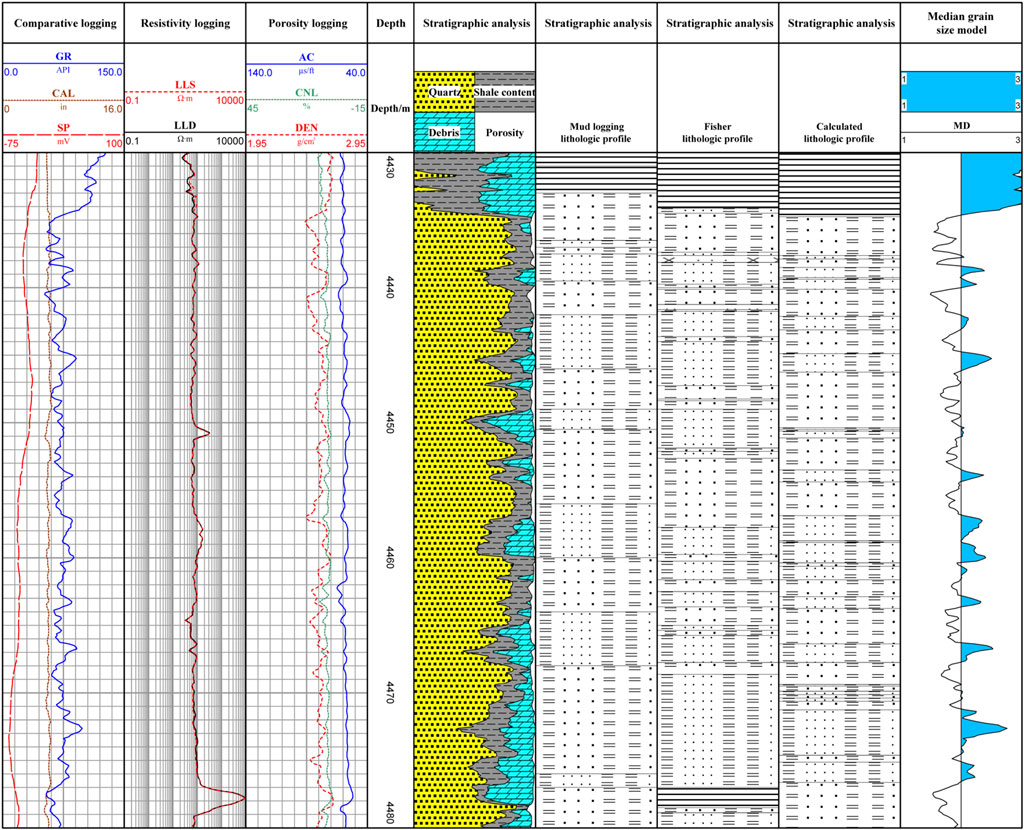
FIGURE 8. Comparison of mud logging, Fisher discriminant, and the calculated lithological profile of formation mineral composition at 4,430–4,480 m in well 1.
Discussions
The CRA method uses the GR or SP log to obtain the shale content and two other porosity logs to determine the mineral composition of the lithological composition. This method is aimed at carbonate rocks, in which the calcite and dolomite develop. As the minerals of calcite and dolomite have stable physical properties, including acoustic wave velocity and neutron porosity, the calculated mineral composition content is always accurate. However, the CRA method is rarely used in sandstone formations. One reason is that normally in the conventional sandstones, the lithology is simple; the other is the tight sandstones with complex mineral components. In this study area, we propose the CRAE method, in which we treat the tight gas reservoir rock as a mixture of quartz, debris, and pores, ignoring the relatively low volume fraction of the unstable mineral feldspar. The rock debris includes sedimentary, metamorphic, and igneous rocks. The sedimentary rocks can be calculated from the GR log for their radioactivity. Also, the metamorphic and igneous rock debris are combined and set a parameter. Meanwhile, the calculated shale contents in different formations have different meanings. The shale content calculated in the tight sandstone formation is a reflection of the sedimentary debris. Also, in shale and other formations, it represents the actual shale content in the formation.
In summary, this method is simple to select parameters. The accuracy meets production needs, and the workflow is easy to popularize. The determination of parameters is the most crucial step. When this workflow is used in a new study area, we should calibrate with core analysis data to select accurate parameters. In other words, when the lithological composition of the study area is different, the components can be replaced. The matrix parameter value of the lithology can be calculated according to the practical value of the study area and calibrated by core porosity.
Conclusion
The complex geological structure and lithological categories of tight sandstone gas reservoirs have posed challenges for logging lithological identification and porosity calculation. This article introduces a CRAE and MD calculation workflow to identify six different lithologies and estimate porosity. The conclusions are as follows:
1) The GR, CNL, and AC logs contain the lithological information and can be used to reveal the components of the formations.
2) Based on the component analysis, the rock bulk volume can be equivalent to three parts: quartz, rock debris, and porosity. The CNL and AC log parameters are selected and used in the CRAE method. The calculated profiles reveal the effeteness of the CRAE method. The agreement of the calculated shale content from GR and the sedimentary debris reveals the radioactive contributions are mainly from the sedimentary debris.
3) The GR log and the MD of the formation have a good relationship, and the ΔGR can be used to predict the MD after the statistical modeling. The rocks can then be divided into coarse, medium, and fine grained through their grain sizes.
4) The proposed lithology identification method and porosity estimation have achieved good application results, providing a new effective workflow for lithology identification in tight areas. Parameters should be recalibrated when used in a new study area.
Data Availability Statement
The raw data supporting the conclusions of this article will be made available by the authors, without undue reservation.
Author Contributions
ZW processed the data and wrote the first version of this manuscript. XN introduced the whole workflow and made revisions on the manuscript. CZ provided suggestions on the methodology. JZ provided the data and gave suggestions. LJ reviewed the language and revised the manuscript.
Funding
This study was financially supported by the Open Foundation of Cooperative Innovation Center of Unconventional Oil and Gas, Yangtze University (Ministry of Education and Hubei Province, No. UOG 2022-09), the National Natural Science Foundation of China (No. 41504094), and the Open Foundation of Top Disciplines in Yangtze University (No. 2019KFJJ0818009).
Conflict of Interest
Author LJ is employed by Golder Associates. The remaining authors declare that the research was conducted in the absence of any commercial or financial relationships that could be construed as a potential conflict of interest.
Publisher’s Note
All claims expressed in this article are solely those of the authors and do not necessarily represent those of their affiliated organizations, or those of the publisher, the editors, and the reviewers. Any product that may be evaluated in this article, or claim that may be made by its manufacturer, is not guaranteed or endorsed by the publisher.
References
Alzubaidi, F., Mostaghimi, P., Swietojanski, P., Clark, S. R., and Armstrong, R. T. (2021). Automated Lithology Classification from Drill Core Images Using Convolutional Neural Networks. J. Pet. Sci. Eng. 197, 107933. doi:10.1016/j.petrol.2020.107933
Bai, B., Zhu, R., Wu, S., Yang, W., Gelb, J., Gu, A., et al. (2013). Multi-scale Method of Nano(Micro)-CT Study on Microscopic Pore Structure of Tight sandstone of Yanchang Formation, Ordos Basin. Pet. Exploration Develop. 40, 354–358. doi:10.1016/S1876-3804(13)60042-7
Bai, X., Li, Z., Lai, F., Wang, L., and Wu, D. (2021). Method for Evaluation of Engineering Sweet Spots Tight sandstone Reservoir Production wells. Arab. J. Geosci. 14, 1–12. doi:10.1007/s12517-021-09216-3
Chen, G., Chen, M., Hong, G., Lu, Y., Zhou, B., and Gao, Y. (2020). A New Method of Lithology Classification Based on Convolutional Neural Network Algorithm by Utilizing Drilling String Vibration Data. Energies 13, 888. doi:10.3390/en13040888
Cheng, D., Yuan, X., Zhou, C., Tan, C., and Wang, M. (2016). Logging-lithology Identification Methods and Their Application: A Case Study on the Chang 7 Member in the central-western Ordos Basin, NW China. China Pet. Explor. 21, 117–126. doi:10.3969/j.issn.1672-7703.2016.05.0016
Cong, Z., Li, Y., Pan, Y., Liu, B., Shi, Y., Wei, J., et al. (2022). Study on CO2 Foam Fracturing Model and Fracture Propagation Simulation. Energy 238, 121778. doi:10.1016/j.energy.2021.121778
Das, B., and Chatterjee, R. (2018). Well Log Data Analysis for Lithology and Fluid Identification in Krishna-Godavari Basin, India. Arab. J. Geosci. 11, 231. doi:10.1007/s12517-018-3587-2
Duan, H., Deng, Z., Deng, F., and Wang, D. (2016). Assessment of Groundwater Potential Based on Multicriteria Decision Making Model and Decision Tree Algorithms. Math. Probl. Eng. 2016, 1–11. doi:10.1155/2016/2064575
Gao, L., Yang, Z., and Shi, Y. (2018). Experimental Study on Spontaneous Imbibition Chatacteristics of Tight Rocks. Adv. Geo-energy Res. 2, 292–304. doi:10.26804/ager.2018.03.07
Gupta, S. D., Chatterjee, R., and Farooqui, M. Y. (2012). Formation Evaluation of Fractured Basement, Cambay Basin, India. J. Geophys. Eng. 9, 162–175. doi:10.1088/1742-2132/9/2/162
Han, L., Fuqiang, L., Zheng, D., and Weixu, X. (2018). A Lithology Identification Method for continental Shale Oil Reservoir Based on Bp Neural Network. J. Geophys. Eng. 15, 895–908. doi:10.1088/1742-2140/aaa4db
He, M., Gu, H., and Wan, H. (2020). Log Interpretation for Lithology and Fluid Identification Using Deep Neural Network Combined with MAHAKIL in a Tight sandstone Reservoir. J. Pet. Sci. Eng. 194, 107498. doi:10.1016/j.petrol.2020.107498
Khamees, L. A., Alhaleem, A. A., and Alrazzaq, A. (2021). Different Methods for Lithology and Mineralogy Recognition. Mater. Today Proc. 5. [In press]. doi:10.1016/j.matpr.2021.04.531
Li, X., and Li, H. (2013). A New Method of Identification of Complex Lithologies and Reservoirs: Task-Driven Data Mining. J. Pet. Sci. Eng. 109, 241–249. doi:10.1016/j.petrol.2013.08.049
Li, Y., Jia, D., Rui, Z., Peng, J., Fu, C., and Zhang, J. (2017). Evaluation Method of Rock Brittleness Based on Statistical Constitutive Relations for Rock Damage. J. Pet. Sci. Eng. 153, 123–132. doi:10.1016/j.petrol.2017.03.041
Liu, Y., Xian, C., Li, Z., Wang, J., and Ren, F. (2020). A New Classification System of Lithic-Rich Tight sandstone and its Application to Diagnosis High-Quality Reservoirs. Adv. Geo-energy Res. 4, 286–295. doi:10.46690/ager.2020.03.06
Nie, X., Wan, Y., and Bie, F. (2017). Dual-shale-content Method for Total Organic Carbon Content Evaluation from Wireline Logs in Organic Shale. Open Geosci. 9, 133–137. doi:10.1515/geo-2017-0011
Pang, M., Ba, J., Carcione, J. M., Picotti, S., Zhou, J., and Jiang, R. (2019). Estimation of Porosity and Fluid Saturation in Carbonates from Rock-Physics Templates Based on Seismic Q. Geophysics 84, M25–M36. doi:10.1190/GEO2019-0031.1.–M36
Sebtosheikh, M. A., Motafakkerfard, R., Riahi, M. A., Moradi, S., and Sabety, N. (2015). Support Vector Machine Method, a New Technique for Lithology Prediction in an Iranian Heterogeneous Carbonate Reservoir Using Petrophysical Well Logs. Carbonates Evaporites 30, 59–68. doi:10.1007/s13146-014-0199-0
Sebtosheikh, M. A., and Salehi, A. (2015). Lithology Prediction by Support Vector Classifiers Using Inverted Seismic Attributes Data and Petrophysical Logs as a New Approach and Investigation of Training Data Set Size Effect on its Performance in a Heterogeneous Carbonate Reservoir. J. Pet. Sci. Eng. 134, 143–149. doi:10.1016/j.petrol.2015.08.001
Sima, L., Wang, C., Wu, F., Wang, L., Ma, L., and Wang, Z. (2017). Calculation of Moblie Water Saturation in Tight sandstone Reservoirs of Penglaizhen Formation, Western Sichuan Basin. Well Logging Technol. 40, 199–204. doi:10.16489/j.issrL.1004-1338.2017.02.01
Song, Z., Li, W., Tang, C., Li, W., Pang, Z., and Wang, Y. (2009). Dividing Sedimentary Facies and Reservoir Distributions by Using Natural Potential and Natural Gamma ray Logging Curves. Prog. Geophys. 24, 651–656. doi:10.3969/j.issn.1004-2903.2009.02.038
Sun, J., Li, Q., Chen, M., Ren, L., Huang, G., Li, C., et al. (2019). Optimization of Models for a Rapid Identification of Lithology while Drilling - A Win-Win Strategy Based on Machine Learning. J. Pet. Sci. Eng. 176, 321–341. doi:10.1016/j.petrol.2019.01.006
Tan, Z., Wang, W., Li, W., Lu, S., and He, T. (2017). Controlling Factors and Physical Property Cutoffs of the Tight Reservoir in the Liuhe basin. Adv. Geo-energy Res. 1, 190–202. doi:10.26804/ager.2017.03.06
Wang, X., Yang, S., Zhao, Y., and Wang, Y. (2018). Lithology Identification Using an Optimized KNN Clustering Method Based on Entropy-Weighed Cosine Distance in Mesozoic Strata of Gaoqing Field, Jiyang Depression. J. Pet. Sci. Eng. 166, 157–174. doi:10.1016/j.petrol.2018.03.034
Wei, Y., Ba, J., Carcione, J. M., Fu, L.-Y., Pang, M., and Qi, H. (2021). Temperature, Differential Pressure, and Porosity Inversion for Ultradeep Carbonate Reservoirs Based on 3D Rock-Physics Templates. Geophysics 86, M77–M89. doi:10.1190/GEO2020-0550.1
Xiong, F., Sun, W., Ba, J., and Carcione, J. M. (2020). Effects of Fluid Rheology and Pore Connectivity on Rock Permeability Based on a Network Model. J. Geophys. Res. Solid Earth 125 (3), e2019JB018857. doi:10.1029/2019JB018857
Xiang, M., Qin, P., and Zhang, F. (2020). Research and Application of Logging Lithology Identification for Igneous Reservoirs Based on Deep Learning. J. Appl. Geophys. 173, 103929. doi:10.1016/j.jappgeo.2019.103929
Yong, S., and Zhang, C. (2002). Logging Date Processing and Comprehensive Interpretation. Dongying: China University of Petroleum Press.
Yuan, C., Ma, M., Zhou, C., Feng, Z., and Shi, Y. (2018). An Improved Method to Evaluate Porosity with the Combination of Formation Elemental Logging and Density. Well Logging Technol. 42, 145–148. doi:10.16489/j.issn.1004-1338.2018.02.004
Zhang, C., Jiang, W., and Pan, H. (2009). Acoustic Logging Principle and Application. Beijing: Petroleum Industry Press.
Zhao, J., and Gao, F. (2003). Application of Crossplots Based on Well Log Data in Identifying Volcanic Lithology. Glob. Geol. 22, 136–140. doi:10.1016/S0955-2219(02)00073-0
Zhao, J., Wang, F., and Lu, Y. (2017). Application of Multivariate Membership Function Discrimination Method for Lithology Identification. Jsm 46, 2223–2229. doi:10.17576/jsm-2017-4611-24
Zhou, X., Zhang, Z., Zhang, C., Nie, X., Zhang, C., and Zhu, L. (2017). A New Lithologic Classification Method for Tight sandstone Reservoirs Based on Rock Components and Logging Response Characteristics. J. Geophys. Eng. 14, 1599–1607. doi:10.1088/1742-2140/aa8eb5
Keywords: tight gas, lithology identification, well logging, complex reservoir analysis, MD model
Citation: Wang Z, Nie X, Zhang C, Wang M, Zhao J and Jin L (2022) Lithology Classification and Porosity Estimation of Tight Gas Reservoirs With Well Logs Based on an Equivalent Multi-Component Model. Front. Earth Sci. 10:850023. doi: 10.3389/feart.2022.850023
Received: 07 January 2022; Accepted: 04 March 2022;
Published: 29 March 2022.
Edited by:
Yuwei Li, Liaoning University, ChinaCopyright © 2022 Wang, Nie, Zhang, Wang, Zhao and Jin. This is an open-access article distributed under the terms of the Creative Commons Attribution License (CC BY). The use, distribution or reproduction in other forums is permitted, provided the original author(s) and the copyright owner(s) are credited and that the original publication in this journal is cited, in accordance with accepted academic practice. No use, distribution or reproduction is permitted which does not comply with these terms.
*Correspondence: Xin Nie, bmlleGluX2N1Z2JAMTI2LmNvbQ==