 Yu Lei
 Liguo Jiao
 Jiyao Tu1
94% of researchers rate our articles as excellent or good
Learn more about the work of our research integrity team to safeguard the quality of each article we publish.
Find out more
ORIGINAL RESEARCH article
Front. Earth Sci., 04 March 2022
Sec. Solid Earth Geophysics
Volume 10 - 2022 | https://doi.org/10.3389/feart.2022.848824
This article is part of the Research TopicContinental Basin and Orogenic Processes: Deep Structure, Tectonic Deformation, and DynamicsView all 24 articles
The formation of magnetic minerals is bound up with the tectonic evolution history, whereupon the distribution of magnetic anomalies has great meanings for regional tectonics. In this study, we use the latest global lithospheric magnetic field model EMAG2-v3, processed by various techniques including reduction to the pole (RTP), upward continuation, derivations, Euler deconvolution, estimation of total magnetization direction, and Curie point depth (CPD), to unveil the tectonics around Longmenshan fault zone (LFZ). LFZ is clearly displayed as a positive and negative anomaly transition zone in RTP anomalies and acts as a magnetic basement boundary. The Sichuan Basin (SB), located to the east of LFZ, is marked by strong magnetic basement and NE-strike banded induced positive anomalies which are associated with the Neoproterozoic magmatic activity. The banded shape, absence of radial pattern of anomalies, and existence of fossil subduction zone supports that the magnetic basement was formed in arc environment. The CPD in SB estimated by radial average power spectral is 30–51 km, which allows magnetic minerals in deep crust or even in lithospheric mantle to exhibit high magnetizations. The Songpan-Ganzi fold belt (SGFB), in contrast, is located to the west of LFZ and covered by thick and low-susceptibility Triassic deposits of flysch, manifests as weak negative anomalies caused by relatively shallow CPD and widespread remanent magnetization. Significant positive anomalies, appearing around the Manai and Rilonguan granitic massifs, indicate a strong magnetic basement beneath SGFB, which is conjectured as westward extension of the Yangtze Block at depth.
The Longmenshan Fault Zone (LFZ) is one of the most active seismogenic zones in Mainland China, originated from the stress transfer of collision between the Indian and Eurasian plate. The Tibetan Plateau moves eastward and encounters the stable Yangtze Block (YB) at LFZ, resulting in steep topographic relief and strong tectonic activities including the 2008 Ms8.0 Wenchuan earthquake, the 2013 Ms7.0 Lushan earthquake, and a series of imbrication-like thrust structures (Figure 1) (Deng et al., 1994; Zhang et al., 2008a; Zhang, 2013).
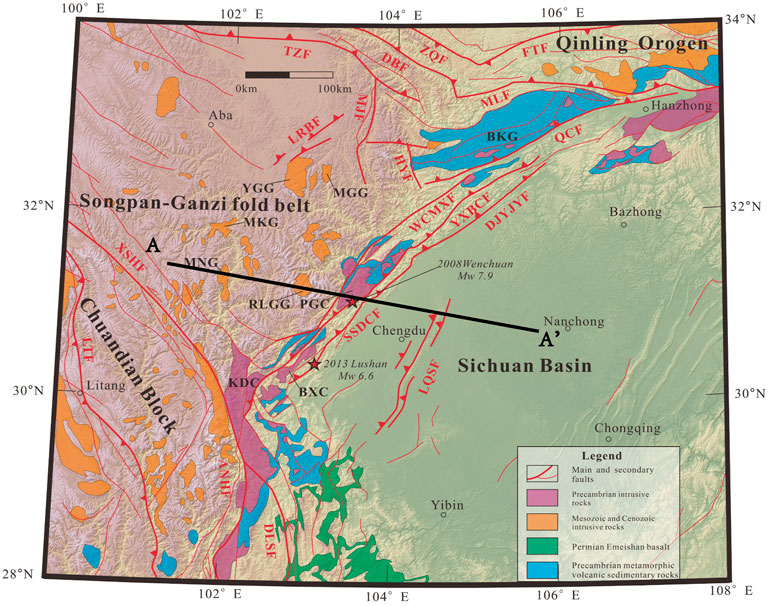
FIGURE 1. Geological sketch around LFZ. The main and secondary faults are drawn by thick and thin black lines, respectively. Types of rock outcrops are given in the legend. The two stars show the location of the 2008 Ms8.0 Wenchuan and the 2013 Ms7.0 Lushan earthquake in the LFZ. The black solid line AA′ marks the profile shown in Figure 10. Abbreviations are as follows: TZF, Tazang Fault; DBF, Diebu Fault; ZQF, Zhouqu Fault; MLF, Mianlue Fault; FTF, Fengtai Fault; LRBF, Longriba Fault; MJF, Mingjiang Fault; HYF, Huya Fault; QCF, Qingchuan Fault; WCMXF, Wenchuan-Maoxian Fault; YXBCF, Yingxiu-Beichuan Fault; DJYJYF, Dujiangyan-Jiangyou Fault; XSHF, Xianshuihe Fault; SSDCF, Suangshi-Dachuan Fault; LQSF, Longquanshan Fault; LTF, Litang Fault; ANHF, Anninghe Fault; DLSF, Daliangshan Fault; BKG, Bikou Group; PGC, Pengguan Complex; BXC, Baoxing Complex; KDC, Kangding Complex; YGG, Yanggon Granite; MGG, Maoergai Granite; MKG, Markam Granite; MNG, Manai Granite; RLGG: Rilongguan Granite. The geological base map is modified from Ren et al. (2013). The faults and granites are named according to Zhang et al. (2008c), Bai et al. (2018), Roger et al. (2004) and Zhang et al. (2006).
The LFZ is a variation zone of many geophysical parameters. For the crustal thickness (TC), Liu et al. (2009) showed that the TC of the Songpan-Ganzi fold belt (SGFB) is 50–58 km, and that of Sichuan Basin (SB) is 46–52 km. Investigation of wide-angle reflection/refraction seismic profiles suggests that the Moho is 43 km beneath SB and up to 62 km beneath SGFB (Chun-Yong Wang et al., 2015a). Seismological studies showed low P and S wave velocities in the upper crust and high velocity anomalies in the middle-lower crust of SB, and high Poisson’s ratio anomalies in the upper-middle and low anomalies in the middle-lower crust, indicating a Precambrian crystalline basement overlain by thick Proterozoic sedimentary rocks and Triassic to Cretaceous sediments (Wang et al., 2010; Wang et al., 2015b; 2017a; Hu and Wang, 2018). By contrast, the SGFB on the west side of LFZ exhibits high velocities in the upper crust but low velocities in the mid-lower crust, which is considered as mid-lower crustal flow channel and is in agreement with low resistivity in magnetotelluric studies (Bai et al., 2010; Wang et al., 2010; Wang et al., 2015b, 2017a; Wang et al., 2018a). Due to the uplift of the Moho, SB has relatively high gravity anomalies, and SGFB show strong negative anomalies surrounded by the gravity gradient belt, suggesting that a density contrast exists cross LFZ (Zhang et al., 2009; Zhang et al., 2010; Zhao et al., 2020).
Due to the thick Triassic flysch in SGFB and Mesozoic sediments in SB, the properties of the basement on both sides of LFZ are hard to determine. Crustal magnetic anomalies are generated by ferromagnetic minerals at temperatures below the Curie point (Thébault et al., 2010), and in general, with the increase of mafic minerals, the magnetism of the igneous rock becomes stronger (Liu et al., 2014; Xiong et al., 2016a), and the magnetic anomaly is thus a practical tool to reveal magnetic sources at depth, and has been widely used to identify buried igneous rocks, dykes, faults and resource exploration (Lou et al., 2008; Khalil, 2016; Zhang et al., 2019). Magnetic anomalies are also used to detect the fluctuation of crystalline basement due to the significant magnetic contrast between sedimentary cover (weak magnetization) and magnetic basement (strong magnetization). Previous studies have shown that the main part of LFZ is covered by negative aeromagnetic anomalies with a NE-SW trend, which is considered to be caused by the reversely magnetized basic rocks with a magnetic inclination of −20° in the crust or compression-induced reversal strata (Zhang et al., 2010). There are significant banded positive anomalies in SB, which is usually interpreted by the existence of a strong magnetic basement (Zhang et al., 2013; Yan et al., 2016). The Precambrian basement with strong magnetism in SB is buried at depths of 8–23 km, and is overlain by a sedimentary metamorphic crystalline basement with weak magnetism (Pan et al., 2020). This strong magnetic basement is conjectured to be generated by craton-scale Neoproterozoic magmatic events rather than Neoarchean crystalline basement (Wang et al., 2020; Xiong et al., 2020). The SGFB shows as an isolated negative magnetic anomaly (Gao et al., 2021). Guo et al. (2014a) analyzed the reduction to the pole (RTP) anomaly and concluded that the anomalies along LFZ and SB have similar features and thus are generated by the same magnetic basement. The strong positive anomalies in SB and the negative anomalies in LFZ, northwestern Sichuan and western Yunnan, was interpreted as the materials beneath the Tibetan Plateau moving eastward and then escaping in northeast and southeast direction after being blocked by SB at LFZ (Bai et al., 2014; Gao et al., 2015).
Despite the large amount of research on magnetic anomalies, there remains some controversy in their tectonic implications. Recent research based on deep seismic reflection and adakitic rocks indicate that the western margin of YB is irregular and its crust may extend to the Longriba fault which is ∼200 km west to LFZ (Guo et al., 2014a; Guo et al., 2014b). Wang et al. (2018a) found a clear low-resistivity abnormal zone existing in the eastern Tibetan Plateau and proposed that it is the western border of YB. Xiong et al. (2020) built a 2D magnetic forward model and concluded that the basement extends to only 33 km west of the Wenchuan-Maoxian fault and decreases to about 17–19 km under the south segment. In addition, to study the geothermal states in this area, the Curie point depth (CPD) has been estimated by many researchers. Zhang et al. (1996) showed that the CPD in SB is 20–28 km, but calculated a deeper CPD of 36–50 km. Gao et al. (2015) suggested that the CPD range from 24–34 km in Southeast Tibet and the faults correspond to the area with shallow CPD. Xiong et al. (2016b) inverted the distribution of CPD in mainland China and concluded that it is 30–40 km in SB and 36–44 km in SGFB. Wang et al. (2018b) showed varied CPD along LFZ and that the south segment is shallow while the north segment is deep, and earthquakes tend to occur in areas with deep CPD and low surface heat flow. Although they all present relatively deep CPD in SB, the estimation of CPD among different studies show varied range. Different distribution patterns of CPD directly effect the role of LFZ in geological tectonics, and thus should be researched. Current studies (e.g. Wang et al., 2020; Xiong et al., 2020) concluded that the basement is generated by Neoproterozoic magmatic activities according to the anomaly distribution and outcrops, which need more magnetic evidences. Meanwhile, the fluctuation of CPD may confuse the results and should be analyzed. Magnetic anomaly patterns are closely related not only to the present distribution of magnetic minerals, but also to the ancient magmatic activities as was shown in Xu et al. (2020). Therefore, the interpretation of magnetic anomalies around LFZ involves the information of tectonic evolution history and is rarely discussed in previous studies.
In this study, to further determine the current characteristics and tectonic origin of magnetic basement in the eastern margin of Tibetan Plateau from the geomagnetic point of view, we analyze the magnetic anomalies around LFZ by RTP, upward continuation, derivations, and Euler deconvolution. Furthermore, we estimate the CPD, and establish a forward model based on CPD and total magnetization direction to learn more about the deep magnetic structures.
The area for this study is located at the eastern margin of Tibet Plateau, containing SGFB in the west, and SB in the east. SB is part of YB which is located on the west of South China Block. The boundary between SGFB and YB is LFZ, composed of three main faults, from west to east: the Wenchuan-Maoxian fault, the Yingxiu-Beichuan fault, and the Shuangshi-Dachuan fault (Figure 1). The southern segment of LFZ is connected to the Xianshuihe fault, which is the northeastern boundary of the Sichuan-Yunnan rhombic block. The South China Block was formed through the amalgamation of YB and Cathaysia Block (CB) during the ca. 1.1–0.9 Ga (Li et al., 2002; Wang et al., 2009) or was not completed until 830–810 Ma (Zhou et al., 2002a; Cawood et al., 2018). There is no obvious GPS velocity gradient inside YB, indicating that it is a stable and rigid Precambrian craton (Zhang, 2013). Along its western and northern margins, abundant Neoproterozoic mafic-ultramafic metamorphic complexes, such as Kangding, Pengguan and Baoxing complexes outcropped. Two end-member models have been proposed for the generation of the magmatic activities during the Neoproterozoic: 1) the break-up of Rodinia along the rifts between YB and CB related to the mantle plume activity during 830–740 Ma (Li et al., 1999; Li et al., 2003; Li et al., 2008a; Li et al., 2008b); and 2) subduction-related arc magmatism (Zhou et al., 2002a, b; Zhou et al., 2006a, b; Cawood et al., 2013). The Proterozoic basement of the craton is dated at 0.8–1 Ga by U/Pb on zircons, overlain by Sinian sedimentary rocks and the thick Paleozoic cover is unconformably overlain on the Sinian sediments (Roger et al., 2004).
The SGFB is located on the west of LFZ, formed during the Indosinian (Late Triassic) (Roger et al., 2004; Roger et al., 2008). During the tectonic epoch, the convergence between the North China, South China and Qiangtang block closed the Paleo-Tethys ocean and the Songpan-Ganzi basin, and the sedimentary rocks derived from denudation of the orogenic belt between the North and South China blocks were filled in the Songpan-Ganzi basin, and then formed the folded Triassic flysch with thickness of 5–15 km under intense compression (Nie et al., 1994; Roger et al., 2004; Roger et al., 2008). Within SGFB, the Neoproterozoic basement crops out only in the Danba area, and some Mesozoic syn-tectonic and post-tectonic granitoids such as Rilonguan, Markam, Manai, Yanggon and Maoergai granitoids intruded the upper crust. Geochemical studies suggest that they have different magmatic sources (Roger et al., 2004; Zhang et al., 2006). After a tectonic quiescence during the Jurassic and Cretaceous, the India-Asia collision in the east Tibet reworks the Triassic fold belt and forms the steep topography between 4,000 m in the plateau and 500 m in SB (Roger et al., 2010).
The magnetization of rocks in the study area varies greatly and can be divided into several grades. The susceptibility of most sedimentary rocks in SB is below
In this section, we utilize several methods to process the magnetic data including RTP, first vertical derivative (FVD), analytical signal amplitude (ASA), upward continuation (UC), Euler deconvolution (ED), estimation of CPD and determination of total magnetization direction (TMD). The aim is to study the distribution patterns and their generation mechanism. To show the procedure more intuitively, we draw a flow chart in Figure 2. RTP, FVD, ASA and UC are used to locate the magnetic complexes, including their position and depth. RTP, UC and ED are used to outline the magnetic boundary of different blocks. CPD and TMD are used to determine the lower magnetic boundary and magnetization direction. The above means are used to build the magnetic structure model.
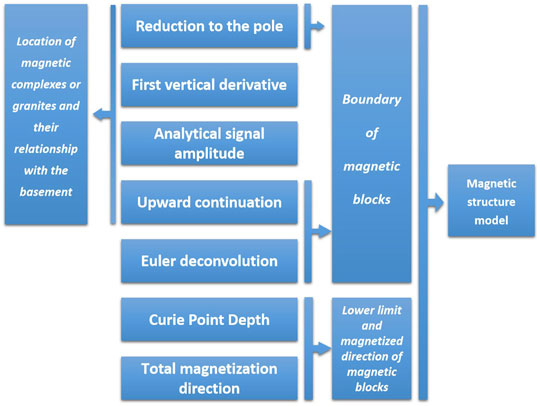
FIGURE 2. Flow chart for the magnetic anomaly analysis.
The magnetic anomaly we use here is the Earth Magnetic Anomaly Grid EMAG2-v3, which provides the ∆T anomalies of 4 km above the geoid and was compiled from satellite, marine, and aeromagnetic survey data, with a resolution of two arc-minutes. Figure 3 shows the ∆T distribution of the EMAG2v3 map around LFZ. As can be seen, the anomalies have, in general, a NE-SW trend which is subparallel to the strike of LFZ. The middle and northern segment of LFZ is located in a significant negative anomaly region with amplitudes of about −170∼−70 nT. A strong negative anomaly lies between the Wenchuan-Maoxian fault and the Yingxiu-Beichuan fault known as the Pengguan complex. This negative anomaly was previously attributed to the reverse magnetization with a magnetic inclination of −20° due to reverse strata after intense compression or remanent magnetization (Zhang et al., 2010). The southern segment of LFZ connects to the Xianshuihe fault, which delineates the boundary between the positive anomaly (40–100 nT) in the east and the weak negative anomaly (−20∼-5 nT) in the west. SB is characterized by a broad high positive anomaly in the range of 50–350 nT, which is presumed to be generated by the Precambrian crystalline basement due to its high susceptibility (Wang et al., 2020). Most Precambrian shields, cratons, and platforms exhibit positive anomalies globally (Frey, 1982), and are supposed to have a similar origin (Arkani-Hamed and Strangway, 1985). The northern SB has a strong negative anomaly of −240∼−100 nT that extends to LFZ. The anomaly in SGFB is weaker (−100–3 nT) compared to that of SB.
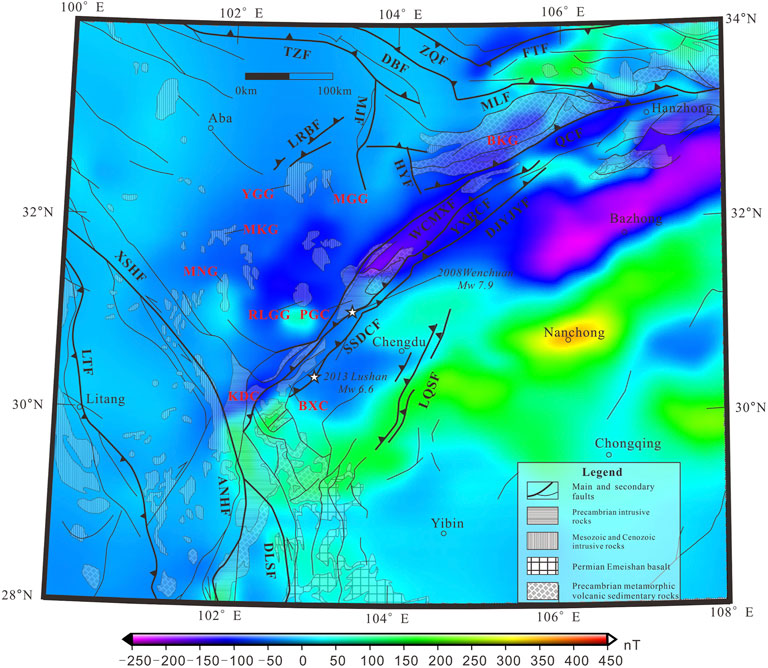
FIGURE 3. Magnetic anomaly (EMAG2-v3) in Longmenshan region at altitude of 4 km with resolution of two arc-minutes. The geological base map is the same as Figure 1.
In order to align the magnetic anomaly with the source, RTP is routinely used to convert oblique magnetization to vertical magnetization. The latitude of the study area spans six degrees, thus a differential RTP (DRTP) scheme (Blakely, 1995; Arkani-Hamed, 1988, 2007) is adopted here and the result is shown in Figure 4. As can be seen, the anomalies have a tendency to move northward after RTP, which is consistent with previous results (Wang et al., 2020). The RTP map shows better correspondence with the geological structure (compared to Figure 3). LFZ divides the anomalies into western negative and eastern positive parts, revealing the obvious contrast of magnetic properties of the basement across the faults. Exception occurs at the south segment of LFZ, where significant negative anomalies (−11∼−5 nT) appear between the 2008 Wenchuan and 2013 Lushan earthquakes corresponding to the seismic gap. SB shows significant NE-SW banded positive anomalies ranging from 130 nT to 420 nT, extending northwestward to the Pengguan complex along LFZ and southwestward to the Kangding complex, indicating that the magnetic properties in the basement of the Pengguan, Baoxing and Kangding complex are similar, and may have common origins (Guo et al., 2014a). The positive anomalies above the Pengguan and Kangding Precambrian metamorphic complexes are consistent with their high susceptibility (Xiong et al., 2015; Xiong et al., 2020). After the RTP procedure, most of the original negative anomalies caused by oblique magnetization in the northern SB diminish and change to positive anomalies with only a negative band left. Hence, the broad positive anomalies in SB should be dominated by induced magnetization, consistent with an inverted result (Wang et al., 2020). Although SGFB generally shows weak negative anomalies, some Mesozoic and Cenozoic intrusive rocks correspond to small positive RTP anomalies, such as the Manai (up to 74 nT) and the Rilonguan granites (up to 170 nT) (Roger et al., 2004; Guo et al., 2014a).
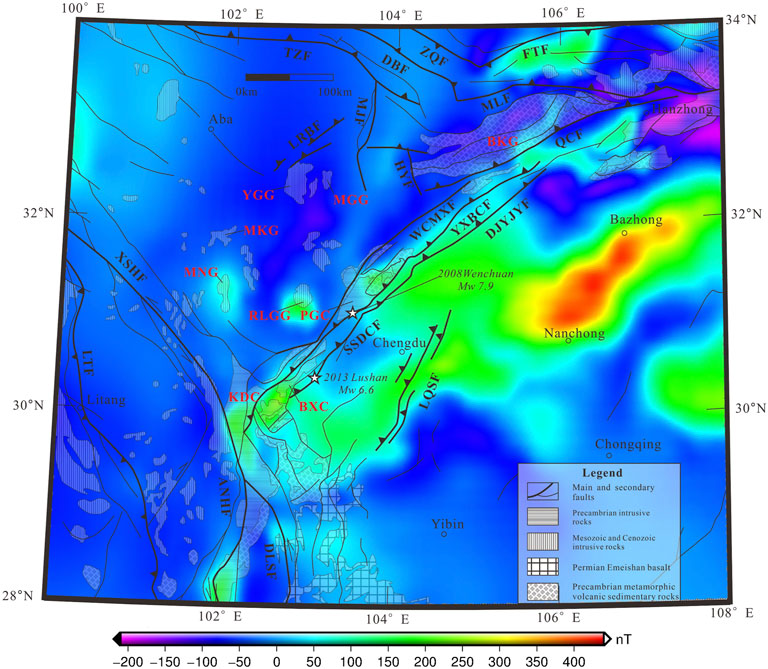
FIGURE 4. The RTP magnetic anomaly calculated from Figure 3.
The first vertical derivative (FVD) is used to identify the boundary of shallow magnetic source. It is positive above the source, zero around the edge and negative outside the source (Bhattacharyya, 1965; Hood and McClure, 1965; Hugh and Vijay, 1994). Figure 5A shows FVD of the RTP anomalies. As can be seen, the short-wavelength anomalies are more obvious. Many faults such as FTF, MLF, QCF, WCMXF are distributed along obvious negative FVD belts and roughly parallel to the zero-lines. High gradients can be found along the Xianshuihe-Anninghe fault and the middle and southern segments of LFZ, coinciding with the Precambrian intrusions such as Kangding and Pengguan complexes. The zero-lines delineate their boundaries more clearly. Mesozoic Rilonguan granites also show high FVD. These indicate that the complexes and the granites are strongly magnetized. The FVD in the northwestern margin of SB has a complex pattern and faults there cut the magnetic block into smaller pieces.
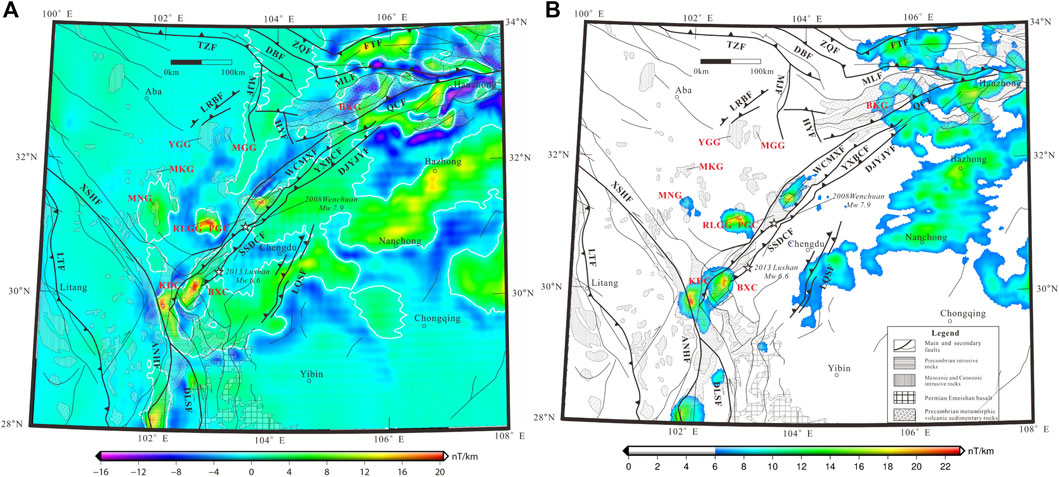
FIGURE 5. (A) The first vertical derivation map of the RTP anomalies. (B) The analytical signal amplitude of the RTP anomalies. Solid white lines mark the zero-values.
Analytical signal amplitude (ASA) is defined as the square root of the squared sum of the vertical and horizontal derivatives of the anomalies, whose max values are used to determine the outlines of sources (Nabighian, 1984; Roest et al., 1992). Figure 5B shows the ASA map of RTP anomalies. To highlight the potential magnetic sources, only ASA values larger than 6 nT/km are plotted. As we can see, the ASA map is similar to the FVD map, confirming the existence of strong magnetized sources in Precambrian Kangding, Pengguan complexes and Mesozoic Manai, Rilonguan granites.
The UC is used to eliminate the effects of noise and anomalies generated by shallow and small-scale magnetic sources. In the UC map of Figure 6, the overall anomaly becomes smaller and smoother with increasing of altitude. The SB shows similar positive anomalies at different altitudes (Figure 6), which confirms that a deep magnetic crystalline basement spreads westward to LFZ. The small-scale anomalies originally distributed over the Pengguan and Kangding complexes are gradually incorporated into the surrounding large-scale anomalies, indicating that Pengguan and Kangding complexes connect with the Precambrian basement of SB at depth. The similar amplitude of RTP anomalies (Figure 4) and strong magnetism between the complexes and SB basement suggest that they were formed in the same situation.
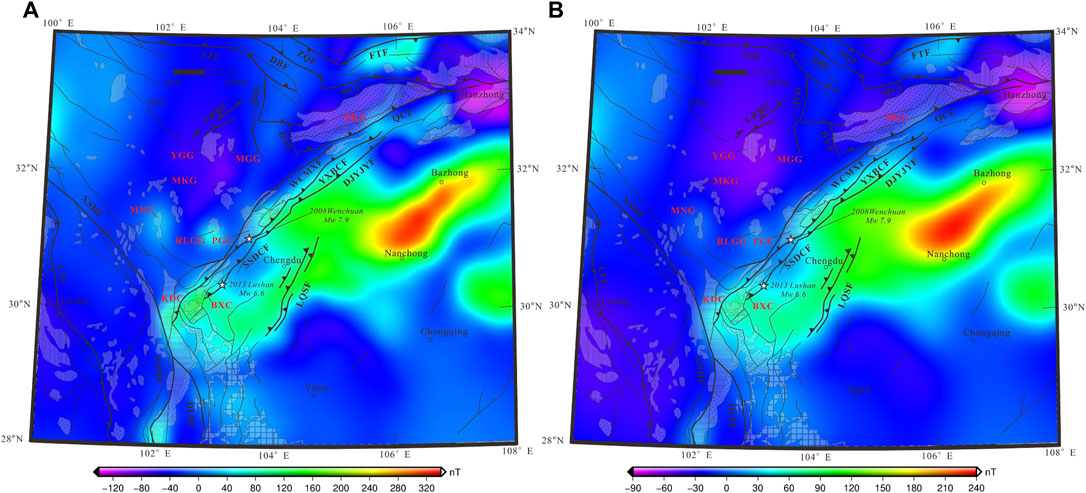
FIGURE 6. Upward continuation of the magnetic anomaly at (A) 10 km; (B) 25 km calculated from RTP anomalies (Figure 4).
To quantitatively analyze the depths of the magnetic sources, we use the Euler deconvolution (Thompson, 1982; Reid et al., 1990). The method is based on Euler’s equation:
where (x, y, z) is the estimated location of the source,
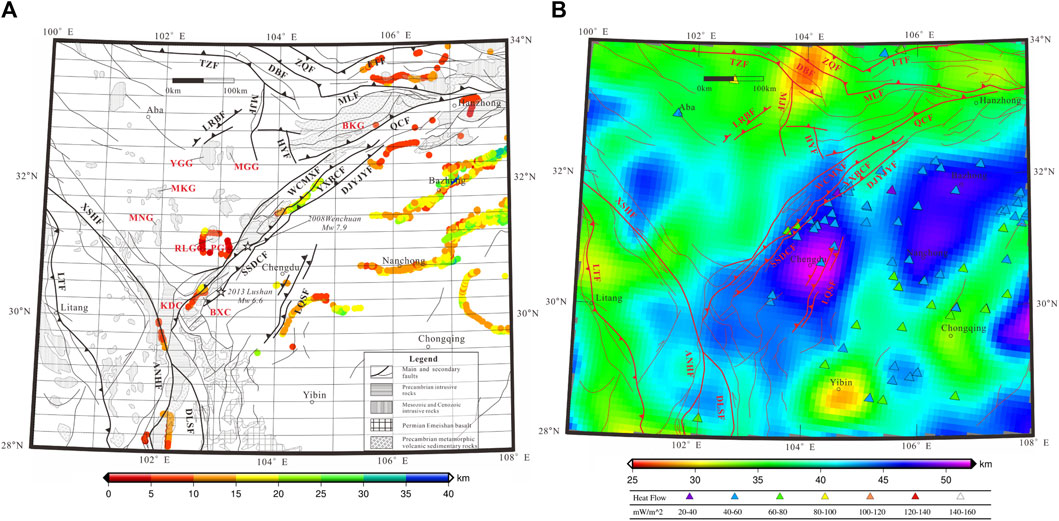
FIGURE 7. (A) Estimation of the position of magnetic bodies using Euler deconvolution (SI = 0). The solid dots marked by different colors correspond to different buried depths. (B) Distribution of CPD around LFZ. The map is interpolated for better display. The triangles with different colors represent suface heat flow measurements. The heat flow data come from Jiang et al. (2019).
The CPD is a specific temperature interface in the lithosphere, above which temperature rocks will lose their ferromagnetism. It is often assumed to be 580°C, the Curie temperature of magnetite, a major magnetic mineral in the crust (Thébault et al., 2010). Sometimes CPD represents the petrological boundary instead due to the non-magnetic mantle rocks (Langel and Hinze, 1998; Demarco et al., 2020). The CPD is significant to reveal deep thermal structure of the lithosphere.
Many methods have been used in the estimation of CPD, among which, the power density spectrum (PDS) for aeromagnetic data is widely used. Spector and Grant (1970) first proposed that the radial average power spectrum is related to the thickness and depth to the upper boundary of the magnetic layer. Then, Tanaka et al. (1999) further developed the method and made it the mainstream. Here, we use PDS to study the thermal state and magnetic structure beneath the study area.
Tanaka et al. (1999)’s method assumes that 1) the magnetic layer extends infinitely in horizontal directions; 2) the thickness of the layer is smaller than the horizontal scale and 3) the magnetization M (x, y) is a random function of x and y. The depth to the top
During calculation, the total anomaly map needs to be divided into several smaller zones (windows), and the depth can be obtained for each window using the power spectrum, corresponding to the averaged CPD within the window.
Due to the assumption of smaller thickness of magnetic layer compared to horizontal scale, the window should be large enough to obtain signals of deep source. Some studies argued that the window should be at least 3 or 4 times the depth of the magnetic layer (Hussein et al., 2013), while others suggested that this ratio should be 2π or even larger (Ravat et al., 2007; Manea and Manea, 2011). To date, there is no consensus for the selection of window size. To ensure the response of the deepest magnetic layer, a larger window size should be selected (Demarco et al., 2020). Here, we use the window size of
In addition, the selection of fitting wavenumber range is also an important factor that affects the estimation as inappropriate fitting may skew the result. In Tanaka et al. (1999)’s research, the wavenumber range for determining the
Data processing, such as filter or truncation, will also influence the result. Okubo et al. (1985) argued that since the main magnetic field is not completely removed in the crustal anomaly, the component at low wave number domain will increase and result in a deeper CPD. To remove the influence of long-wavelength anomalies, they conducted high-pass filtering. However, Ravat et al. (2007) argued that the anomalies should not be filtered, because they will significantly change the shape of the power spectrum, especially the low-wavenumber signals associated with the bottom of the magnetic layer. Therefore, in this paper, the original anomaly grids of EMAG2-v3 are used without filtering, but a 12-point Hanning cut-off window is applied on the edges of each window to prevent spectrum leakage.
The final result of CPD is exhibit in Figure 7B. On the whole, it is relatively shallow in SGFB and deep in SB. In SB, there are two large obvious CPD depressions in the west and in the east. The western CPD depression (46–51 km) extends westward to LFZ, while the eastern CPD depression is located in Nanchong-Bazhong area with a depth of ∼48 km. There are also two distinct CPD uplifts in the south of SB. The western one is located near Yibin with a depth of 30–36 km, while the eastern one roughly starts from Chongqing and extends to the northeast with a depth of 34–40 km. Another relatively small CPD depression is located in the eastern edge of SB with a depth of 51 km. The CPD of SGFB is relatively shallow. It drops from 49 km in SB on the east side of the Shuangshi-Dachuan fault to 38 km in SGFB on the northwest side of the Wenchuan-Maoxian fault. Different CPD results were obtained around the LFZ. The differences between them are associated with the data source, processing, and algorithm. The result of Zhang et al. (1996) is based on the assumption of magnetic dipole and 3D inversion algorithm. They show a shallow CPD area (∼24.5 km) located in the center of SB. With the development of magnetic satellite and aeromagnetic survey, accurate geomagnetic data and models are available. Xiong et al. (2016b), Wang et al. (2018b), Gao et al. (2015) used magnetic data derived from the aeromagnetic survey, EMAG2 grid model, and NGDC-720 model to investigate the CPD. Although they all showed depression area of CPD in SB corresponding to the stable Yangtze Block, the range and distribution pattern are different. Xiong et al. (2016b) concluded that the CPD in Sichuan is between 30–40 km, and that in SGFB is 36–44 km. Wang et al. (2018b) proposed that the CPD extends to a great depth (up to 40 km) in SB and SGFB, and the LFZ exhibit shallow CPD of ∼30 km. Gao et al. (2015) suggested that the CPD around SB and SGFB range from 24–34 km, the depression area of CPD is located in northern SB, and the CPD in SGFB is shallow, which means that the LFZ is the gradient belt of CPD. Different distribution patterns of CPD directly concern the role of LFZ in geological tectonics. Our results show that LFZ is roughly the gradient belt of CPD, which leads to different characteristic of magnetic anomalies on both sides.
The surface heat flow is closely related to the CPD, so we mark it by triangles with different colors in Figure 7B. It can be seen that low heat flows (blue and purple triangles) appear in the northern SB with deep CPD, and higher values (green triangles) are distributed in the southern SB with relative shallow CPD, or in areas as CPD gradient belts, such as the two green triangles in middle LFZ.
Seismic wave studies showed that the crustal thickness of this region is 50–58 km, thus the CPD is located in the middle and lower crust. Studies showed that the middle crustal temperature of SGFB reaches 700–800°C, the lower crust reaches 1,000°C (Wang et al., 2015b, 2017a), and the surface heat flow is greater than that of SB, which also supports that the CPD in SGFB is relatively shallow. The relatively high temperature may result in partial melting of the middle and lower crust. Magnetotoluric and seismological studies indicated that there is a channel flow in the middle and lower crust of SGFB (Royden et al., 1997; Bai et al., 2010; Wang et al., 2015b, 2017a), where the Tibetan Plateau material moves, but is blocked by the cold YB, and then shifts to southeast and northeast corresponding to the shallow CPD of Qinling orogenic belt on northern SB (27–38 km) and the western part of Xianshuihe fault (30–36 km). Fault systems distributed in these two areas may promote the upwelling of deep thermal materials, resulting in the uplift of CPD (Zhang, 2013).
The total magnetization is the vector sum of the induced and remanent magnetization, and the relative contribution between the two is defined by the Koenigsherg ratio Q:
where
Previous studies have shown that, in most cases, the TMD in continents is parallel to the current direction of the geomagnetic field (Q << 1) (Thébault et al., 2010). Since continental rocks cooled and formed over long geological periods and may have undergone multiple reversals of the geomagnetic field, the minerals in the continental crust host multiple directions of remanent magnetization which may cancel each other out (Shive, 1989), with only the induced component left. Meanwhile, previous studies indicate that the susceptibility of magnetic minerals above the CPD in the lower crust increases with temperature and reaches a maximum value called the Hopkinson peak, while the remanent magnetization attenuates rapidly (Kiss et al., 2005; Dunlop et al., 2010). In addition, a study showed that multi-domain (MD) magnetite in the lower crust is dominated by induced magnetization, but rapidly cooled magnetite is dominated by remanent magnetization as seen in mid-ocean ridges and volcanic regions (Lanza and Meloni, 2006). Therefore, most magnetic studies in the continents are based on the assumption of induced magnetization, including the RTP operation mentioned above. If the actual direction deviates from the assumption of induced magnetization, the RTP anomalies may not align to the magnetic sources exactly (Blakely, 1995; Dannemiller and Li, 2006).
Some studies have challenged the assumption of continental induction. McEnroe et al. (2004) pointed out that the hemo-ilmenite or ilmeno-hematite could be retained at middle and lower crustal temperature and thus may have a remanent component. Meanwhile, high Q values were found in many regions (McEnroe et al., 2002), which suggests the existence of remanent component. In our RTP map, strong negative anomalies appear in the SGFB, Bikou continental flood basalt, and northern margin of SB, which cannot be interpreted by induced magnetization. Therefore, the TMD need to be estimated.
To determine the direction of magnetization, we use the method proposed by Dannemiller and Li (2006). It was based on the correlation between the vertical and total gradient of the RTP field and the cross-correlation coefficient can be evaluated by the following formula:
where
where R denotes the observed total magnetic anomaly, and
To avoid the unstable RTP process in areas with small magnetic inclination, we introduce the suppression filter (Yao et al., 2003) into the RTP process, and the results are checked to ensure the stability of the RTP operation. To suppress the noise in the magnetic data, the anomaly at an altitude of 25 km is used. We select three areas with negative RTP anomalies and one with positive anomaly to determine the TMD, as shown in Figure 8A. The results are listed in Figures 8B–E, in which the red “+” marks the most possible declination and inclination. These indicate that remanent magnetization really exists and the TMD deviates from the induced component. Whether the basement beneath SB is dominated by induced magnetization can be inferred from the direction determining process for the positive anomalies (block 4 in Figure 8A). The result (Figure 8E) shows that the inclination and declination of the Precambrian basement is 49° and −26° respectively, close to the direction of the main geomagnetic field (49° and −2° in average). Therefore, the stable magnetic basement of SB is largely dominated by induced magnetization.
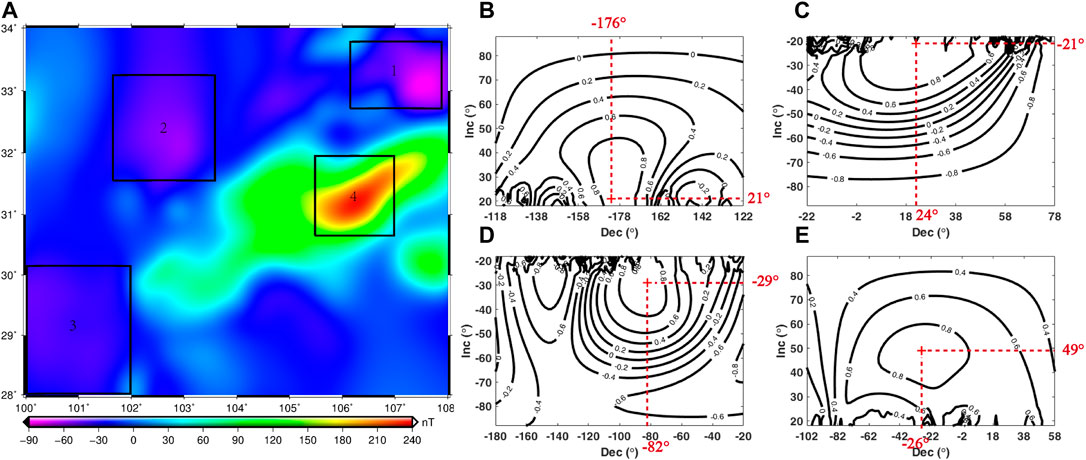
FIGURE 8. (A) Regional magnetic anomaly used to determine the total magnetization directions are marked by four black boxes. (B–E) show the contour maps of correlation coefficient between analytic signal and vertical derivative in the block 1–4. The most possible magnetize directions are marked by the red crosses, and the inclination and declination are shown by red text.
The observed anomalies are generated by rocks with varied magnetization. To determine the properties of magnetic rocks underground, we construct a simple forward model. The study area is divided into 9 blocks according to the faults distribution, RTP anomaly, and result of Euler deconvolution, as shown in Figure 9A. The magnetic property of each block is set to be uniform. Based on the CPD estimated in section 3.6, we assign the lower magnetic boundaries to the 9 magnetic blocks. The magnetic parameters of the blocks are list in Table 1. The TMD are based on the results in Section 3.7 and the magnetization directions are parallel to the main geomagnetic field.
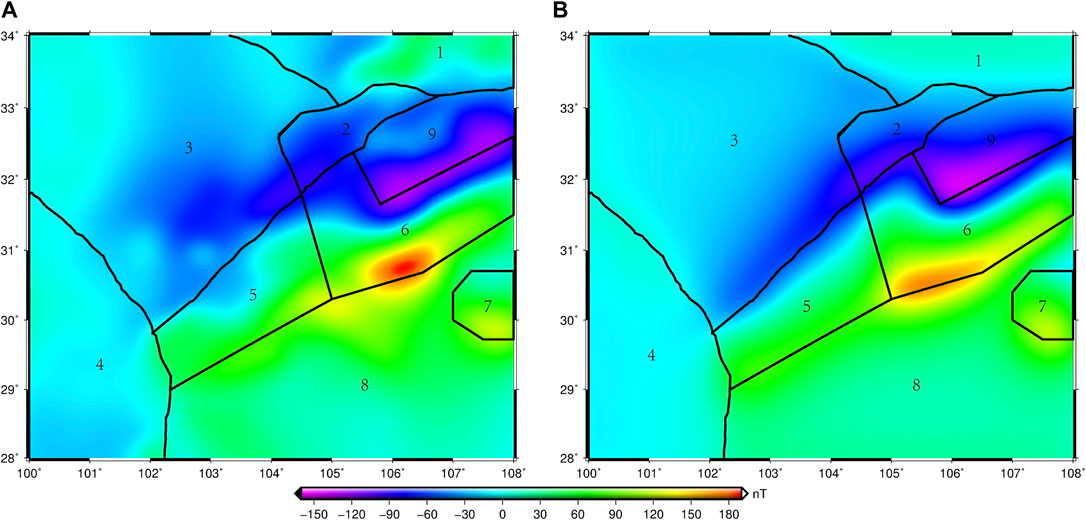
FIGURE 9. (A) Magnetic anomalies (EMAG2v3) and (B) the forward calculated anomalies at altitude of 25 km. The black lines divide the study area into nine blocks according to the faults distribution, RTP anomalies and Euler deconvolution result.
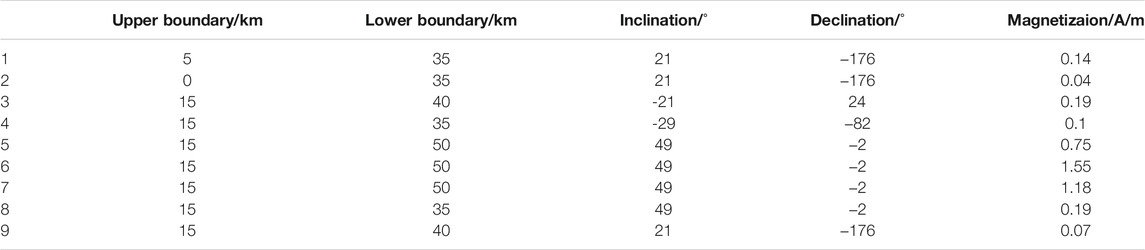
TABLE 1. Parameters of the magnetic blocks for anomaly calculation.
Figure 9B shows the calculated anomalies at 25 km. As can be seen, the forward calculated anomaly (Figure 9B) is roughly consistent with the observed anomaly (Figure 9A). The cross-correlation and root mean square between them are 0.946 and 16.5 nT, respectively. The forward model suggests that the NE-strike banded Precambrian basement with great CPD provide abundant magnetic sources with high magnetization (0.75 A/m equivalent to 0.0189 SI in the west and 1.55 A/m equivalent to 0.039 SI in the east), which generate the NE-strike positive anomalies and associated negative anomalies in the north due to the induced oblique magnetization. The susceptibility is consistent with the 2D forward model in Xiong et al. (2020) (0.01885–0.04398 SI in SB). The board weak negative anomalies distributed in SGFB and north Yunnan block result from the relatively weak remanent magnetization of 0.19 A/m and 0.1 A/m.
The Kangding and Pengguan complexes show positive RTP anomalies and high values in FVD map and ASA map (Figures 5A,B), indicating magnetic sources with high susceptibility exist in the complexes. Meanwhile, Proterozoic quartz diorite with high susceptibility (
Unlike the Kangding and Pengguan complexes with positive anomalies, the Neoproterozoic Bikou Group located on the northwest margin of SB contains basic volcanic rocks which should have high susceptibility but shows negative anomalies (Figure 4). There may be two reasons. Firstly, the volcanic rocks in the Bikou Group are generally bimodal in composition, consisting of basaltic rocks and subordinate felsic rocks (Xu et al., 2002; Wang, et al., 2008), and lack intermediate rocks. Therefore, the magnetic susceptibility varies by several orders of magnitude, and may not generate observable anomalies. Secondly, the Bikou Group consists of large amounts of effusive volcanic rocks (Xu et al., 2002), which cool rapidly with small dimensions of the crystals of Fe-Ti oxides, therefore, cannot carry enough induced magnetization but only remanent magnetization (Lanza and Meloni, 2006) which may have reversed direction and thus shown as negative anomalies in the RTP map.
LFZ is used as the boundary between YB and SGFB due to the different physical properties between the two blocks. However, recent studies indicate that the western margin of YB may extend to the Longriba fault which is about 200 km northwest and subparallel to LFZ (Guo et al., 2014a, b). Xiong et al. (2020) showed that the basement extends to only 33 km west of Wenchuan-Maoxian fault and decreases to about 17–19 km under the south segment. Wang et al. (2018a) also found a clear low-resistivity abnormal zone exists between Longriba and Minjiang Fault, the abnormal zone runs through the lithosphere and may be the deep boundary of YB. In our RTP anomalies map (Figure 4), LFZ delineates the western border of the positive anomalies, and the anomalies calculated by NE banded magnetic basement also match well with the observed anomalies around LFZ. The result of Euler deconvolution shows a potential magnetic contact beneath LFZ (Figure 7A), which suggest that the west margin of magnetic basement of YB does not spread much to the west. To simulate the anomalies generated by westward extension, we set a strong magnetic basement whose west boundary spreads to the west (marked by the white line in Figures 10A–D), and have the same magnetic property with the magnetic basement of SB (induced magnetization of 1.55 A/m). The results show that the westward extending basement generates positive anomalies and cancels out the original negative anomalies, so that the positive anomalies will significantly spread westward (Figures 10A–D). With the increasing distance to the Yingxiu-Beichuan Fault, which is the central fault of LFZ, the root mean square between the calculated anomalies and observed anomalies increases from 16.5 to 27.87 nT, and the cross-correlation coefficient decreases from 0.946 to 0.85, indicating a worse fitting. Therefore, the west margin of strong magnetic basement is more likely to lie beneath LFZ.
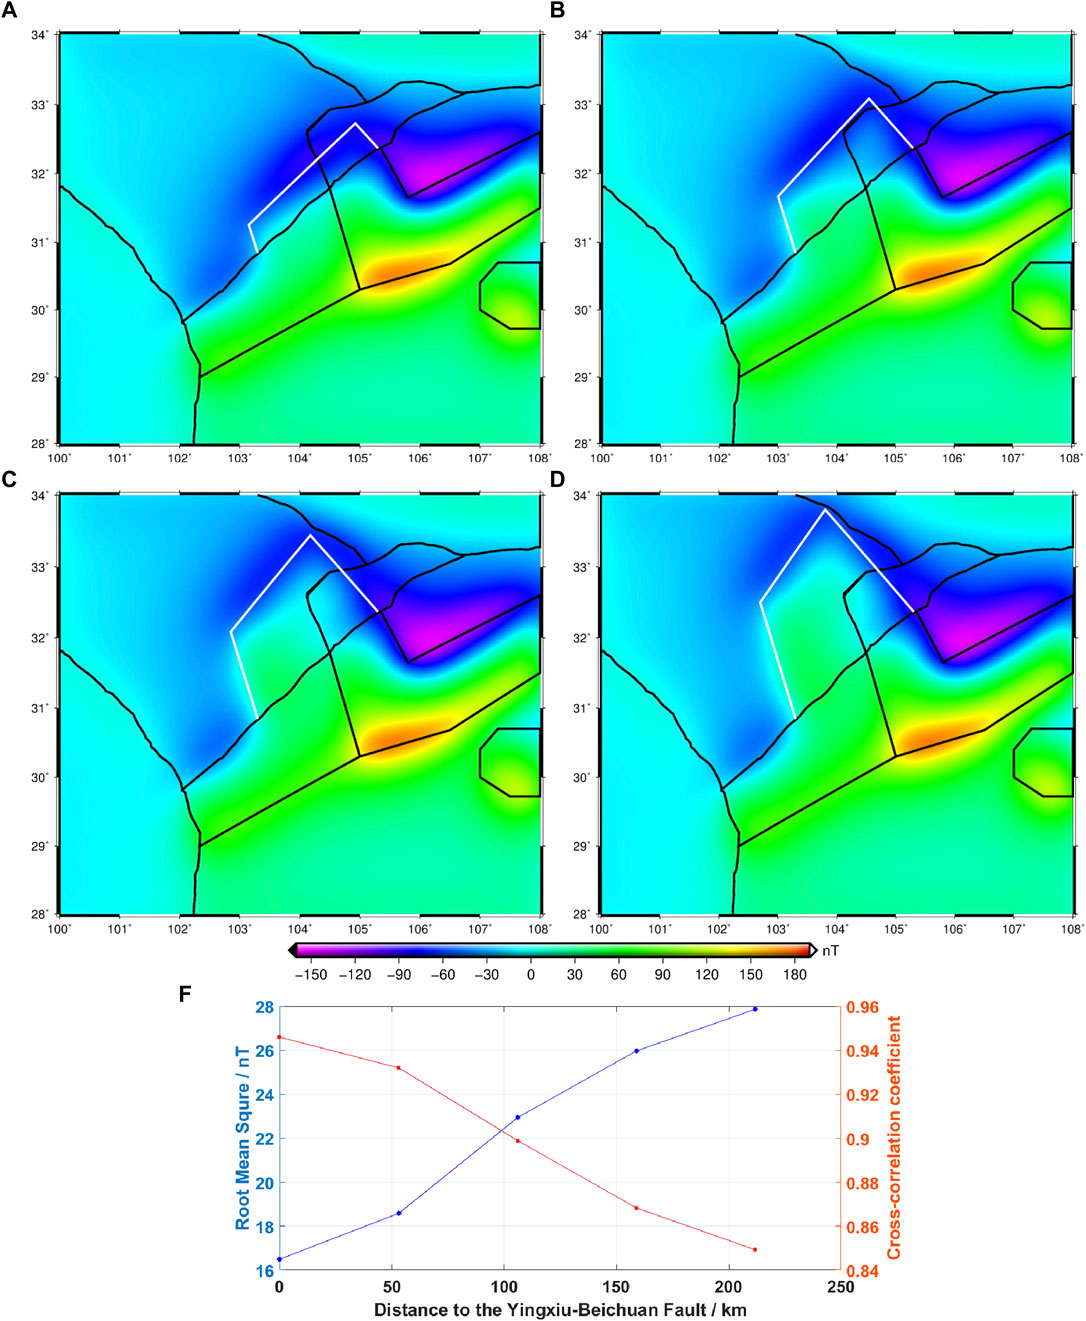
FIGURE 10. Calculated anomalies generated by models with different west margin corresponding to (A) 53 km; (B) 106 km; (C) 158 km; (D) 211 km from the YXBCF. Black lines are the same boundaries of magnetic blocks as Figure 9. White lines mark the west margin of block 5 and 6. (F) Varied standard deviation (blue) and cross-correlation coefficient (red) with different boundary marked by white lines.
However, we cannot rule out the possibility of the western extension of weak magnetic or non-magnetic basement, which cannot produce obvious measurable anomalies. That means the magnetic boundary beneath LFZ may not represent the true basement in the petrological sense, since the uplift of CPD may eliminate most rock magnetism. As we can see in Figure 7B, the CPD decreases from 49 km in SB to 34–44 km in SGFB, thus large amounts of strong magnetic basement loses their magnetism, leaving only the upper part of the basement with weak magnetism remains and generates weak anomalies. Two clear isolated positive anomalies in the east exhibit high vertical gradients and positive anomalies at different altitudes (Figure 5A, Figure 6), corresponding well to the Manai and Rilonguan granitic massifs. Geochemical studies showed that the Mesozoic Manai and Rilonguan granites are syn-kinematic granites resulting from partial melting of the basement of SGFB or South China block based on the relatively young TDM (672 and 896 Ma) and the moderately negative εNd values (Roger et al., 2004). The young TDM suggests that the granites incorporate the Neoproterozoic basement, which means these granites inherit the high susceptibility from the Precambrian basement beneath YB, and thus exhibit strong positive anomalies. By contrast, the Markam granitic massif on the north does not show any positive anomalies, and the geochemical evidence showed that the Markam granites are with older TDM (1,612–1793 Ma) and negative εNd, suggesting that they came from the melts of Middle Triassic sediments (Roger et al., 2004), which have low susceptibility. Therefore, the two strong positive anomalies corresponding to the granite massifs are ascribed to the addition of Precambrian basement with high susceptibility during the Mesozoic, proving the existence of the Precambrian basement beneath SGFB, which may be the westward extending basement of YB but loses its magnetism due to the relatively shallow CPD. Zhang et al. (2006) also argued that the adakites distributed in SGFB was generated at depth >50 km and proved the existence of mafic continental crust similar to the basement of YB, which can be used to identify the western boundary of YB (Guo et al., 2014a).
In short, as shown in Figure 11, we proposed that the west margin of the magnetic basement of YB (marked by red block) is more likely to stay beneath LFZ, and the weak or non-magnetic basement extends westward beneath SGFB (marked by blue block), supported by magnetotelluric study (Li et al., 2017; Wang et al., 2018a). However, the question of how far the basement spreads needs further study.
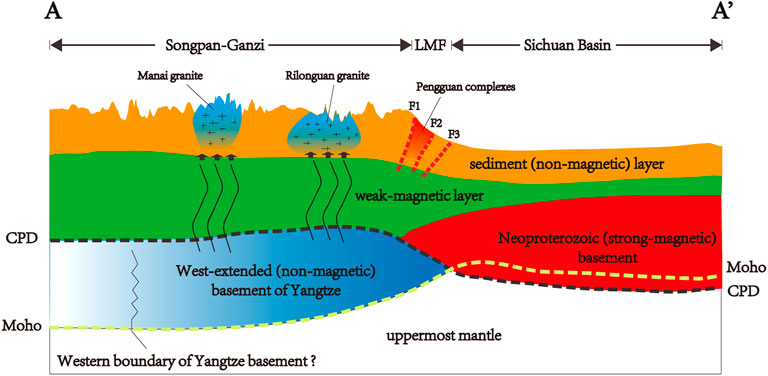
FIGURE 11. Sketch of magnetic structure along the profile AA’. Different colors represent different magnetic layers. Black and green dotted line marks the CPD and Moho boundary. F1: Wenchuan-Maoxian Fault, F2: Yingxiu-Beichuan Fault, F3: Shuangshi-Dachuan Fault.
As shown in Figure 9, the magnetic pattern in the study area is dominated by NE banded magnetic basement. The magnetic basement is postulated to be formed by the Neoproterozoic magmatic events (Wang et al., 2020; Xiong et al., 2020). Two models have been proposed to explain these magmatic events, mantle plume model (Li et al., 1999; Li et al., 2003; Li et al., 2008a; Li et al., 2008b) or the subduction-related arc model (Zhou et al., 2002a, b; Zhou et al., 2006a, b; Cawood et al., 2013).
A recent study has shown that the Permian plume beneath the Tarim Basin has a radial pattern of linear anomalies emanating from a central region (Xu et al., 2020), indicating that the anomalies are related to the plume-induced mafic intrusions. If the anomalies in the study area are produced by the Neoproterozoic magnetic basement, the pattern of the anomalies may also relate to the interaction of the crust and mantle during Neoproterozoic. For the plume model, Li et al. (2003) proposed that the widespread granitoids were formed within a short time interval of ∼5 Ma at ca. 825−820 Ma, and coeval intrusion of granitoids and mafic-ultramafic rocks over an area of >1000 km
In this study, we established connections between magnetic anomalies and tectonic structure around LFZ. Good correspondence exists between the RTP anomalies and tectonic structure, in that the positive anomalies delineate the shape of magnetic basement beneath SB. The CPD of SB estimated by PDS shows that the depth to the bottom of the magnetic basement is 30–51 km, which allows strong magnetized rocks to be preserved and exhibit strong anomalies. The west margin of the magnetic basement of YB lies beneath LFZ and does not extend westward. However, the basement in the petrological sense may spread westward to SGFB and generate positive anomalies over the Manai and Rilonguan granites by melts of basement. The magnetic basement is associated with the Neoproterozoic magmatic events. The banded shape and absence of radial pattern of the positive anomalies as well as the existence of fossil subduction zone all support that the magnetic basement is generated by the subducted oceanic crust or serpentine mantle wedge.
Publicly available datasets were analyzed in this study. This data can be found here: https://www.ncei.noaa.gov/access/metadata/landing-page/bin/iso?id=gov.noaa.ngdc.mgg.geophysical_models:EMAG2_V3.
YL contributed to the data analyses and preparation of the manuscript. Jiao contributed to the conception of the study, discussion and improvement of the manuscript. JT contributed to the preparation of figures and discussion. JZ contributed to the figures. QH contributed to the analyses.
This work is supported by the National Natural Science Foundation of China (Grant No. 42074072), the Special Fund of the Institute of Geophysics, China Earthquake Administration (Grant No. DQJB20B26, DQJB21X26, DQJB21Y41).
The authors declare that the research was conducted in the absence of any commercial or financial relationships that could be construed as a potential conflict of interest.
All claims expressed in this article are solely those of the authors and do not necessarily represent those of their affiliated organizations, or those of the publisher, the editors and the reviewers. Any product that may be evaluated in this article, or claim that may be made by its manufacturer, is not guaranteed or endorsed by the publisher.
The EMAG2v3 magnetic grid model is available at https://www.ncei.noaa.gov/access/metadata/landing-page/bin/iso?id=gov.noaa.ngdc.mgg.geophysical_models:EMAG2_V3. We thank editor LW and two reviewers CF-L and WW for their valuable advice. The figures presented in this study are drawn by Generic mapping tool (Wessel et al., 2013). LY acknowledge the course “English Presentation for Geophysical Research” of Peking University (Course #01201110) for help in improving the manuscript.
Arkani‐Hamed, J. (1988). Differential Reduction‐to‐the‐pole of Regional Magnetic Anomalies. Geophysics 53 (12), 1592–1600. doi:10.1190/1.1442441
Arkani-Hamed, J. (2007). Differential Reduction to the Pole: Revisited. Geophysics 72 (1), L13–L20. doi:10.1190/1.2399370
Arkani-Hamed, J., and Strangway, D. W. (1985). Lateral Variations of Apparent Magnetic Susceptibility of Lithosphere Deduced from Magsat Data. J. Geophys. Res. 90 (B3), 2655–2664. doi:10.1029/JB090iB03p02655
Bai, C., Kang, G., and Gao, G. (2014). Distribution of the Crustal Magnetic Field in Sichuan-Yunnan Region, Southwest China. Scientific World J. 2014, 1–11. doi:10.1155/2014/854769
Bai, D., Unsworth, M. J., Meju, M. A., Ma, X., Teng, J., Kong, X., et al. (2010). Crustal Deformation of the Eastern Tibetan Plateau Revealed by Magnetotelluric Imaging. Nat. Geosci 3, 358–362. doi:10.1038/ngeo830
Bai, M., Chevalier, M.-L., Pan, J., Replumaz, A., Leloup, P. H., Métois, M., et al. (2018). Southeastward Increase of the Late Quaternary Slip-Rate of the Xianshuihe Fault, Eastern Tibet. Geodynamic and Seismic hazard Implications. Earth Planet. Sci. Lett. 485, 19–31. doi:10.1016/j.epsl.2017.12.045
Bhattacharyya, B. K. (1965). Two‐dimensional Harmonic Analysis as a Tool for Magnetic Interpretation. Geophysics 30 (5), 829–857. doi:10.1190/1.1439658
Blakely, R. J. (1995). Potential Theory in Gravity and Magnetic Applications. Cambridge: Cambridge University Press. doi:10.1017/CBO9780511549816.012
Cawood, P. A., Wang, Y., Xu, Y., and Zhao, G. (2013). Locating South China in Rodinia and Gondwana: a Fragment of Greater India Lithosphere. Geology 41 (8), 903–906. doi:10.1130/G34395.1
Cawood, P. A., Zhao, G., Yao, J., Wang, W., Xu, Y., and Wang, Y. (2018). Reconstructing South China in Phanerozoic and Precambrian Supercontinents. Earth-Science Rev. 186, 173–194. doi:10.1016/j.earscirev.2017.06.001
Dannemiller, N., and Li, Y. (2006). A New Method for Determination of Magnetization Direction. Geophysics 71 (6), L69–L73. doi:10.1190/1.2356116
Deng, Q., Chen, D., and Zhao, X. (1994). Tectonics, Scismisity and Dynamics of Longmenshan Mountains and its Adjacent Regions. Seismology Geology. 16 (4), 389–403. (in Chinese with English abstract).
Dunlop, D. J., Özdemir, Ö., and Costanzo-Alvarez, V. (2010). Magnetic Properties of Rocks of the Kapuskasing Uplift (Ontario, Canada) and Origin of Long-Wavelength Magnetic Anomalies. Geophys. J. Int. 183 (2), 645–658. doi:10.1111/j.1365-246X.2010.04778.x
Frey, H. (1982). MAGSAT Scalar Anomaly Distribution: The Global Perspective. Geophys. Res. Lett. 9 (4), 277–280. doi:10.1029/GL009i004p00277
Gao, G., Kang, G., Bai, C., and Wen, L. (2015). Study on Crustal Magnetic Anomalies and Curie Surface in Southeast Tibet. J. Asian Earth Sci. 97, 169–177. doi:10.1016/j.jseaes.2014.10.035
Gao, G., Lu, Q., Wang, J., and Kang, G. (2021). Constraining Crustal Thickness and Lithospheric thermal State beneath the Northeastern Tibetan Plateau and Adjacent Regions from Gravity, Aeromagnetic, and Heat Flow Data. J. Asian Earth Sci. 212, 104743. doi:10.1016/j.jseaes.2021.104743
Gao, R., Chen, C., Wang, H., Lu, Z., Brown, L., Dong, S., et al. (2016). SINOPROBE Deep Reflection Profile Reveals a Neo-Proterozoic Subduction Zone beneath Sichuan Basin. Earth Planet. Sci. Lett. 454, 86–91. doi:10.1016/j.epsl.2016.08.030
Gu, Z., and Wang, Z. (2014). The Discovery of Neoproterozoic Extensional Structures and its Significance for Gas Exploration in the Central Sichuan Block, Sichuan Basin, South China. Sci. China Earth Sci. 57, 2758–2768. doi:10.1007/s11430-014-4961-x
Guo, X., Gao, R., and Keller, G. R. (2014b). Integrated Geophysical Study on the Tectonic Feature of the Longriba Fault Zone, Eastern Tibetan Pleteau, and the Tectonic Implications. Prog. Geophys. 29 (5), 2004–2012. (in Chinese with English abstract). doi:10.6038/pg20140503
Guo, X., Keller, G. R., Gao, R., Xu, X., Wang, H., and Li, W. (2014a). Irregular Western Margin of the Yangtze Block as a Cause of Variation in Tectonic Activity along the Longmen Shan Fault Zone, Eastern Tibet. Int. Geology. Rev. 56 (4), 473–480. doi:10.1080/00206814.2013.873358
He, D.-F., Li, D., Li, C.-X., Li, Y.-Q., and Mei, Q.-H. (2017). Neoproterozoic Rifting in the Upper Yangtze Continental Block: Constraints from Granites in the Well W117 Borehole, South China. Sci. Rep. 7, 12542. doi:10.1038/s41598-017-12764-y
Hood, P., and McClure, D. J. (1965). Gradient Measurements in Ground Magnetic Prospecting. Geophysics 30 (3), 403–410. doi:10.1190/1.1439592
Hu, Y., and Wang, Z. (2018). Plate Interactions, Crustal Deformation and Magmatism along the Eastern Margins of the Tibetan Plateau. Tectonophysics 740-741, 10–26. doi:10.1016/j.tecto.2018.05.011
Hugh, G. M., and Vijay, S. (1994). Potential Field Tilt – a New Concept for Location of Potential Field Sources. J. Appl. Geophys. 32, 213–217. doi:10.1016/0148-9062(95)94633-0
Hussein, M., Mickus, K., and Serpa, L. F. (2013). Curie point Depth Estimates from Aeromagnetic Data from Death Valley and Surrounding Regions, California. Pure Appl. Geophys. 170, 617–632. doi:10.1007/s00024-012-0557-6
Jiang, G., Hu, S., Shi, Y., Zhang, C., Wang, Z., and Hu, D. (2019). Terrestrial Heat Flow of continental China: Updated Dataset and Tectonic Implications. Tectonophysics 753, 36–48. doi:10.1016/j.tecto.2019.01.006
Kang, H., Li, D., Chen, Y., Hu, G., and Deng, W. (2017). Origin and Tectonic Implications of Kangding Intrusive Comples in Sichuan Province: Evidence from Ziron Hf Isotope. Geology. China 44 (6), 1175–1189. (in Chinese with English abstract). doi:10.12029/gc20170610
Khalil, M. H. (2016). Subsurface Faults Detection Based on Magnetic Anomalies Investigation: A Field Example at Taba Protectorate, South Sinai. J. Appl. Geophys. 131, 123–132. doi:10.1016/j.jappgeo.2016.06.001
Kiss, J., Szarka, L., and Prácser, E. (2005). Second-order Magnetic Phase Transition in the Earth. Geophys. Res. Lett. 32, L24310. doi:10.1029/2005GL024199
Lanza, R., and Meloni, A. (2006). The Earth’s Magnetism: An Introduction for Geologist. Berlin, Heidelberg: Springer. doi:10.1007/978-3-540-27980-8
Langel, R. A., and Hinze, W. J. (1998). The Magnetic Field of the Earth’s lithospher. Cambridge: Cambridge University Press. doi:10.1017/CBO9780511629549
Li, J., Wang, X., and Li, D. (2017). Characteristics of the Lithosphere Physical Structure in Eastern Margin of the Qinghai-Tibei Plateau and Their Deep Tectonic Implications. Chin. J. Geophys. 60 (6), 2500–2511. (in Chinese with English abstract). doi:10.6038/cjg20170637
Li, W.-X., Li, X.-H., and Li, Z.-X. (2008a). Middle Neoproterozoic Syn-Rifting Volcanic Rocks in Guangfeng, South China: Petrogenesis and Tectonic Significance. Geol. Mag. 145 (4), 475–489. doi:10.1017/S0016756808004561
Li, X.-H., Li, W.-X., Li, Z.-X., and Liu, Y. (2008b). 850-790 Ma Bimodal Volcanic and Intrusive Rocks in Northern Zhejiang, South China: a Major Episode of continental Rift Magmatism during the Breakup of Rodinia. Lithos 102, 341–357. doi:10.1016/j.lithos.2007.04.007
Li, X., Li, Z., Ge, W., Zhou, H., Li, W., Liu, Y., et al. (2003). Neoproterozoic Granitoids in South China: Crustal Melting above a Mantle Plume at Ca. 825 Ma. Precambrian Res. 122, 45–83. doi:10.1016/s0301-9268(02)00207-3
Li, Z.-X., Li, X.-h., Zhou, H., and Kinny, P. D. (2002). Grenvillian continental Collision in south China: New SHRIMP U-Pb Zircon Results and Implications for the Configuration of Rodinia. Geol 30 (2), 163–166. doi:10.1130/0091-7613(2002)030<0163:gccisc>2.0.co;2
Li, Z. X., Li, X. H., Kinny, P. D., and Wang, J. (1999). The Breakup of Rodinia: Did it Start with a Mantle Plume beneath South China. Earth Planet. Sci. Lett. 173 (3), 171–181. doi:10.1016/S0012-821X(99)00240-X
Liu, Q., Li, Y., Chen, J., Guo, B., Li, S., Wang, J., et al. (2009). Wenchuan Ms8.0 Earthquake: Preliminary Study of the S-Wave Velocity Structure of the Crust and Upper Mantle. Chin. J. Geophys. 52 (2), 309–319. (in Chinese with English abstract).
Liu, Y., Qian, M., and Li, C. (2014). Magnetic Response and Distribution of Deep Volcanic Rock in Songliao Basin. Prog. Geophys. 29, 2708–2717. (in Chinese with English abstract). doi:10.6038/pg20140636
Lou, D., Song, G., Li, N., Ding, J., Yin, J., and Zou, W. (2008). The Application of Magnetic Method in National mineral Prediction. Prog. Geophys. 23 (1), 249–256. (in Chinese with English abstract).
Manea, M., and Manea, V. C. (2011). Curie point Depth Estimates and Correlation with Subduction in Mexico. Pure Appl. Geophys. 168, 1489–1499. doi:10.1007/s00024-010-0238-2
McEnroe, S. A., Harrison, R. J., Robinson, P., and Langenhorst, F. (2002). Nanoscale Haematite-Ilmenite Lamellae in Massive Ilmenite Rock: an Example of 'lamellar Magnetism' with Implications for Planetary Magnetic Anomalies. Geophys. J. Int. 151, 890–912. doi:10.1046/j.1365-246X.2002.01813.x
McEnroe, S. A., Langenhorst, F., Robinson, P., Bromiley, G. D., and Shaw, C. S. J. (2004). What Is Magnetic in the Lower Crust. Earth Planet. Sci. Lett. 226, 175–192. doi:10.1016/j.epsl.2004.07.020
Nabighian, M. N. (1984). Toward a Three‐dimensional Automatic Interpretation of Potential Field Data via Generalized Hilbert Transforms: Fundamental Relations. Geophysics 49 (6), 780–786. doi:10.1190/1.1441706
Nie, S., Yin, A., Rowley, D. B., and Jin, Y. (1994). Exhumation of the Dabie Shan Ultra-high-pressure Rocks and Accumulation of the Songpan-Ganzi Flysch Sequence, central China. Geol 22 (11), 999–1002. doi:10.1130/0091-7613(1994)022<0999:EOTDSU>2.3.CO;2
Núñez Demarco, P., Prezzi, C., Sánchez Bettucci, L., and Bettucci, L. S. (2020). Review of Curie point Depth Determination through Different Spectral Methods Applied to Magnetic Data. Geophys. J. Int. 224, 17–39. doi:10.1093/gji/ggaa361
Okubo, Y., Graf, R. J., Hansen, R. O., Ogawa, K., and Tsu, H. (1985). Curie point Depths of the Island of Kyushu and Surrounding Areas, Japan. Geophysics 50 (3), 481–494. doi:10.1190/1.1441926
Pan, S., Xu, X., Guo, L., and Gao, R. (2020). Crustal Structure of Daba Shan and Adjacent Terranes Revealed from High-Resolution Deep Seismic-Reflection Profiling and Potential Field Modeling. Prog. Geophys. 35 (4), 1292–1298. (in Chinese with English abstract). doi:10.6038/pg2020DD0246
Ravat, D., Pignatelli, A., Nicolosi, I., and Chiappini, M. (2007). A Study of Spectral Methods of Estimating the Depth to the Bottom of Magnetic Sources from Near-Surface Magnetic Anomaly Data. Geophys. J. Int. 169, 421–434. doi:10.1111/j.1365-246X.2007.03305.x
Reid, A. B., Allsop, J. M., Granser, H., Millett, A. J., and Somerton, I. W. (1990). Magnetic Interpretation in Three Dimensions Using Euler Deconvolution. Geophysics 55 (1), 80–91. doi:10.1190/1.1442774
Reid, A. B., Ebbing, J., and Webb, S. J. (2014). Avoidable Euler Errors - the Use and Abuse of Euler Deconvolution Applied to Potential fields. Geophys. Prospecting 62, 1162–1168. doi:10.1111/1365-2478.12119
Reid, A. B., and Thurston, J. B. (2014). The Structural index in Gravity and Magnetic Interpretation: Errors, Uses, and Abuses. Geophysics 79 (4), J61–J66. doi:10.1190/geo2013-0235.1
Ren, J., Niu, B., Wang, J., Jin, X., and Xie, L. (2013). International Geological Map of Asia, 1: 5, 000, 000. Beijing: Geological Publishing House.
Roest, W. R., Verhoef, J., and Pilkington, M. (1992). Magnetic Interpretation Using the 3-D Analytic Signal. Geophysics 57 (1), 116–125. doi:10.1190/1.1443174
Roger, F., Jolivet, M., and Malavieille, J. (2008). Tectonic Evolution of the Triassic Fold Belts of Tibet. Comptes Rendus Geosci. 340 (2-3), 180–189. doi:10.1016/j.crte.2007.10.014
Roger, F., Jolivet, M., and Malavieille, J. (2010). The Tectonic Evolution of the Songpan-Garzê (North Tibet) and Adjacent Areas from Proterozoic to Present: A Synthesis. J. Asian Earth Sci. 39, 254–269. doi:10.1016/j.jseaes.2010.03.008
Roger, F., Malavieille, J., Leloup, P. H., Calassou, S., and Xu, Z. (2004). Timing of Granite Emplacement and Cooling in the Songpan-Garzê Fold Belt (Eastern Tibetan Plateau) with Tectonic Implications. J. Asian Earth Sci. 22 (5), 465–481. doi:10.1016/S1367-9120(03)00089-0
Royden, L. H., Burchfiel, B. C., King, R. W., Wang, E., Chen, Z., Shen, F., et al. (1997). Surface Deformation and Lower Crustal Flow in Eastern Tibet. Science 276 (5313), 788–790. doi:10.1126/science.276.5313.788
Shive, P. N. (1989). Can Remanent Magnetization in the Deep Crust Contribute to Long Wavelength Magnetic Anomalies. Geophys. Res. Lett. 16 (1), 98–92. doi:10.1029/gl016i001p00089
Song, H. B., and Liu, S. G. (1991). The Relation of Gravity and Aeromagnetic Field and Deep Structure in Middle-Northern Longmenshan Mountains. J. Chengdu Coll. Geology. 18 (1), 74–82. (in Chinese with English abstract).
Spector, A., and Grant, F. S. (1970). Statistical Models for Interpreting Aeromagnetic Data. Geophysics 35, 293–302. doi:10.1190/1.1440092
Tanaka, A., Okubo, Y., and Matsubayashi, O. (1999). Curie point Depth Based on Spectrum Analysis of the Magnetic Anomaly Data in East and Southeast Asia. Tectonophysics 306, 461–470. doi:10.1016/S0040-1951(99)00072-4
Thébault, E., Purucker, M., Whaler, K. A., Langlais, B., and Sabaka, T. J. (2010). The Magnetic Field of the Earth's Lithosphere. Space Sci. Rev. 155 (1-4), 95–127. doi:10.1007/s11214-010-9667-6
Thompson, D. T. (1982). EULDPH: A New Technique for Making Computer‐assisted Depth Estimates from Magnetic Data. Geophysics 47, 31–37. doi:10.1190/1.1441278
Wang, C., Yang, W., Wu, J., and Ding, Z. (2015a). Study on the Lithospheric Structure and Earthquakes in North-South Tectonic Belt. Chin. J. Geophys. 58 (11), 3867–3901. (in Chinese with English abstract). doi:10.6038/cjg20151101
Wang, H., Gao, R., Lu, Z., Li, W., Guo, H., Xiong, X., et al. (2017b). Deep Crustal Structure in Sichuan basin: Deep Seismic Reflection Profiling. Chin. J. Geophys. 60 (8), 2913–2923. (in Chinese with English abstract). doi:10.6038/cjg20170801
Wang, J., Yao, C., Li, Z., Zheng, Y., Shen, X., Zeren, Z., et al. (2020). 3D Inversion of the Sichuan basin Magnetic Anomaly in south china and its Geological Significance. Earth Planets Space 72, 40. doi:10.1186/s40623-020-01167-5
Wang, J., Zhang, G., Li, C., and Liang, S. (2018b). Correlating Seismicity to Curie-point Depth in the Eastern Margin of the Tibetan Plateau. Chin. J. Geophys. 61 (5), 1840–1852. (in Chinese with English abstract). doi:10.6038/cjg2018M0130
Wang, X.-C., Li, X.-H., Li, W.-X., Li, Z.-X., Liu, Y., Yang, Y.-H., et al. (2008). The Bikou Basalts in the Northwestern Yangtze Block, South China: Remnants of 820-810 Ma continental Flood Basalts. Geol. Soc. America Bull. 120 (11-12), 1478–1492. doi:10.1130/B26310.1
Wang, X.-C., Li, X.-H., Li, W.-X., and Li, Z.-X. (2009). Variable Involvements of Mantle Plumes in the Genesis of Mid-neoproterozoic Basaltic Rocks in South China: A Review. Gondwana Res. 15 (3-4), 381–395. doi:10.1016/j.gr.2008.08.003
Wang, X., Zhang, G., Zhou, J., Li, D., Luo, W., Hu, Y., et al. (2018a). Crust and Upper Mantle Electrical Resistivity Structure in the Longmenshan Tectonic belt and its Relationship with the Wenchuan and Lushan Earthquakes. Chin. J. Geophys. 61 (5), 1984–1995. (in Chinese with English abstract). doi:10.6038/cjg2018M0233
Wang, Z., Su, J., Liu, C., and Cai, X. (2015b). New Insights into the Generation of the 2013 Lushan Earthquake (Ms7.0), China. J. Geophys. Res. Solid Earth 120, 3507–3526. doi:10.1002/2014JB011692
Wang, Z., Wang, X., Huang, R., and Liu, G. (2017a). Deep Structure Imaging of Multi-Geophysical Parameters and Seismogenesis in the Longmenshan Fault Zone. Chin. J. Geophsics 60 (6), 2068–2079. (in Chinese with English abstract). doi:10.6038/cjg20170604
Wang, Z., Zhao, D., and Wang, J. (2010). Deep Structure and Seismogenesis of the north-south Seismic Zone in Southwest China. J. Geophys. Res. 115, B12334. doi:10.1029/2010JB007797
Wessel, P., Smith, W. H. F., Scharroo, R., Luis, J., and Wobbe, F. (2013). Generic Mapping Tools: Improved Version Released. Eos Trans. AGU 94 (45), 409–410. doi:10.1002/2013eo450001
Williams, S. E., and Gubbins, D. (2019). Origin of Long-Wavelength Magnetic Anomalies at Subduction Zones. J. Geophys. Res. Solid Earth 124, 9457–9473. doi:10.1029/2019JB017479
Xiong, S., Ding, Y., Li, Z., Zhang, H., Fang, Z., Guo, Z., et al. (2015). Continental Aeromagnetic and Geological Tectonic Characteristics in China. Beijing: Geological Publishing House.
Xiong, S., Yang, H., Ding, Y., and Li, Z. (2016b). Characteristics of Chinese Continent Curie point Isotherm. Chin. J. Geophys. 59 (10), 3604–3617. (in Chinese with English abstract). doi:10.6038/cjg20161008
Xiong, S., Yang, H., Ding, Y., Li, Z., and Li, W. (2016a). Distribution of Igneous Rocks in China Revealed by Aeromagnetic Data. J. Asian Earth Sci. 129, 231–242. doi:10.1016/j.jseaes.2016.08.016
Xiong, S., Yang, H., Liu, Q., Yang, X., Li, Z., and Fu, C. (2020). Imaging the Crustal Structure beneath the Longmenshan Fault Zone and Geodynamics for Wenchuan Mw 7.9 and Lushan Ms 7.0 Earthquakes. Earth Space Sci. Open Archive Epub ahead of print. doi:10.1002/essoar.10504398.1
Xu, X., Xia, Z., and Xia, L. (2002). Volcanic Cycles of the Bikou Group and Their Tectonic Implications. Geol. Bull. China 21 (8-9), 478–485. (in Chinese with English abstract). doi:10.3969/j.issn.1671-2552.2002.08.005
Xu, X., Zuza, A. V. V., Yin, A., Lin, X., Chen, H., and Yang, S. (2020). Permian Plume-Strengthened Tarim Lithosphere Controls the Cenozoic Deformation Pattern of the Himalayan-Tibetan Orogen. Geology 49 (1), 96–100. doi:10.1130/G47961.1
Yan, Y., Teng, J., Run, X., and Hu, G. (2016). Aeromagnetic Field Characteristics and the Wenchuan Earthquakes in the Longmenshan Mountains and Adjacent Areas. Chin. J. Geophys. 59 (1), 197–214. (in Chinese with English abstract). doi:10.6038/cjg20160117
Yao, C., Guan, Z., Gao, D., Zhang, X., and Zhang, Y. (2003). Reduction to the Pole of Magnetic Anomalies at Low Latitude with Suppression Filter. Chin. J. Geophys. 46 (5), 690–696. (in Chinese with English abstract). doi:10.1002/cjg2.418
Zhang, C. (2003). Deduction of Magnetic Characteristics of Lithosphere in China from Results on Satellite and Aeromagnetic Measurements. Prog. Geophys. 18 (1), 103–110. (in Chinese with English abstract). doi:10.3969/j.issn.1004-2903.2003.01.017
Zhang, H.-F., Zhang, L., Harris, N., Jin, L.-L., and Yuan, H. (2006). U-pb Zircon Ages, Geochemical and Isotopic Compositions of Granitoids in Songpan-Garze Fold belt, Eastern Tibetan Plateau: Constraints on Petrogenesis and Tectonic Evolution of the Basement. Contrib. Mineral. Petrol. 152, 75–88. doi:10.1007/s00410-006-0095-2
Zhang, J., Gao, R., Li, Q., Ye, G., Wang, H., and Wenhui, L. (2013). Characteristic of Gravity and Magnetic Anomalies in the Daba Shan and the Sichuan basin, China: Implication for Architecture of the Daba Shan. Acta Geol. Sinica 87 (4), 1154–1161. doi:10.1111/1755-6724.12117
Zhang, J., Gao, R., Zeng, L., Li, Q., Guan, Y., He, R., et al. (2009). Relationship between Characteristics of Gravity and Magnetic Anomalies and the Earthquakes in Longmenshan Range and Adjacent Areas. Chin. J. Geophys. 52 (2), 572–578. (in Chinese with English abstract).
Zhang, J., Gao, R., Zeng, L., Li, Q., Guan, Y., He, R., et al. (2010). Relationship between Characteristics of Gravity and Magnetic Anomalies and the Earthquakes in the Longmenshan Range and Adjacent Areas. Tectonophysics 491, 218–229. doi:10.1016/j.tecto.2009.12.004
Zhang, L., Li, H., Sun, Z., and Cao, Y. (2019). A Review of Rock Magnetism for Fault Rocks. Acta Geoscientica Sinica 40 (1), 157–172. (in Chinese with English abstract). doi:10.3975/cagsb.2018.10902
Zhang, P.-Z. (2013). A Review on Active Tectonics and Deep Crustal Processes of the Western Sichuan Region, Eastern Margin of the Tibetan Plateau. Tectonophysics 584, 7–22. doi:10.1016/j.tecto.2012.02.021
Zhang, P., Xu, X., Wen, X., and Ran, Y. (2008a). Slip Rate and Recurrence Intervals of the Longmen Shan Active Fault, and Tectonic Implications for the Mechanism of the May 12 Wenchuan Earthquake. Chinses J. Geophys. 51 (4), 1066–1073. (in Chinese with English abstract). doi:10.3321/j.issn:0001-5733.2008.04.015
Zhang, P., Zhou, Z., Xu, C., and Zhang, Q. (2008b). Geochemistry of Pengguan Complex in the Longmenshan Region, Westen Sichuan Province, SW China: Petrogenesis and Tectonic Implications. Geotectonica et Metallogenia 32 (1), 105–116. (in Chinese with English abstract). doi:10.3969/j.issn.1001-1552.2008.01.014
Zhang, X., Hu, X.-F., Shen, J.-X., Tian, C.-Z., Zhao, L., Liu, M., et al. (1996). Study of Curie Isothermal Surface in Sichuan Basin and the Seismic Area on its Western Margin. Acta Seismologica Sinica 9, 109–116. (in Chinese). doi:10.1007/bf02650629
Zhang, Y., Yang, N., Shi, W., and Dong, S. (2008c). Neotectonics of Eastern Tibet and its Control on the Wenchuan Earthquake. Acta Geologica Sinica 82 (12), 1668–1678. (in Chinese with English abstract). doi:10.3321/j.issn:0001-5717.2008.12.004
Zhao, G., Liu, J., Chen, B., Kaban, M. K., and Zheng, X. (2020). Moho beneath Tibet Based on a Joint Analysis of Gravity and Seismic Data. Geochem. Geophys. Geosyst. 21, e2019GC008849. doi:10.1029/2019GC008849
Zhou, M.-F., Yan, D.-P., Wang, C.-L., Qi, L., and Kennedy, A. (2006b). Subduction-related Origin of the 750 Ma Xuelongbao Adakitic Complex (Sichuan Province, China): Implications for the Tectonic Setting of the Giant Neoproterozoic Magmatic Event in South China. Earth Planet. Sci. Lett. 248, 286–300. doi:10.1016/j.epsl.2006.05.032
Zhou, M. F., Kennedy, A. K., Sun, M., Malpas, J., and Lesher, C. M. (2002b). Neoproterozoic Arc‐Related Mafic Intrusions along the Northern Margin of South China: Implications for the Accretion of Rodinia. J. Geology. 110, 611–618. doi:10.1086/341762
Zhou, M. F., Ma, Y., Yan, D., Xia, X., Zhao, J., and Sun, M. (2006a). The Yanbian Terrane (Southern Sichuan Province, SW China): a Neoproterozoic Arc Assemblage in the Western Margin of the Yangtze Block. Precambrian Res. 144, 19–38. doi:10.1016/j.precamres.2005.11.002
Keywords: magnetic anomaly, longmenshan fault zone, curie point depth, magnetic basement, west margin of the Yangtze block
Citation: Lei Y, Jiao L, Tu J, Zhao J and Huang Q (2022) Magnetic Structure and its Tectonic Implication Around Longmenshan Fault Zone Revealed by EMAG2v3. Front. Earth Sci. 10:848824. doi: 10.3389/feart.2022.848824
Received: 05 January 2022; Accepted: 25 January 2022;
Published: 04 March 2022.
Edited by:
Lei Wu, Zhejiang University, ChinaCopyright © 2022 Lei, Jiao, Tu, Zhao and Huang. This is an open-access article distributed under the terms of the Creative Commons Attribution License (CC BY). The use, distribution or reproduction in other forums is permitted, provided the original author(s) and the copyright owner(s) are credited and that the original publication in this journal is cited, in accordance with accepted academic practice. No use, distribution or reproduction is permitted which does not comply with these terms.
*Correspondence: Liguo Jiao, bGdqaWFvQGNlYS1pZ3AuYWMuY24=
Disclaimer: All claims expressed in this article are solely those of the authors and do not necessarily represent those of their affiliated organizations, or those of the publisher, the editors and the reviewers. Any product that may be evaluated in this article or claim that may be made by its manufacturer is not guaranteed or endorsed by the publisher.
Research integrity at Frontiers
Learn more about the work of our research integrity team to safeguard the quality of each article we publish.