 Baohua Guo
 Tan Cheng
 Jiehao Sun1
94% of researchers rate our articles as excellent or good
Learn more about the work of our research integrity team to safeguard the quality of each article we publish.
Find out more
ORIGINAL RESEARCH article
Front. Earth Sci., 14 July 2022
Sec. Geohazards and Georisks
Volume 10 - 2022 | https://doi.org/10.3389/feart.2022.848440
This article is part of the Research TopicRecent Advances in Mechanics and Physics of Rock Fractures across ScalesView all 7 articles
The degradation of shear mechanical properties of rock fracture surfaces was determined after applying multiple dry-wet cycles. Artificially fractured feldspathic sandstone specimens were soaked in chemical solutions with pH values of 2, 7, and 12 for 3, 6, 9, 12, and 15 dry-wet cycles, followed by direct shear tests under normal stresses of 3, 6, 9, 12, and 15 MPa. The results showed that the pre-peak shear stiffness and peak shear strength of the fracture surfaces decreased, and the peak shear displacement increased progressively after cumulative dry-wet cycling treatments compared to the behavior of oven-dry rock fractures. Additionally, the pre-peak shear stiffness, peak shear strength, peak shear displacement, and residual shear strength decreased cumulatively as the number of dry-wet cycles increased. However, the chemistry of the wetting solution had little effect on mechanical behavior. Based on the Barton formula for describing the peak shear strength for rock fractures, an empirical formula for peak shear strength for irregular rock fractures under dry-wet cycling conditions is proposed by introducing a proportionality factor to describe the degree of deterioration of the rock fracture surface shear strength. The modified formula has a good fitting accuracy for the test shear strength data of sandstone fractures under dry-wet cycling conditions, which may assist in the practical estimation of the peak shear strength of rock fractures under dry-wet cycling conditions in engineering practice.
Rock masses are characterized by the presence of variously orientated structurally weak planes, such as joints and faults, and their mechanical properties are affected by the surrounding physico-chemical environment, particularly pore fluids (Han et al., 2016). The influence of the physical and chemical action of pore water on rock strength is mainly related to the microscopic structure characteristics of the rock itself, such as the geometric size of the grains and pores, the existence of clay minerals, and the contact of particles. The effective pressure (total pressure minus pore fluid pressure) is a well-known key parameter (e.g., Rutter, 1972; Hadizadeh and Law 1991; Baud et al., 2000; Yang et al., 2014) and chemical interactions between mineral phases and pore fluids can have a significant effect on the deformation and strength of the rock mass (e.g., Rehbinder and Lichtman 1957; Colback and Wiid 1965; Burshtein 1969; Rutter 1972; Karfakis and Akram, 1993; Feng et al., 2001; Lu et al., 2014; Lu et al., 2017). In terms of hydro-physical effects, the dissolution effect of water in rock reduces its physical and mechanical properties by reducing the interconnection between the mineral particles and the effectiveness of the confining pressure (Huang et al., 2020). Experimental studies have shown that the decrease in P-wave velocity and increase in porosity with increasing number of dry-wet cycles increase the damage level of sandstone specimens. The overall effect is a tendency for cohesion to decline as the number of dry-wet cycles increases. Cohesion may decrease significantly (e.g., by 42.6% from 8.2 to 4.7 MPa), even after the first dry-wet cycle (Zhang et al., 2014). The water-chemical effect on rock appears to be related to a change in the pH of the chemical solution, relative to deionized water, whether for acidic or alkaline solutions (Lin et al., 2020). From microscopic analysis, specimens have been found to have been corroded by the acidic and alkaline solutions. This enhances the development of pores and cracks, and leads to a consequent decline of the physical and mechanical properties of the rock (Huang et al., 2020).
Previous studies have also shown that the strength and deformation of rock can be affected simply by increasing the moisture content, measured as relative humidity (e.g., Colback and Wiid, 1965; Burshtein 1969; Hawkins and McConnell, 1992; Erguler et al., 2009). In addition, the sensitivity of sandstone to water depends both on the effective porosity of the rock and grain size (Vásárhelyi and Ván, 2006). The uniaxial compressive strength of rock is generally reduced in the presence of water (e.g., Rehbinder and Lichtman 1957; Baud et al., 2000). For example, the uniaxial compressive strength of limestones in the presence of water reduced from 5 to 17% (Rutter 1972). Several mechanisms of the water-weakening effect have been proposed, including a decrease of surface fracture energy with wetting, decreasing capillary tension, stress corrosion, friction reduction, and chemical degradation (e.g., Van Eeckhout 1976; Silva et al., 2008; Huang et al., 2010).
Many studies have shown that slope and dam foundation instabilities are often caused by the failure of weakened structural planes, and more than 90% of rock slope landslide accidents are related to water (Fang et al., 2019). A rock mass in a zone of fluctuating water saturation or pore pressure variation is periodically in an environment of alternating wetting and drying cycles thanks to the rise and fall of the reservoir water level, and will be damaged to a certain degree in each dry-wet cycle. As the number of dry-wet cycles increases, the damage sustained by the rock mass will continue to accumulate and develop, and may eventually lead to instability in the reservoir’s bank slope.
To aid evaluation of the stability of reservoir bank slopes under dry-wet cycling conditions, many scholars have studied the mechanical properties and failure mechanisms of intact rock masses under dry-wet cycling conditions. Many experimental studies have shown that dry-wet cycling has an irreversible effect on various types of rocks (e.g., Hale et al., 2003; Deng et al., 2013). The compressive strength, cohesion, and internal friction angle of rocks may show varying degrees of decrease under the same dry-wet cycles (Deng et al., 2012). For example, 10 dry-wet cycles were found to be critical for the rapid decline of the uniaxial compressive strength of sandstone (Huang et al., 2020), while the uniaxial compressive strength of water-saturated sandstone was only 80% of dry sandstone after 60 dry-wet cycles (Lin et al., 2005). This deleterious effect on rock strength can, over time, reduce the resistance to failure of contacts between mineral particles and enhance microcrack growth, which can eventually result in a decrease in overall rock strength (Liu X. et al., 2017).
The above research mainly focuses on the uniaxial or triaxial compressive strength of otherwise intact rock under dry-wet cycling conditions. However, it does not focus on the influence of water-rock interactions on the resistance to shear failure across pre-existing planes of weakness, such as joints and faults in rocks. In fact, the stability of a rock slope is mostly determined by the shear strength of its weakness planes. Water-rock interaction leads to a decrease in fracture bearing capacity, which is more likely to cause landsliding of fractured rock slopes. As with intact rock failure, elevated pore fluid pressures are known to promote frictional slip across weakness planes through the effective pressure effect, but the mere presence of water in a weak plane and its ionic chemistry can also promote the reduction of the cohesive strength of the rock fractures. Several studies have indicated that the peak shear strength of dry fractures is usually greater than that of saturated fractures when other conditions are the same (e.g., Pellet et al., 2013; Zhao et al., 2017; Li et al., 2020). Compared with a pure water environment, the peak shear strength of sandstone fractures further decreased by 25.5 and 43.2%, respectively, when the ionic concentration of a hydrofluoric acid (HF) pore solution concentration was 1 and 3% (Xia et al., 2019). The time duration of soaking in water also affects the shear mechanical properties of rock fractures. For example, the peak shear strength of sandstone fractures decreased by 20∼24% after 1 day of soaking in deionized water, and decreased by approximately 50% after 32 days of soaking (e.g., Zhao et al., 2017; Tang et al., 2019). In the study of the mechanical properties of jointed rocks in acidic and alkaline solutions, most studies used extreme pH values, such as pH=2 or pH=12 (e.g., Han et al., 2013; Chen et al., 2019). This range of pH is rather large compared to the more typical range of pH values that are encountered in the upper crust of the Earth (i.e., 5.5–8.5). Although these weaker solutions are not expected to produce large amounts of dissolution reactions in rocks, the extreme range potentially enhances chemo-mechanical effects that might be attributable to pH variations and shortens the time-scale over which they may be seen.
In summary, while the uniaxial compressive strength of intact rock under dry-wet cycling conditions and the shear strength of rock fractures under the action of single-pass soaking in an aqueous ionic solution have been studied previously, the effects of loading on fracture planes in shear during repeated cycles of soaking and drying is not well known. From limited previous studies, it is known that the peak shear strength, friction angle, and cohesive strength of the rock fractures may decrease as the number of dry-wet cycles increases under low normal stress (0.5∼4.0 MPa) (Tang et al., 2021). However, the shear mechanical properties of irregular natural rock fractures under higher normal stresses are less well understood. Therefore, this paper will describe direct shear tests on sandstone fractures under high normal stresses combined with dry-wet cyclic conditions. The aim is to establish an empirical formula relating the peak shear strength of irregular rock fractures to interfacial normal stress under these conditions.
The sandstone samples that were used in the tests were obtained from a quarry in Sichuan Province, China. The samples were fresh and unweathered, with a medium to fine-grained sandy texture. Mineralogy, particle size, and rock texture were studied in standard optical thin sections using an Axio Imager M2 polarizing microscope (Figure 1). Mineralogy is dominated by quartz (∼70%), followed by feldspar (∼25%) and muscovite (∼5%). The modal analysis results were converted into volume fractions using published values for mineral densities and were used to calculate the average grain density of the rock. Table 1 shows the physical parameters of 10 prepared specimens. The density of the oven-dried intact rock was measured to be 2,384.9 kg/m3±18.2 kg/m3. Together with the grain density (2,645 kg/m3), the average porosity of the rock is 9.84 ± 1.36%. Figure 1 shows the sample grains to be angular, with grain sizes predominantly within the range of 0.2∼0.3 mm. They showed no preferred alignment, were mostly sub-angular to sub-rounded, and were moderately well-sorted. The grains show evidence of compaction by pressure solution, with a small amount of siliceous cement between the grains. This rock may be termed an arkosic sandstone based on its composition and texture. With respect to a pure quartz sandstone, a feldspathic sandstone is expected to be more susceptible to damage from chemical interactions with ionic solutions.
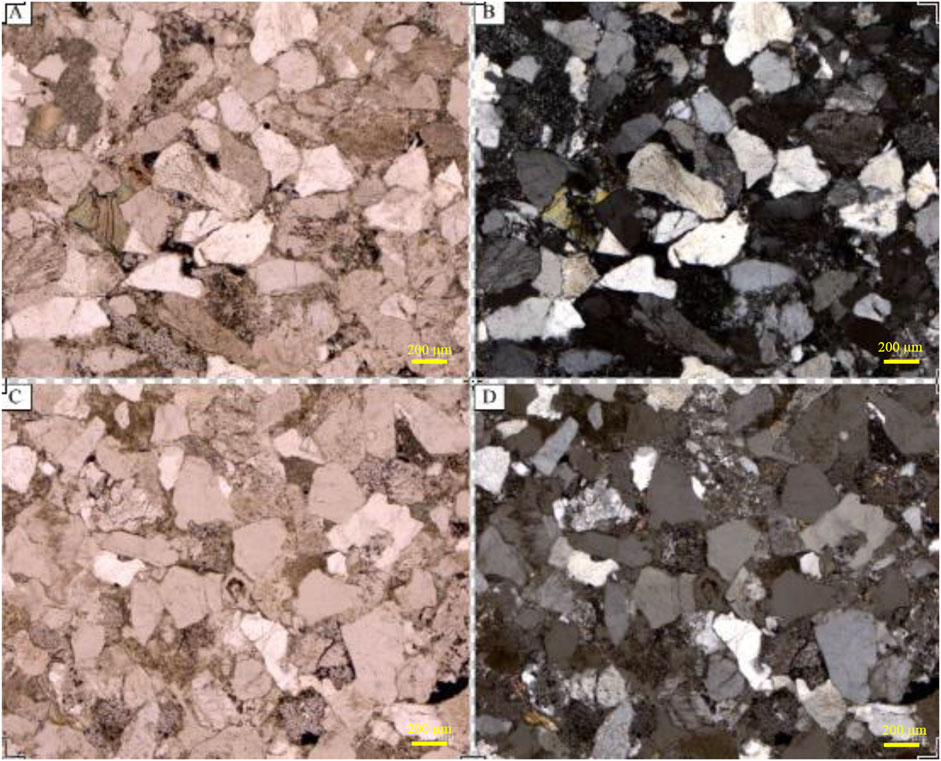
FIGURE 1. Standard thin sections illustrating the microstructure of the sandstone samples. In each case, the width of the image is 2.50 mm. (A,B) are of the same area, (A) is taken with plane-polarized light and (B) is taken between crossed polars. (C,D) are of a different area; (C) is under plane-polarized light and (D) is between partially crossed polars. In (D), quartz grains are clear and range from white to mid- and light-grey (according to their crystallographic orientation), feldspars (grey) show clouding due to chemical alteration, and interstitial clusters of finer-grained muscovite can be seen.
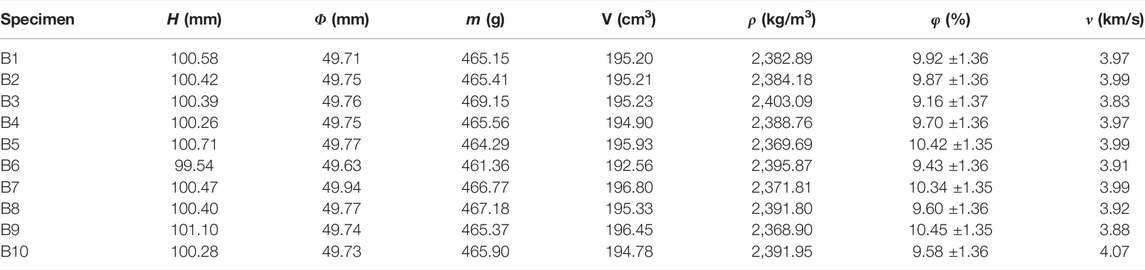
TABLE 1. Physical parameters of sandstone specimens including height of specimen H, diameter Φ, quality m, volume V, density ρ, porosity φ, and longitudinal wave velocity ν.
Standard intact cylindrical specimens with sizes of Φ 50 mm × 100 mm length and Φ 50 mm × 25 mm length were prepared through drilling, sawing, and grinding. To ensure textural homogeneity between the prepared specimens, the longitudinal wave velocity and mass of each specimen were tested before the experiment. A UTA-2000A ultrasonic testing analyzer was used to obtain the longitudinal wave velocity of the rocks, with a sensor frequency of 35 kHz, a sampling frequency of 10 MHz, and a time accuracy of 0.1 μs. The experimental results for these specimens are shown in Table 1. Specimens with longitudinal wave velocities of 3952 m/s ± 118 m/s and masses of 465 ± 5 g were selected for each experiment. A total of 10 standard intact cylindrical specimens with dimensions Φ50 mm × 100 mm length, were used: five for unconfined compression tests and five for triaxial compression tests. A further five specimens of Φ50 mm × 25 mm length were prepared for Brazilian splitting tests.
For the direct shear tests, 85 cylindrical specimens of dimensions Φ50 mm × 100 mm length were prepared by making a rough tensile fracture normal to the cylinder axis near the midpoint of each specimen. Fracturing was done using a homemade specimen splitting tool (Cheng et al., 2022). For each specimen, a tensile fracture was made near the axial midpoint using a NYL-60 pressure testing machine, as shown in Figure 2. The splitting device consists of two identical steel plates bearing cylindrical grooves. A rectangular groove perpendicular to the specimen axis is set at the midpoint in the axial direction of each cylindrical groove and a steel bar with a triangular section was placed in the rectangular groove. When the splitting device wrapped the specimen, the concentrated linear load provided by the upper and lower steel bars produced a tension fracture in the specimen. The preparation process is shown in Figure 2. All of the prepared specimens were stored in an oven before shear testing.
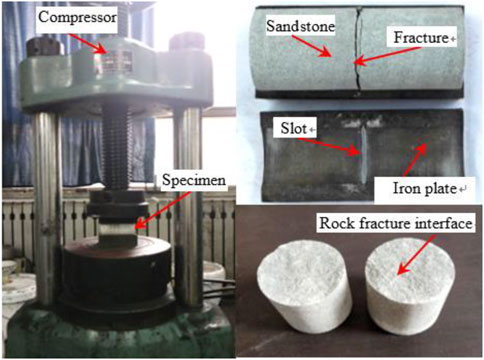
FIGURE 2. Preparation method for rock fracture.
A total of 75 shear tests were carried out on 15 groups of specimens, each group was treated with different dry-wet cycles in three kinds of pH soaking solutions. Five fractured specimens in each group were subjected to direct shear tests under five normal stresses (3, 6, 9, 12, and 15 MPa). To avoid the influence of different moisture contents on the shear test results while they were conducted, the specimens after dry-wet cycling treatment were oven-dried before the shear test. In addition, 10 fractured specimens were tested after oven drying treatment and taken as the reference group, with each test under given conditions being carried out twice.
The shear tests were carried out under constant normal stress (CNL) boundary conditions, and the specific shear test procedure was as follows: 1) the normal stress was applied up to the set value from zero in the load control mode; 2) the tangential load was applied in the displacement control mode with a shear rate of 1 mm/min; and 3) the shear process was controlled by the servo system to maintain a constant normal stress and the test was terminated when the shear displacement reached 8 mm. Four parameters were recorded (i.e., normal stress, normal displacement, shear stress, and shear displacement) in each shear test.
Water-rock interactions are usually a long-term process in practical rock engineering. However, it is difficult to obtain a substantial water-rock interaction effect simply by soaking in water for a long period of time. Therefore, the acidity and alkalinity of the soaking solution, and the ion concentration were enhanced, as proposed by Han et al. (2013) and Chen et al. (2019), to enhance the corrosion effect on the specimen in the short term during the dry-wet cycling. A set of NaSO4 solutions with different pH values (i.e., 2, 7, and 12) were prepared as follows. A standard NaSO4 0.1 mol L−1 solution was added into distilled water with pH = 7 to form a neutral solution. The pH = 2 acidic solution was prepared by titrating HCl solution into the neutral solution until the pH value was 2. The pH = 12 alkaline solution was prepared by titrating NaOH solution into the neutral solution until the desired pH was attained.
In this study, the specimen was soaked using the natural immersion method (e.g., Lin et al., 2005; Khanlari and Abdilor, 2015; Momeni et al., 2017). The specimen was completely immersed in chemical solution, with a rock to solution volume ratio of 1:2, with a sealed plastic wrap to prevent contact with the outside air. After soaking for 24 h, the pH value of the chemical solution in contact with the rock specimen was tested using a pH meter and then the specimen was removed. The free surface fluid on the specimen was removed by water absorption onto a filter paper and was then dried in an oven at 105°C for 24 h, which formed a dry-wet cycling event. For each of the three kinds of soaking solutions prepared, with pH values of 2, 7, and 12, five groups of specimens were subjected to 3, 6, 9, 12, and 15 dry-wet cycles, respectively. There were five specimens in each group, thus a total of 75 specimens in 15 groups were used to investigate the influence of the dry-wet cycle number and soaking solution pH value on the shear mechanical properties of the rock fracture.
When studying the influence of pore fluids on the failure of intact rocks, it is usual to vacuum-impregnate the specimen with the fluid to ensure that the fluid accesses all of the pores. However, in this study we are only interested in the effect of the various wetting fluids on the shear behavior of the exposed surface of the rock. Therefore, it was not considered necessary to submit each specimen to vacuum impregnation, which would have been inordinately time-consuming.
After dry-wet cycling treatment of the fractured sandstone specimens, the fracture surface morphology of each specimen was obtained using a Tianyuan OKIO-400 3D scanner (Cheng et al., 2022). This 3D scanner controls the scanning accuracy of fracture morphology using the global error control module. The average scanning resolution is 0.02∼0.03 mm in the vertical direction, the average sampling point spacing is 0.31∼0.15 mm, and the maximum scanning area is 400 mm× 300 mm. After scanning using the scan-line pattern shown in Figure 3, the 3D morphology parameters of each fracture were obtained by processing the scanning data, as illustrated in Figure 4.
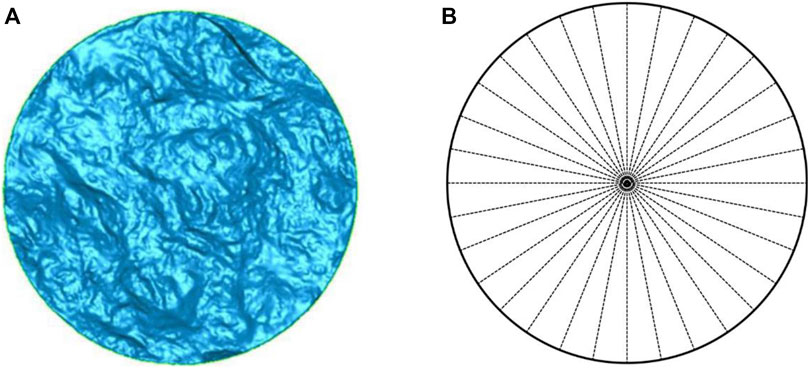
FIGURE 3. (A) Morphological contrast image of a fracture surface (view normal to surface) derived from the scan-line pattern illustrated in (B). The diameter of the fractured sample is 50.0 mm.
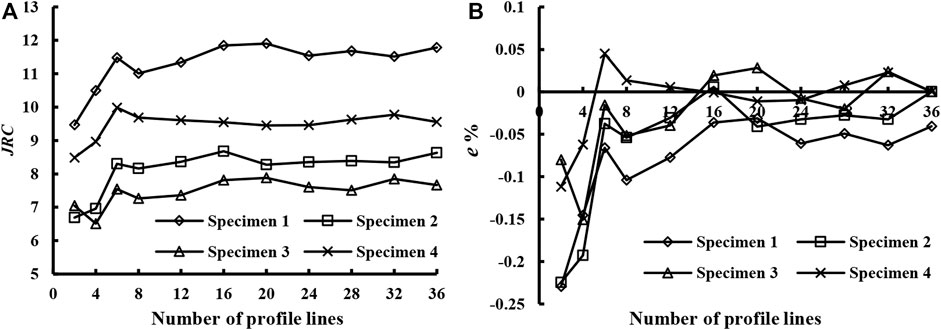
FIGURE 4. (A) Relationship between the joint roughness coefficient JRC and the number of profile lines measured. (B) The relationship between the JRC relative error and the number of profile lines. The error value is low and stable after about 16 profile lines have been completed.
The calculation process to obtain the fracture roughness coefficient (JRC) is as follows:
The root mean square of slope Z2 of each profile line (Figure 3B) was calculated using:
where yi is the height coordinate of the fracture surface profile line at sampling point i, l is the number of data points, and Δx is the interval between data points.
Each 2D Z2i of the profile line was substituted into Equation 2 (Yang et al., 2001) to calculate the roughness JRCi of each fracture surface profile line:
where Z2i is the root mean square of the slope of the ith fracture surface profile line and JRCi is the roughness coefficient of the ith fracture surface profile line.
Finally, the roughness coefficient JRC of the whole fracture surface was obtained with Eqn. 3:
where m is the total number of fracture surface profile lines.
The accuracy of the JRC characterization of fracture roughness is related to the number of the profile lines. The average roughness coefficients JRC calculated from different numbers of profile lines from four specimens are shown in Figure 4A. It can be seen that JRC first increases rapidly and then tends to be stable with the increase of the number of intercepted profile lines m. When the number of profile lines is greater than 16, JRC varies only slightly. The relative errors of JRC determined by different number of profile lines calculated using Eqn. 4 are shown in Figure 4B:
where e is the relative error, %; JRCm is the JRC value obtained by intercepting m profile lines; and JRC36 is the JRC value obtained from 36 profile lines.
It can be seen from Figure 4B that when the number of profile lines exceeds 16, the calculation error is less than ±5%, and the accuracy is relatively high. Therefore, this study uses 16 profiles to calculate the fracture roughness coefficient JRC.
Uniaxial compression, conventional triaxial compression, and Brazilian splitting tests on sandstone were carried out using an RMT-150B rock mechanics test system. The axial displacement was measured by a displacement sensor with a measuring range of 5 mm, and the axial load was measured by a force sensor with a measuring range of 1000 kN. For the Brazilian splitting tests, a more sensitive force sensor with a measuring range of 100 kN was employed. The displacement control mode was used in tests with an axial loading rate of 0.002 mm/s and a confining pressure loading rate of 0.1 MPa/s. Based on five repeated uniaxial compression tests, triaxial compression tests, and Brazilian splitting tests, the basic mechanical parameters of the sandstone specimens were obtained, as shown in Table 2. These comprise the uniaxial compressive strength σc, tensile strength σt, cohesion c, internal friction angle φ0, Poisson’s ratio μ, and elastic modulus E. In addition, the basic sliding friction angles φb of the rock fractures obtained by a tilt test of three standard cylinder specimens (Li et al., 2019) are also listed in Table 2.

TABLE 2. Mechanical properties of sandstone specimens, including uniaxial compressive strength σc, tensile strength σt, cohesion c, internal friction angle φ0, Poisson’s ratio μ, elastic modulus E, and basic sliding friction angle φb.
An RDS-200 rock direct shear apparatus (Guo and Dong, 2019) produced by Geotechnical Consulting and Testing Systems (GCTS), as shown in Figure 5, was used for the direct shear tests. The direct shear apparatus provides normal and shear loads using an electrohydraulic servo control system. The maximum tangential and normal loads are 10 and 5 tonnes, respectively, and the load precision is 0.01 kN. The maximum tangential and normal strokes are 25 and 24 mm, respectively, and the displacement accuracy is 0.001 mm.
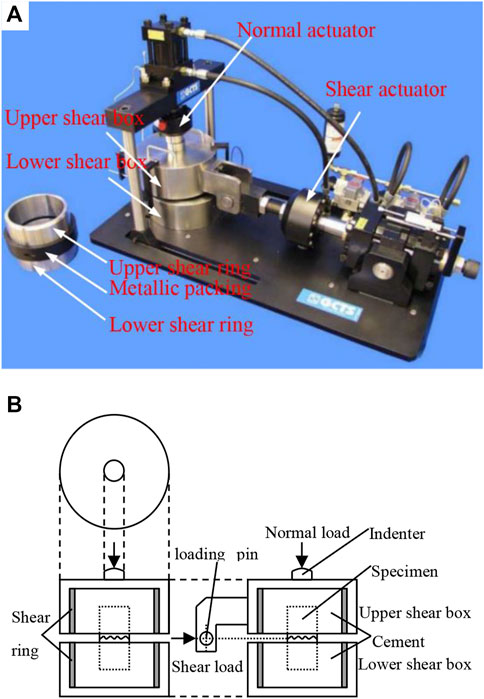
FIGURE 5. (A) RDS-200 direct shear testing system. (B) Schematic sketch of the sample holder in the direct shear apparatus, Plan view (top left-hand panel), front elevation (bottom left-hand panel), side elevation (bottom right-hand panel). The diameter of the rock specimen is 50.0 mm.
The mechanical tests on the intact rock specimens were carried out to provide a baseline comparison with the results of the direct shear tests. The results of these tests are summarized in Table 2. The detailed results that are presented in this section relate to the direct shear tests on specimens that were given different soaking treatments.
The Appendices 1–4 show the shear stress-shear displacement curves obtained from direct shear tests on sandstone fractures under the oven-dry state and dry-wet cycling conditions.
Figure 6 illustrates the general form of a typical shear stress-shear displacement curve. The peak shear stress τp is the maximum shear stress on the curve; the peak shear displacement up is the shear displacement corresponding to the peak shear stress; the pre-peak shear stiffness ks is the slope of the approximately straight-line part of the curve before the peak; and the residual strength τr is the shear stress value when it is roughly stable.
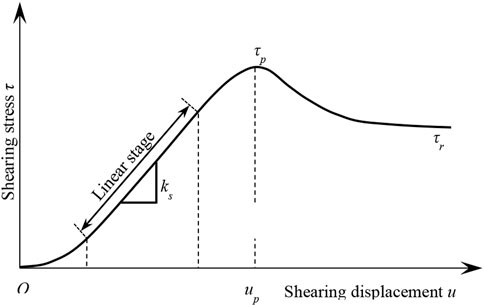
FIGURE 6. Typical form of a shear stress—shear displacement curve for shearing of a fractured sample. τp = peak shear stress; ks = pre-peak shear stiffness; τr = residual shear strength.
Table 3 presents the shear mechanical parameters and test conditions of sandstone fractures in the oven-dry state (tests D1∼D10) and under dry-wet cycling conditions (tests B1∼B75). The following parameters are tabulated: chemical solution pH value, number of dry-wet cycles N, applied normal stress σn, peak shear strength τp, pre-peak shear stiffness ks, peak shear displacement up, residual shear strength τr, and fracture roughness coefficient JRC.
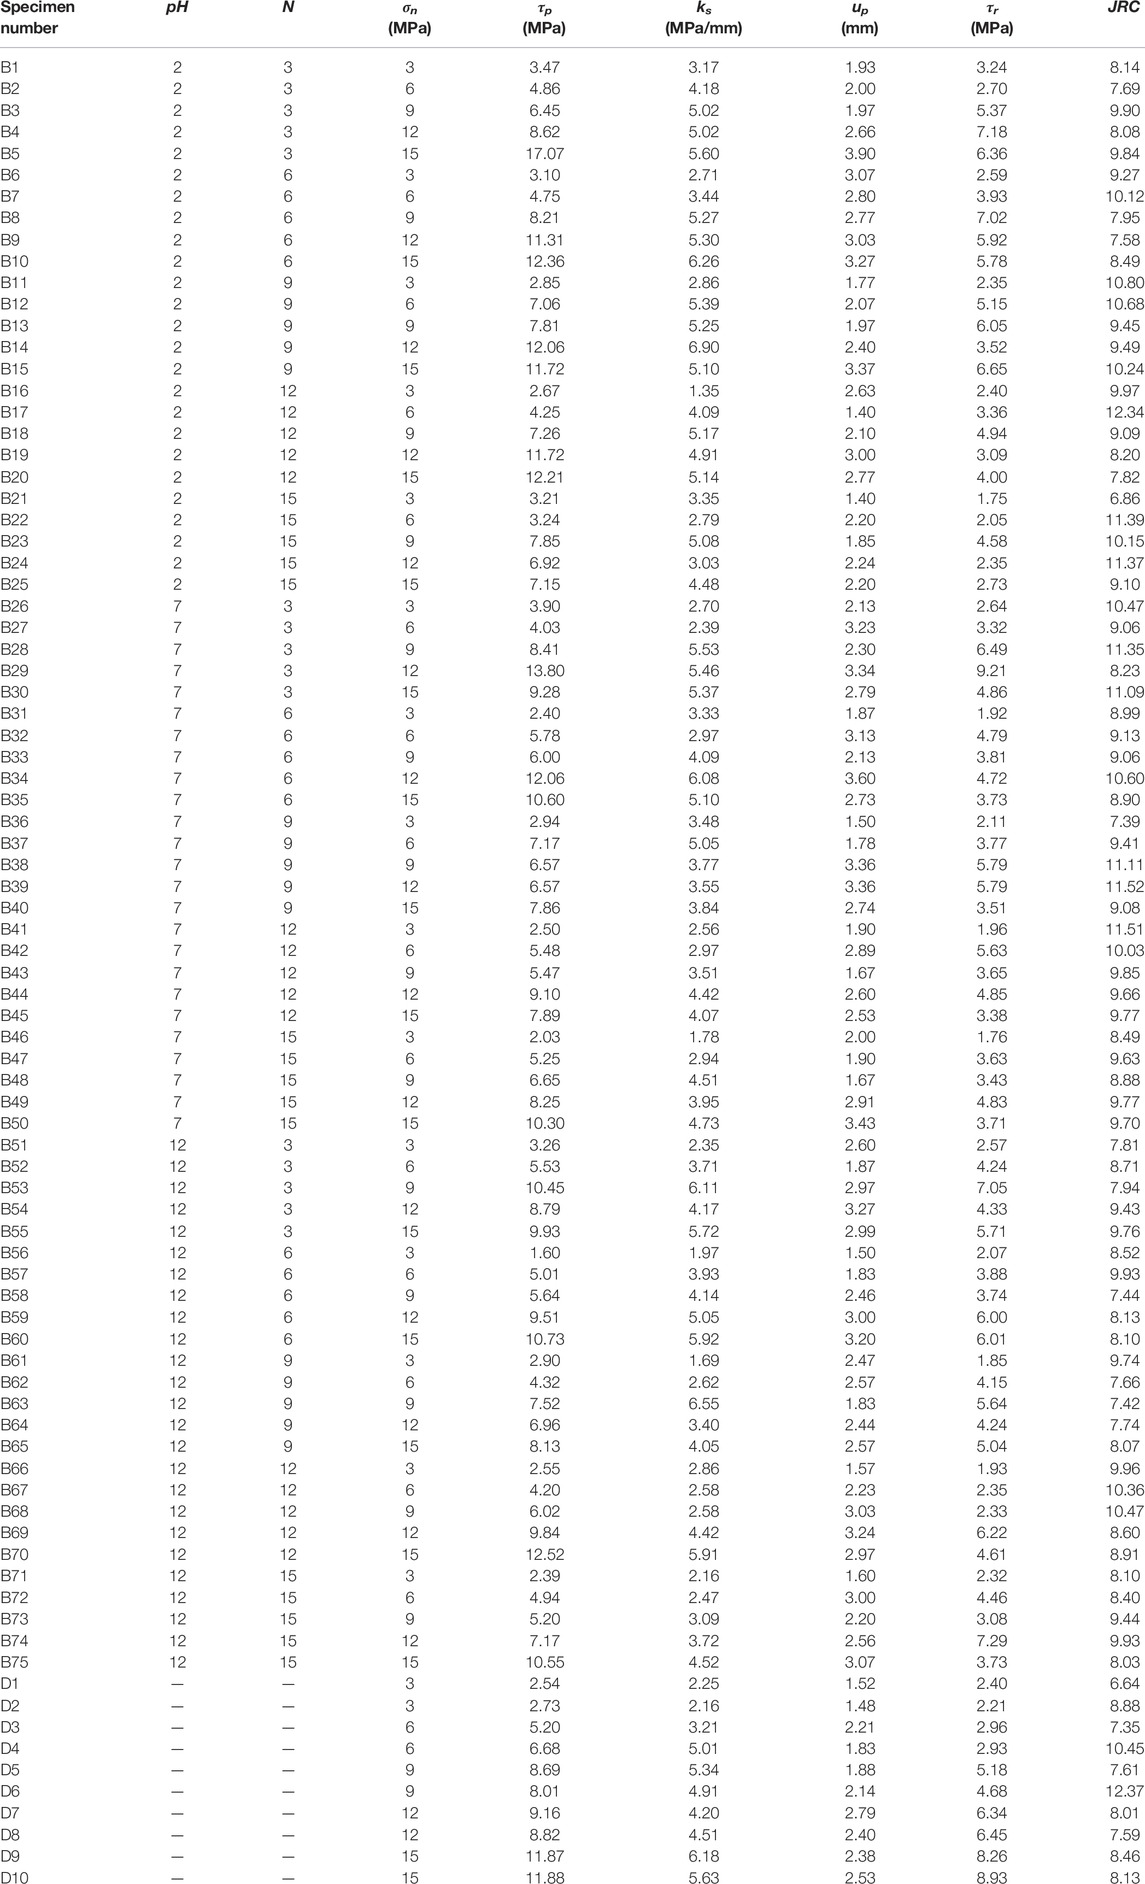
TABLE 3. Shear mechanical parameters of the rock fracture under dry-wet cycling treatment (specimen numbers prefixed B) and the oven-dry state (specimen numbers prefixed D), including chemical solution pH value, number of dry-wet cycles N, applied normal stress σn, peak shear strength τp, pre-peak shear stiffness ks, peak shear displacement up, residual shear strength τr, and fracture roughness coefficient JRC.
The form of the shear stress versus shear displacement curves is similar to the general schematic shown in Figure 6 in all cases, with a well-developed peak stress after an elastic loading stage, followed by a progressive decay of the shear bearing load towards a steady value of sliding friction (residual strength) as the asperities are fractured and the slip surface evolves. Pre-peak shear stiffness, peak shear stress, and residual shear stress all increase with normal stress. The data that are plotted in Figure 7 are drawn from the experimental data presented in the Appendices 1–4 and in Table 3. This figure shows how the peak shear strength, pre-peak shear stiffness, peak shear displacement and residual shear strength of the rock fractures in the oven-dry state and under dry-wet cycling conditions vary under different normal stresses. In Figure 7, the parameter subscript p refers to a peak value, u indicates that no dry-wet cycling treatment was applied, w refers to measurements made after dry-wet cycling treatment, and ave indicates an average value.
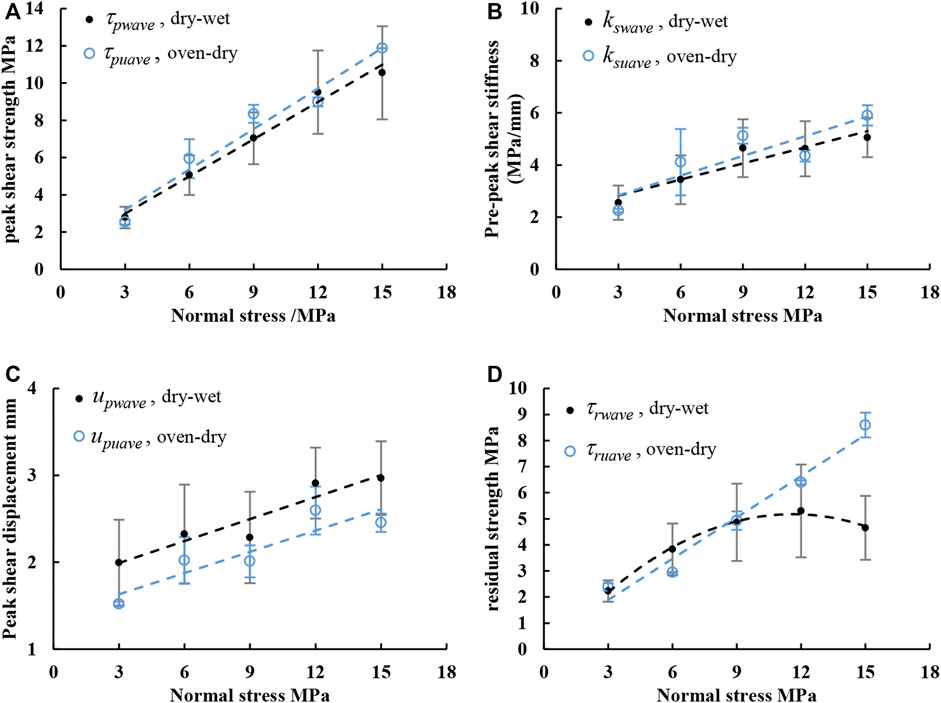
FIGURE 7. Comparison of the shear mechanical parameters of rock fractures under oven-dry conditions and under dry-wet cycling conditions. (A) Peak shear strength vs normal stress. (B) Pre-peak shear stiffness vs normal stress. (C) Peak shear displacement vs. normal stress. (D) Residual shear strength vs. normal stress. The peak shear strength, pre-peak shear stiffness, peak shear displacement, and residual strength are, respectively, expressed as τpu, ksu, upu, and τru in the oven-dry state, and their average values under the same normal stresses are respectively expressed as τpuave, ksuave, upuave, and τruave. These parameters are expressed as τpw, ksw, upw, and τrw, respectively, for shear sliding under dry-wet cycling conditions, and their average values are expressed as τpwave, kswave, upwave, and τrwave, respectively.
From the shear mechanical parameters following dry-wet cycling treatment, we can observe:
1) Figure 7A shows that τpuave is higher than τpwave under each same normal stress. The dry-wet cycling is inferred to change the mineral particle structure, weaken the connectivity between particles, and promote the generation and expansion of microcracks on the sandstone fracture surfaces, as proposed by Huang et al. (2020). This accumulated damage in sandstone is inferred to lead to the observed deterioration of the peak shear strength of fractures. Figure 7A also shows that the difference between the trend lines of τpuave and τpwave. This implies that the greater the normal stress, the more evident is the deterioration effect of dry-wet cycling on the peak shear strength. This is inferred to indicate that higher normal stress enhances the development and growth of microcracks and meso-scale cracks in sandstone fractures, which result in a decrease in the shear bearing capacity of the fractures.
2) Figure 7B shows that, for a given normal stress, kswave is less than ksuave. This indicates that the dry-wet cycling leads to a deterioration of shear stiffness. In addition, the trend line difference between ksuave and kswave increases with increasing normal stress.
3) Figure 7A and Figure 7B show that the peak shear strength and pre-peak shear stiffness all deteriorate to different degrees after dry-wet cycling. Figure 7C shows that the upwave is significantly greater than the upuave under each normal stress. Therefore, the decrease in pre-peak shear stiffness after dry-wet cycling has a greater impact on the peak shear displacement than on the peak shear strength.
4) Figure 7D shows that the wet residual shear strength τrwave is generally indistinguishable from the dry residual shear strength τruave at normal stresses up to 9 MPa. When σn>9 MPa, the deterioration effect of dry-wet cycling on the residual strength of the rock fractures increases sharply with increasing normal stress.
To study the influence of the number of dry-wet cycles on the shear mechanical properties of the rock fracture, the average values of peak shear strength, pre-peak shear stiffness, peak shear displacement, and residual shear strength after different numbers dry-wet cycles for each of three different pH soaking solutions and at five normal stress values are shown in Figure 8. Both the peak shear strength and the residual strength are reduced only very slightly at low normal stresses but this effect increases as the normal stress is increased. Pre-peak shear stiffness and peak shear displacement both decrease by a similar amount as the number of dry-wet cycles increases at all normal stresses.
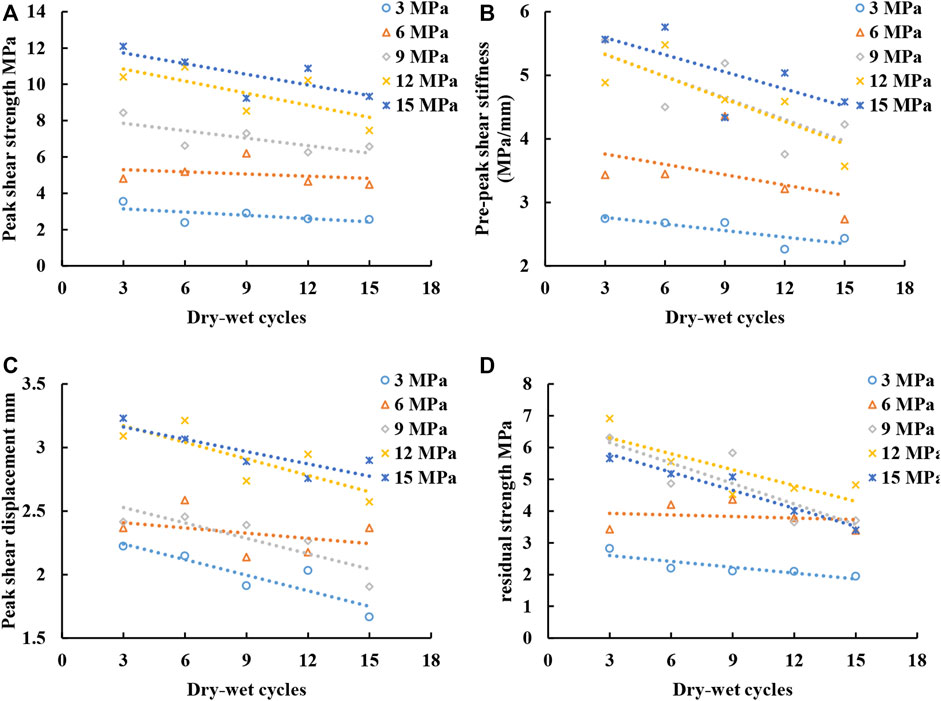
FIGURE 8. Relationship between the shear mechanical parameters for shear failure and number of dry-wet cycles applied. (A) Peak shear strength vs dry-wet cycles. (B) Pre-peak shear stiffness vs dry-wet cycles. (C) Peak shear displacement vs dry-wet cycles. (D) Residual strength vs wet-dry cycles.
Figure 9 shows how the pH value of the soaking solution varies with the number of imposed dry-wet cycles. The pH value of the acidic solution (initially pH = 2) increases to weaker acidity, the pH value of the alkaline solution (initially pH = 12) decreases to weakly alkaline, and the pH value of the neutral solution (initially pH = 7) changes to weakly alkaline after the second dry-wet cycle and they then remain roughly constant. The volume ratio of sandstone to soaking solution is 1 : 2. It is surprising that such large changes in the alkalinity and acidity occur with successive soaking cycles. This suggests that some chemical reactions take place between the solutions and the exposed surfaces of the rock specimens. The thin section results are dominated by quartz and feldspars, which are expected to display some reactivity, but the effect on the residual solution pH will depend on the relative ratio of the rock to solution volumes. Although there is no indication of significant amounts of carbonate minerals present, there could be some at trace levels.
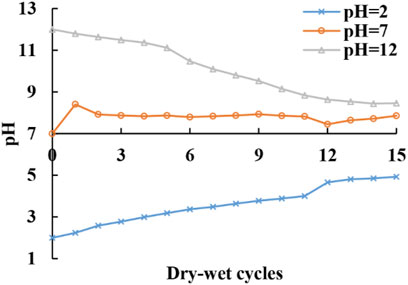
FIGURE 9. Relationship between the pH value observed after the application of each number (N) of dry-wet cycles for each of the three prepared solution pH values. Successive cycles of drying and wetting cause progressive migration from the initially extreme values of pH towards a more neutral composition.
In contrast to the influence of the number of dry-wet cycles imposed on specimens prior to shearing, and despite the indications that the solution pH is modified by chemical interactions with the rock (Figure 9), the experimental data show apparently no significant influence of variations in the acidity or alkalinity of the solutions in the strength parameters (Figure 10).
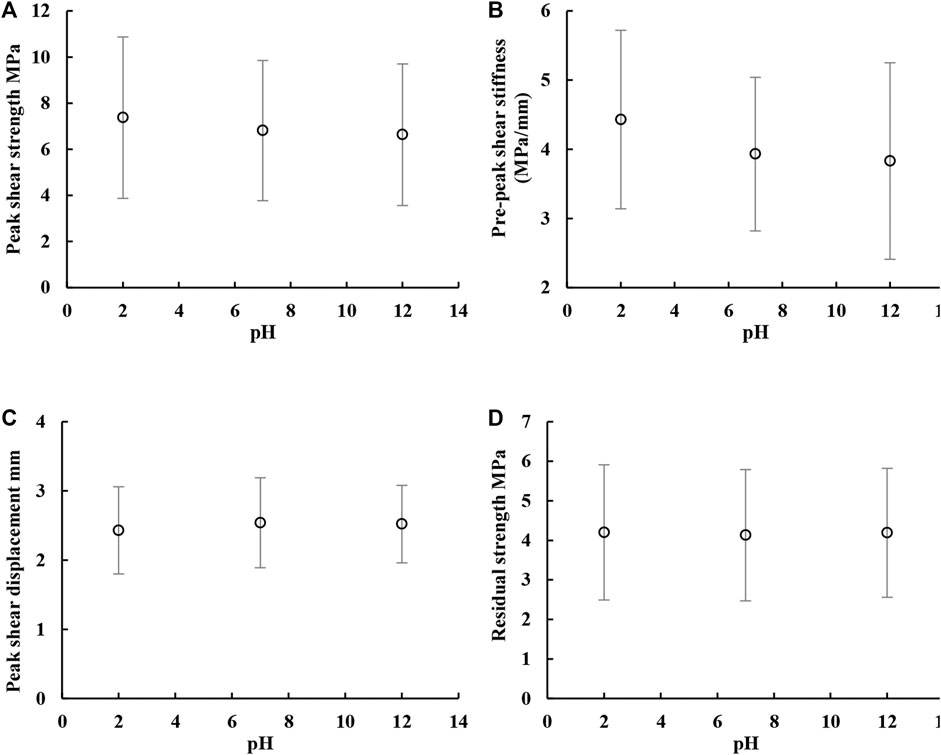
FIGURE 10. Relationship between the shear mechanical parameters for shear failure and pH of soak solution. (A) Peak shear strength vs pH. (B) Pre-peak shear stiffness vs pH. (C) Peak shear displacement vs pH. (D) Residual strength vs. pH.
To further investigate the influence of normal stress, solution pH value, and number of dry-wet cycles imposed on the shear mechanical properties of sandstone fractures, orthogonal test analysis was carried out on the experimental results listed in Table 3. The orthogonal experimental design method is based on mathematical statistics and the orthogonality principle. This method involves selecting representative points from a large number of experimental data, and arranging and analyzing these in multifactor experiments using an orthogonal table (e.g., Li and Hao, 2018; Yang et al., 2020; Zhang et al., 2020). The influencing factors include the normal stress, pH value of the soaking solution, and dry-wet cycle number. The test index parameters include the peak shear strength, pre-peak shear stiffness, peak shear displacement, and residual shear strength. The standard orthogonal table, symbolized L25 (56) with six factors and five levels was adopted after it was modified to L25 (53) with three factors and five levels based on the test scheme in this paper. In this study, Design-Expert software was used for the orthogonal test analysis. The significance level of the factors was analyzed and evaluated using the P significance test (Yang et al., 2019). Only the experimental results were input to obtain the p value of the significant indigenous index representing the influencing factors.
In the variable explicitness test of a linear econometric model, we can judge by comparing the calculated t statistics with the critical value or by comparing P with the explicitness level α. Assuming that we calculate the t test value of the parameter estimation of an explanatory variable in an econometric model as t0:
1) When
2) When
Therefore, in the judgment of the variable dominance test, P should be directly compared with α, rather than with α/2. The judgment criterion is as follows:
1) When P
2) When P
Table 4 shows the p values of the normal stress, pH value of the solution, dry-wet cycle number, and combined factors on the peak shear strength, pre-peak shear stiffness, peak shear displacement, and residual shear strength.
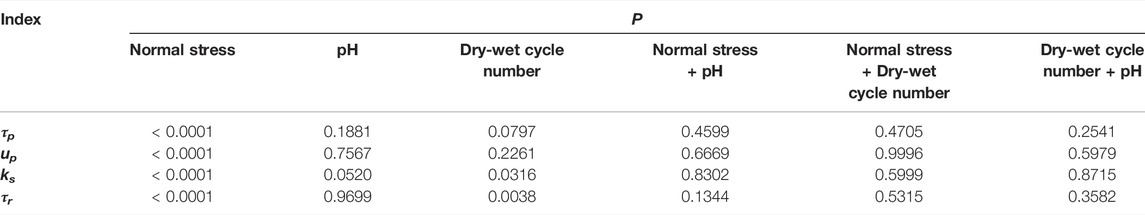
TABLE 4. Indigenous p value of each index under three factors.
The variance analysis method can be used to further estimate the size of the error and to accurately estimate the contribution of each factor in the experimental results. As mentioned earlier, the size of p value reflects the significance of the influence factors on the target indicators. The greater the p value, the smaller the sensitivity of the influence factors on the target indicators. When the p value is less than 0.05, it shows that the influence factors can be determined under the condition of confidence 0.95. It can be seen from Table 4 that the influence of normal stress on peak shear strength, peak shear displacement, pre-peak shear stiffness, and residual strength is relatively significant. The influence of dry-wet cycle number on peak shear strength, pre-peak shear stiffness, and residual strength is relatively significant. However, the influence of solution pH on the four shear mechanical parameters is relatively small. In addition, the interaction between the various factors has no obvious effect on the shear mechanical parameters.
The experimental results that are presented in this paper show that wet-dry cycling degrades the shear mechanical properties of sandstone fractures. There is no single mechanism that explains the influence of wet-dry cycling on the shear mechanical behavior of rock fractures. Van Eeckhout (1976) summarized five mechanisms based on a large number of compression tests, as follows: 1) fracture energy reduction; 2) capillary tension decrease; 3) pore pressure increase (through undrained compaction); 4) friction coefficient reduction; and 5) chemical and corrosive deterioration of mineral structures. These processes, in various combinations, have been invoked to explain weakening effects observed through fluid/rock interactions by many authors (e.g., Colback and Wiid 1965; Burshtein 1969; Rutter 1972; Hadizadeh and Law 1991; Baud et al., 2000; Pellet et al., 2013; Tang et al., 2019). Most studies have been of the weakening role of the presence of water in axisymmetric compression tests on intact rocks. Some of these weakening processes are also likely to apply to shearing of fracture surfaces, which typically involves abrasion and mechanical wear because of fracturing and comminution of contacting asperities, and the progressive generation of wear products (i.e., fault gouge).
Tang et al. (2021) suggested that particular attention should be paid to the influence of water-rock interaction on rock fracture morphology, and summarized three mechanisms for the reduction of rock fracture peak shear strength, as follows: 1) water-induced degradation in rock strength, 2) water-induced changes in the frictional characteristics of the fracture surface, and 3) water-induced change in geometrical features through (for example) solution. Zhao et al. (2017) considered that the reduction of the shear strength of rock fractures is due to the reduction in both fracture energy and the sliding friction coefficient between mineral particles. The presence of water can reduce the strength and fracture toughness of rocks through chemical interactions between the rock and the pore fluid through various mechanisms of stress corrosion at crack tips. Detailed microstructural analysis has shown that the shapes of mineral particles in sandstone become smoother as the number of dry-wet cycles increases, which weakens the cemented contacts between the grains (Zhang et al. (2014). Tang et al. (2019) further indicated that the deterioration of peak shear strength was also related to the decrease of basic friction angle of fracture, the mechanism of which may arise from induced capillary forces, in addition to asperity weakening through the chemical and/or physio-chemical effects (Gutierrez et al., 2000).
Based on a large number of direct shear tests on irregular rock fractures, Barton and Choubey (1977) introduced a modification to the basic sliding friction angle in the Mohr–Coulomb criterion by including a fracture roughness coefficient JRC, and an unconfined compressive strength term. Hence, they proposed a widely used empirical formula for the peak shear strength of rock fractures in shear, as follows:
where τp is the peak shear strength, MPa; σn is the normal stress, MPa; φb is the basic friction angle in degrees; JCS is the compressive strength of the fracture wall (which is typically estimated from a Schmid hammer rebound test) in MPa; and JCS is equal to the uniaxial compressive strength σc of the rock for fresh formation of the rock fractures.
Figure 11 shows the predicted peak shear strength of sandstone fractures under oven-dry conditions and under dry-wet cycling conditions according to eqn. 5 and their test values. Figure 11 shows that the predicted peak shear strength of sandstone fractures is close to its corresponding test value under oven-dry conditions and the data points are evenly distributed on both sides of the straight line y = x, while under dry-wet cycling conditions most of the predicted peak shear strength is significantly higher than its corresponding test value. For quantitative analysis of the predictive accuracy of eqn. 5, the average absolute error expression is given as follows:
where δ is the average absolute error value, MPa; τpm is the test value of the peak shear strength, MPa; τpc is the predicted value of the peak shear strength, MPa; and n is the number of test data.
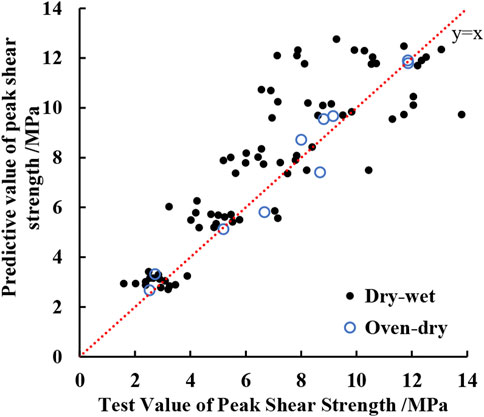
FIGURE 11. The predicted values of the Barton formula under oven-dry conditions and dry-wet cycles plotted against observed values.
The average absolute error of eqn. 6 for the peak shear strength under oven-dry conditions is only 0.50 MPa, and that for the peak shear strength under dry-wet cycling conditions reaches 1.41 MPa. This indicates that the Barton formula is unsuitable for estimating the peak shear strength of the rock fractures under dry-wet cycling conditions directly. It would be necessary to modify the Barton formula to obtain the peak shear strength of irregular rock fractures under dry-wet cycling conditions.
As mentioned earlier, Figure 8 shows that the peak shear strength, pre-peak shear stiffness, peak shear displacement, and residual shear strength of sandstone fractures all decrease with an increasing number of dry-wet cycles under the same normal stress and the slopes of their trend lines with the number of dry-wet cycles are slightly higher under high normal stresses. The damage to sandstone fractures enhanced by dry-wet cycling is clearly a cumulative effect that can be considered to be analogous to a static fatigue process. The cyclic infiltration and removal of water molecules in the process of dry-wet cycling leads to an episodic attack on the crack tips in the mineral particles and their likely enlargement. The damage evolution and accumulation at the microscopic scale leads to macroscopic defects, which are manifested by the deterioration of the shear mechanical parameters of sandstone fractures. In general, the more dry-wet cycles there are, the greater the cumulative damage to the rock fracture surfaces, and the more obvious the deterioration of the shear mechanical parameters of the rock fractures will be. This is interpreted to be analogous to the long-term degradation of shear surfaces in natural rock masses, subject to cyclic drying and wetting by rainfall, and leading eventually to failures in the near-surface regime.
According to this interpretation, the deterioration degree of the fracture peak shear strength increases with an increasing number of dry-wet cycles and is the cumulative influence result of physical and chemical effects. Thus, it is very difficult to quantify separately the influence of each factor on the mechanical parameters of the shear failure. Therefore, a proportionality parameter λ is introduced into eqn. 5 as a modifier of the Barton formula to describe the degradation effect of dry-wet cycling on the shear strength of the rock fractures:
Through the regression analysis of the peak shear strength under successive dry-wet cycling, the corresponding deterioration parameter λ values are calculated as 0.99, 0.98, 0.89, 0.93, and 0.82 when the number of dry-wet cycles is 3, 6, 9, 12, and 15, respectively. The parameter λ decreases as the number of dry-wet cycles increases, as shown in Figure 12.
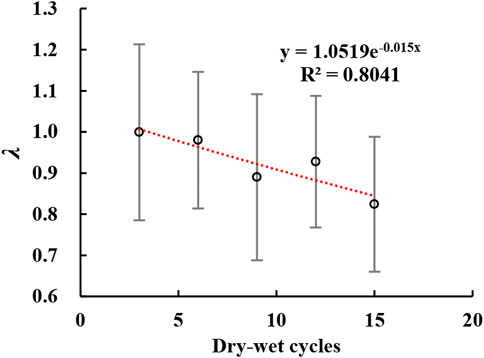
FIGURE 12. The relationship between the parameter λ, which measures the factor by which the shear resistance to sliding is reduced after increasing numbers of applied dry-wet cycles.
While the peak shear strength of the rock fractures decreases with increasing number of applied dry-wet cycles, it cannot be expected to do so infinitely. According to the experimental study of Liu et al. (2017b), the peak shear strength of sandstone fractures decreases slowly with increasing dry-wet cycle number and gradually tends to be stable after approximately 50 dry-wet cycles. In the present study, a decreasing rate of the peak shear strength of the rock fractures is not apparent because the number of dry-wet cycles was relatively small and it is only equivalent to the initial stage of the dry-wet cycling process of Liu X. et al. (2017).
1) The average values of peak shear strength, pre-peak shear stiffness, peak shear displacement, and residual shear strength of the feldspathic sandstone fracture were measured as a function of applied normal stress. Specimens were tested both in the oven-dry state, and after multiple cycles of soaking and drying in acidic, neutral, and alkaline solutions. After dry-wet cycling treatments, the peak shear strength and pre-peak shear stiffness of the rock fractures were less than those of oven-dried rock fractures, the peak shear displacement of the rock fractures was greater than that of oven-dried rock fractures, and the residual shear strength was less than that of oven-dried rock fractures when the normal stress was higher than 9 MPa.
2) Dry-wet cycling promoted a cumulative deterioration effect on the shear mechanical properties of the rock fractures. The peak shear strength, pre-peak shear stiffness, peak shear displacement, and residual strength of the rock fractures decrease overall as the number of dry-wet cycles increases under the same normal stress and the slopes of their trend lines with the number of dry-wet cycles are slightly higher under higher normal stresses. However, the acidity or alkalinity of the wetting solution does not significantly impact on the overall pattern of behavior. Dry-wet cycling is regarded as producing mechanical degradation that is analogous to the influence of rainfall cycles that can culminate in shear failure in near-surface rock slopes.
3) The analysis results of the orthogonal test showed that the normal stress had the greatest influence on the peak shear strength, peak shear displacement, shear stiffness, and residual strength, followed by the number of dry-wet cycles. However, the influence of solution pH was small. A modification to the Barton and Choubey (1977) formula that empirically describes the shear strength of rock fractures and joints is proposed by introducing a deterioration parameter as a multiplier of the rock fracture shear strength, while the deterioration parameter value is related to the number of wet-dry cycles.
The original contributions presented in the study are included in the article/Supplementary Material, and further inquiries can be directed to the corresponding author.
BG: conceptualization, analysis, writing-editing. TC: experiments, analysis, original draft of the manuscript. JS: experiments. ST: experiments. YC: writing-editing. YN: experiments.
This work was supported by the National Natural Science Foundation of China (Grant No. 51904092), the Fundamental Research Funds for the Universities of Henan Province (Grant no. NSFRF180336), and the Natural Science Foundation of Henan Province (Grant no. 202300410183), China.
The authors declare that the research was conducted in the absence of any commercial or financial relationships that could be construed as a potential conflict of interest.
All claims expressed in this article are solely those of the authors and do not necessarily represent those of their affiliated organizations, or those of the publisher, the editors and the reviewers. Any product that may be evaluated in this article, or claim that may be made by its manufacturer, is not guaranteed or endorsed by the publisher.
The authors gratefully acknowledge the preparation of chemical solution guided by Hongqi Meng and Caixia Tian (Institute of Resources and Environment, Henan Polytechnic University), and the thin section interpretation was guided by Min Wang (Institute of Resources and Environment, Henan Polytechnic University). Assistance in specimen preparation and running of experiments was provided by Chengdong Su (School of Energy Science and Engineering, Henan Polytechnic University). The authors thank two anonymous reviewers for helpful comments that led to improvements in the presentation of the paper, and to co-editor E.H. Rutter for helpful advice.
Shear Stress–Shear Displacement Curves for Dry Samples at Different Values of Applied Normal Stress. Samples Were Tested Twice Under the Same Normal Stresses and Demonstrate Good Reproducibility (A and B).
Shear Stress–Shear Displacement Curves After Dry-Wet Cycling Treatments, Soaking Solution pH=2. The Number of Dry-Wet Cycles Applied to Each Sample is Indicated by the N Value: (A) N=3. (B) N=6. (C) N=9. (D) N=12. (E) N=15.
Shear Stress–Shear Displacement Curves After Dry-Wet Cycle Treatments, Soaking Solution pH=7. The Number of Dry-Wet Cycles Applied to Each Sample is Indicated by the N Value: (A) N=3. (B) N=6. (C) N=9. (D) N=12. (E) N=15.
Shear Stress–Shear Displacement Curves After Dry-Wet Cycle Treatments, Soaking Solution pH=12. The Number of Dry-Wet Cycles Applied to Each Sample is Indicated by the N Value: (A) N=3. (B) N=6. (C) N=9. (D) N=12. (E) N=15.
Barton, N., and Choubey, V. (1977). The Shear Strength of Rock Joints in Theory and Practice. Rock Mech. 10 (1), 1–54. doi:10.1007/BF01261801
Baud, P., Zhu, W., and Wong, T.-f. (2000). Failure Mode and Weakening Effect of Water on Sandstone. J. Geophys. Res. 105 (B7), 16371–16389. doi:10.1029/2000JB900087
Burshtein, L. S. (1969). Effect of Moisture on the Strength and Deformability of Sandstone. Soviet Min. Sci. 5 (5), 573–576. doi:10.1007/BF02501278
Chen, C., Peng, S., Wu, S., and Xu, J. (2019). The Effect of Chemical Erosion on Mechanical Properties and Fracture of Sandstone under Shear Loading: an Experimental Study. Sci. Rep. 9, 19886. doi:10.1038/s41598-019-56196-2
Cheng, T., Guo, B. H., Sun, J. H., Tian, S. X., and Chen, Y. (2022). Study on Peak Shear Test and Strength Empirical Formula of Irregular Rock Fractures. Chin. J. Rock Mech. Rock Eng. 41 (1), 93–105. doi:10.13722/j.cnki.jrme.2021.0364
Colback, P., and Wiid, B. L. (1965). “The Influence of Moisture Content on the Compressive Strength of Rock,” in Proc. 3rd Canadian rock Mech. symp. tronto, 65–84.
Deng, H. F., Li, J. L., Zhu, M., Wang, K. W., Wang, L. H., and Deng, C. J. (2012). Experimental Research on Strength Deterioration Rules of Sandstone under “Saturation-air” Dry Circulation Function. Rock Soil Mech. 33 (11), 3306–3312. doi:10.16285/j.rsm.2012.11.015
Erguler, Z. A., Ulusay, R., and Ulusay, R. (2009). Water-induced Variations in Mechanical Properties of Clay-Bearing Rocks. Int. J. Rock Mech. Min. Sci. 46, 355–370. doi:10.1016/j.ijrmms.2008.07.002
Fang, J., Deng, H., Qi, Y., Xiao, Y., Zhang, H., and Li, J. (2019). Analysis of Changes in the Micromorphology of Sandstone Joint Surface under Dry-Wet Cycling. Adv. Mater. Sci. Eng. 2019, 1–11. doi:10.1155/2019/8758203
Feng, X.-T., Chen, S., and Li, S. (2001). Effects of Water Chemistry on Microcracking and Compressive Strength of Granite. Int. J. Rock Mech. Min. Sci. 38, 557–568. doi:10.1016/s1365-1609(01)00016-8
Guo, B., and Dong, H. (2019). Shear Failure Modes and AE Characteristics of Sandstone and Marble Fractures. Open Geosci. 11 (1), 249–262. doi:10.1515/geo-2019-0020
Gutierrez, M., Øino, L. E., and Høeg, K. (2000). The Effect of Fluid Content on the Mechanical Behaviour of Fractures in Chalk. Rock Mech. Rock Eng. 33, 93–117. doi:10.1007/s006030050037
Hadizadeh, J., and Law, R. D. (1991). Water-weakening of Sandstone and Quartzite Deformed at Various Stress and Strain Rates. Int. J. Rock Mech. Min. Sci. Geomechanics Abstr. 28 (5), 431–439. doi:10.1016/0148-9062(91)90081-V
Hale, P. A. (2003). A Laboratory Investigation of the Effects of Cyclic Heating and Cooling, Wetting and Drying, and Freezing and Thawing on the Compressive Strength of Selected Sandstones. Environ. Eng. Geoscience 9 (2), 117–130. doi:10.2113/9.2.117
Han, T. L., Chen, Y. S., Shi, J. P., Yu, C., and He, M. M. (2013). Experimental Study of Mechanical Characterstics of Sandstone Subjected to Hydrochemical Erosion. Chin. J. Rock Mech. Rock Eng. 32 (S2), 3064–3072. doi:10.3969/j.issn.1000-6915.2013.z2.012
Han, T., Shi, J., and Cao, X. (2016). Fracturing and Damage to Sandstone under Coupling Effects of Chemical Corrosion and Freeze-Thaw Cycles. Rock Mech. Rock Eng. 49 (11), 4245–4255. doi:10.1007/s00603-016-1028-7
Hawkins, A. B., and McConnell, B. J. (1992). Sensitivity of Sandstone Strength and Deformability to Changes in Moisture Content. Q. J. Eng. Geol. Hydrogeology 25, 115–130. doi:10.1144/GSL.QJEG.1992.025.02.05
He, M., Deng, H., Yuan, X., Wang, L., Zhu, M., and Luo, Q. (2013). Experimental Research on Changes in the Mechanical Property Law of Reservoir Bank Sandstone under "Immersion-Air Dry" Circulation. Environ. Eng. Manag. J. 12 (9), 1785–1789. doi:10.30638/eemj.2013.215
Huang, S., Xia, K., Yan, F., and Feng, X. (2010). An Experimental Study of the Rate Dependence of Tensile Strength Softening of Longyou Sandstone. Rock Mech. Rock Eng. 43, 677–683. doi:10.1007/s00603-010-0083-8
Huang, X., Pang, J., Liu, G., and Chen, Y. (2020). Experimental Study on Physicomechanical Properties of Deep Sandstone by Coupling of Dry-Wet Cycles and Acidic Environment. Adv. Civ. Eng. 2020, 1–17. doi:10.1155/2020/2760952
Karfakis, M. G., and Akram, M. (1993). Effects of Chemical Solutions on Rock Fracturing. Int. J. Rock Mech. Min. Sci. Geomechanics Abstr. 30, 1253–1259. doi:10.1016/0148-9062(93)90104-L
Khanlari, G., and Abdilor, Y. (2015). Influence of Wet-Dry, Freeze-Thaw, and Heat-Cool Cycles on the Physical and Mechanical Properties of Upper Red Sandstones in Central Iran. Bull. Eng. Geol. Environ. 74, 1287–1300. doi:10.1007/s10064-014-0691-8
Li, B., Ye, X., Dou, Z., Zhao, Z., Li, Y., and Yang, Q. (2020). Shear Strength of Rock Fractures under Dry, Surface Wet and Saturated Conditions. Rock Mech. Rock Eng. 53, 2605–2622. doi:10.1007/s00603-020-02061-y
Li, C. C., Zhang, N., and Ruiz, J. (2019). Measurement of the Basic Friction Angle of Planar Rock Discontinuities with Three Rock Cores. Bull. Eng. Geol. Environ. 78 (2), 847–856. doi:10.1007/s10064-017-1045-0
Li, X., and Hao, J. (2018). Orthogonal Test Design for Optimization of Synthesis of Super Early Strength Anchoring Material. Constr. Build. Mater. 181, 42–48. doi:10.1016/j.conbuildmat.2018.06.029
Lin, M. L., Jeng, F. S., Tsai, L. S., and Huang, T. H. (2005). Wetting Weakening of Tertiary Sandstones-Microscopic Mechanism. Environ. Geol. 48 (2), 265–275. doi:10.1007/s00254-005-1318-y
Lin, Y., Zhou, K., Li, J., Ke, B., and Gao, R. (2020). Weakening Laws of Mechanical Properties of Sandstone under the Effect of Chemical Corrosion. Rock Mech. Rock Eng. 53 (3), 1857–1877. doi:10.1007/s00603-019-01998-z
Liu, X., Jin, M., Li, D., and Zhang, L. (2017a). Strength Deterioration of a Shaly Sandstone under Dry-Wet Cycles: a Case Study from the Three Gorges Reservoir in China. Bull. Eng. Geol. Environ. 77, 1607–1621. doi:10.1007/s10064-017-1107-3
Liu, X. R., Yuan, W., Fu, Y., Wang, Z. J., and Xie, Y. K. (2017b). Deterioration Rules of Shear Strength in Sandstones under Wetting and Drying Cycles in Acid and Alkali Environment. Chin. J. Geotech. Eng. 39 (12), 2030–2326. doi:10.11779/CJGE201712022
Lu, Y., Wang, L., Sun, X., and Wang, J. (2017). Experimental Study of the Influence of Water and Temperature on the Mechanical Behavior of Mudstone and Sandstone. Bull. Eng. Geol. Environ. 76 (2), 645–660. doi:10.1007/s10064-016-0851-0
Lu, Z.-d., Chen, C.-x., Feng, X.-t., and ZhangLiang., Y.-l. (2014). Strength Failure and Crack Coalescence Behavior of Sandstone Containing Single Pre-cut Fissure under Coupled Stress, Fluid Flow and Changing Chemical Environment. J. Cent. South Univ. 21 (3), 1176–1183. doi:10.1007/s11771-014-2051-z
Momeni, A., Hashemi, S. S., Khanlari, G. R., and Heidari, M. (2017). The Effect of Weathering on Durability and Deformability Properties of Granitoid Rocks. Bull. Eng. Geol. Environ. 76, 1037–1049. doi:10.1007/s10064-016-0999-7
Pellet, F. L., Keshavarz, M., and Boulon, M. (2013). Influence of Humidity Conditions on Shear Strength of Clay Rock Discontinuities. Eng. Geol. 157, 33–38. doi:10.1016/j.enggeo.2013.02.002
Ramos da Silva, M., Schroeder, C., and Verbrugge, J.-C. (2008). Unsaturated Rock Mechanics Applied to a Low-Porosity Shale. Eng. Geol. 97, 42–52. doi:10.1016/j.enggeo.2007.12.003
Rehbinder, P., and Lichtman, V. (1957). “Effect of Surface Active Media on Strains and Rupture in Solids,” in Pro. 2nd Int. Cong. Surf. Act. L3. Editor J. H. Schulman (London: Butterworths Scientific), 563–582.
Rutter, E. H. (1972). The Influence of Interstitial Water on the Rheological Behaviour of Calcite Rocks. Tectonophysics 14 (1), 13–33. doi:10.1016/0040-1951(72)90003-0
Tang, Z. C., Zhang, Q. Z., Peng, J., and Jiao, Y. Y. (2019). Experimental Study on the Water-Weakening Shear Behaviors of Sandstone Joints Collected from the Middle Region of Yunnan Province, P.R. China. Eng. Geol. 258, 105161. doi:10.1016/j.enggeo.2019.105161
Tang, Z. C., Zhang, Q. Z., and Zhang, Y. (2021). Cyclic Drying-Wetting Effect on Shear Behaviors of Red Sandstone Fracture. Rock Mech. Rock Eng. 54, 2595–2613. doi:10.1007/s00603-021-02413-2
Van Eeckhout, E. M. (1976). The Mechanisms of Strength Reduction Due to Moisture in Coal Mine Shales. Int. J. Rock Mech. Min. Sci. Geomechanics Abstr. 13, 61–67. doi:10.1016/0148-9062(76)90705-1
Vásárhelyi, B., and Ván, P. (2006). Influence of Water Content on the Strength of the Rock. Eng. Geol. 84, 70–74. doi:10.1016/j.enggeo.2005.11.011
Xia, B.-W., Xu, M.-X., and Pan, C. (2019). Mechanical Properties of the Hard Sandstone Fracture Surface under Hydrochemical Corrosion. J. Eng. 2019, 1–11. doi:10.1155/2019/4807104
Yang, L., Chen, S., Dong, P., Wang, Q., and Huang, C. (2020). Orthogonal Analysis and Numerical Simulation of Rock Mechanics Parameters in Stress Field of Shaft Heading Face. Adv. Mater. Sci. Eng. 2020, 1–11. doi:10.1155/2020/3107364
Yang, S.-Q., Jing, H.-W., and Cheng, L. (2014). Influences of Pore Pressure on Short-Term and Creep Mechanical Behavior of Red Sandstone. Eng. Geol. 179, 10–23. doi:10.1016/j.enggeo.2014.06.016
Yang, Y., Zhang, D., Chen, X., and Zhao, Y. (2019). Sensitivity Analysis of Rock Mechanics Parameters in Stability of Tunnel Surrounding Rock. Energy Sources, Part A Recovery, Util. Environ. Eff. 7, 1–14. doi:10.1080/15567036.2019.1688431
Yang, Z. Y., Lo, S. C., and Di, C. C. (2001). Reassessing the Joint Roughness Coefficient (JRC) Estimation Using Z 2. Rock Mech. Rock Eng. 34, 243–251. doi:10.1007/s006030170012
Zhang, P., Wang, J., Jiang, L., Zhou, T., Yan, X., Yuan, L., et al. (2020). Influence Analysis and Stepwise Regression of Coal Mechanical Parameters on Uniaxial Compressive Strength Based on Orthogonal Testing Method. Energies 13 (14), 3640. doi:10.3390/en13143640
Zhang, Z., Jiang, Q., Zhou, C., and Liu, X. (2014). Strength and Failure Characteristics of Jurassic Red-Bed Sandstone under Cyclic Wetting-Drying Conditions. Geophys J. Int. 198, 1034–1044. doi:10.1093/gji/ggu181
Keywords: rock mechanics, rock fracture, peak shear strength, dry-wet cycle, direct shear
Citation: Guo B, Cheng T, Sun J, Tian S, Chen Y and Niu Y (2022) Evolution of Peak Shear Strength of Rock Fractures Under Conditions of Repetitive Dry and Wet Cycling. Front. Earth Sci. 10:848440. doi: 10.3389/feart.2022.848440
Received: 04 January 2022; Accepted: 06 June 2022;
Published: 14 July 2022.
Edited by:
Ernest Henry Rutter, The University of Manchester, United KingdomReviewed by:
Stefano Aretusini, Istituto Nazionale di Geofisica e Vulcanologia (INGV), ItalyCopyright © 2022 Guo, Cheng, Sun, Tian, Chen and Niu. This is an open-access article distributed under the terms of the Creative Commons Attribution License (CC BY). The use, distribution or reproduction in other forums is permitted, provided the original author(s) and the copyright owner(s) are credited and that the original publication in this journal is cited, in accordance with accepted academic practice. No use, distribution or reproduction is permitted which does not comply with these terms.
*Correspondence: Baohua Guo, Z3VvYmFvaHVhQDEzOS5jb20=
Disclaimer: All claims expressed in this article are solely those of the authors and do not necessarily represent those of their affiliated organizations, or those of the publisher, the editors and the reviewers. Any product that may be evaluated in this article or claim that may be made by its manufacturer is not guaranteed or endorsed by the publisher.
Research integrity at Frontiers
Learn more about the work of our research integrity team to safeguard the quality of each article we publish.