- 1School of Highway, Chang’an University, Shaanxi, China
- 2College of Civil Engineering and Architecture, Henan University of Technology, Henan, China
The phenomenon of mixed migration of liquid water and water vapor appeared in subgrade covered with an impermeable semi-arid rigid base. The soil-water characteristic curves (SWCC) at different temperatures are a key factor in revealing the mechanism of liquid water migration. In particular, the matric suction of unsaturated soil is considerably affected by the change in temperature. A moisture migration laboratory experiment can visually observe the moisture migration process. Therefore, matric suction tests with different temperatures and moisture migration of the one-dimensional soil column were conducted. Then the non-isothermal SWCC model was extended based on the Van Genuchten (VG) model, and the validity was given. Based on the above results, the mechanism of the mixed migration of liquid water and water vapor in moisture migration of unsaturated soil under the effect of the cyclic diurnal temperature variation was revealed. The research demonstrated that the matric suction of unsaturated sand decreases with the increase in temperature. During the daytime, the temperature of the soil column gradually increases. Except for a part of liquid water transformed into water vapor, the liquid water migrated downward under the action of gravity and matric potential. At night, the water vapor accumulated beneath the lid condensed into liquid water under the action of the temperature sharply decreased, which was the main reason for the moisture aggregate beneath the closed layer. Meanwhile, the liquid water and water vapor mutually transformed and dynamically migrated in the soil column under the effect of the cyclic diurnal temperature variation. The moisture in the soil column dynamically migrates between daytime and night, which is named the “moisture circulation of covering effect” in this paper. The “moisture circulation of covering effect” would progressively attain a dynamic equilibrium and dynamic circulatory between the daytime and night with time.
1 Introduction
In arid and semi-arid areas of northwest China, numerous airport roads and expressways, such as Zhongchuan airport in Lanzhou province and the Urumuqi-Kuitun expressway in Xinjiang province, began to show pavement cracks, uneven subsidence, and other diseases, which was of prime concern in the engineering practice (Yao et al., 2016; Niu et al., 2017; Yao et al., 2016; Xu et al., 2017; Xu et al., 2016; Xu et al., 2016). Road core sampling was conducted, and the phenomenon that moisture aggregates between subgrade soil and a semi-rigid base was found. The increase in moisture weakened the strength of subgrade soil and semi-rigid base and led to a weak-soft zone between subgrade soil and semi-rigid base. Then the stress concentration was generated at the bottom of the pavement and caused the surface to crack. Meanwhile, the increase in moisture also led to frost heaving and thaw collapse in the subgrade and then caused expansion and uneven settlement on the surface. Most previous research showed that moisture comes from subgrade soil (Nakano et al., 1984; Parlange et al., 1998). In this region, the semi-rigid base is the most frequently used structure on asphalt concrete roads with its good integrity, mechanical properties, and water stability. Additionally, there is a great thermal difference between day and night in arid and semi-arid areas of China (Tang et al., 2020). For example, in Yanchang County, Shaanxi province, northwest China, the diurnal temperature variation can reach 33°C. The moisture in subgrade soil would migrate upward under temperature gradients and aggregate beneath the semi-rigid base. To emphasize the effect of the impervious boundary, the “Covering effect” defined as the phenomenon of moisture accumulation underneath an impervious cover due to thermal gradients was proposed to generalize this problem (Li et al., 2014).
To reveal the road disease caused by moisture migration, the mechanism of moisture migration was investigated by many scholars. Research showed that the moisture migration in unsaturated soil was a mixed migration of liquid water and water vapor (Wang et al., 2012). The liquid water migration played a key role in areas with shallow groundwater levels and strong capillarity, while the water vapor migration occupied a dominant position in areas with strong evaporation and deep underground water level (Teng et al., 2016; Zhang et al., 2016; Zhang et al., 2016; Zhang et al., 2016; He et al., 2017) Research on the driving force of moisture migration revealed that the liquid water was mainly driven by matric suction and gravity (Mao et al., 2010). The liquid water would migrate downward under the action of gravity. And the matric suction of unsaturated soil measured at room temperature was often used to explain the liquid water migration under the condition of changing temperature in previous studies. In fact, the matric suction of unsaturated soil was closely related to temperature (Gardner et al., 1955; Philip et al., 1957; Wilkinson et al., 1960; Hugh et al., 1998; Fattah et al., 2017). F. Arifin et al. (2006) took three different suction measurement methods measuring the total suction of soil specimens at 20°C and 80°C and found that the total suction of the specimens at 80°C was notably lower than the corresponding total suction measured at 20°C with the same water content. Zhang et al. (2020) found that the soil-water characteristic curves (SWCC) were significantly influenced by the temperature. For the water vapor, the driving force was driven by the water vapor density gradient. And water vapor density was positively correlated with temperature. The liquid water would transform into water vapor with the increase in temperature. Then the water vapor would condense into liquid water when the water vapor density is more than the saturated water vapor density. Zeng et al. (2008) and Li et al. (2016) pointed out that the water vapor migrated from the region with high temperature to that with lower temperature. In addition, some scholars conducted a series of laboratory tests by simulating the work condition of the subgrade to search for the regularity and mechanism of moisture migration. Gao et al. (2018) and Eigenbord et al. (1996) conducted a series of one-side freezing experiments to research the effects of fine contents and initial moisture content on the moisture migration and frost susceptibility of the coarse-grained soils. The research results showed that a thin ice layer appeared in the cold end with the impermeable layer, and the frost susceptibility increased with the increased initial moisture content and fine contents. Liu et al. (2020) found that “soil lid” and the “soil covering effects” existed in both loess soil columns with and without lids under cyclic diurnal temperature variation[28]. The “soil covering effects” for the soil column with a lid were much more obvious.
As shown from the above research results, many researchers realized the “covering effects” in unsaturated soil and conducted a series of experiments to explore the mechanism of moisture migration. However, research on moisture migration caused by temperature variation at the normal temperature in arid and semi-arid has just started. There are great diurnal temperature variations besides the freezing period, and the moisture migration is more prominent. Plus, there is sandy desertification in arid and semiarid areas. So, the effect of the cyclic diurnal temperature variation under the positive temperature on moisture migration in unsaturated sand also cannot be ignored. Besides, less attention has been paid to the effect of matric suction with different temperatures on moisture migration. Diurnal temperature differences may lead to the change of matric suction and then affect moisture migration.
Therefore, in this paper, two-part laboratory tests were conducted to explore the mechanism of moisture migration of unsaturated sand under cyclic diurnal temperature variation: one was the matric suction test considering temperature variation, and the other was a moisture migration test of the one-dimensional soil column under cyclic diurnal temperature variation. First, based on the laboratory test results, this study analyzed the change characteristics for matric suction of unsaturated sand under the different temperature conditions and extended the non-isothermal SWCC model. Then the moisture migration and change in the sand soil column under the effect of the cyclic diurnal temperature variation with time were analyzed considering the effect of temperature on matric suction. These obtained results can offer an important reference for explaining the mechanism of moisture migration and putting forward disease prevention measures in the future.
2 Materials and Methods
2.1 Materials
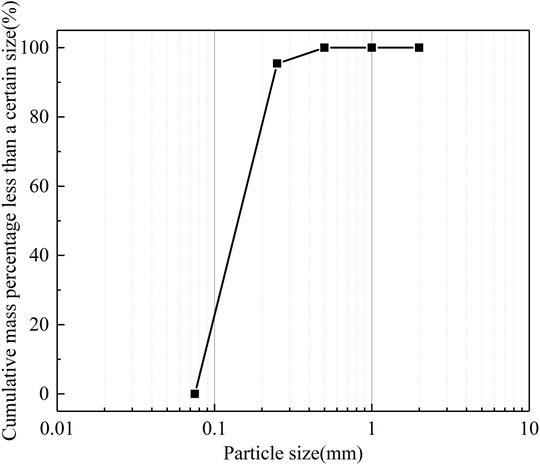
The test materials used in this study were sand, and the soil typical to the Urumuqi-Kuitun expressway. The specific gravity and compaction characteristics of the test soil were measured according to ASTM D854-14, and ASTM D4318-17el, respectively. The results are shown in Table 1. The grain size distribution curve for the test soil is presented in Figure 1.
2.2 Test Apparatus and Methods
2.2.1 Matric Suction Test Considering Temperature Variation
In previous studies, the matric suction of unsaturated soil tested at normal temperature was often used to explain the mechanism of moisture migration. But the matric suction of unsaturated soil in subgrade would change with the variation of soil temperature. In Yanchang County, the maximum and minimum temperatures in 1 day can reach 38 and 5°C, respectively. So, several groups of the matric suction tests under the range of 0–45°C that considered the extreme temperature of subgrade soil were conducted to search for the effect of temperature on matric suction.
The matric suction of unsaturated sands was measured by the TEROS 21 water potential meter, which was composed of the TEROS 21 water potential sensor and Em50 water potential collector, as shown in Figure 2. In particular, the TEROS 21 water potential sensors were used to measure the matric suction and temperature of unsaturated soil. And the measurement range for the matric suction was −1 kPa to −100,006 kPa with an accuracy of −1 kPa, and for the temperature −40–60°C with an accuracy of ±1°C. The measurement time was about 60 min. Em50 water potential collector consisted of five sensor interfaces used to collect and store data. This testing process is shown in Figure 3, and the moisture content design for the test soil is shown in Table 2.
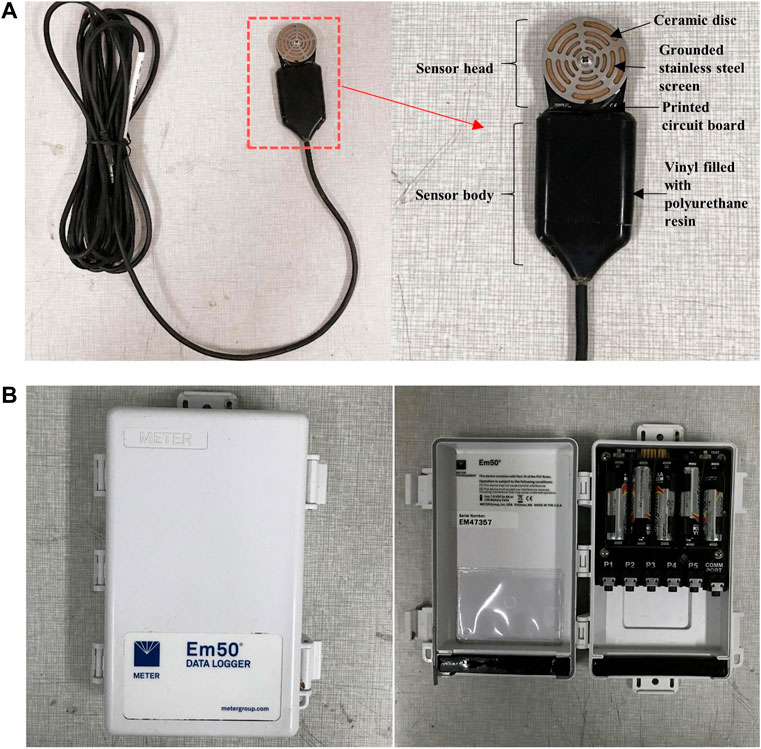
FIGURE 2. TEROS 21 water potential meter. (A) TEROS 21 water potential sensor; (B) Em50 water potential collector.
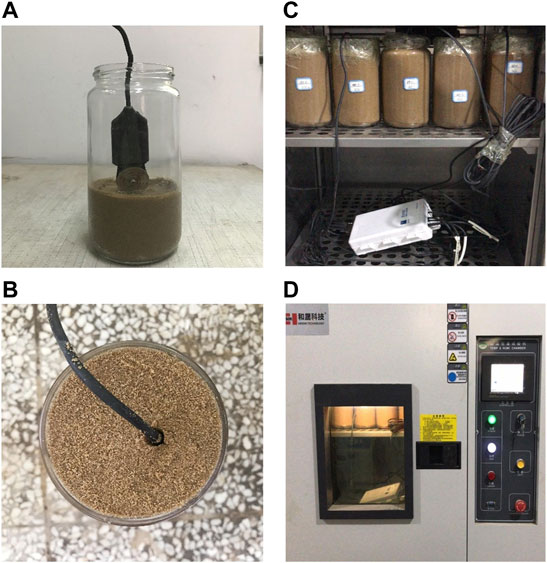
FIGURE 3. Test process of matric suction. (A) Fill soil sample; (B) Fill complete; (C) Connection the acquisition instrument; (D) Put specimens in the thermostat.
2.2.2 Moisture Migration Test Under Cyclic Diurnal Temperature Variation
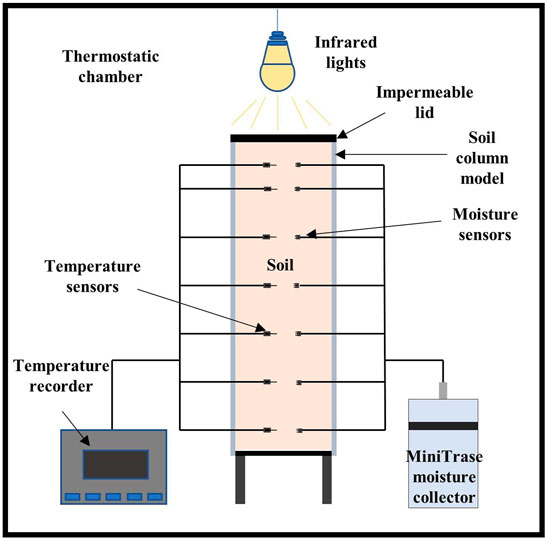
In this test, a one-dimensional moisture migration test apparatus of soil column (Figure 4) was developed to explore the mechanism of moisture migration in subgrade soil covered with a closing layer under cyclic diurnal temperature variation. The apparatus is mainly composed of a soil column model, an impermeable lid, a moisture monitoring system, a temperature monitoring system, and an infrared light.
The soil column is used to simulate the one-dimensional subgrade model and it is a closed system with no moisture supplied to simulate the condition of deep groundwater level. The soil column is 65 cm high with a diameter of 20 cm. On the side of the soil column, small holes with a diameter of 0.5 cm are placed at 5 cm intervals along the vertical direction to arrange the moisture and temperature sensors. The impermeable lid is used to simulate the semi-rigid type base covering on the subgrade. The moisture and temperature data are acquired by a Mini-Trase moisture collector and ECR 90 paperless temperature recorder, respectively. The infrared light is fixed above the soil column to control the temperature of the soil column and simulate sunshine conditions.
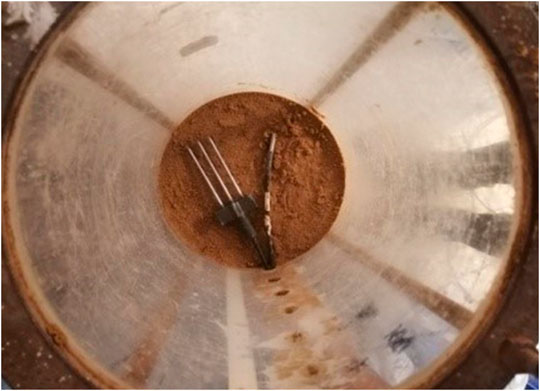
In order to reduce the testing error, two parallel tests were conducted, and specific test steps were as follows. Firstly, the sand samples with the optimum moisture content were prepared. Then the soil samples were filled in layers into the soil column with a compaction degree of 98%. During the filling process, temperature and moisture sensors were buried at 5 cm, 10 cm, 20 cm, 30 cm, 40 cm, 50 cm, and 60 cm depth of soil column. The sensors were arranged in the middle of the soil layer. The temperature and moisture sensor was separated by 2 cm to assure that each reading was independent, as shown in Figure 5. After the soil column was filled completely, the impermeable lid was placed closely on the soil column. Then, excess holes and space between the sensors and the holes, and excess space between the impermeable lid and the soil column model were carefully sealed with glass glue to prevent water vapor exchange between the soil and the environment. Finally, the infrared light was fixed above the soil column, and the light was adjusted to regulate the temperature at the top of the soil column. The maximum temperature at the top of the soil column model was controlled at approximately 45°C to simulate the extreme work condition of the subgrade. Subsequently, the test apparatus was placed in a constant temperature environment to prevent the impact of climate change on the experiment. The cyclic diurnal temperature variations 40 times were conducted in this experiment. A diurnal temperature cycle is 24 h. In a cyclic diurnal temperature variation, infrared light irradiated the soil column for 14 h to simulate the sunshine condition during the daytime, and at other times lights were turned off to simulate night conditions.
3 Results and Discussion
3.1 Matric Suction Considering Temperature Variation
3.1.1 Non-isothermal Extension of SWCC Model
The matric suction test results are shown in Figure 6. It can be seen that the matric suction decreases with the increase of temperature and moisture content, which proves the water holding capacity of unsaturated soil is negatively correlated with temperature. Meanwhile, the effect of temperature on the matric suction for sand with different moisture content is different (Figure 6). For the soil sample with 5–20% moisture content, the matric suction decreases linearly with the increase in temperature, as shown in Figure 6B. Taking the soil sample with 9% moisture content as an example, the matric suction decreases 0.076 kPa/°C from 0 to 45 °C. However, the variations character of 0.5% moisture content is different from 5 to 20% moisture content, as shown in Figure 6A. When the temperature is less than 11 °C, the matric suction reaches the maximum measurement range of the test instrument, 100,006 kPa. According to the characteristics of the curve, the curve greater than 11°C is divided into two-stages, a rapid decay stage and a slow decay stage. For the rapid decay stage, the matric suction decreases 7,544 kPa/°C from 11 to 24°C. For the slow decay stage, the matric suction decreases 78.6 kPa/°C from 24 to 45°C. The change rate of matric suction for sand with 0.5% moisture content decreases with increases in temperature. The experimental results indicate that the effect of temperature on matric suction for soil with low water content is significantly greater than that of soil with high water content.
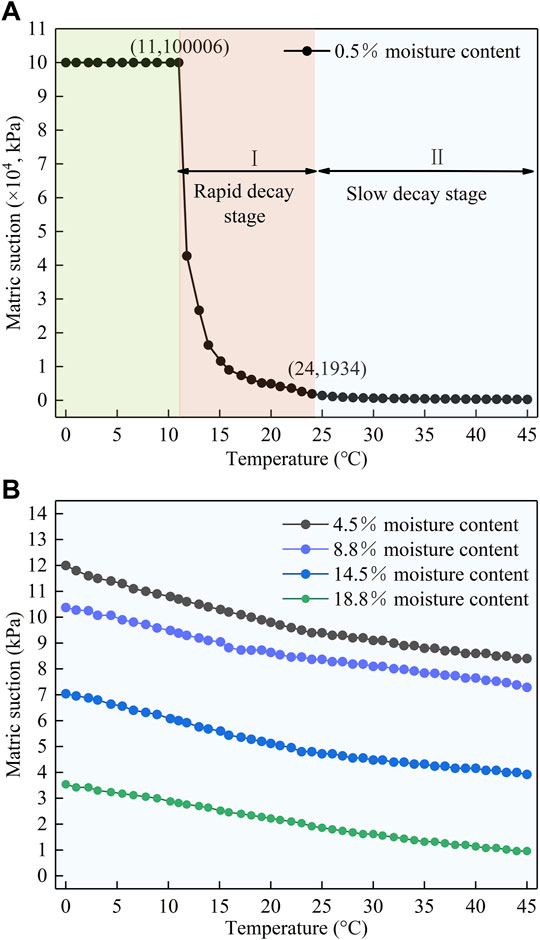
FIGURE 6. Matric suction for unsaturated sand with different moisture content and temperature. (A) 0.5% moisture content; (B) 5–20% moisture content.
To characterize the effect of matric suction under the different temperatures on moisture migration, a model describing the relationship between matric suction, moisture content, and temperature should be established.
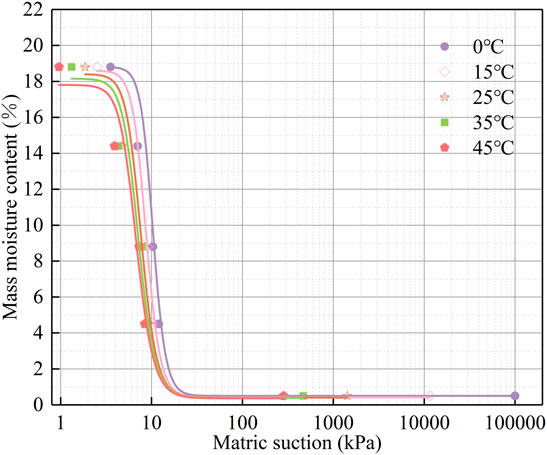
Firstly, the SWCC at 0°C, 15°C, 25°C, 35°C, and 45°C is fitted by VG models based on matric suction test results. The VG model was proposed by Van Genuchten in the 1980s, which was often used to fit SWCC, as shown in Equation 1:
Where
The fitting results show that the related coefficients are all higher than 0.9, as shown in Figure 7 and Table 3, which confirms that the SWCC fitted by VG models is good. The SWCC shifts to the lower left with the temperature increases, which also proves the matric suction of unsaturated sand is closely related to temperature.
Secondly, the parameters of the VG model (
Where
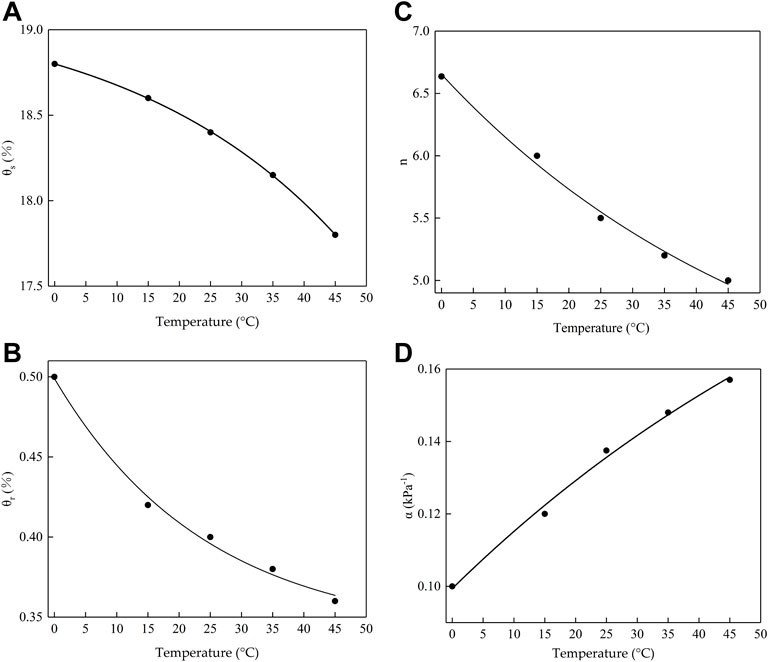
FIGURE 8. Relationship between the fitting parameters of the VG model and temperature. (A)
The fitting results show that the related coefficients are all higher than 0.99, as shown in Figure 7 and Table 4, which confirms that the parameters of the VG model and temperature fitted by Equation 2 are good. The relational expressions between the parameters of the VG model and the temperatures are obtained, as shown in Equations 3–6:
Finally, Equations 3–6 is fed into Equation 1 and the non-isothermal SWCC model is acquired, as shown in Equation 7:
3.1.2 Validation of the Modified Model
In order to verify the rationality for the above model, the SWCC at 10°C, 20°C, 30°C, and 40°C is acquired by the above model and then compared with the measured value of matric suction at 10°C, 20°C, 30°C, and 40°C from the matric suction test. It became clear that the calculated SWCC is highly close to the measured value, as shown in Figure 9. It indicates that the non-isothermal extension of the SWCC model is rational, which may offer support for analyzing the water migration mechanism.
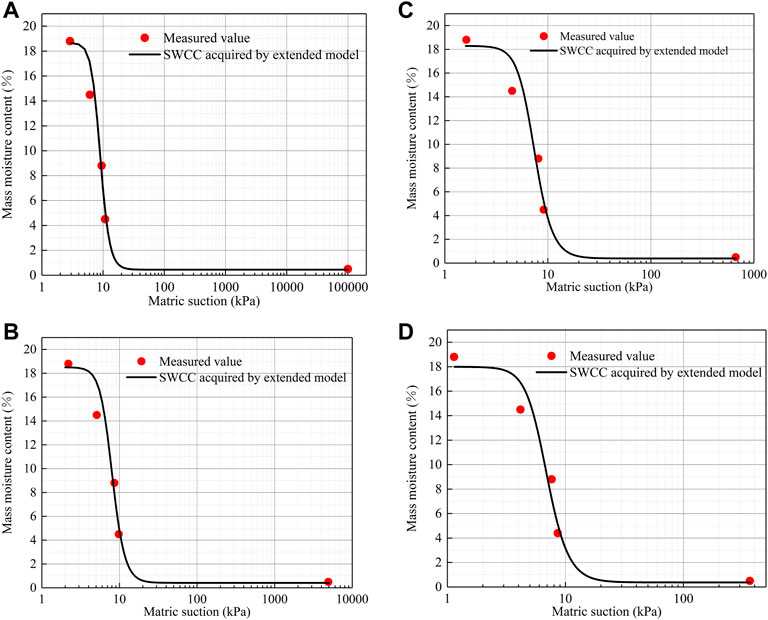
FIGURE 9. Comparison between the measured value and SWCC acquired by extended model. (A)10 °C; (B)20 °C; (C)30 °C; (D)40 °C.
3.2 Moisture Migration Under Cyclic Diurnal Temperature Variation
A previous study indicated the temperature in subgrade changes periodically. The matric suction test results show that the change in temperature would change the matric suction of unsaturated soil, and affects the moisture migration. So, the temperature change in the soil column is analyzed. Plus, the mechanism of moisture migration is analyzed considering cyclic diurnal temperature variation.
3.2.1 Temperature Distribution in the Soil Column
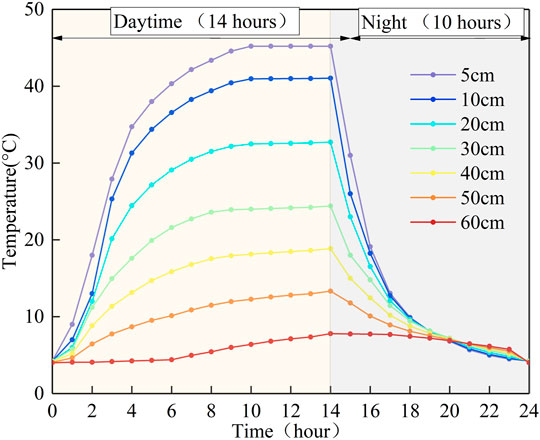
Figure 10 shows the temperature variation in different soil layers at a cyclic diurnal temperature variation. Before the light turned on, the temperature of the whole soil column was about 4.2°C, which was the same as the temperature in the thermostatic chamber. After the light turned on, the temperature in the upper soil layer kept rising. The top soil layer reached the highest temperature after the light was turned on for 10 h, about 45.2°C. The heat transferred from the top to the lower soil layer. Thus, the temperature in the lower soil layer increased gradually with the rise of the temperature in the upper soil layer. The bottom of the soil layer was less affected by the light. Because of the hysteresis of heat transfer, the temperature reached its maximum after the light was turned on for 14 h, about 7.8°C. After the light turned off, the temperature of the soil column gradually decreased due to the influence of the thermostatic chamber with lower temperatures. After the light had been off for 10 h, the temperature of the whole soil column gradually dropped down to 4.2°C. Obviously, the upper soil layer is more readily affected by external temperature compared to the lower soil layer. Wang et al. (2015) also concluded that temperature fluctuations decreased gradually from top to bottom by field monitoring of the temperature inside a subgrade in a high evaporation area. That demonstrated that the temperature condition simulating the actual engineering in this experiment is rational.
3.2.2 Variation of Moisture Field
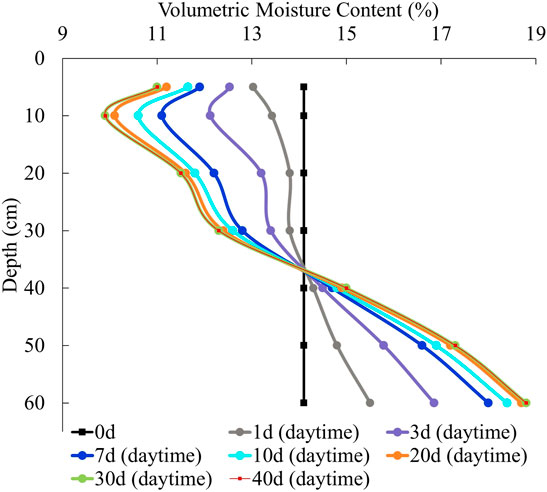
Figure 11 shows that the moisture distribution of two-time points in a cyclic diurnal temperature variation when the light turns on for 14 h (daytime) and turns off for 10 h (night) varies with test times. Under the effect of the cyclic diurnal temperature variation, the moisture in the upper soil layer (0–38 cm) gradually migrated to the lower soil layer (38–65 cm). It is noteworthy that the moisture migration quantity in the 0–38 cm soil layer varies with time. On the first day, the moisture migration quantity in the 0–38 cm soil layer linearly reduced with the increase of depth. The maximum moisture migration quantity presents in the top soil layer. On other days, the moisture migration quantity increases at first and then decreases with the increase of depth. The maximum moisture migration quantity presents in the 10 cm soil layer. So, the moisture distribution in the 0–38 cm soil layer presents a non-monotonic characteristic apart from the first day.
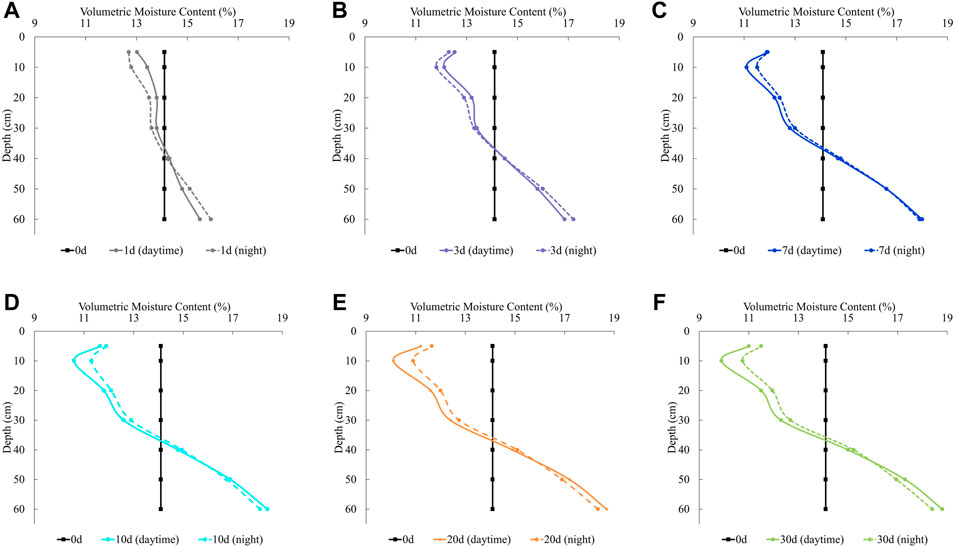
FIGURE 11. Comparison of moisture distribution in a cyclic diurnal temperature variation when the light turns on 14 h (daytime) and turns off 10 h (night) at different times. (A) 1 day; (B) 3 days; (C)7 days; (D) 10 days; (E) 20 days; (F) 30 days.
In addition, there are differences in the moisture distribution between daytime and night at different test times, as shown in Figure 11. In the early trials (0–3 days), the moisture content in the upper soil layer in the daytime is higher than that at night, while the moisture content in the lower soil layer in the daytime is lower than that at night. For example, on the first day, the moisture content in the 5 cm soil layer was changed from 13.0% in the daytime to 12.7% at night, and the moisture content in 60 cm was changed from 15.5% in the daytime to 15.9% at night. It demonstrated that in the early trials, the moisture migrated downward from the upper soil layer to the lower soil layer at night. After 3 days, the moisture content in the upper soil layer at night is higher than that in the daytime, and the moisture content in the lower soil layer at night is lower than that in the daytime. For instance, on the 30th day, the moisture content in the 5 cm soil layer was changed from 11.0% in the daytime to 11.5% at night, and the moisture content in the 60 cm soil layer was changed from 18.8% in the daytime to 18.4% at night. It showed that at night the moisture migrated upward from the lower soil layer to the upper soil layer in this period.
The moisture distribution in the 0–38 cm soil layer presents a non-monotonic characteristic, which is related to water vapor migration affected by diurnal temperature variation. In this experiment, the decrease of moisture in the upper soil layer led to the shrinkage of the soil layer appearing at the top of the soil column, as shown in Figure 12. When the experiments finished and the lid was removed, some of the liquid water still clung to the bottom of the lid and the wall of the cylinder. Due to the shrinkage that existed in the soil column, there was empty space between the lid and the soil column. So, the moisture on the bottom of the lid cannot come from liquid water migration. The above phenomenon confirmed that the vapor water migration led to moisture accumulation in the upper soil layer. For water vapor migration, the liquid water in the soil column transformed into water vapor with the increase of temperature in the soil column after the light was turned on. Due to the impermeable lid on the soil column, the abundant water vapor in the upper soil layer accumulated beneath the lid. After the light turned off, the water vapor accumulated beneath the lid condensed into the liquid water due to the temperature in the upper soil layer sharply decreasing. Then this part of liquid water migrated downward under the action of gravity and replenished moisture for the upper soil layer (0–10 cm). Therefore, the moisture distribution in the 0–38 cm soil layer presents a non-monotonic characteristic (Figure 11).
As mentioned before, the moisture distribution in the soil column is the result of the mixed migration of liquid water and water vapor. For liquid water migration, the driving force is mainly gravity and matric suction. Gravity leads the liquid water migration downward. The influence of matric suction on moisture migration in soil column is affected by the soil temperature that varied with diurnal temperature differences. To search the effect of matric suction at different test times on liquid water, the matric suction of soil column in a cyclic diurnal temperature variation when the light turns on for 14 h (daytime) and turns off for 10 h (night) at different times is calculated by Equation 7 based on the moisture distribution and the temperature in the soil column. Figure 13 shows that the soil matric suction varies with the cyclic diurnal temperature variation. Based on the obtained results, the change mechanism of moisture field in soil column under cyclic diurnal temperature variation is illustrated. After the light turned on, the matric suction in the soil column decreased gradually with the increase of temperature in the soil column. The gravitational and matric potential for the upper soil layer has the same direction of action. Therefore, the liquid water in the upper soil migrated downward under gravity and matric potential, and a small part of liquid water transformed into water vapor. That is the main reason leading to the increase of moisture content in the lower soil layer and the decrease of moisture content in the upper soil layer, as shown in Figure 11. After the light turned off, the matric suction in the soil column increased gradually with the decrease of temperature. The gravity and matric potential for liquid water has a different direction of action. The liquid water migrated under the combined effect of gravity and matric potential. In the early trials, the gravity was more than the matric potential. The liquid water migrated downward. So, the moisture content in the upper soil layer decreased and the moisture content in the lower soil layer increased from 1 to 3 days, as shown in Figure 11. However, the matric suction in the upper soil layer increased with the decrease of moisture. The matric potential was against gravity and made the liquid water migrate upward. The moisture content in the upper soil layer increased, and the moisture content in the lower soil layer decreased from 7 to 30 days, which also indicated that the liquid water migrated upward under the action of matric potential. It can be seen that diurnal temperature variation would lead to the change of matric suction of unsaturated soil, and then make the moisture dynamically migrate. And the phenomenon that moisture migrates downward and upward under the temperature difference cycle is defined as of “moisture circulation of covering effect” in this paper. Yao et al. (2021) also conducted that there existed moisture circulation in unsaturated soil.
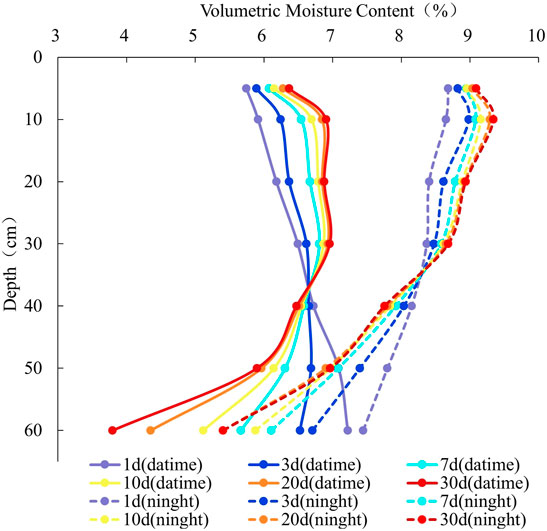
FIGURE 13. Matric suction of soil column in a cyclic diurnal temperature variation when the light turns on 14 h (daytime) and turns off 10 h (night) at different times.
3.2.3 Influence of Test Time on Moisture Migration
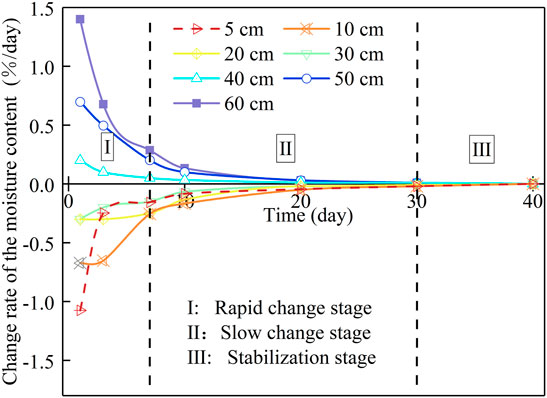
Figure 14 shows that the moisture distribution of the soil column when the light turns on for 14 h at a cyclic diurnal temperature variation varied with time. As shown in Figure 14, the curve for moisture distribution of soil column gradually coincides, which means the change rate of moisture gradually decreases with time. Here, the ratio of soil moisture change quantity to the trial time is used to describe the changes in water migration. Figure 15 shows that the change rate of moisture migration in different soil layers varies with time. Positive and negative values represent an increase and decrease in moisture content, respectively. It is noteworthy that the maximum increase and decrease rate of moisture migration is in the 60 and 5 cm soil layers in the early trials, respectively. After 3 days, the decrease rate in the 5 cm soil layer is inferior to that at 10 and 20 cm, and the maximum decrease rate is presented in the 10 cm soil layer, which is related to condensation of water vapor accumulating beneath the lid. According to the change characteristics of the curve, the experiments are divided into three stages, rapid change stage (0–10 days), slow change stage (10–30 days), and stabilization stage (after 30 days), as shown in Figure 15. The change characteristic of the curve in different soil layers is roughly the same. So, take the soil layer at 60 cm as an example, the moisture migration rate is 1.4%/day from 0 to 1 day (stage Ⅰ). The moisture migration rate is 0.03%/day from 10 to 20 days (stage Ⅱ). After 30 days (stage Ⅲ), the moisture migration rate tends to 0%/ day, which means the change rate of moisture migration decreases with time and the soil column moisture field reaches stable status.
That also indicates that there exists disequilibrium in the “moisture circulation of covering effect” between daytime and night. By the 30th day, the quantity of moisture migration in the daytime is higher than that at night. So, the moisture distribution shows that the moisture content in the upper soil layer decreases, and the moisture content in the lower soil layer increases, as shown in Figure 14. After 30 days, the quantity of moisture migration during daytime and night was the same, which demonstrated that the “moisture circulation of covering effect” reached a dynamic equilibrium and dynamic circulatory between the daytime and night.
4 Conclusion
(1) The matric suction for unsaturated sand decreases with the increase of temperature and moisture content. And the matric suction for unsaturated sand with lower moisture content is affected by temperature more than that with high moisture content. The non-isothermal SWCC model based on the VG model is extended, which can sufficiently characterize the effect of temperature and moisture content on matric suction.
(2) Under the effect of the cyclic diurnal temperature variation, the mixed migration of liquid water affected by gravity and matric potential and water vapor influenced by temperature variation led to moisture migration from the upper soil layer to the lower soil layer. In the daytime, the temperature of the soil column gradually increased with time. The matric suction affected by high temperature gradually decreased. The liquid water migrated downward under the action of matric potential and gravity. At night, the temperature of the soil column gradually decreased with time. The matric suction gradually increased. After 3 days, the liquid water migrated upward under the action of matric potential. In addition, the water vapor affected by the high temperature during the daytime accumulated beneath the impermeable lid and condensed into liquid water at the night, which caused the moisture accumulation in the upper soil layer.
(3) The liquid water and water vapor mutually transformed and dynamically migrated in the soil column under cyclic diurnal temperature variation. The moisture migrated downward in the daytime and migrated upward at night under the action of the driving force, which is defined as the “moisture circulation of covering effect” in this paper. The change rate of moisture migration decreases with time and the soil column moisture field reaches stable status. And the “moisture circulation of covering effect” reached a dynamic equilibrium and dynamic circulatory between the daytime and night after 30 days.
Data Availability Statement
The original contributions presented in the study are included in the article/Supplementary Material, further inquiries can be directed to the corresponding author.
Author Contributions
XM and JZ conceived this research. XM, QW, XL, YW, and JZ contributed to conception. XM, FL, and JZ contributed to data analysis and methodology. JZ wrote the first draft of the manuscript. All authors contributed to manuscript revision and read and approved the submitted version.
Funding
This research was funded by the National Natural Science Foundation of China (Grant No. 51878064), High-Level Talent Fund of Henan University of Technology (Grant No. 31401370), Natural Science Basic Research Program of Shaanxi (Grant No. 2021JQ-224), and the Fundamental Research Funds for the Central Universities, Chang’an University (Grant Nos 300102218408 and 300102219108).
Conflict of Interest
The authors declare that the research was conducted in the absence of any commercial or financial relationships that could be construed as a potential conflict of interest.
Publisher’s Note
All claims expressed in this article are solely those of the authors and do not necessarily represent those of their affiliated organizations, or those of the publisher, the editors and the reviewers. Any product that may be evaluated in this article, or claim that may be made by its manufacturer, is not guaranteed or endorsed by the publisher.
Acknowledgments
The authors express their appreciation for the financial support of the National Natural Science Foundation of China (Grant No. 51878064), High-Level Talent Fund of Henan University of Technology (Grant No. 31401370), Natural Science Basic Research Program of Shaanxi (Grant No. 2021JQ-224), and the Fundamental Research Funds for the Central Universities, CHD (Grant No. 300102218408 and 300102219108). Our thanks go to the editors and reviewers for their efficient work.
References
Arifin, Y. F., Agus, S. S., and Schanz, T. (2006). Temperature Effects on Suction Characteristic Curve of Bentonite-Sand Mixtures. 4th Int. Conf. Unsated Soils 2016, 1314–1325. doi:10.1061/40802(189)108
Eigenbrod, K. D., and Kennepohl, G. J. A. (1996). Moisture Accumulation and Pore Water Pressures at Base of Pavements. Transp. Res. Rec. 1546, 151–161. doi:10.1177/0361198196154600117
Fattah, M. Y., Salim, N. M., and Irshayyid, E. J. (2017). Influence of Soil Suction on Swelling Pressure of Bentonite-Sand Mixtures. Eur. J. Environ. Civ. En.,2017 1–15. doi:10.1080/19648189.2017.1320236Gardner
Gao, J., Lai, Y., Zhang, M., and Feng, Z. (2018). Experimental Study on the Water-Heat-Vapor Behavior in a Freezing Coarse-Grained Soil. Appl. Therm. Eng. 128, 956–965. doi:10.1016/j.applthermaleng.2017.09.080
Gardner, R. (1955). Relation of Temperature to Moisture Tension of Soil. Soil Sci. 79, 257–266. doi:10.1097/00010694-195504000-00003(
He, Z. Y., Teng, J. D., Zhang, S., and Sheng, D. C. (2017). Moisture Transfer and Phase Change in Unsaturated Soils: an Experimental Study of Two Types of Canopy Effect. Sci. Cold Arid. Reg. 9, 65–71. doi:10.11779/CJGE201610010
Hugh, Y. S., and Brent, E. S. (1998). The Effect of Temperature on Capillary Pressure-Saturation Relationships for Air-Water and Perchloroethylene-Water Systems. Water Resour. Res. 34, 2587–2597. doi:10.1029/98WR01199
Li, Q., Yao, Y. P., Han, L. M., Hu, J., Peng, R., and Wang, N. D. (2014). Pot-cover Effect of Soil. Ind. Constr. 44, 69–71. doi:10.13204/j.gyjz201402016
Li, Y. L., Wang, J., and Wang, T. H. (2016). Moisture Migration of Unsaturated Soil Due to Thermal Gradients. Rock Soil Mech. 37, 2839–2844. doi:10.16285/j.rsm.2016.10.014
Liu, F., Mao, X., Xu, C., Li, Y. Q., Wu, Q., and Zhang, J. (2020). "Covering Effects" under Diurnal Temperature Variations in Arid and Semiarid Areas. Adv. Civ. Eng. 2020, 1–12. doi:10.1155/2020/7496182
Mao, X., Li, Z., and Kong, L. K. (2010). Agent Based Affective Tutoring Systems: A Pilot Study. Comput. Educ. 55, 202–208. doi:10.1016/j.compedu.2010.01.005
Nakano, Y., Tice, A., and Oliphant, J. (1984). Transport of Water in Frozen Soil Iv. Analysis of Experimental Results on the Effects of Ice Content. Adv. Water Resour. 7, 58–66. doi:10.1016/0309-1708(84)90002-2
Niu, F., Li, A., Luo, J., Lin, Z., Yin, G., Liu, M., et al. (2017). Soil Moisture, Ground Temperatures, and Deformation of a High-Speed Railway Embankment in Northeast China. Cold Regions Sci. Technol. 133, 7–14. doi:10.1016/j.coldregions.2016.10.007
Parlange, M. B., Cahill, A. T., Nielsen, D. R., Hopmans, J. W., and Wendroth, O. (1998). Review of Heat and Water Movement in Field Soils. Soil Tillage Res. 47, 5–10. doi:10.1016/S0167-1987(98)00066-X
Philip, J. R., and De Vries, D. A. (1957). Moisture Movement in Porous Materials under Temperature Gradients. Trans. AGU 38, 222–232. doi:10.1029/TR038I002P00222
Tang, K., Mao, X.-S., Wu, Q., Zhang, J.-X., and Huang, W.-J. (2020). Influence of Temperature and Sodium Sulfate Content on the Compaction Characteristics of Cement-Stabilized Macadam Base Materials. Materials 13 (16), 3610–3632. doi:10.3390/ma13163610
Teng, J. D., He, Z. Y., Zhang, S., and Sheng, D. C. (2016). Moisture Transfer and Phase Change in Unsaturated Soils: Physical Mechanism and Numerical Model for Two Types of "canopy Effect. Rock Soil Mech. 38, 1813–1821. doi:10.11779/CJGE201705022
Wang, G. Y., Xiao, X., and Huang, Y. M. (2015). Simulation of Moisture Diffusion and Condensate Migration in Subgrade Soil. J. Cent. South Univ. 39, 729–733.
Wang, T. H., Wang, J. J., and Zhang, L. D. (2012). Experimental Research on Moisture Migration in Freezing Unsaturated Loess. J. Xi'an Univ. Archit. Technol. 44, 7–13. doi:10.15986/j.1006-7930.2012.01.002
Wilkinson, G. E., and Klute, A. (1960). The Temperature Effect on the Equilibrium Energy Status of Water Held by Porous Media. Soil Sci. Soc. Am. J. 26, 535–540. doi:10.2136/sssaj1962.03615995002600040007x
Xu, X., Wang, Y., Bai, R., Fan, C., and Hua, S. (2016). Comparative Studies on Mechanical Behavior of Frozen Natural Saline Silty Sand and Frozen Desalted Silty Sand. Cold Regions Sci. Technol. 132, 81–88. doi:10.1016/j.coldregions.2016.09.015
Xu, X., Wang, Y., Bai, R., Zhang, H., and Hu, K. (2016). Effects of Sodium Sulfate Content on Mechanical Behavior of Frozen Silty Sand Considering Concentration of Saline Solution. Results Phys. 6, 1000–1007. doi:10.1016/j.rinp.2016.11.040
Xu, X., Wang, Y., Yin, Z., and Zhang, H. (2017). Effect of Temperature and Strain Rate on Mechanical Characteristics and Constitutive Model of Frozen Helin Loess. Cold Regions Sci. Technol. 136, 44–51. doi:10.1016/j.coldregions.2017.01.010
Yao, Y. P., Wang, L., and Wang, N. D. (2016). Analysis of Disaster Characteristics and Cases of Pot-Cover Effect in Dry and Cold Areas. Ind. Constr. 46, 21–24. doi:10.13204/j.gyjz201609006
Yao, Y. P., Wang, L., Wang, N. D., and Jia, J. F. (2016). Mechanism of Forming Pot-Cover Effect and its Prevention. Ind. Constr. 46, 6–10. doi:10.13204/j.gyjz201609001
Yao, Y. P., Wei, L., Chen, H., and Li, Q. (2021). Research on the Law of Water Vapor Circulation of the Pot Cover Effect. Rock Soil Mech. 42, 1512–1518. doi:10.16285/j.rsm.2020.1313
Zeng, J., Liu, Z., and Champliaud, H. (2008). FEM Dynamic Simulation and Analysis of the Roll-Bending Process for Forming a Conical Tube. J. Mater. Process. Technol. 198, 330–343. doi:10.1016/j.jmatprotec.2007.07.016
Zhang, H., Liu, H. Y., and Li, C. (2020). Temperature Effect of Soil-Water on Characteristic Curve of Aeolian Sand Subgrade Soil. Chin. J. Hw. Transp. 33, 42–49. doi:10.19721/j.cnki.1001-7372.2020.07.004
Zhang, M., Wen, Z., Xue, K., Chen, L., and Li, D. (2016). A Coupled Model for Liquid Water, Water Vapor and Heat Transport of Saturated-Unsaturated Soil in Cold Regions: Model Formulation and Verification. Environ. Earth Sci. 75, 1–19. doi:10.1007/s12665-016-5499-3
Zhang, S., Teng, J., He, Z., Liu, Y., Liang, S., Yao, Y., et al. (2016). Canopy Effect Caused by Vapour Transfer in Covered Freezing Soils. Géotechnique 66, 927–940. doi:10.1680/jgeot.16.p.016
Keywords: road engineering, moisture migration of unsaturated sand, cyclic diurnal temperature variation, non-isothermal soil-water characteristic curves, mixed migration, moisture circulation of covering effect
Citation: Mao X, Zhang J, Wu Q, Liu F, Li X and Wang Y (2022) Experimental Study on Moisture Migration in Unsaturated Sand Under Cyclic Diurnal Temperature Variation. Front. Earth Sci. 10:847463. doi: 10.3389/feart.2022.847463
Received: 06 January 2022; Accepted: 03 May 2022;
Published: 20 June 2022.
Edited by:
Jie Huang, University of Texas at San Antonio, United StatesReviewed by:
Mohammed Y. Fattah, University of Technology, IraqK. Ravi, Indian Institute of Technology Guwahati, India
Copyright © 2022 Mao, Zhang, Wu, Liu, Li and Wang. This is an open-access article distributed under the terms of the Creative Commons Attribution License (CC BY). The use, distribution or reproduction in other forums is permitted, provided the original author(s) and the copyright owner(s) are credited and that the original publication in this journal is cited, in accordance with accepted academic practice. No use, distribution or reproduction is permitted which does not comply with these terms.
*Correspondence: Qian Wu, d3VxaWFuQGNoZC5lZHUuY24=
†ORCID: Feifei Liu, orcid.org/0000-0003-4512-5256; Xiangyu Li, orcid.org/0000-0003-4942-7294; Yueyue Wang, orcid.org/0000-0002-2515-2743
 Xuesong Mao
 Jianxun Zhang
 Qian Wu
 Feifei Liu
 Xiangyu Li1†
 Yueyue Wang
