 Jie Cao
 Shuping Ma
 Lingkun Ran3
- 1Key Laboratory of Meteorological Disaster, Ministry of Education and Collaborative Innovation Center on Forecast and Evaluation of Meteorological Disasters, Nanjing University of Information Science and Technology, Nanjing, China
- 2School of Geography and Planning, Ningxia University, Yinchuan, China
- 3Institute of Atmospheric Physics, Chinese Academy of Sciences, Beijing, China
Water vapor flux divergence under the terrain-following coordinate system is decomposed into slow and fast manifolds with the adoption of the Barnes filter method and the synoptic approach based on the Helmholtz theorem in this study. The performances and applications of both methods are evaluated in precipitating events over the Xinjiang province in China when traditional analysis fails to capture the evolutions of extreme precipitations caused by multi-scale systems and complicated terrains. A blizzard with a short duration under weak moisture environments and a persistent torrential rainfall event with abundant water vapor in the summer are selected as test examples for comparative analysis of the relationships between water vapor divergence and precipitation characteristics with the adoptions of both traditional synoptic diagnosis and two decomposition methods. It is found that divergent areas of the total water vapor flux divergence at the middle and high levels are blocked by false convergence at the low levels as the precipitation weakens in both cases, which leads to the failure of traditional synoptic diagnoses. Meanwhile, the two decomposition methods can provide superior indicators for extreme precipitation, especially before rainfall decreases or terminates. The synoptic approach performs better than the Barnes filter method as the latter sharply decreases in accuracy as the complexity of the flow fields and moisture conditions increase. Remedies for relieving this problem are proposed before being used for further applications.
1 Introduction
The recently published IPCC AR6 report presents a full and systematic evaluation of extreme weather events. It shows that severe precipitation increases 7% in intensity when the temperature increases 1°. Furthermore, the variability of torrential rainfall events is studied and seen well-related to global climate warming in the form of non-linear processes (IPCC, 2021; Zhang et al., 2021). Compared to regions at the same latitudes, Central Asia is more sensitive to global climate change for its complicated terrains and unevenly distributed hydrological sources (Yin et al., 2014; Li et al., 2015; Hu et al., 2016; Jiang et al., 2020). Featuring in scarce precipitation, Central Asia is experiencing an increase in the occurrence of extreme rainfall and has been vulnerable to extreme precipitation in recent years (Deng et al., 2014; Huang et al., 2014, 2015; Hu et al., 2014, 2017; Malsy et al., 2015; Zhao et al., 2016; Zhang et al., 2017). Increased extreme precipitation may help solve the limited water availability problem, but introduce floods and secondary disasters (Knapp and Coauthrs., 2008) at the same time. Severe droughts and floods threaten human lives and constructions of the Silk Road Economic Belt. Xinjiang province, the key area of the Silk Road Economic Belt, has suffered 45 local rainstorms and floods every year in average for the past 10 years (Wang and Wang, 2021). Apart from complicated terrains and soil types, dominant weather systems of different scales are also responsible for the sudden and extreme precipitations in both summer and winter (Ma et al., 2021). Anomalous precipitation is directly related to the moisture supply and can be represented by water vapor transport which is well studied and widely used globally or over East Asia (Ding, 1994; Trenberth et al., 1995; Zhou and Yu, 2005; Gao et al., 2017, 2021; Qin et al., 2021). Hu et al. (2021) studied the water vapor transport of the summer half-year from 1979 to 2018, the results showed that water vapor from the North Atlantic Ocean, Europe, and the Mediterranean Sea contributes to northern Xinjiang’s extreme precipitation, while water vapor from the Arabian Sea, the Arabian Peninsula, and the Indian Peninsula contribute to extreme precipitation over southern Xinjiang. By far, a detailed comprehension of the relationship between water vapor transport by different scales of motions and extreme precipitation over the Xinjiang province is deficient and should be an issue of considerable urgency.
Multi-scale flows coexist in the real atmosphere. In other words, real weather events can be seen as a combination of slow manifolds and fast ones from the perspective of phase space (Leith, 1980; Lorenz, 1980, 1986; Daley, 1991). Slow manifolds follow basic physical principles with high predictability, while fast ones contain randomness and thus are hard to forecast. However, the fast manifold motions and their interaction with slow ones are the direct reason for the initiation of most severe weather events. For climatic studies, the slow manifold covers systems of planetary scale and large-scale ones (Hasselmann, 1976). Most climate numerical models are constructed by eliminating fast manifolds which coexist as perturbations over the slow ones. For synoptic studies, the slow manifold serves as the background for the fast one which includes flows of sub-synoptic, mesoscale, and convective scales. There are three types of approaches to decompose slow and fast manifolds which are: the statistical method (Seager et al., 2010), synoptic analysis, and dynamic one. Barnes filter (Barnes, 1973) is a classical statistical method which has been broadly used in diagnosing typhoons, cyclones, and Meiyu fronts (Doswell, 1977; Gomis and Alonso, 1990; Xu et al., 2017; Xue et al., 2018; Zou et al., 2018; Ma et al., 2021), the mathematical procedure is direct and efficient, but the physical basis is not solid, especially for a specific case study. The synoptic analysis approach is based on the Helmholtz theorem by decomposing horizontal velocity into rotational and divergent flow components (Hawkins and Rosenthal, 1965; Dimego and Bosart, 1982; Ullah et al., 2020, 2021). The latter is the fast manifold which is directly linked to vertical motions and is responsible for severe weather. Applications of this physically solid method are wide in both atmospheric and oceanic motions. However, the accuracy and efficiency for mesoscale diagnosis in a limited domain limits this method in climatic or large-scale applications (Renfrew et al., 1997). Xu et al. (2011) designed an integral method with the adoption of Green’s function for limited areas of arbitrary shapes. The dynamic analysis approach approximates primitive equations to different extents and can be divided into geostrophic and balanced types (Allen, 1991; Xu, 1992). This is the most solid physical approach but at the same time is extremely complicated for numerical computations. High resolution dataset outputs from mesoscale models add difficulties to the applications of the dynamic analysis approach.
The intensity of the net water vapor advection or water vapor flux divergence in the lower troposphere is the core factor to judge the precipitation intensity, which is also the key factor in the analysis and forecast of large-scale rainstorm (Sun, 2017), therefore, water vapor flux divergence is critical in a rainstorm, and many case studies have confirmed the effectiveness of its decomposed components (Zhou and Zhang., 2016; Ma et al., 2022; Wu et al., 2022). Ma et al. (2022) analyzed the decomposition of water vapor flux divergence and its application to a Blizzard event over Ili Valley in Central Asia from 30 Nov to 1 Dec, 2018. Cao et al. (2022b) analyzed the decomposed components’ application to rainstorms caused by Typhoon Rumbia in 2018, and Wu et al. (2022) researched persistent extreme precipitation events in the post-flood season over Hainan Island from 16 to 18 Oct, 2020. The results of those cases showed that the decomposed water vapor flux divergence can better interpret which components play more important roles during extreme precipitation. This is useful for further applications in rainfall predictions. The main purpose of this study is to decompose water vapor flux divergence with the Barnes filter and synoptic methods in different precipitation events to see their performances when traditional analysis fails to identify the evolution of extreme precipitations over the Xinjiang province. Quantitative comparisons of these two methods in two severe precipitations distinct in synoptic and hydrological backgrounds, terrain heights ranging from 500 m to 4,000 m, and durations are performed with the hope to seize useful information for severe precipitation forecasts from decomposed manifolds. The traditional synoptic analysis and numerical configurations for the two real cases are presented in Section 2, followed with brief derivations of these two decomposition approaches. In Section 3, the decomposed slow manifolds by the Barnes filter and synoptic methods are analyzed compared to the original water vapor flux divergence and to each other. Further decomposition of the moisture parameter is carried out with the hope to seize the dominant signal for precipitations. Conclusions and short discussions are presented in Section 4.
2 Methodology
2.1 Observational analysis
From 0000 UTC on November 30 to 0000 UTC on December 2, 2018, the passage of cold front over the Ili River Valley with complicated plains, mountains, and valleys (blue domain in Figure 1I) in northern Xinjiang triggered a blizzard of short duration. The Ili River Valley is under the control of the warm and humid southwest airflow in front of the trough at 700 hPa (Figure 1A). There is a weak west water vapor channel at 700 hPa (Figure 1B), which transports water vapor from Lake Balkhash to the Ili River Valley. However, the negative Qall areas are small, and it is distributed alternately with the stronger divergence. Seen from the Qall pattern, it is not favorable for severe precipitation in the near future.

FIGURE 1. (A) Wind vector and equivalent temperature (shaded, units: (K) and (B) water vapor flux (vector, unit: g cm−1 hPa−1 s−1) and its divergence (shaded, unit: 10−7 g cm−2 hPa−1 s−1) at 700 hPa at 12 UTC 30 November 2018, (C) geopotential (solid contours, unit: gpm), temperature (dashed contours, unit: K), and relative vorticity (shaded, unit: 10−4 s−1) at 500 hPa and (D) water vapor flux (vector, unit: g cm−1 hPa−1 s−1) and its divergence (shaded, unit: 10−7 g cm−2 hPa−1 s−1) at 850 hPa at 00UTC on 15 Jun, 2021. Twelve hour-accumulated observed rainfall (E) and simulated results (F) at 00UTC on 1 Dec, 2018. (G) and (H) are the same as (E) and (F) correspondingly except for at 00UTC on 16 June, 2021. Units are mm. (I) Terrain heights in the unit of m. The blue and red rectangular regions in Figures 1F,H are the target domains for the following analysis.
From 0000 UTC on June 15 to 0000 UTC on June 15, 2021, a persistent torrential rainfall event occurs in the Hotan Region of southern Xinjiang with flat lands (red domain Figure 1I). The Central Asia vortex is the dominant large-scale system at 500 hPa (Figure 1C). The easterly and northerly water vapor channels transport moisture flux from the Arctic Ocean and the Siberian marshes to the southern Xinjiang basin through the gap between the Altay Mountains and the Tianshan Mountains and it is blocked by the Kunlun Mountains in the south. There is visible Qall in the Hotan area (Figure 1D). Abundant moisture exists in this summer case, but negative Qall centers are not closely correlated to rainfall belts.
In a short conclusion, the winter case is characterized with a cold front and weak moisture flux, while the summer case is with the Central Asia vortex and abundant moisture.
2.2 Modeling system and configuration
Numerical simulations for the two events are performed by using the Weather Research and Forecasting modeling system (Skamarock et al., 2008). The background field and lateral boundary conditions of the rainfall process are the European Centre for Medium-Range Weather Forecasts (ECMWF) ERA5 hourly data with the horizontal resolution of 0.25°×0.25°. Physical parameterization schemes adopted in the two simulations are described in Table 1. Seen from the similarity of the pattern and intensity of the precipitation in both cases in Figures 1E–H, the two simulations reproduced the two events well. Validity of the other parameters are performed and described in our previous study (Ma et al., 2021).
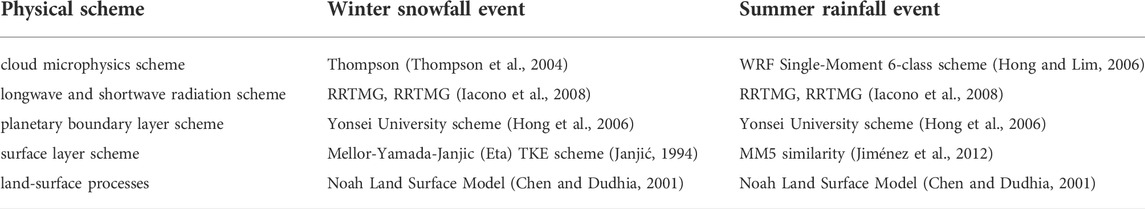
TABLE 1. Model scheme settings.
2.3 Flow decomposition approaches
2.3.1 Barnes filter
The Barnes band-pass filter is constructed on the basis of the Barnes objective analysis scheme (Maddox, 1980) and is used to smooth parameters such as geopotential height and wind fields (Xu et al., 2017; Xue et al., 2018). First, each grid point is assigned a first-guess value
where
where
The horizontal velocity field v and specific humidity
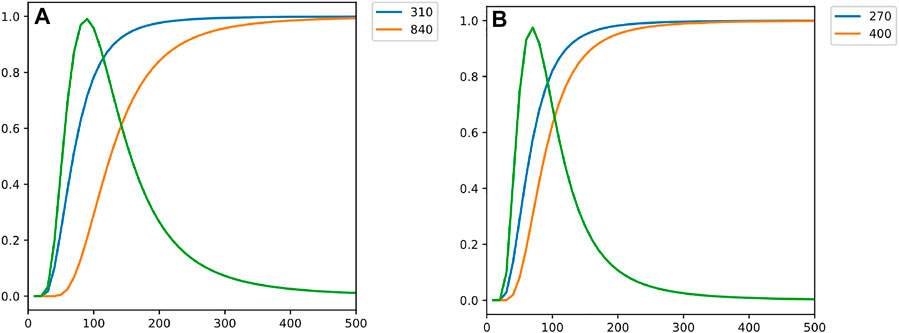
FIGURE 2. The band-pass filter response functions of (A) rainfall in 2021 and (B) snowstorm in 2018. The orange line and blue line are for the low-pass filters used to define te bandpass filter represented by the green line, the numbers in the upper right corner of the figure represent filter parameters.
2.3.2 Synoptic decomposition method based on the Helmholtz theorem
According the Helmholtz theorem, a horizontal velocity field v can be partitioned into rotational and divergent components represented by stream function ψ and velocity potential χ, respectively, as follows:
where k is the unit vector in the vertical direction and ∇ is the horizontal gradient operator. There are analytical solutions for Eqs. 2.1, 2.2, 2.3 in unlimited domains or global situations. But for the limited domain, the accurate solutions are thoroughly studied for decades (Sangster, 1960; Lynch, 1989; Chen and Kuo, 1992a, 1992b; Xu et al., 2011). Recently a hybrid method is designed and applied for computing the stream function and velocity potential for complex flow fields over mesoscale domains (Cao et al., 2022a), and it is adopted in the following calculation.
2.3.3 Decomposition of water vapor flux divergence
Water vapor flux divergence under the terrain-following coordinate system (denoted by Qall), and its three components: flow divergence, moisture convection term by non-divergent or slow manifold, and moisture convection term by divergent or fast manifold (denoted as Qdiv, QS, and QF, respectively) are re-derived as:
Here,
Here, A represents any variable. The subscript s represents the horizontal direction (x or y).
3 Moisture flux divergence analysis
Qdiv shares similar quantities and evolving patterns with Qall at all levels. However, neither of them presents divergent signals before the precipitation weakens. In winter snowstorms of short durations, the divergence regions at the middle levels seen in Qall (Figure 3A) are blocked by large convergence at the middle and low levels (Figure 3B). In the summer case with persistent rainfall, divergent signals presented by Qall (Figure 3E) show up after the precipitation reaches its maximum, and the divergence is weaker in Qdiv (Figure 3F). Large convergent regions in Qall and Qdiv are also blocked at the middle levels as rainfall ends. Therefore, though occupying the largest magnitude in Qall, Qdiv fails to identify the weakening or ceasing of precipitation in both torrential events.
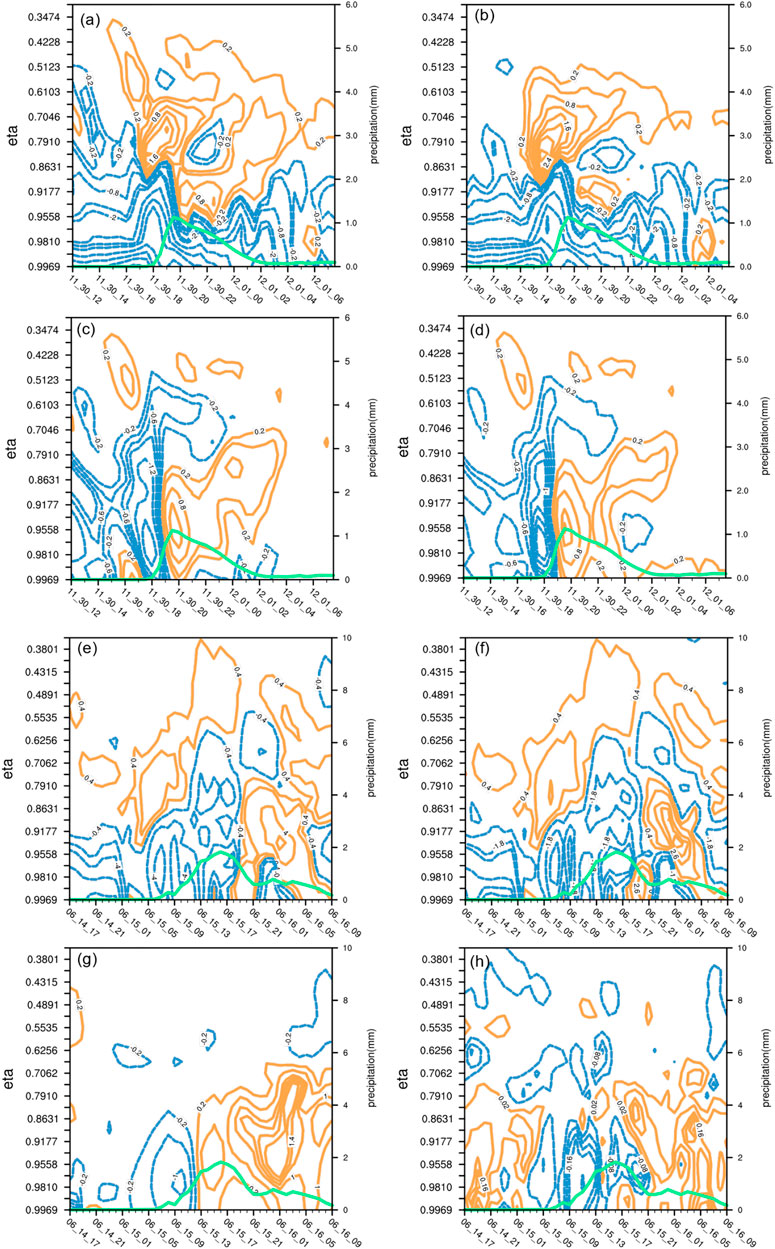
FIGURE 3. Domain averaged (A) Qall, (B) Qdiv, (C) QBS and (D) QHS in the unit of 10−7 g cm−2 hPa−1 s−1 in the winter case from 1200UTC 30 November to 0730 UTC 1 December with the target domain marked by a blue rectangular region in Figure 1F. (E–H) are the same except for the summer case from 1700UTC 14 to 0900UTC 16 June with the target domain marked by a red rectangular region in Figure 1H. The green curves represent the 30-min accumulated precipitation (right y-axis, units: mm).
In both winter and summer events presented in Figure 3, Qdiv (Figures 3B,F) shares the evolving patterns as Qall (Figures 3A,E) at all levels with dominant quantities compared to the other two components. However, neither of them in both events discloses the divergent signals before precipitation weakens, as shown by the green curves. To be specific, the large divergent regions of Qall (Figure 3A) after 20 UTC Nov. 30 above the middle levels are blocked by large convergent areas at lower levels which have resulted from negative values in Qdiv (Figure 3B). Meanwhile, the convergent signals presented by Qall (Figure 3E) and Qdiv (Figure 3F) still occupy low and middle levels over the target domain for around 6 h after the precipitation reaches its maximum. Furthermore, as the rainfall ends, there is still large convergent Qdiv transporting downward which contradicts with the precipitating characteristics. Therefore, though occupying the largest magnitude in Qall, Qdiv fails to identify the weakening or ceasing of precipitation in both torrential events.
QBS in both events (Figures 3C,G) present strong convergence as precipitation increases, and abruptly change to divergence before precipitation weakens. QHS (Figures 3D,H) performs slightly better compared to QBS (Figures 3C,G) in both the winter event with uniform divergence at lower levels since 20 UTC Nov. 30, and the summer event with small convergent areas before rainfall increases since 21 UTC June 15. As a short conclusion, the decomposed QS by both the Barnes filter and synoptic methods are useful for depicting the precipitating evolutions during the winter and summer events, while the latter performs better.
However, the accuracy between the reconstructed velocity and the initial one in winter is much lower than the summer case mainly due to the fact that the wind field is more complicated in the short duration snowstorm. The deviations of the reconstructed zonal and meridional wind component by the synoptic method and Barnes filter to their corresponding initial one over the target domain are investigated. In the winter, meridional differences by the synoptic method (Figure 4A) keep a uniform vertical distribution with a small magnitude of the same order as in the summer, while those by the Barnes filter (Figure 4B) are tremendously amplified with maximum centers after a snowstorm. Zonal differences by the synoptic method (Figure 4C) show a uniform distribution vertically, while those by the Barnes filter (Figure 4D) with the same magnitude but increase evidently as the rainfall intensifies in the summer. The power spectral density of the vertical velocity in the summer event (Figure 4F) is evidently less complicated than that in the winter (Figure 4E) event. Therefore, the capability for accurately reconstructing the complex flow field may be a reason for the better performance of the synoptic method over the Barnes filter in both summer and winter events.
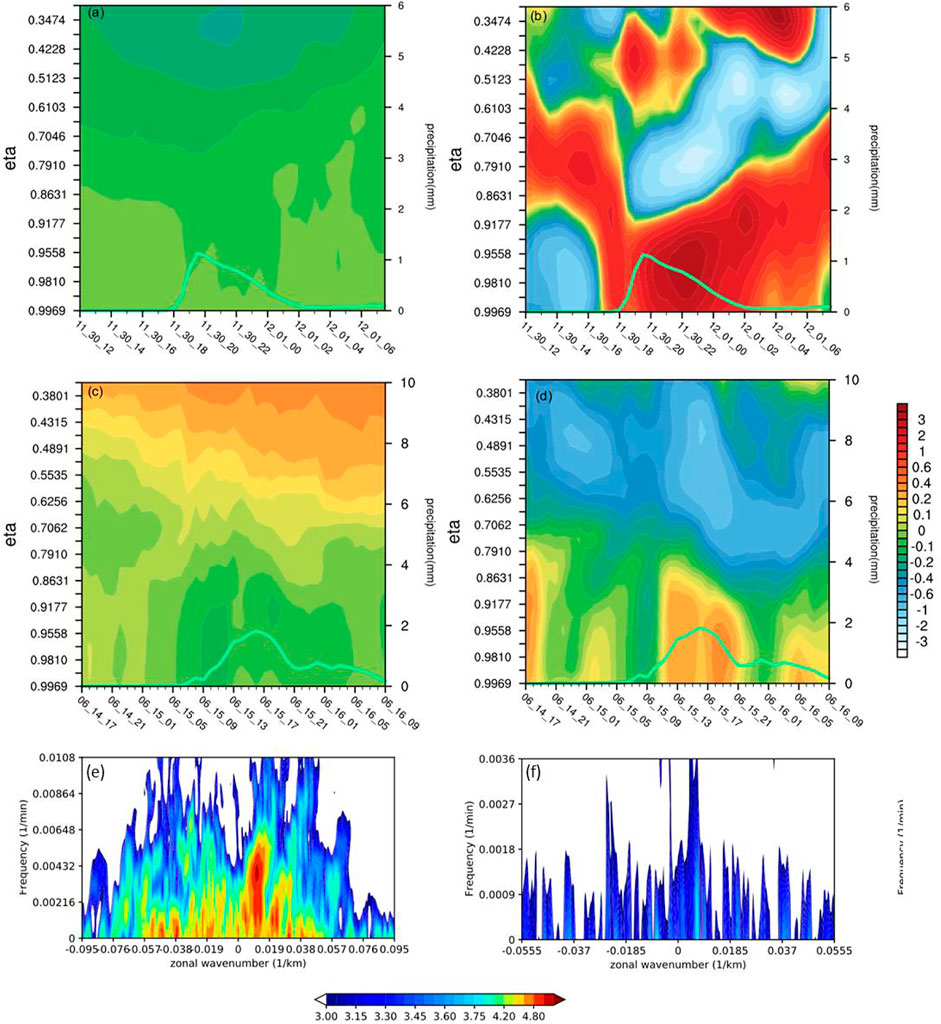
FIGURE 4. Domain averaged meridional wind residual by using (A) the synoptic method, (B) the Barnes filter in winter case, zonal wind residual by using (C) the synoptic method, and (D) the Barnes filter in summer case. The target domains are marked by blue and red rectangular regions in Figures 1F,H, respectively. Unit is m s−1. Power spectral density of the vertical velocity at the height of 12 km (E) along 44.5°N in the winter case, and (F) 37.2°N in the summer case. Unit is m2· s−2.
Another possible reason for the worse situation by the Barnes filter in the winter event may due to the less abundance but more variable moisture. The moisture is thus decomposed by the Barnes filter with the same response function in Figure 1B to further decompose q into slow and fast manifold components as follows:
Substituting Eq. 4.1 into Eq. 3.3 leads to:
Here, the subscript B denotes the Barnes filter, the superscript m denotes mean, and d denotes disturbance. QBS is the moisture convection term by non-divergent or slow manifold based on the Barnes filter, QBSm is the mean component of the moisture convection term by non-divergent or slow manifold based on the Barnes filter, QBSd is the disturbed component of the moisture convection term by non-divergent or slow manifold based on the Barnes filter, QBFm is the mean component of the moisture convection term by divergent or fast manifold based on the Barnes filter.
Compared to the weak convergence in QBS (Figure 3C) when a snowstorm weakens, the decomposed mean component of QBSm (Figure 5A) keeps uniform divergence as precipitation ceases. It can be seen from QBSd (Figure 5B) that the false convergence signal is resulted from q’. This can be seen vividly in the distributions of q (Figure 5E) and its decomposed components (Figures 5F,G). However, both QBSm and QBSd in the summer event remain uniformly divergent as precipitation ceases and convergent as it increases, as shown in Figures 5C,D with q and its components keeping the same signals (Figs. omitted). This proves the necessity of further decomposing q especially for the winter event with complicated flow patterns.
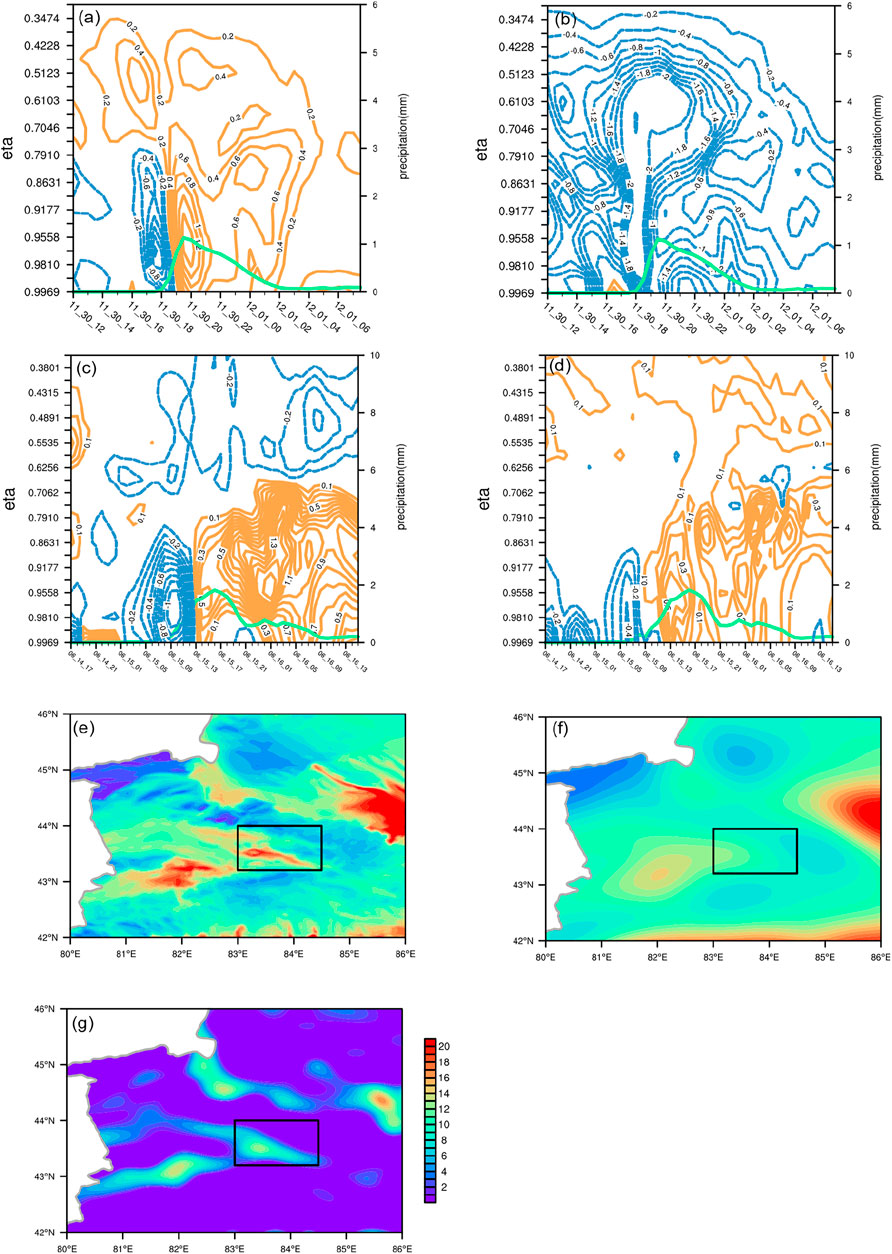
FIGURE 5. Domain averaged (A) QBSm, (B) QBSd in the unit of 10−7 g cm−2 hPa−1 s−1, (E) q, (F) qm, and (G) q’ at η=0.9558 (shaded, unit: 10−4 kg kg−1) at 2330 UTC on 30 Nov in winter case. Domain averaged (C) QHSm, (D) QHSd in the unit of 10−7 g cm−2 hPa−1 s−1 in summer case.
4 Conclusion and discussions
In the research of extreme precipitation climate events, the method of decomposing the influence of water vapor flux divergence (Qall) into climatic and large-scale systems has been mature. For extreme precipitation weather events, similar ideas are adopted to separate the influence of synoptic and sub-synoptic scale weather systems represented by slow and fast manifolds, respectively, in this study with the purpose to better forecast precipitation.
The statistical Barnes filter method and the synoptic decomposition approach are adopted by dividing Qall under the terrain-following coordinate system into three components, i.e., Qdiv, QS, and QF. These components represent flow divergence, moisture convection term by slow and fast manifolds. A blizzard process with a short duration and weak moisture and a persistent rainstorm event with abundant water vapor are investigated with both traditional synoptic analysis and decomposition methods. The main results are as follows:
(1) Qdiv, which is directly related to the convergence and divergence of the large-scale velocity field, always occupies the biggest magnitude in Qall. During the periods of intensification and weakening of extreme precipitation events, Qall at the middle and lower levels converges which contradicts to the ceasing of the precipitation. Vertical distributions that show the divergent signals of mid-to-high-level Qall are blocked at the middle and high levels.
(2) Although QS, which represents specific humidity transportation by large-scale motions, only accounts for 10% in Qall, visible divergent regions at the middle and low levels can be seen before precipitation weakens.
(3) In the persistent rainfall event, QS obtained by the Barnes filter and synoptic method show similar temporal and spatial evolutions better than Qall. In the short-term snowfall event, QS obtained by the Barnes filter presents a false convergence signal when the snow is about to end. There are two possible reasons for this deficiency. One is the evident low accuracy of reconstructed flow field by the Barnes filter which may be caused by the complexity of the original velocity field. The other reason is the increased discrete error introduced by differentiating weak moisture. By further decomposing specific humidity into its mean and disturbance components, the latter problem is partially relived.
The two decomposition methods can provide superior indicators for the prediction of extreme precipitation weather events, especially the decrease and termination of precipitation. However, the accuracy of the Barnes filter method is more related to the complexity of flow fields as well as the moisture conditions. In the future, this research will combine these two scale decomposition methods with high-resolution numerical models, and carry out research on other material transport and aggregation such as dust in other parts of the earth.
Data availability statement
The raw data supporting the conclusions of this article will be made available by the authors, without undue reservation.
Author contributions
The JC and SM analyzed and wrote the article, and the LR is responsible for the simulation of extreme precipitation cases.
Funding
This work was supported by the National Natural Science Foundation of China Grants 91937301 and 41875074, the Second Tibetan Plateau Comprehensive Scientific Expedition 2019QZKK0104, the Startup Foundation for Introducing Talent of NUIST 2022r004, and the National Key Scientific and Technological Infrastructure Project “EarthLab”.
Acknowledgments
The authors are thankful to the anonymous reviewers for their comments and suggestions on the original manuscript that improved the structures and presentations of the results. The authors are thankful to Drs. Xin XU and Shaofeng HUA for providing the codes of the Barnes filter. The computing for this project was performed at the Supercomputing Center for Education and Research at the University of Oklahoma (OU), United States.
Conflict of interest
The authors declare that the research was conducted in the absence of any commercial or financial relationships that could be construed as a potential conflict of interest.
Publisher’s note
All claims expressed in this article are solely those of the authors and do not necessarily represent those of their affiliated organizations, or those of the publisher, the editors, and the reviewers. Any product that may be evaluated in this article, or claim that may be made by its manufacturer, is not guaranteed or endorsed by the publisher.
References
Allen, J. (1991). Balanced equations based on momentum equations with global invariants of potential enstrophy and energy. J. Phys. Oceanogr. 21, 265–276. doi:10.1175/1520-0485(1991)021<0265
Barnes, S. (1973). Mesoscale objective map analysis using weighted time series observations. NOAA Tech. Memo. ERL NSSL- 62, 60.
Cao, J., Xu, Q., Ma, S., and Chen, H. (2022a). Hybrid methods for computing streamfunction and velocity potential for complex flow fields over mesoscale domains. Adv. Atmos. Sci. 39, 1417–1431. doi:10.1007/s00376-021-1280-y
Cao, J., Zhou, G., Liu, L., Zhao, W., and Yan, Y. (2022b). Kinetic energy budget analyses among different quadrants during typhoon recurvature: A case study of Typhoon Rumbia (2018). Atmos. Res. 278, 106319. doi:10.1016/j.atmosres.2022.106319
Chen, F., and Dudhia, J. (2001). Coupling an advanced land-surface/hydrology model with the Penn State/NCAR MM5 modeling system. Part I: Model description and implementation. Mon. Wea. Rev. 129, 569–585. doi:10.1175/1520-0493(2001)129%3C0569
Chen, Q., and Kuo, Y. (1992b). A consistency condition for wind-field reconstruction in a limited area and a harmonic-cosine series expansion. Mon. Wea. Rev. 120, 2653–2670. doi:10.1175/1520-0493(1992)120<2653:ACCFWF>2.0.CO;2
Chen, Q., and Kuo, Y. (1992a). A harmonic-sine series expansion and its application to the partitioning and reconstruction problem in a limited area. Mon. Wea. Rev. 120, 91–112. doi:10.1175/1520-0493
Deng, H., Chen, Y., Shi, X., Li, W., Wang, H., Zhang, S., et al. (2014). Dynamics of temperature and precipitation extremes and their spatial variation in the arid region of northwest China. Atmos. Res. 138, 346–355. doi:10.1016/j.atmosres.2013.12.001
Dimego, G., and Bosart, L. (1982). The transformation of tropical storms Agnes into an extratropical cyclone, Part I: The observed fields and vertical motion computations. Mon. Wea. Rev. 110, 385–411. doi:10.1175/1520-0493
Doswell, C. (1977). Obtaining meteorologically significant surface divergence fields through the filtering property of objective analysis. Mon. Wea. Rev. 105, 885–892. doi:10.1175/1520-0493
Gao, S., Mao, J., Zhang, W., Zhang, F., and Shen, X. (2021). Atmospheric moisture shapes increasing tropical cyclone precipitation in southern China over the past four decades. Environ. Res. Lett. 16, 034004. doi:10.1088/1748-9326/abd78a
Gao, S., Zhai, S., Chen, B., and Li, T. (2017). Water budget and intensity change of tropical cyclones over the western North pacific. Mon. Weather Rev. 145, 3009–3023. doi:10.1175/mwr-d-17-0033.1
Gerrity, J. (1972). The potential vorticity theorem in general s-coordinates. Natl. Meteorol. Cent. Off. Note 76, 5.
Gomis, D., and Alonso, S. (1990). Diagnosis of a cyclogenetic event in the western Mediterranean using an objective technique for scale separation. Mon. Wea. Rev. 118, 723–736. doi:10.1175/1520-0493(1990)118<0723:DOACEI>2.0
Hasselmann, K. (1976). Stochastic climate models, Part I: Theory. Tellus 28, 473–485. doi:10.1111/j.2153-3490.1976.tb00696.x
Hawkins, H. F., and Rosenthal, S. L. (1965). On the computation of stream functions from the wind field. Mon. Wea. Rev. 93, 245–252. doi:10.1175/1520-0493(1965)093<0245:OTCOSF>2.3
Hong, S. Y., and Lim, J. O. J. (2006). The WRF single-moment 6-class microphysics scheme (WSM6). J. Korean Meteor. Soc. 42, 129–151.
Hong, S. Y., Noh, Y., and Dudhia, J. (2006). A new vertical diffusion package with an explicit treatment of entrainment processes. Mon. Weather Rev. 134, 2318–2341. doi:10.1175/MWR3199.1
Hu, Q., Zhao, Y., Huang, A. N., Ma, P., and Ming, J. (2021). Moisture transport and sources of the extreme precipitation over northern and southern Xinjiang in the summer half-year during 1979–2018. Front. Earth Sci. 9, 770877. doi:10.3389/feart.2021.770877
Hu, Z., Li, Q., Chen, X., Teng, Z., Chen, C., Yin, G., et al. (2016). Climate changes in temperature and precipitation extremes in an alpine grassland of central Asia. Theor. Appl. Climatol. 126, 519–531. doi:10.1007/s00704-015-1568-x
Hu, Z., Zhang, C., Hu, Q., and Tian, H. (2014). Temperature changes in central Asia from 1979 to 2011 based on multiple datasets. J. Clim. 27, 1143–1167. doi:10.1175/JCLI-D-13-00064.1
Hu, Z., Zhou, Q., Chen, X., Qian, C., Wang, S., and Li, J. (2017). Variations and changes of annual precipitation in central Asia over the last century. Int. J. Climatol. 37, 157–170. doi:10.1002/joc.4988
Huang, A., Zhou, Y., Zhang, Y., Huang, D., Zhao, Y., and Wu, H. (2014). Changes of the annual precipitation over central Asia in the twenty-first century projected by multimodels of CMIP5. J. Clim. 27, 6627–6646. doi:10.1175/JCLI-D-14-00070.1
Huang, W., Feng, S., Chen, J., and Chen, F. (2015). Physical mechanisms of summer precipitation variations in the Tarim Basin in northwestern China. J. Clim. 28, 3579–3591. doi:10.1175/JCLI-D-14-00395.1
Iacono, M., Delamere, J. S., Mlawer, E. J., Shephard, M. W., Clough, S. A., and Collins, W. D. (2008). Radiative forcing by long-lived green-house gases: Calculations with the AER radiative transfer models. J. Geophys. Res. 113, D13103. doi:10.1029/2008JD009944
IPCC (2021). Climate change 2021 the physical science basis. available at: https://www.ipcc.ch/report/ar6/wg1/downloads/report/IPCC_AR6_WGI_Full_Report.pdf.
Janjić, Z. I. (1994). The step-mountain eta coordinate model: Further developments of the convection, viscous sublayer, and turbulence closure schemes. Mon. Wea. Rev. 122, 927–945. doi:10.1175/1520-0493(1994)122<0927:TSMECM>2.0
Jiang, J., Zhou, T., Chen, X., and Zhang, L. (2020). Future changes in precipitation over central Asia based on CMIP6 projections. Environ. Res. Lett. 15, 054009. doi:10.1088/1748-9326/ab7d03
Jiménez, P. A., Dudhia, J., González-Rouco, J. F., Navarro, J., Montávez, J. P., and García-Bustamante, E. (2012). A revised scheme for the WRF surface layer formulation. Mon. Weather Rev. 140, 898–918. doi:10.1175/MWR-D-11-00056.1
Knapp, A. K., Beier, C., Briske, D. D., Classen, A. T., Luo, Y., Reichstein, M., et al. (2008). Consequences of more extreme precipitation regimes for terrestrial ecosystems. BioScience 58, 811–821. doi:10.1641/B580908
Leith, C. (1980). Nonlinear normal mode initialization and quasi-geostrophic theory. J. Atmos. Sci. 37, 958–968. doi:10.1175/1520-0469(1980)037<0958:NNMIAQ>2.0
Li, Z., Chen, Y., Li, W., Deng, H., and Fang, G. (2015). Potential impacts of climate change on vegetation dynamics in central Asia. J. Geophys. Res. Atmos. 120, 12345–12356. doi:10.1002/2015JD023618
Lorenz, E. (1980). Attractor sets and quasi-geostrophic equilibrium. J. Atmos. Sci. 37, 1685–1699. doi:10.1175/1520-0469(1980)037<1685
Lorenz, E. (1986). On the existence of a slow manifold. J. Atmos. Sci. 43, 1547–1558. doi:10.1175/1520-0469(1986)043<1547
Lynch, P. (1989). Partitioning the wind in a limited domain. Mon. Wea. Rev. 117, 1492–1500. doi:10.1175/1520-0493(1989)117<1492
Ma, Q. R., Zhang, J., Ma, Y. J., Game, A. T., Chen, Z. H., Chang, Y., et al. (2021). How do multiscale interactions affect extreme precipitation in eastern central Asia? J. Clim. 34, 7475–7491. doi:10.1175/JCLI-D-20-0763.1
Ma, S. P., Cao, J., Zhao, H. J., Zhou, X., and Ran, L. K. (2022). Decomposition of water vapor flux divergence and its application to a blizzard event over Ili Valley in Central Asia during 30 Nov to 1 Dec 2018. Atmos. Res. 270, 106079. doi:10.1016/j.atmosres.2022.106079
Maddox, R. A. (1980). An objective technique for separating macroscale and mesoscale features in meteorological data. Mon. Wea. Rev. 108, 1108–1121. doi:10.1175/1520-0493(1980)108<1108
Malsy, M., Beek, T. A. D., and Floerke, M. (2015). Evaluation of large-scale precipitation data sets for water resources modelling in Central Asia. Environ. Earth Sci. 73, 787–799. doi:10.1007/s12665-014-3107-y
Qin, P. H., Xie, Z. H., Zou, J., Liu, S., and Chen, S. (2021). Future precipitation extremes in China under climate change and their physical quantification based on a regional climate model and CMIP5 model simulations. Adv. Atmos. Sci. 38, 460–479. doi:10.1007/s00376-020-0141-4
Renfrew, I. A., Thorpe, A., and Bishop, C. H. (1997). The role of the environmental flow in the development of secondary frontal cyclones. Q. J. R. Meteorol. Soc. 123, 1653–1675. doi:10.1002/qj.49712354210
Sangster, W. (1960). A method of representing the horizontal pressure force without reduction of station pressure to sea level. J. Meteor. 17, 166–176. doi:10.1175/1520-0469(1960)017<0166:AMORTH>2.0
Seager, R., Naik, N., and Vecchi, G. A. (2010). Thermodynamic and dynamic mechanisms for large-scale changes in the hydrological cycle in response to global warming. J. Clim. 23, 4651–4668. doi:10.1175/2010JCLI3655.1
Sun, J. S. (2017). Differences and relationship between flash heavy rain and heavy rainfall (in Chinese). Torrential Rain Disasters 36, 498–506. doi:10.3969/j.issn.1004-9045.2017.06.002
Thompson, G., Rasmussen, R. M., and Manning, K. (2004). Explicit forecasts of winter precipitation using an improved bulk microphysics scheme. Part I: Description and sensitivity analysis. Mon. Wea. Rev. 132, 519–542. doi:10.1175/15200493(2004)132<0519
Trenberth, K. E., and Guiliemot, C. J. (1995). Evaluation of the global atmospheric moisture budget as seen from analyses. J. Clim. 8, 2255–2272. doi:10.1175/1520-0442(1995)008<2255
Ullah, W., Wang, G., Gao, Z., Hagan, D., Bhatti, A., and Zhua, C. (2020). Observed linkage between Tibetan plateau soil moisture and south asian summer precipitation and the possible mechanism. J. Clim. 34, 361–377. doi:10.1175/jcli-d-20-0347.1
Ullah, W., Wang, G., Lou, D., Ullah, S., Bhatti, A., Ullah, S., et al. (2021). Large-scale atmospheric circulation patterns associated with extreme monsoon precipitation in Pakistan during 1981-2018. Atmos. Res. 232, 105489. doi:10.1016/j.atmosres.2021.105489
Wang, X., and Wang, X. (2021). Spatial distribution and temporal variation characteristics of rainstorm flood disasters with different intensities in southern Xinjiang from 1980 to 2019. J. Glaciol. Geocryol. 43, 1818–1828. (in Chinese with English abstract).
Wu, Z. Y., Cao, J., Zhao, W., Ke, Y. H., and Li, X. (2022). An observational analysis of a persistent extreme precipitation event in the post-flood season over a tropical Island in China. Atmos. (Basel). 13, 679. doi:10.3390/atmos13050679
Xu, Q. (1992). A geostrophic pseudo-vorticity and geostrophic C-vector forcing- A new look at the Q vector in three dimensions. J. Atmos. Sci. 49, 981–990. doi:10.1175/1520-0469(1992)049<0981:APAGCV>2.0.CO;2
Xu, Q., Cao, J., and Gao, S. (2011). Computing streamfunction and velocity potential in a limited domain of arbitrary shape. Part I: Theory and integral formulae. Adv. Atmos. Sci. 28, 1433–1444. doi:10.1007/s00376-011-0185-6
Xu, X., Xue, M., Wang, Y., and Huang, H. (2017). Mechanisms of secondary convection within a mei-yu frontal mesoscale convective system in eastern China. J. Geophys. Res. Atmos. 122, 47–64. doi:10.1002/2016JD026017
Xue, M., Luo, X., Zhu, K., Sun, Z., and Fei, J. (2018). The controlling role of boundary layer inertial oscillations in Meiyu frontal precipitation and its diurnal cycles over China. J. Geophys. Res. Atmos. 123, 5090–5115. doi:10.1029/2018JD028368
Yin, Z. Y., Wang, H., and Liu, X. (2014). A comparative study on precipitation climatology and interannual variability in the lower midlatitude East Asia and central Asia. J. Clim. 27, 7830–7848. doi:10.1175/JCLI-D-14-00052.1
Zhang, M., Chen, Y., Shen, Y., and Li, Y. (2017). Changes of precipitation extremes in arid central Asia. Quat. Int. 436, 16–27. doi:10.1016/j.quaint.2016.12.024
Zhang, W., Furtado, K., Wu, P., Zhou, T., Chadwick, R., Marzin, C., et al. (2021). Increasing precipitation variability on daily-to-multiyear timescales in a warmer world. Sci. Adv. 7, eabf8021. doi:10.1126/sciadv.abf8021
Zhao, Y., and Zhang, H. (2016). Impacts of SST Warming in tropical Indian Ocean on CMIP5 model-projected summer rainfall changes over Central Asia. Clim. Dyn. 46, 3223–3238. doi:10.1007/s00382-015-2765-0
Zhou, T. J., and Yu, R. C. (2005). Atmospheric water vapor transport associated with typical anomalous summer rainfall patterns in China. J. Geophys. Res. 110, D08104. doi:10.1029/2004JD005413
Keywords: extreme precipitation, flow decomposition, Helmholtz theorem, Barnes filter, moisture flux divergence
Citation: Cao J, Ma S and Ran L (2022) Comparative analysis of two flow decomposition approaches and their applications in diagnosing water vapor in extreme precipitation events over Xinjiang province, China. Front. Earth Sci. 10:847317. doi: 10.3389/feart.2022.847317
Received: 02 January 2022; Accepted: 01 August 2022;
Published: 30 August 2022.
Edited by:
Sanjeev Kumar Jha, Indian Institute of Science Education and Research, IndiaReviewed by:
Junqiang Yao, China Meteorological Administration, ChinaChenghai Wang, Lanzhou University, China
Copyright © 2022 Cao, Ma and Ran. This is an open-access article distributed under the terms of the Creative Commons Attribution License (CC BY). The use, distribution or reproduction in other forums is permitted, provided the original author(s) and the copyright owner(s) are credited and that the original publication in this journal is cited, in accordance with accepted academic practice. No use, distribution or reproduction is permitted which does not comply with these terms.
*Correspondence: Shuping Ma, bWFzaHVwaW5nQG1haWwuaWFwLmFjLmNu