
94% of researchers rate our articles as excellent or good
Learn more about the work of our research integrity team to safeguard the quality of each article we publish.
Find out more
ORIGINAL RESEARCH article
Front. Earth Sci., 05 April 2022
Sec. Structural Geology and Tectonics
Volume 10 - 2022 | https://doi.org/10.3389/feart.2022.846949
This article is part of the Research TopicContinental Basin and Orogenic Processes: Tectonic Deformation and Associated Landscape and Environmental EvolutionView all 15 articles
 Guoqiang Zhao
 Zhengyang Pan*
The Qilian fold-and-thrust belt (QFTB) offers an excellent example to demonstrate the strain transition from strike–slip shearing to oblique crustal shortening, which plays an important role in dissecting the stress propagation of Indian–Eurasian convergence from the plateau interior to the surrounding blocks. Various geological or numerical models have attempted to describe the regional tectonic characteristics of the QFTB. However, these models only interpret one or part of the deformation behaviors in the QFTB, and the strain distribution across and along the QFTB as well as its deformation kinematics remains to be determined. Therefore, in this work, we applied the method of velocity decomposition and cluster analysis using combined GPS data to determine the strain partition or accommodation in different parts of the QFTB as well as tectonic relationships with surrounding blocks, which will contribute to distinguishing which model is more suitable for delineating the present-day deformation kinematics of the QFTB. Our analysis indicates that the western part of the QFTB is dominated mainly by crustal shortening perpendicular to the trend of the QFTB, coupled with lateral extension along the trend of the QFTB, while the eastern part of the QFTB is characterized mainly by lateral extrusion owing to the impact of two large eastward-striking left-slip faults (East Kunlun fault and Haiyuan fault), which are accommodated by an obvious velocity gradient boundary belt centered on two diamond basins (Qinghaihu and Gonghe basins) associated with their boundary faults. The active tectonics of the QFTB are obviously divided into two distinct groups: one group is a pure shear–strain pattern, accounting for strong crustal shortening in the western part of the QFTB, and the other group is a simple shear–strain pattern, accounting for the obvious lateral extrusion in the eastern part of the QFTB.
The Qilian fold-and-thrust belt (QFTB) is located on the northeastern forefront boundary of the Tibetan Plateau, adjoining the Alashan Block and Ordos Block, which provides a natural laboratory to study how the deformation pattern of the periphery of the Tibetan Plateau is influenced by the remote effect of Indian–Eurasian convergence (Burchfiel et al., 1989; Tapponnier et al., 1990; Meyer et al., 1998; Dupont-Nivet et al., 2004; Lease et al., 2012; Yuan et al., 2013). At the same time, the QFTB also offers the best place to quantify the formation and evolution of large left-lateral strike–slip faults (Altyn Tagh fault, Haiyuan fault, and East Kunlun fault), partitioning or accommodating the strain diffusion of Indian–Eurasian convergence (Burchfiel et al., 1991; Meyer et al., 1996; Kirby et al., 2007; Zheng D. et al., 2017). The junction between the North–South Seismic Belt and the Haiyuan–Liupanshan–Luohe Seismic Belt has hosted more than ten earthquakes of magnitude 7 or higher in the past several hundred years in the QFTB, including the famous Haiyuan 8.5 earthquake and the Gulang 8.0 earthquake (Gaudemer et al., 1995; Zhang, 2013). These intense tectonic activities are inextricably linked to fault strain accumulation and regional stress concentrations in the QFTB (Hu et al., 2017; Pan et al., 2020). Therefore, studying contemporary deformation around the QFTB can not only contribute to a better understanding of how the strain from the Indian–Eurasian convergence is allocated between these large-scale strike–slip faults and their surrounding blocks but also facilitate comprehending intracontinental earthquake occurrence processes and fault dynamic behavior and better assessing the risk of earthquakes and geological disasters in this region.
Therefore, in this study, we utilized the updated GPS velocity field and improved the analysis method to further discover subtle deformation characteristics and detailed tectonic kinematics of the QFTB and advanced ongoing research regarding the kinetic mechanisms. First, we combined the previous GPS velocity field and transferred this to a common reference frame and provided a full new map of crustal movement of the QFTB. Next, we decomposed the combined GPS velocity field into the crustal shortening parallel and perpendicular to the trend of the QFTB, which helped quantify how the velocities varied across the different parts of the QFTB. Then, we applied cluster analysis to the combined GPS velocity field, and on each cluster, we utilized the spherical GPS strain algorithm by least-square estimation to discover detailed kinematic characteristics. Finally, by combining the aforementioned results with previous geodetic, geological, and geophysical data, the deformation patterns and the dominant kinematic mechanisms in the QFTB were examined. The results of our study have important significance for further research on the dynamic mechanisms and evolving processes of plateau growth and expansion.
The QFTB defines the northeastern boundary of the Tibetan Plateau, which is characterized by folds, thrust faults, strike–slip faults, and intermontane basins spaced at ∼30–40 km that partially accommodate Indian–Eurasian convergence (Tapponnier et al., 1990; Meyer et al., 1998). It is bounded by several tectonic blocks, which include the Alashan Block to the northeast, Ordos Block to the east of the western North China Craton, Qaidam Block to the southwest, and Tarim Block to the northwest. This orogenic belt is ∼100 km wide and ∼1,000 km long, and its average elevation is ∼4.5 km. Its boundaries comprise several left-lateral strike–slip faults, including the left strike–slip East Kunlun, Altyn Tagh, and Haiyuan faults that extend for ∼1,500, ∼2000, and ∼1,000 km, respectively, which are the longest and most continuous structures on the northeastern Tibetan Plateau (Zuza and Yin, 2016). Among these large strike–slip faults, the NNW- to NWW-trending faults (Riyueshan fault, Elashan fault, Qilian Nanshan thrust faults, and Qaidam Basin thrust faults), associated with secondary tectonic structures, including two diamond basins (Qinghaihu and Gonghe basins), accommodate the internal tectonic deformation of the QFTB (Duvall et al., 2011; Yuan et al., 2013; Lease, 2014; Zuza and Yin, 2016). The formation of the QFTB originated from the closure of the Qilian Ocean during the collision between the Qaidam–Kunlun terrane and North China Craton, which has been considered an example of an ancient oceanic subduction zone that records a complete history of the Proto-Tethyan Ocean from the seafloor spreading and subduction to the ultimate continental collision (Gehrels et al., 2011; Song et al., 2013). To date, it still suffers significant crustal shortening and intensive active deformation (Meyer et al., 1998).
A great deal of achievements has been made on active tectonics of the QFTB and its surrounding regions. For example, horizontal GPS velocities show that the QFTB is experiencing crustal shortening with a horizontal shortening rate of 8.7
Over several decades, a number of GPS velocity fields have been published to constrain the fault activity and regional kinematics of the Tibetan Plateau (Zhang et al., 2004; Gan et al., 2007; Zhao et al., 2015; Zheng G. et al., 2017). On the basis of these results, we can establish a more detailed and delicate crustal movement image by combining the individual velocities relative to a common reference frame, which is achieved by calculating a six-parameter Helmert solution (three rotations and three translations) from the individual frames. Thus, we compiled the recent GPS velocity field of Wang and Shen (2020) covering the plateau and its surroundings, which is based mainly on datasets collected by the Crustal Movement Observation Network of China with relatively long time spans exceeding ∼15 years. Then, we supplemented these solutions with other published GPS velocity data, including the 36 GPS sites reported previously (Su et al., 2018), which are based on datasets collected by the Institute of Earthquake Forecasting Network and local agencies with relatively long time spans exceeding ∼10 years. For more details of the datasets and their processing, refer to Wang and Shen (2020). Here, we used the GPS data of Wang and Shen (2020) as our reference data and transferred the other GPS data by estimating translation and rotation parameters with the program VELROT, which is a part of GAMIT/GLOBK software with a Euler pole (wx = −0.02350 deg/Myr, wy = −0.14760 deg/Myr, and wz = 0.21400 deg/Myr) (Herring et al., 2010). Furthermore, we picked the GPS velocity vectors with one standard deviation < 1.5 mm/yr to obtain the self-consistent resolution, which was directed to avoid contaminating the subsequent strain rate estimation and cluster analysis. Finally, the combined velocity field, including ∼335 GPS stations, is presented in Figure 1.
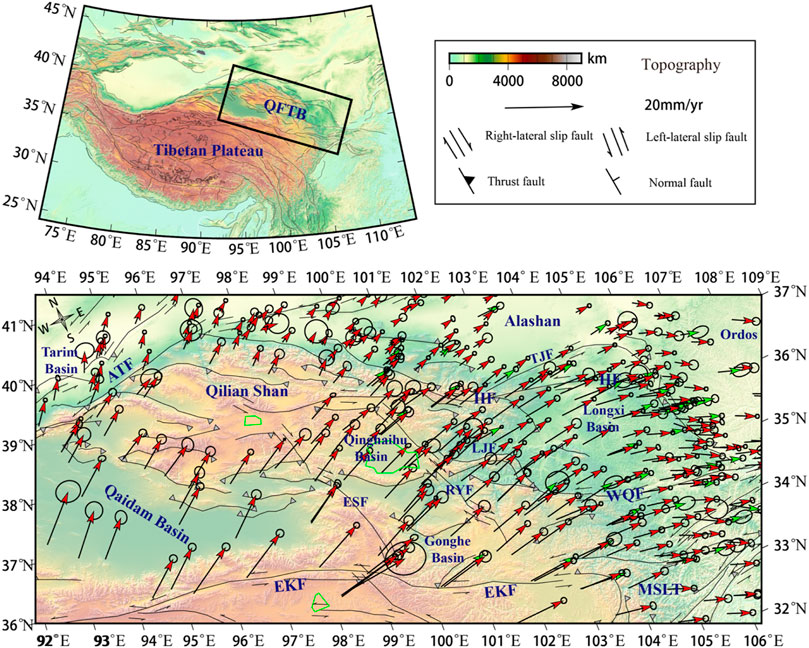
FIGURE 1. Tectonic map of the Qilian fold-and-thrust belt (a) located in the India–Eurasia collisional belt (b) with the combined GPS velocity field including uncertainties (95% confidence ellipses) relative to a Eurasian reference frame. Velocity with red arrows from Wang and Shen (2020) and velocity with green arrows from Su et al., 2018. The black solid lines represent faults from Styron et al. (2010); Zuza and Yin (2016). Abbreviations (from north to south): QFTB = Qilian fold-and-thrust belt; ATF = Altyn Tagh fault; HF = Haiyuan fault; EKF = East Kunlun fault; TJF = Tianjingshan fault; RYF = Riyueshan fault; ESF = Elashan fault; WQF = West Qinling fault; LJF = Laji fault; MSLT = Min Shan–Longmen thrust belt.
In view of the principal stress associated with NE-SW or NEE-SW orientations for most of the Qilian orogenic belt in Pan (2020), which is almost consistent with the orientation of Indian–Eurasian convergence, we decompose the combined GPS velocities into two components: along (or tangential to) and normal (or perpendicular) to the trend of the QFTB (∼NE110 is approximately perpendicular to the aforementioned stress orientation) and calculate the velocity gradient on each of them by the spline in the tension algorithm described previously (Wessel and Bercovici, 1998; Hackl et al., 2009) in Figure 2. To fully reveal the delicate deformation characteristics and regional kinematics, we also present a series of velocity profiles to examine the regional deformation fields in Figures 3, 4.
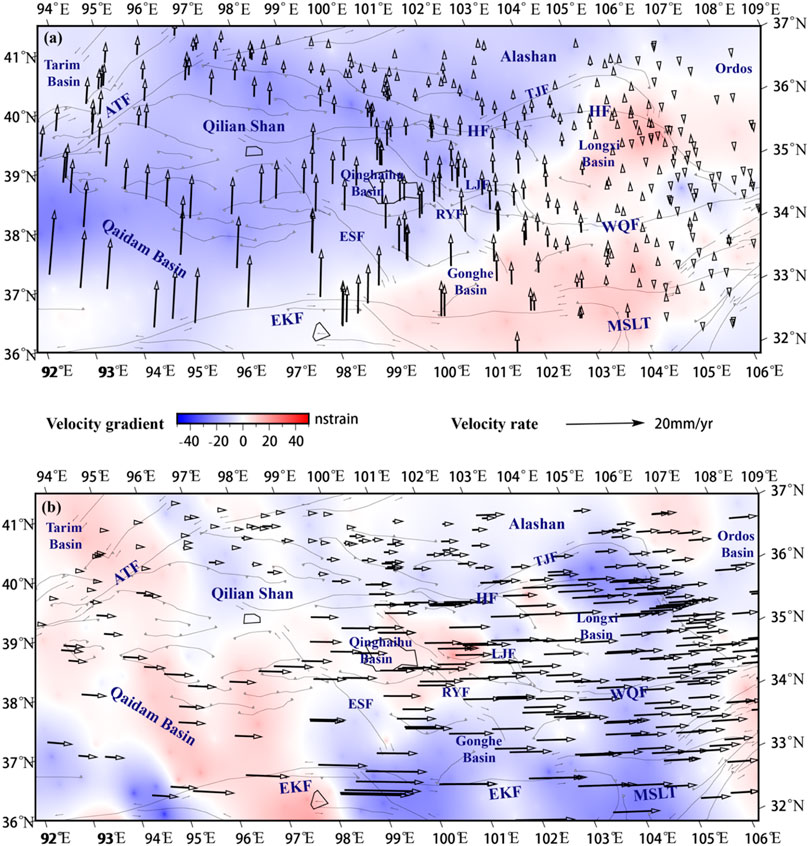
FIGURE 2. (A) GPS velocity component perpendicular to the trend of the QFTB superimposed on the map of its gradient. (B) GPS velocity component along the QFTB superimposed on the map of its gradient.
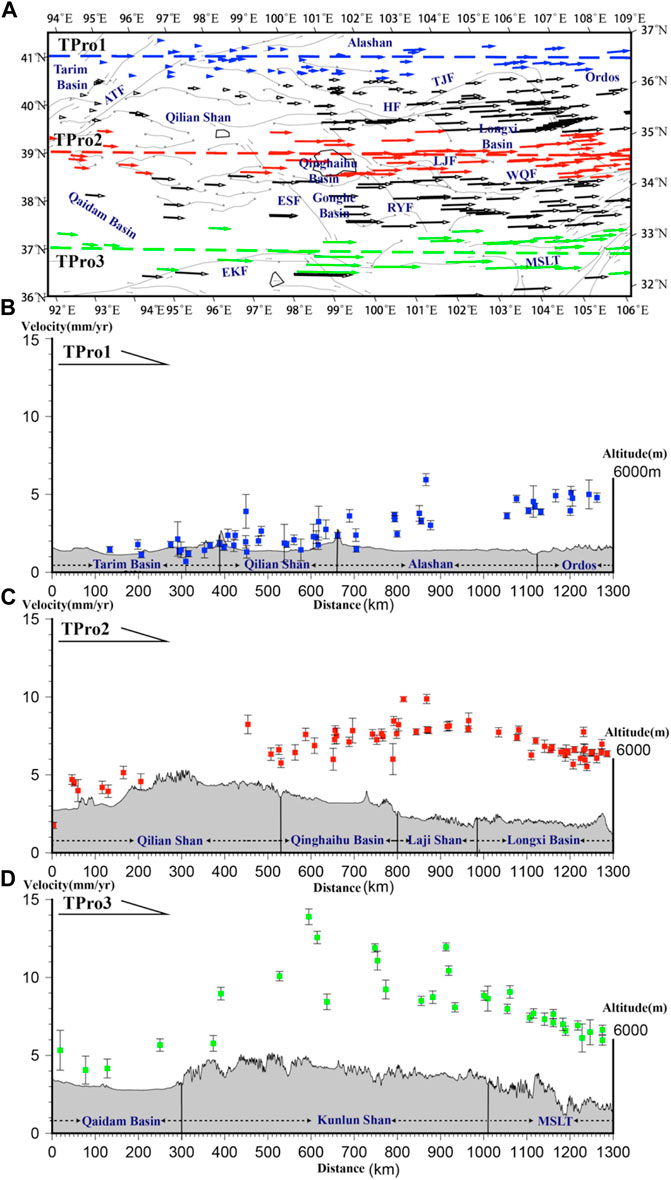
FIGURE 3. (A) Location of three GPS velocity profiles in QFTB. (B) Profile TPro1 of GPS velocity along the trend of the QFTB with 1 error bar. (C) Profile TPro2 of GPS velocity along the trend of the QFTB with 1 error bar. (D) Profile TPro3 of GPS velocity along the trend of the QFTB with 1 error bar.
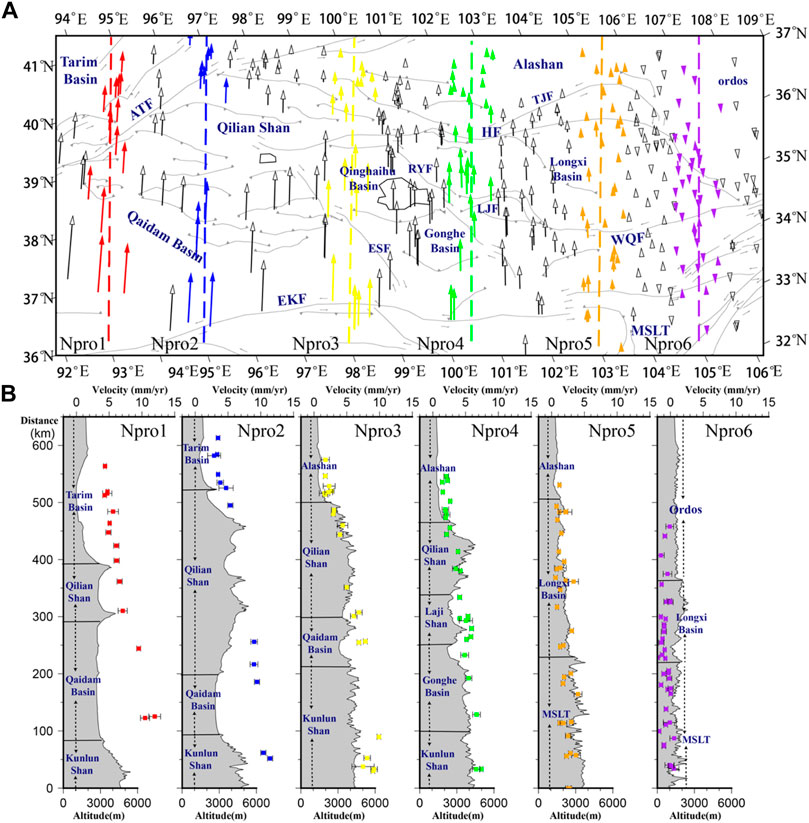
FIGURE 4. (A) Location of six GPS velocity profiles in QFTB. (B) Profile NPro1–6 of GPS velocity perpendicular to the trend of the QFTB with 1 error bar. The colors represent the different velocity profiles and their available GPS stations.
The cluster analysis applied in the GPS velocity field can help us recognize the characteristics of regional crustal movement in an agnostic way without referencing geologic information (Thatcher et al., 2016). At the same time, it also allows us to discover regional boundaries purely based on the velocity field independent of any geophysical model (Granat et al., 2021). The core of the clustering method is to group the available observations and separate the members of each group with similar features from the members of all other groups. This facilitates the discovery of novel boundary features and/or the independent confirmation of other models or theories (Savage and Simpson, 2013). As the number of clusters increases, it will discern which fault plays an important role in the regional deformation (Granat et al., 2021). Here, we adopted k-means clustering according to Simpon (2012) to distinguish the regional feature depending only on the velocity field. Considering the spatial distribution of several large strike–slip faults and many secondary strike–slip and thrust faults within the QFTB, we define the number of microblocks divided by Li (2018) as the largest cluster in cluster analysis and test the different numbers of clusters (k = 2–10) to identify groups of velocities. The results are shown by color coding in Figures 5, 6.

FIGURE 5. Clustering velocity result for K = 2−6 and their calculated principal strain rate and rotational strain rate. a1–e1 represent the velocity result of cluster analysis, and a2–e2 represent the strain rate for each cluster.
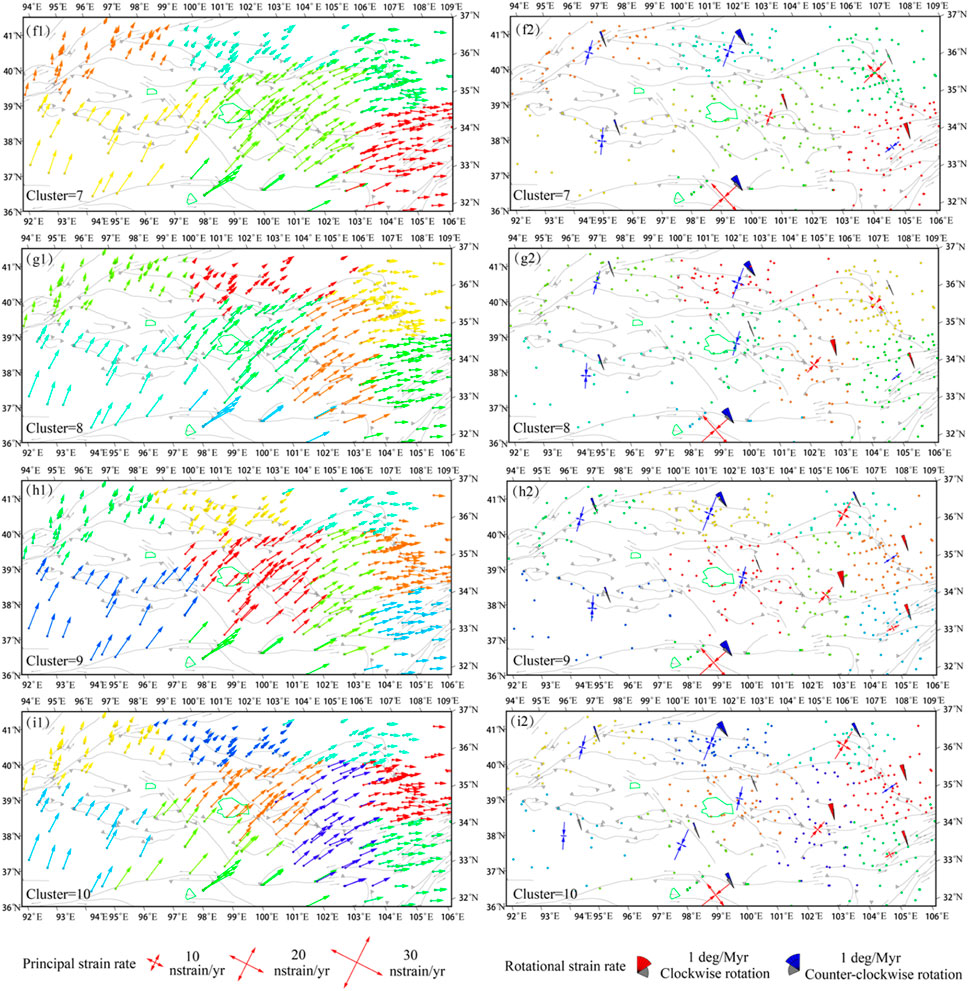
FIGURE 6. Clustering velocity result for K = 7–10 and their calculated principal strain rate and rotational strain rate. f1–i1 represent the velocity result of cluster analysis, and f2–i2 represent the strain rate for each cluster.
Then, we use the method introduced by Savage (2001) to calculate the average strain rate across the regions separated by the cluster analysis to determine how uniform the average strains and rotations are (Savage et al., 2001). The principal strain rate tensors (i.e., the maximum and minimum strain rate tensors) and rotational strain rate are computed as follows:
where i and j are the indices for the east and north directions, respectively,
The results clearly show that the velocities decrease from south of the East Kunlun fault to north of the Qilian Mountains perpendicular to the trend of the QFTB, and present a relatively obvious clockwise rotation from the west to the east along the trend of the QFTB. On a larger scale, this velocity field explicitly reflects distributed and diffusive deformation throughout the QFTB and the surrounding regions as has been discussed by previous geodetic studies (Zhang et al., 2004; Gan et al., 2007; Zhao et al., 2015; Zheng G. et al., 2017; Wang and Shen, 2020). The velocity component perpendicular to the trend of the QFTB indicates that the gradient of velocity from south to north decreases from west to east (Figure 2). The velocity rate in southern Qaidam is approximately 12∼13 mm/yr, and the velocity rate north of the Qilian Shan is approximately 1–3 mm/yr. Meanwhile, the velocity components remain almost unchanged east of the Riyueshan fault at a rate of approximately 1–4 mm/yr. However, along the trend of the QFTB (Figure 2B), the values of the velocity component increase from approximately 2–3 mm/yr west of the Qaidam Basin to approximately 8–11 mm/yr in the region adjoining the Riyueshan fault, while the values of the velocity component have a rate of approximately 5∼8 mm/yr east of the Riyueshan fault. These results imply that the region adjoining the Riyueshan fault plays an important role in accommodating the deformation of the QFTB.
The GPS velocity along the trend of the QFTB in Profile TPro1-3 in Figure 3 shows evidence for the eastward extrusion of the QFTB, and the velocity in the eastern part of the QFTB is obviously larger than that in the western part of the QFTB. Not surprisingly, the velocity in the Gonghe Basin in Profile Tpro3 has a rate of 7–9 mm/yr, which may be related to the properties of the basin, in which the filled weak materials or sediments flow more easily under the same circumstances. As mentioned previously, the surface movement decreases gradually from south to northwest of the Riyueshan fault, which is shown clearly in GPS velocity Profile Npro1-4 in Figure 4, while the velocity has fewer or no obvious changes east of the Riyueshan fault on GPS velocity Profile Npro5-6 in Figure 4. Crustal shortening was detected in the Qilian Shan and Qaidam Basin between the East Kunlun fault and North Qilian front fault, and east–west extension was clearly identified through a comparison of GPS sites in the western and eastern QFTB, which is consistent with the results inferred from previous geophysical and geological data (Zhang et al., 2004; Gan et al., 2007; Zhao et al., 2015; Zheng G. et al., 2017; Wang and Shen, 2020).
In cluster analysis of GPS velocities, one boundary for k = 2 can be identified from the intersection between the East Kunlun and Elashan faults, following the Gonghe Basin and Riyueshan faults, and then follows the central part of the Haiyuan fault. The Qilian Nanshan thrust fault and Qaidam Basin thrust faults are identified when k > 2, suggesting that these faults could act as the boundary between the Qilian Shan and Qaidam Basin. East of the Qilian Shan and Qaidam Basin, the Haiyuan fault can be identified when k > 6, which is consistent with the identification of the western Qinling fault. However, remarkably, an underlying boundary located at approximately 104°E is identified when k > 3; it begins from the eastern end of the East Kunlun fault, follows the central part of the western Qinling fault and the Longxi Basin, and then follows the arc-shaped Haiyuan fault. This boundary can be related to part of the horizontal motion induced by subsidence in the Longxi Basin (Liang et al., 2013).
The results for the principal strain rate and rotational strain rate field are presented at the center of the cluster in Figures 5, 6. The strain rates computed from the updated GPS velocities for k = 2–10 indicate that most of the QFTB experienced high magnitudes of contraction strain directed perpendicular to the trend of the QFTB and relatively lower magnitudes of extension strain along the trend of the QFTB. Generally, the deformation pattern in the QFTB can be divided into two distinct groups—the shortening regime accompanied by anticlockwise rotation in the western part of the QFTB and the strike-slipping regime along with obvious clockwise rotation in the eastern part of the QFTB. Based on the aforementioned results, we regard that the boundary of strain transfer seems to begin from the East Kunlun fault adjoining the Gonghe Basin and follows the Qinghaihu Basin joining the Riyueshan fault, which then follows the central part of the Haiyuan fault. This transfer zone within the strain rate field is consistent with the previously mentioned results of velocity decomposition, which illustrates that the diamond basin associated with boundary faults plays a considerable role in accommodating the far-field effect of Indian–Eurasian convergence. In the western part of the QFTB, the contraction strain has a value of approximately 40–50 nstrain/yr, but the extension rate is relatively low, with a value of less than 20 nstrain/yr. On the eastern Qilian Shan margin near the Qinghaihu Basin and Riyueshan faults, the inferred rotational rate field displays an anticlockwise rotation, while in the interior of the Qilian Shan and the majority of the Qaidam Basin, it shows very little rotation, which we suggest is possibly related to the combined effects of mountain growth and fault adjustment subjected by convergence stress propagated from the Indian–Eurasian collision. In the eastern part of the QFTB, the rotational rate field shows an obvious clockwise rotation between the East Kunlun fault and Haiyuan fault. We believe that this relative rotation may also have been related to lateral extrusion of the material, which is compatible with geological and seismological evidence (Li et al., 2011; Eken et al., 2013; Chang et al., 2017). Both the extension strain rate and the contraction strain rate have similar magnitudes, with values of approximately 30–40 nstrain/yr, which are ascribed to the accommodation of the eastward strike of the East Kunlun fault and Haiyuan fault.
Understanding the strain distribution will not only allow us to test and improve models of the active tectonics of the QFTB but also provide much more related information to assess future regional seismic hazards. Our findings indicate that stronger contraction strain is mainly concentrated west of the Riyueshan fault, where the focal mechanisms are mainly dominated by thrust faulting (Pan et al., 2020). This is in accordance with geological findings that a series of imbricate thrust faults and active folds in the Qilian Shan accommodate the remote effects of Indian–Eurasian convergence (Liu et al., 2017; Bi et al., 2018; Yang et al., 2018; Hetzel et al., 2019). The map of the velocity gradient perpendicular to and parallel to the trend of the QFTB also exhibits consistent characteristics, which imply that the region adjoining the Riyueshan fault plays an important role in accommodating the deformation of the QFTB. Considering the northward and eastward velocity gradient and the high contraction strain rate, the deformation characteristics of the western part of the QFTB can be viewed as an analog of the pure shear–strain pattern, which suggests that the deformation of the QFTB can be interpreted by faulting, folding in the upper crust, and horizontal shortening (Lease et al., 2012; Zheng D. et al., 2017). Moreover, the deflection of GPS velocities across the East Kunlun fault also suggests the occurrence of strain partitioning due to the strength of the lithosphere (He et al., 2013), suggesting strong compression perpendicular to the trend of the QFTB.
In contrast, the extensional strains are localized along the East Kunlun fault and Haiyuan fault east of the Riyueshan fault, where the majority of shallow crustal earthquakes are strike–slip faulting regimes. These results are consistent with our velocity decomposition results. However, the Longxi Basin between the Haiyuan and Kunlun faults shows a weak northward velocity gradient and an obvious clockwise rotation, which supports the idea of the strain transfer of the Kunlun fault motion (Duvall and Clark, 2010). The underlying boundary identified by cluster analysis from the eastern end of the East Kunlun fault to the arc-shaped Haiyuan faults could serve as a channel for this strain transfer. Combining the results of cluster analysis and the velocity gradient, the deformation characteristics of the eastern QFTB can be deciphered by the simple shear–strain pattern, which suggests that the kinematics of the QFTB can be explained by a combination of block rotation and lateral transport of crustal materials (England and Molnar, 1990; Gan et al., 2021). As boundary faults, a number of studies have revealed that the strong activity of the Haiyuan and East Kunlun faults plays an important role in accommodating the eastward extrusion of northeastern Tibet relative to the surrounding block. The Ms 6.9 Menyuan earthquake on 8 Jan 2022 with a strike–slip faulting regime offers an example to illustrate the strain mode on these large faults. At the same time, InSAR observations indicate that the slip rates along the Haiyuan fault decrease from the center of the Lenglongling fault to the east of the Liupanshan fault (Daout et al., 2016), confirming our proposed simple shear model.
In light of the aforementioned results of the GPS profiles perpendicular to the trend of the orogenic belts, we observe statistically significant differential motion between the stations located to the west and east of the Riyueshan fault, reflecting a velocity offset. On the one hand, this could be invoked as strain partitioning and transfer along these crustal faults over the orogenic belt due to the heterogeneity and strength of the crustal material (i.e., the properties of the Gonghe Basin and the effect of fault geometry and segmentation) (He et al., 2013; Zhu et al., 2020). On the other hand, previous geological and geomorphological results indicate that the secondary faults in the QFTB are tectonically active (Craddock et al., 2011; Craddock et al., 2014). The Qinghai Nanshan fault, the southern boundary fault of the Qinghaihu Basin, and the Gonghe Nanshan fault, located on the southern margin of the Gognhe Basin, have experienced obvious crustal shortening and variable uplift based on the analysis of their landscape features (Su et al., 2022; Zhang et al., 2012). Combined with the results of GPS velocity decomposition, cluster analysis in GPS velocity, and the different regimes displayed by the ternary diagram of focal mechanisms (Frohlich, 1992) (Figure 7), we suggest that two diamond basins (Qinghaihu Basin and Gonghe Basin) associated with their boundary faults could play a considerable role in accommodating and absorbing crustal deformation within the QFTB. The stress and strain results also demonstrate that the axis of the compressive stress orientation changes from trending approximately NE-SW to the west of the QFTB to NEE-SWW to the east (Pan et al., 2020; Pan et al., 2021). The results of the velocity profile and strain estimation in this study can be better described by the diffuse model, which is different from the continuous model indicating that the convergence is accommodated by the widely distributed deformation (Flesch et al., 2001; England and Molnar, 2005) because the lengths of the boundary faults around the QFTB that accommodate the regional deformation are of the same order of magnitude as the dimensions of the deforming region. At the same time, the slip rates on several major faults estimated by geological and geodetic surveying are relatively slow (Hetzel et al., 2002; Li et al., 2019), such as the Altyn Tagh fault and the East Kunlun fault, and the deformation within the tectonic units of the QFTB derived from cluster analysis of GPS velocity is not negligible. These results contradict the block model assuming that the deformation is mainly localized near the major strike–slip faults (Tapponnier et al., 2001; Thatcher, 2007, 2009). In addition, the nonrigid bookshelf rotation model proposed by Zuza and Yin (2016) cannot explain the regional and local scale of deformation in the QFTB because the magnitude and style of the strain in the QFTB vary considerably among those boundary strike–slip faults.
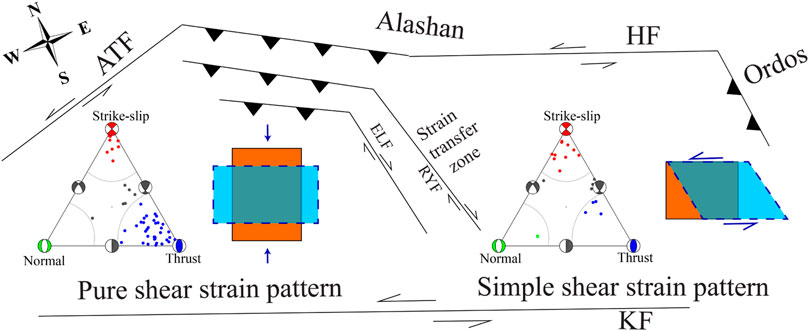
FIGURE 7. Schematic illustrations of the model for the deformation pattern of QFTB.
In summary, the active tectonics of the QFTB are obviously divided into two distinct groups: one group is a pure shear–strain pattern mainly accounting for strong crustal shortening in the western QFTB, and the other group is a simple shear–strain pattern describing obvious lateral extrusion in the eastern QFTB. Indeed, when considering these local variations and different inhomogeneities, the variations in topography and crustal thickness and other deep geophysical processes should be considered. In addition, more observational strain indicators and numerical models (regional to local scales) are required to investigate the potential mechanisms and dynamic processes behind this surface deformation and tectonics.
The purpose of this study was to use velocity decomposition and cluster analysis to place better constraints on the regional tectonics and kinematics of the QFTB, relying only on the updated GPS velocity field without any geological constraints or model limitations (i.e., fault locations, fault locking, and creeping). In our analysis, the main conclusions are as follows:
(1) The velocity decomposition and velocity gradient results indicate that the deformation in the west of the Riyueshan fault is characterized mainly by crustal shortening perpendicular to the trend of the QFTB, coupled with lateral extension along the trend of the QFTB, while the deformation in the east of Riyueshan is characterized mainly by lateral extrusion owing to the impact of two large eastward striking left-slip faults (East Kunlun fault and Haiyuan fault).
(2) The clustering analysis and strain estimation illustrate that the deformation of the QFTB can be divided into two groups: the shortening regime accompanied by anticlockwise rotation in the western QFTB and the strike-slipping regime along with obvious clockwise rotation in the eastern QFTB. The dividing line begins where the East Kunlun fault adjoins the Gonghe Basin, following which the Qinghaihu Basin joins the Riyueshan fault, and then follows the central part of the Haiyuan fault.
(3) The active tectonics of the QFTB are obviously divided into two distinct groups: one group is a pure shear–strain pattern mainly accounting for strong crustal shortening in the western part of the QFTB, and the other group is a simple shear–strain pattern describing obvious lateral extrusion in the eastern part of the QFTB. As the strain transfer zone, two diamond basins (Qinghaihu Basin and Gonghe Basin) associated with their boundary faults play a considerable role in accommodating and absorbing crustal deformation within the QFTB.
The raw data supporting the conclusion of this article will be made available by the authors, without undue reservation.
GZ carried out data analysis and wrote the manuscript. ZP conceptualized the problem, model implementation and validation, wrote the modeling section, and participated in discussions of all aspects of the manuscript.
The authors declare that the research was conducted in the absence of any commercial or financial relationships that could be construed as a potential conflict of interest.
All claims expressed in this article are solely those of the authors and do not necessarily represent those of their affiliated organizations, or those of the publisher, the editors, and the reviewers. Any product that may be evaluated in this article, or claim that may be made by its manufacturer, is not guaranteed or endorsed by the publisher.
The authors are very grateful to the editor and three anonymous reviewers for their constructive reviews that have significantly improved the manuscript. We are grateful to all the people who contributed to the Crustal Movement Observation Network of China (CMONOC). This work was supported by National Natural Science Foundation of China (42104056) and the Special Fund of the Institute of Earthquake Forecasting, China Earthquake Administration (2021IEF0105). All figures in this manuscript were prepared with The Generic Mapping Tools (GMT) (Wessel et al., 2013).
Bi, H., Zheng, W., Ge, W., Zhang, P., Zeng, J., and Yu, J. (2018). Constraining the Distribution of Vertical Slip on the South Heli Shan Fault (Northeastern Tibet) from High‐Resolution Topographic Data. J. Geophys. Res. Solid Earth 0 (0).
Burchfiel, B. C., Quidong, D., Molnar, P., Royden, L., Yipeng, W., Peizhen, Z., et al. (1989). Intracrustal Detachment within Zones of continental Deformation. Geol 17 (8), 748–752. doi:10.1130/0091-7613(1989)017<0448:idwzoc>2.3.co;2
Burchfiel, B. C., Zhang, P., Wang, Y., Zhang, W., Song, F., Deng, Q., et al. (1991). Geology of the Haiyuan Fault Zone, Ningxia-Hui Autonomous Region, China, and its Relation to the Evolution of the Northeastern Margin of the Tibetan Plateau. Tectonics 10 (6), 1091–1110. doi:10.1029/90tc02685
Chang, L., Ding, Z., Wang, C., and Flesch, L. M. (2017). Vertical Coherence of Deformation in Lithosphere in the NE Margin of the Tibetan Plateau Using GPS and Shear-Wave Splitting Data. Tectonophysics 699, 93–101. doi:10.1016/j.tecto.2017.01.025
Craddock, W. H., Kirby, E., Zhang, H., Clark, M. K., Champagnac, J.-D., and Yuan, D. (2014). Rates and Style of Cenozoic Deformation Around the Gonghe Basin, Northeastern Tibetan Plateau. Geosphere 10 (6), 1255–1282. doi:10.1130/ges01024.1
Craddock, W., Kirby, E., and Zhang, H. (2011). Late Miocene-Pliocene Range Growth in the interior of the Northeastern Tibetan Plateau. Lithosphere 3 (6), 420–438. doi:10.1130/l159.1
Daout, S., Jolivet, R., Lasserre, C., Doin, M.-P., Barbot, S., Tapponnier, P., et al. (2016). Along-strike Variations of the Partitioning of Convergence across the Haiyuan Fault System Detected by InSAR. Geophys. J. Int. 205 (1), 536–547. doi:10.1093/gji/ggw028
Dupont-Nivet, G., Horton, B. K., Butler, R. F., Wang, J., Zhou, J., and Waanders, G. L. (2004). Paleogene Clockwise Tectonic Rotation of the Xining-Lanzhou Region, Northeastern Tibetan Plateau. J. Geophys. Res. Solid Earth 109 (B4). doi:10.1029/2003jb002620
Duvall, A. R., and Clark, M. K. (2010). Dissipation of Fast Strike-Slip Faulting within and beyond Northeastern Tibet. Geology 38 (3), 223–226. doi:10.1130/g30711.1
Duvall, A. R., Clark, M. K., van der Pluijm, B. A., and Li, C. (2011). Direct Dating of Eocene Reverse Faulting in Northeastern Tibet Using Ar-Dating of Fault Clays and Low-Temperature Thermochronometry. Earth Planet. Sci. Lett. 304 (3–4), 520–526. doi:10.1016/j.epsl.2011.02.028
Eken, T., Tilmann, F., Mechie, J., Zhao, W., Kind, R., Su, H., et al. (2013). Seismic Anisotropy from SKS Splitting beneath Northeastern Tibet. Bull. Seismological Soc. America 103 (6), 3362–3371. doi:10.1785/0120130054
England, P., and Molnar, P. (1990). Right-lateral Shear and Rotation as the Explanation for Strike-Slip Faulting in Eastern Tibet. Nature 344 (6262), 140–142. doi:10.1038/344140a0
Frohlich, C. (1992). Triangle Diagrams: Ternary Graphs to Display Similarity and Diversity of Earthquake Focal Mechanisms. Phys. Earth Planet. Interiors 75 (1), 193–198. doi:10.1016/0031-9201(92)90130-n
Gan, C., Ming, A., Wenjun, Z., Haiyun, B., Jinrui, L., Yipeng, Z., et al. (2021). Nonrigid Bookshelf Kinematics of Northeastern Tibet: Constrains from Fault Slip Rates Around the Qinghai Lake and Chaka-Gonghe Basins. Lithosphere, 2021. (Special 2).
Gan, W., Zhang, P., Shen, Z.-K., Niu, Z., Wang, M., Wan, Y., et al. (2007). Present-day Crustal Motion within the Tibetan Plateau Inferred from GPS Measurements. J. Geophys. Res. 112 (B8). doi:10.1029/2005jb004120
Gaudemer, Y., Tapponnier, P., Meyer, B., Peltzer, G., Shunmin, G., Zhitai, C., et al. (1995). Partitioning of Crustal Slip between Linked, Active Faults in the Eastern Qilian Shan, and Evidence for a Major Seismic gap, the 'Tianzhu gap', on the Western Haiyuan Fault, Gansu (China). Geophys. J. Int. 120 (3), 599–645. doi:10.1111/j.1365-246x.1995.tb01842.x
Gehrels, G., Kapp, P., DeCelles, P., Pullen, A., Blakey, R., Weislogel, A., et al. (2011). Detrital Zircon Geochronology of Pre-tertiary Strata in the Tibetan-Himalayan Orogen. Tectonics 30 (5). doi:10.1029/2011tc002868
Granat, R., Donnellan, A., Heflin, M., Lyzenga, G., Glasscoe, M., Parker, J., et al. (2021). Clustering Analysis Methods for GNSS Observations: A Data-Driven Approach to Identifying California’s Major Faults. Earth Space Sci. (n). n/a, e2021EA001680.
Hackl, M., Malservisi, R., and Wdowinski, S. (2009). Strain Rate Patterns from Dense GPS Networks. Nat. Hazards Earth Syst. Sci. 9 (4), 1177–1187. doi:10.5194/nhess-9-1177-2009
He, J., Lu, S., and Wang, W. (2013). Three-dimensional Mechanical Modeling of the GPS Velocity Field Around the Northeastern Tibetan Plateau and Surrounding Regions. Tectonophysics 584, 257–266. doi:10.1016/j.tecto.2012.03.025
Herring, T. A., King, R. W., and McClusky, S. C. (2010). GLOBK Reference Manual. Global Kalman Filter VLBI and GPS Analysis Program, 10.4. Cambridge, MA: Massachussetts Institute Technology.
Hetzel, R., Hampel, A., Gebbeken, P., Xu, Q., and Gold, R. D. (2019). A Constant Slip Rate for the Western Qilian Shan Frontal Thrust during the Last 200 Ka Consistent with GPS-Derived and Geological Shortening Rates. Earth Planet. Sci. Lett. 509, 100–113. doi:10.1016/j.epsl.2018.12.032
Hetzel, R., Niedermann, S., Tao, M., Kubik, P. W., Ivy-Ochs, S., Gao, B., et al. (2002). Low Slip Rates and Long-Term Preservation of Geomorphic Features in Central Asia. Nature 417 (6887), 428–432. doi:10.1038/417428a
Hu, X., Zang, A., Heidbach, O., Cui, X., Xie, F., and Chen, J. (2017). Crustal Stress Pattern in China and its Adjacent Areas. J. Asian Earth Sci. 149, 20–28. doi:10.1016/j.jseaes.2017.07.005
Kirby, E., Harkins, N., Wang, E., Shi, X., Fan, C., and Burbank, D. (2007). Slip Rate Gradients along the Eastern Kunlun Fault. Tectonics 26 (2), n/a. doi:10.1029/2006tc002033
Lease, R. O. (2014). Cenozoic Mountain Building on the Northeastern Tibetan Plateau. Geological Society of America Special Papers 507. doi:10.1130/2014.2507(06)
Lease, R. O., Burbank, D. W., Zhang, H., Liu, J., and Yuan, D. (2012). Cenozoic Shortening Budget for the Northeastern Edge of the Tibetan Plateau: Is Lower Crustal Flow Necessary? Tectonics 31 (3), n/a–n. doi:10.1029/2011tc003066
Li, X., Li, C., Pierce, I. K. D., Zhang, P., Zheng, W., Dong, J., et al. (2019). New Slip Rates for the Tianjingshan Fault Using Optically Simulated Luminescence, GPS, and Paleoseismic Data, NE Tibet, China. Tectonophysics 755, 64–74. doi:10.1016/j.tecto.2019.02.007
Li, X., Santosh, M., Cheng, S., Xu, X., and Zhong, W. (2015). Crustal Structure and Composition beneath the Northeastern Tibetan Plateau from Receiver Function Analysis. Phys. Earth Planet. Interiors 249, 51–58. doi:10.1016/j.pepi.2015.10.001
Li, Y., Liu, M., Wang, Q., and Cui, D. (2018). Present-day Crustal Deformation and Strain Transfer in Northeastern Tibetan Plateau. Earth Planet. Sci. Lett. 487, 179–189. doi:10.1016/j.epsl.2018.01.024
Li, Y., Wu, Q., Zhang, F., Feng, Q., and Zhang, R. (2011). Seismic Anisotropy of the Northeastern Tibetan Plateau from Shear Wave Splitting Analysis. Earth Planet. Sci. Lett. 304 (1–2), 147–157. doi:10.1016/j.epsl.2011.01.026
Li, Z., Ni, S., and Roecker, S. (2014). Interstation Pg and Sg Differential Traveltime Tomography in the Northeastern Margin of the Tibetan Plateau: Implications for Spatial Extent of Crustal Flow and Segmentation of the Longmenshan Fault Zone. Phys. Earth Planet. Interiors 227, 30–40. doi:10.1016/j.pepi.2013.11.016
Liang, S., Gan, W., Shen, C., Xiao, G., Liu, J., Chen, W., et al. (2013). Three-dimensional Velocity Field of Present-Day Crustal Motion of the Tibetan Plateau Derived from GPS Measurements. J. Geophys. Res. Solid Earth. n/a. doi:10.1002/2013jb010503
Liu, X.-W., Yuan, D.-Y., and Su, Q. (2017). Late Pleistocene Slip Rate of the Northern Qilian Shan Frontal Thrust, Western Hexi Corridor, China. Terra Nova 29 (4), 238–244. doi:10.1111/ter.12270
Ma, H., Wu, Y., Feng, J. g., Xu, R., Wu, S., and Wang, Q. (2017). Research on Recent GPS Crustal Deformation Characteristics in the Northeastern Edge of Qinghai-Tibet Plateau. J. Phys. Conf. Ser. 910, 012028. doi:10.1088/1742-6596/910/1/012028
Meyer, B., Tapponnier, P., Bourjot, L., Métivier, F., Gaudemer, Y., Peltzer, G., et al. (1998). Crustal Thickening in Gansu-Qinghai, Lithospheric Mantle Subduction, and Oblique, Strike-Slip Controlled Growth of the Tibet Plateau. Geophys. J. Int. 135 (1), 1–47. doi:10.1046/j.1365-246x.1998.00567.x
Meyer, B., Tapponnier, P., Gaudemer, Y., Peltzer, G., Shunmin, G., and Zhitai, C. (1996). Rate of Left-Lateral Movement along the Easternmost Segment of the Altyn Tagh Fault, East of 96°E (China). Geophys. J. Int. 124 (1), 29–44. doi:10.1111/j.1365-246x.1996.tb06350.x
Pan, Z., He, J., and Shao, Z. (2020). Spatial Variation in the Present-Day Stress Field and Tectonic Regime of Northeast Tibet from Moment Tensor Solutions of Local Earthquake Data. Geophys. J. Int. 221 (1), 478–491. doi:10.1093/gji/ggaa013
Pan, Z., Zhang, Z., Shao, Z., and Zhao, G. (2021). Block Motions and Strain Partition on Active Faults in Northeast Tibet and Their Geodynamic Implications. Terra Nova 33, 356–363. doi:10.1111/ter.12520
Savage, J. C., Gan, W., and Svarc, J. L. (2001). Strain Accumulation and Rotation in the Eastern California Shear Zone. J. Geophys. Res. 106 (B10), 21995–22007. doi:10.1029/2000jb000127
Savage, J. C., and Simpson, R. W. (2013). Clustering of Velocities in a GPS Network Spanning the Sierra Nevada Block, the Northern Walker Lane Belt, and the Central Nevada Seismic Belt, California-Nevada. J. Geophys. Res. Solid Earth 118 (9), 4937–4947. doi:10.1002/jgrb.50340
Shen, X., Yuan, X., and Liu, M. (2015). Is the Asian Lithosphere Underthrusting beneath Northeastern Tibetan Plateau? Insights from Seismic Receiver Functions. Earth Planet. Sci. Lett. 428, 172–180. doi:10.1016/j.epsl.2015.07.041
Simpson, R. W., Thatcher, W., and Savage, J. C. (2012). Using Cluster Analysis to Organize and Explore Regional GPS Velocities. Geophys. Res. Lett. 39 (18), L18307. doi:10.1029/2012gl052755
Song, S., Niu, Y., Su, L., and Xia, X. (2013). Tectonics of the North Qilian Orogen, NW China. Gondwana Res. 23 (4), 1378–1401. doi:10.1016/j.gr.2012.02.004
Su, Q., Wang, X., Yuan, D., Zhang, H., Lu, H., and Xie, H. (2022). Secondary Faulting Plays a Key Role in Regulating the Cenozoic Crustal Deformation in the Northeastern Qinghai-Tibet Plateau. Terra Nova, 1–13. doi:10.1111/ter.12583
Su, X., Yao, L., Wu, W., Meng, G., Su, L., Xiong, R., et al. (2018). Crustal Deformation on the Northeastern Margin of the Tibetan Plateau from Continuous GPS Observations. Remote Sensing 11 (1). doi:10.3390/rs11010034
Tapponnier, P., Meyer, B., Avouac, J. P., Peltzer, G., Gaudemer, Y., Guo, S., et al. (1990). Active Thrusting and Folding in the Qilian Shan, and Decoupling between Upper Crust and Mantle in Northeastern Tibet. Earth Planet. Sci. Lett. 97 (3), 382–403. doi:10.1016/0012-821x(90)90053-z
Thatcher, W., Savage, J. C., and Simpson, R. W. (2016). The Eastern California Shear Zone as the Northward Extension of the Southern San Andreas Fault. J. Geophys. Res. Solid Earth, 2015JB012678. doi:10.1002/2015jb012678
Wang, H., Gao, R., Zeng, L., Kuang, Z., Xue, A., Li, W., et al. (2014). Crustal Structure and Moho Geometry of the Northeastern Tibetan Plateau as Revealed by SinoProbe-02 Deep Seismic-Reflection Profiling. Tectonophysics 636, 32–39. doi:10.1016/j.tecto.2014.08.010
Wang, M., and Shen, Z.-K. (2020). Present-Day Crustal Deformation of Continental China Derived from GPS and its Tectonic Implications. J. Geophys. Res. Solid Earth (n/a), e2019JB018774. n/a.
Wang, Q., Niu, F., Gao, Y., and Chen, Y. (2016). Crustal Structure and Deformation beneath the NE Margin of the Tibetan Plateau Constrained by Teleseismic Receiver Function Data. Geophys. J. Int. 204 (1), 167–179. doi:10.1093/gji/ggv420
Wessel, P., and Bercovici, D. (1998). Interpolation with Splines in Tension: A Green's Function Approach. Math. Geology. 30 (1), 77–93. doi:10.1023/a:1021713421882
Wessel, P., Smith, W. H. F., Scharroo, R., Luis, J., and Wobbe, F. (2013). Generic Mapping Tools: Improved Version Released. Eos Trans. AGU 94 (45), 409–410. doi:10.1002/2013eo450001
Yang, H., Yang, X., Zhang, H., Huang, X., Huang, W., and Zhang, N. (2018). Active Fold Deformation and Crustal Shortening Rates of the Qilian Shan Foreland Thrust Belt, NE Tibet, since the Late Pleistocene. Tectonophysics 742-743, 84–100. doi:10.1016/j.tecto.2018.05.019
Yin, A., and Harrison, T. M. (2000). Geologic Evolution of the Himalayan-Tibetan Orogen. Annu. Rev. Earth Planet. Sci. 28 (1), 211–280. doi:10.1146/annurev.earth.28.1.211
Yu, Y., and Chen, Y. J. (2016). Seismic Anisotropy beneath the Southern Ordos Block and the Qinling-Dabie Orogen, China: Eastward Tibetan Asthenospheric Flow Around the Southern Ordos. Earth Planet. Sci. Lett. 455, 1–6. doi:10.1016/j.epsl.2016.08.026
Yuan, D. Y., Ge, W. P., Chen, Z. W., Li, C. Y., Wang, Z. C., Zhang, H. P., et al. (2013). The Growth of Northeastern Tibet and its Relevance to Large‐scale continental Geodynamics: A Review of Recent Studies. Tectonics 32 (5), 1358–1370. doi:10.1002/tect.20081
Zhang, H.-P., Craddock, W. H., Lease, R. O., Wang, W.-t., Yuan, D.-Y., Zhang, P.-Z., et al. (2012). Magnetostratigraphy of the Neogene Chaka basin and its Implications for Mountain Building Processes in the north-eastern Tibetan Plateau. Basin Res. 24 (1), 31–50. doi:10.1111/j.1365-2117.2011.00512.x
Zhang, P.-Z. (2013). A Review on Active Tectonics and Deep Crustal Processes of the Western Sichuan Region, Eastern Margin of the Tibetan Plateau. Tectonophysics 584, 7–22. doi:10.1016/j.tecto.2012.02.021
Zhang, P.-Z., Shen, Z., Wang, M., Gan, W., Bürgmann, R., Molnar, P., et al. (2004). Continuous Deformation of the Tibetan Plateau from Global Positioning System Data. Geol 32 (9), 809. doi:10.1130/g20554.1
Zhang, Q., Sandvol, E., Ni, J., Yang, Y., and Chen, Y. J. (2011). Rayleigh Wave Tomography of the Northeastern Margin of the Tibetan Plateau. Earth Planet. Sci. Lett. 304 (1–2), 103–112. doi:10.1016/j.epsl.2011.01.021
Zhang, Z., Bai, Z., Klemperer, S. L., Tian, X., Xu, T., Chen, Y., et al. (2013). Crustal Structure across Northeastern Tibet from Wide-Angle Seismic Profiling: Constraints on the Caledonian Qilian Orogeny and its Reactivation. Tectonophysics 606, 140–159. doi:10.1016/j.tecto.2013.02.040
Zhao, B., Huang, Y., Zhang, C., Wang, W., Tan, K., and Du, R. (2015). Crustal Deformation on the Chinese mainland during 1998-2014 Based on GPS Data. Geodesy and Geodynamics 6 (1), 7–15. doi:10.1016/j.geog.2014.12.006
Zhao, P., Chen, J., Li, Y., Liu, Q., Chen, Y., Guo, B., et al. (2021). Growth of the Northeastern Tibetan Plateau Driven by Crustal Channel Flow: Evidence from High-Resolution Ambient Noise Imaging. Geophys. Res. Lett. 48 (13), e2021GL093387. doi:10.1029/2021gl093387
Zheng, D., Wang, W., Wan, J., Yuan, D., Liu, C., Zheng, W., et al. (2017a). Progressive Northward Growth of the Northern Qilian Shan-Hexi Corridor (Northeastern Tibet) during the Cenozoic. Lithosphere 9 (3), 408–416. doi:10.1130/l587.1
Zheng, G., Wang, H., Wright, T. J., Lou, Y., Zhang, R., Zhang, W., et al. (2017b). Crustal Deformation in the India-Eurasia Collision Zone from 25 Years of GPS Measurements. J. Geophys. Res. Solid Earth. doi:10.1002/2017jb014465
Zhu, X., He, J., Xiao, J., and Wang, X. (2020). Uniform Slip Rates of the Altyn Tagh and the Kunlun Faults Likely Reflect Lateral Variation of Frictional Strength of the Faults. Terra Nova 32, 381–389. doi:10.1111/ter.12467
Keywords: Qilian fold-and-thrust belt, GPS velocity decomposition, cluster analysis, pure shear–strain pattern, simple shear–strain pattern
Citation: Zhao G and Pan Z (2022) Strain Distribution Along the Qilian Fold-and-Thrust Belt Determined From GPS Velocity Decomposition and Cluster Analysis: Implications for Regional Tectonics and Deformation Kinematics. Front. Earth Sci. 10:846949. doi: 10.3389/feart.2022.846949
Received: 31 December 2021; Accepted: 10 March 2022;
Published: 05 April 2022.
Edited by:
Xuhua Shi, Zhejiang University, ChinaReviewed by:
Yiran Wang, Nanyang Technological University, SingaporeCopyright © 2022 Zhao and Pan. This is an open-access article distributed under the terms of the Creative Commons Attribution License (CC BY). The use, distribution or reproduction in other forums is permitted, provided the original author(s) and the copyright owner(s) are credited and that the original publication in this journal is cited, in accordance with accepted academic practice. No use, distribution or reproduction is permitted which does not comply with these terms.
*Correspondence: Zhengyang Pan, cGFuemhlbmd5YW5nQGllZi5hYy5jbg==
Disclaimer: All claims expressed in this article are solely those of the authors and do not necessarily represent those of their affiliated organizations, or those of the publisher, the editors and the reviewers. Any product that may be evaluated in this article or claim that may be made by its manufacturer is not guaranteed or endorsed by the publisher.
Research integrity at Frontiers
Learn more about the work of our research integrity team to safeguard the quality of each article we publish.