 Akshay Singhal
 Ashwin Raman
 Sanjeev K. Jha
- Indian Institute of Science Education and Research Bhopal, Bhopal, India
Due to the increase in extreme rainfall events in India, there is an urgent need for prior communication of the expected impacts and appropriate responses in order to mitigate the losses of lives and damage to property. Extreme rainfall events cause numerous casualties, damage to property and infrastructure and vast displacement of people. Hence, the development of an approach where the rainfall forecasts are well analyzed, associated risks are identified, and the probable impacts are clearly communicated to relevant stakeholders is required. In this study, we aim to develop a framework for generating the impact-based forecasts (IBF) and associated warning matrices over the selected districts of eastern Uttar Pradesh, India, by integrating the rainfall forecasts and the socio-economic characteristics such as population, economy and agriculture. The selected districts lack proper infrastructure, have poor socio-economic conditions and have been historically prone to frequent extreme rainfall. The basic idea is to estimate the impacts that could occur over various sectors of population, economy and agriculture and suggest appropriate actions in order to mitigate the severity of the impacts. To this end, we identify the vulnerable districts based on the frequency of the number of extreme rainfall forecasts (ERFs) in the past four years (2017–2020) and the nature of socio-economic conditions. We selected three vulnerable districts based on the expected impacts, i.e., Shravasti (high category), Gorakhpur (medium category) and Jaunpur (low category) and subsequently, the corresponding IBFs are generated. Furthermore, a warning matrix is created for each district which provides updated information regarding the potential risk for a district a few days in advance. This study is significant since it identifies the different levels of potential impact over multiple sectors of society, presents a framework to generate impact-based forecasts and warnings, informs about the expected impacts, and suggests mitigation actions to reduce potential damage and losses.
1 Introduction
India has witnessed an increase in extreme rainfall events during the summer monsoon season, which is expected to intensify in the future (Goswami et al., 2006a; Mukherjee et al., 2018; Singhal and Jha, 2021a; Singhal et al., 2022). Extreme rainfall cause damage to property and infrastructure, numerous casualties and vast displacement of people. The increase in the extreme rainfall also means an increase in the total seasonal rainfall during the monsoon season, thus leading to frequent floods (Pattanaik and Rajeevan, 2010). Floods incur huge losses of life and economy over different parts of the country. According to an estimate, floods caused due to extreme rainfall amounts to economic losses of around 3 billion USD per year in India, which is around 10% of the global economic losses (Roxy et al., 2017). In addition, they constitute the maximum share of mortality (46.1%) among all the extreme weather events in India (Ray et al., 2021). This happens despite the fact that various Quantitative precipitation Forecasts (QPFs) are available in many regions of the world, and the majority of extreme rainfall events are forecasted. The QPFs, obtained from the Numerical Weather Prediction (NWP) models, help in predicting the possible rainfall amount over a certain region a few days in advance (Froude, 2010; Verdin et al., 2016; Jha et al., 2018). In the recent decades, QPFs have shown improvement both in the quality and quantity of information (availability of lead-times) mainly due to advancement in technology, availability of real-time data and increased capability of computer simulations.
One of the main reasons for the losses in life and property despite the availability of QPFs is that the QPFs rarely include warnings about the potential impacts they may have over a certain region or over a certain population. Even if the warnings are included, they lack proper communication to the general public (Basher, 2006; Uccellini and Ten Hoeve, 2019). Several methods have been utilized for communicating the consequences of high impact weather events in the past. The methods include interviews (Bostrom et al., 2018; Tozier de la Poterie et al., 2018), surveys (Morss et al., 2018; Potter et al., 2018), experience-based decisions (Casteel, 2018; Losee and Joslyn, 2018), social media analysis (Rossi et al., 2018) etc. However, the communications are mostly based on theoretical and subjective responses of the exposed population themselves. Recently, it has been emphasized that along with the QPFs, the nature of impact which may be caused due to extreme rainfall such as area and number of people exposed, regions expected to flood, damage to trees or infrastructure must also be communicated (Pittore et al., 2017). In the same line, at the Third UN World Conference on Disaster Risk Reduction in 2015, the Sendai Framework for Disaster Risk Reduction recommended include multi-hazard early warning systems and rapid disaster risk information by 2030 (WMO, 2015). Various national and regional rainfall forecasting agencies have started issuing risk-based warnings, which include both the probability of occurrence and the degree of potential impacts arising from the extreme rainfall (Weyrich et al., 2018; Silvestro et al., 2019). Such an approach in which the forecast information is provided on the basis of the potential impact of the event is termed as Impact-Based Forecast (IBF).
IBF is an integrated framework that includes hazard, exposure and vulnerability data for identifying risks and enabling decision-making. The overall objective of IBFs is to add scientific information to severe weather warnings to promote timely response and reduce losses of lives. A more effective and user-friendly warning comprises the information regarding “What the weather will do” instead of “What the weather will be” (Kaltenberger et al., 2020). They are expected to include the specific social, economic and environmental impacts of hazard in the warning to enable people to adapt and mitigate the possible adverse consequences (WMO, 2015; Kox et al., 2018). Previous studies suggest that IBF improves the understanding of forecasts for the general public as it bridges the gap between the raw QPFs, its related warnings and potential impacts (Potter et al., 2018; Taylor et al., 2019). Moreover, it facilitates people to take timely defensive measures against the impending extreme rainfall (Casteel, 2016). However, providing IBFs can be challenging at many levels. For instance, a significant number of resources in terms of time, money and workforce is required to combine the produced weather information with the exposure and vulnerability prevalent at the ground level. Regular updates of the socio-economic status of the region must be kept so that the IBFs are consistently accurate. Socio-economic developments such as urbanization and population growth are expected to influence the exposure and vulnerability of many regions across the world, especially in hazard-prone regions (Winsemius et al., 2015; Jongman, 2018). Consequently, large datasets of socio-economic progress are required to be processed under changing scenarios for multiple sectors. Nevertheless, greater precision of QPFs, greater availability of data and lead-times (LT) provide new opportunities for enhancing IBFs (Silvestro et al., 2019).
The topic of IBF is still in its early stage and has started to gain momentum in recent years. Worldwide, few studies have explored the utility of IBFs in the case of various extreme weather hazards. For instance, Silvestro et al. (2019) used a multi-model ensemble approach to design an impact-based flash-flood probabilistic forecasting system in northwestern Italy. Sai et al. (2018) explored the use of color-codes in developing impact-based forecasts of floods among a flood-exposed community in a district of Bangladesh. Mendis (2021) developed a warning matrix as a tool of IBF to relate the risk of heavy rain hazards in Sri Lanka. Otieno et al. (2014) used a predictive model and observed satellite rainfall as a covariate to estimate flood impacts on exposed communities in a river basin of Kenya. In India, to the best of our knowledge, the potential use of QPFs and socio-economic data for IBFs is lacking. With the rise in events of extreme rainfall, there is a need to develop an approach in India where the QPFs are analyzed, associated risks are identified, and the probable impacts are estimated. Once the risks and potential impacts are identified, proper communication to local stakeholders is crucial so that the impending impacts are mitigated at the ground level (Reddy et al., 2021).
In this study, we aim to develop impact-based forecasting approach by integrating the available QPF and the local socio-economic data over the districts of the eastern part of Uttar Pradesh, India. The basic idea is to estimate the possible impacts that could be caused due to potential extreme rainfall over various social and economic sectors such as local population, marginalized groups, agriculture and economy and subsequently suggest mitigation actions. The deterministic rainfall forecast data from the National Centre for Medium-Range Weather Forecasting (NCMRWF) available for the period of 2017–2020 is used as the rainfall forecasts in the study. The socio-economic data is collected from various state and national agencies. The number of extreme rainfall events calculated for each district is correlated with the corresponding spatial maps created using the socio-economic data. The IBFs are generated on the combined basis of the frequency of the extreme rainfall and the nature of the socio-economic condition of the district. Furthermore, warning matrices are formed for the vulnerable districts, which provide information regarding the overall risk probability of a district in the case of an extreme rainfall event. This study is significant since it identifies the different levels of potential impact over multiple sectors of society and issues impact-based warnings to reduce probable damage and losses.
The rest of the paper is organized as follows. Section 2 describes the study area and dataset. The methodology is explained in Section 3. Results are presented in Section 4. Discussions are dealt with in Section 5, followed by conclusions in Section 6.
2 Study Area and Dataset
2.1 Study Area
The study area includes thirty-two administrative districts of the eastern part of Uttar Pradesh located in the Ganga River Basin of India. Figure 1A shows the location of the state of Uttar Pradesh in India along with the selected districts, and Figure 1B shows the expanded view of the selected districts. The districts are located between 23°53′N to 28°24′N latitude and 80°30′E to 84°38′E longitude. The area is one of the most densely populated regions of India, with agriculture being the predominant source of livelihood for the majority of the population. The climate of the region is generally hot and humid, with much of the rainfall occurring during the summer monsoon season (June to September). The region has poor infrastructure, poor drainage facilities etc., due to which extreme rainfall events often lead to flash floods and waterlogging. Moreover, the presence of the Ganga River is also one of the reasons for frequent inundation of the region when heavy rainfall occurs in the upper parts of Uttarakhand. The main reason for selecting the region as our study area is that it faces a high rate of mortality of humans and livestock and annual displacement of a vast population each year due to extreme rainfall. Moreover, the socio-economic conditions of the population are generally poor with a low literacy rate. Hence, the availability of reliable forecasts along with their proper interpretation and subsequent guidelines can mitigate the losses of lives and annual displacement of a vast population.
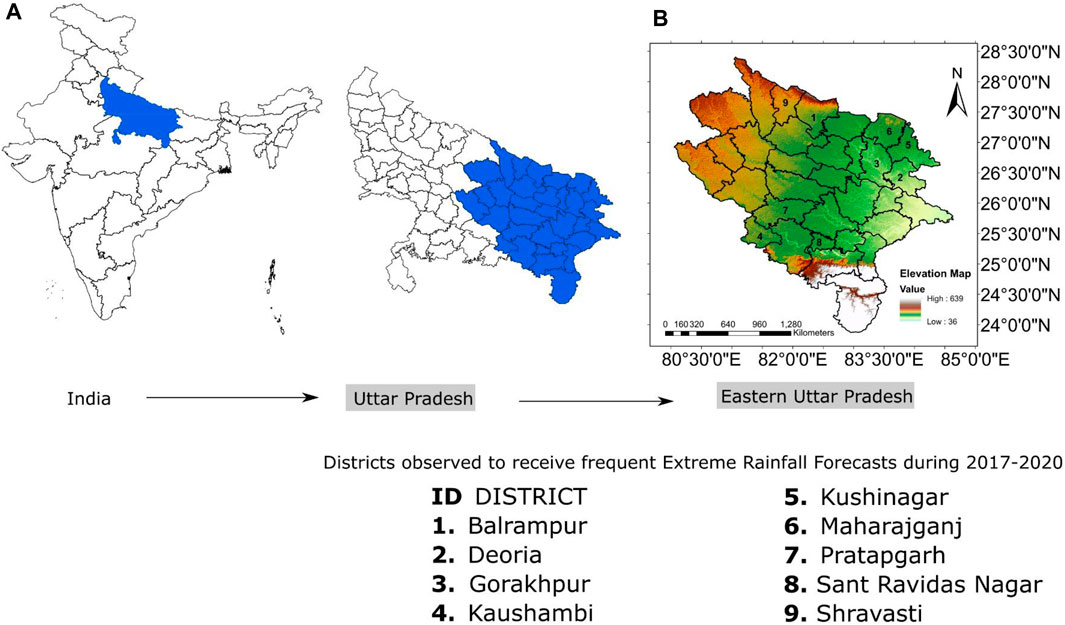
FIGURE 1. The study area map showing (A) the state of Uttar Pradesh in India; (B) the expanded view of the districts in Uttar Pradesh (East) selected as the study area along with the names of key districts for this study which are prone to frequent extreme rainfall forecasts.
2.2 Datasets Used
This study uses two kinds of data: 1) quantitative precipitation forecast data and 2) socio-economic data. The forecast data is obtained from the NWP model of NCMRWF, which is the premier weather forecast center of India. It provides rainfall forecasts in real-time by performing medium-range global assimilation. The data is downloaded from the TIGGE data portal after interpolation (at the TIGGE portal itself) at 0.5° × 0.5° spatial grid resolution for the years 2017–2020. The temporal resolution of the data is 24 h, along with a lead time of 5 days. Moreover, various socio-economic data such as population density (total population, female population, children population), net sown area, gross domestic product (GDP), airports, percentage of population below the poverty line and number of homeless people are collected for each district. These datasets are collected from various secondary sources, such as the census handbooks of each district and primary census data. The handbooks are available at the website of the census of India (www.censusindia.gov.in).
3 Methodology
In this study, we use the integrated approach of using the QPFs (along with lead-times) and the relevant socio-economic data for generating the IBFs. The overall approach of generating the IBFs can be divided into three steps, as shown in Figure 2.
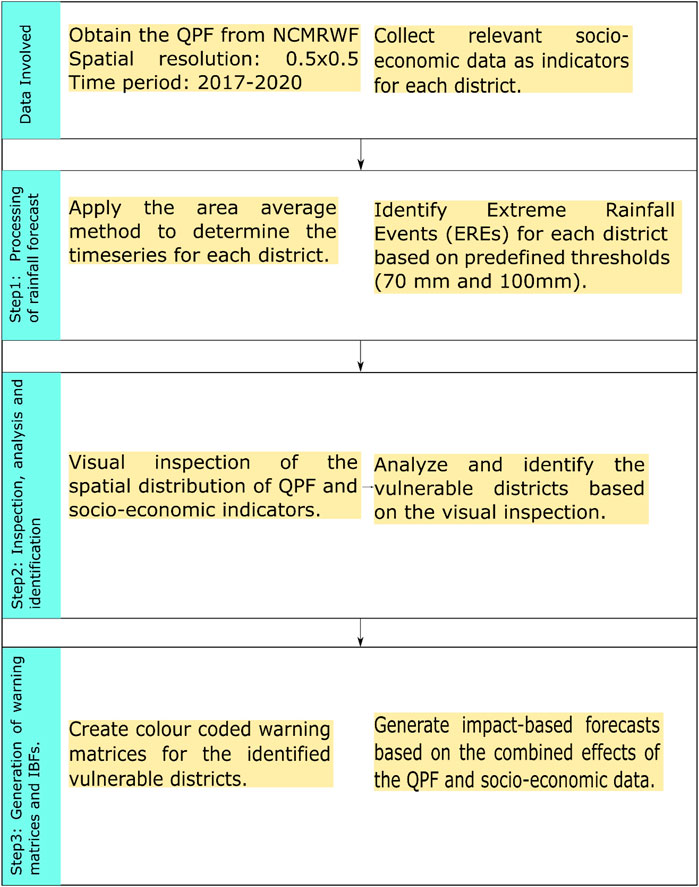
FIGURE 2. The methodological framework applied to generate IBFs and warning matrices in the study.
3.1 Processing of Rainfall Forecast
The available rainfall forecast is gridded in nature which must be calculated at the district level to make it suitable for this study. To this end, we use the method of area-weighted average to estimate the rainfall forecast in each of the districts (Jha et al., 2018; Singhal and Jha, 2021b; Singh et al., 2021). The area-weighted average method involves three steps:
(a) Estimating the area (Ai) based on the portion of the rainfall forecast grid that overlaps with the sub-district,
(b) Multiplying the area (Ai) with the rainfall forecast value (Ri) on that grid,
(c) Divide the result of area*precipitation (Σ(Ai*Ri)) by the value of total area (A = Σ(Ai)).
The above steps are demonstrated in Supplementary Figure S1A which shows the estimated area based on the portion of the rainfall forecast grid for all the districts in the study area. An expanded view of one of the districts is presented in Supplementary Figure S1B, in which many rainfall grids overlap. We select five grids to demonstrate the working of area-weighted average. Let us suppose that the area of overlap is estimated as A1, A2, … A5 and the rainfall forecast for each of those areas as R1, R2, R3, … R5. In that case, the area-weighted rainfall for the district would be calculated using Eq. 1.
Next, the obtained rainfall time-series is used to identify extreme rainfall forecasts (ERFs) for each district based on two predefined thresholds of 70 and 100 mm (Goswami et al., 2006b; Salio et al., 2015; Panda et al., 2016). The idea is to select precipitation thresholds that can cause a significant impact in the region (or any region). Generally, a rainfall of more than 70 and 100 mm per day usually will cause serious impacts in most districts of India. We select two thresholds different in magnitude to take into account the possible diversity in results. Moreover, ERFs at the three lead-times (LT_1, LT_3 and LT_5) are obtained at each of the two percentile thresholds.
Obtaining results using three lead times will allow to understand how the likelihood of probable impacts and their severity may change with an increase (or decrease) in the lead times.
3.2 Analysis and Identification of Vulnerable Districts
In this step, we plot spatial maps of the ERFs at various lead-times showing their spatial distribution in the study area (shown in Supplementary Figure S2). We also plot the spatial maps corresponding to the various socio-economic indicators (shown in Supplementary Figure S3). The idea here is to visually analyze the extent of possible impacts that could occur in a district based on the integrated effects of the magnitude of ERF and the prevalent socio-economic conditions at the ground. The combined effect determines the likelihood and severity of the impact for each district. For instance, if a district with high population density is forecasted to face extreme rainfall, the likelihood and the severity of the impact (mortality, injuries or displacement) could be much higher than that of a district with low population density. Similarly, a district having an airport facility is likely to be impacted in case of extreme rainfall more severely than a district with no airport. Subsequently, the vulnerable districts are identified to generate the warning matrices and the impact-based forecasts.
3.3 Generation of Warning Matrices and Impact-Based Forecasts
After the vulnerable districts are identified, a color-coded warning matrix is issued as an advisory for the potential impacts much before the extreme rainfall has taken place, as shown in Supplementary Figure S4. The advantage of such warning matrices is that they can be updated depending upon the change in risk and likelihood of impact. For instance, the 5-day lead time (LT_5; 5 days before an extreme rainfall) could advise for a “low” likelihood but “high” severity of the impact of extreme rainfall (Supplementary Figure S4A). In this case, the target group must be informed about the impending extreme rainfall. Subsequently, both the likelihood and impact may change for the 3-day lead time (LT_3) to “medium” (Supplementary Figure S4B). Then, the target group must be given appropriate warnings regarding the potential impacts. Furthermore, for the 1-day lead time (LT_1), the likelihood and impact may change to “high,” meaning there is a greater possibility of the occurrence of extreme rainfall leading to severe impacts (Supplementary Figure S4C). Finally, an integrated warning matrix must be issued, which takes into account the warnings of all the individual matrices as shown in Supplementary Figure S4D. At this stage, meaningful dos and don’ts must be conveyed to the local stakeholders. Finally, impact-based forecasts must be issued in the form of a warning message for each sector which informs about the extent of the impact, its severity and possible mitigation measures.
4 Results
In this section, we use the QPF from NCMRWF to determine the districts that have received the maximum ERFs (with various lead-times) during the years 2017–2020 (Section 4.1). Then, we evaluate the potential vulnerability of the districts using the corresponding socio-economic data of the districts (Section 4.2). Further, we select three days when the magnitude of forecasted rainfall in the district was highest. For each of the three days, one district is selected (belonging to different categories of impact) to generate the warning matrix and IBFs (Section 4.3). For brevity, we present the results using three lead times (lead times 1, 3 and 5).
4.1 Analysis of the Extreme Rainfall Forecasts
In this section, we analyze the spatial distribution of ERFs to identify the districts which have been forecasted to face the maximum number of extreme rainfall during 2017–2020 (see Supplementary Figure S2). Supplementary Figures S2A–F depicts the spatial distribution of ERFs greater than 100 and 70 mm for the LT_1, LT_3 and LT_5, respectively. Results from both the forecast thresholds show that the distribution of ERFs is quite heterogeneous over the region; however, the frequency in a few districts is higher. Using the results, we identify the districts which show a higher number of ERFs. To this end, we put a threshold on the number of ERFs issued; for instance, at least five ERFs must be issued above the threshold of 100 mm, and ten ERFs above the 70 mm threshold. We observe that the district Shravasti has received the maximum ERFs in the past four years, followed by Kushinagar and Maharajganj. A total of nine districts are identified whose names are listed in Table 1.
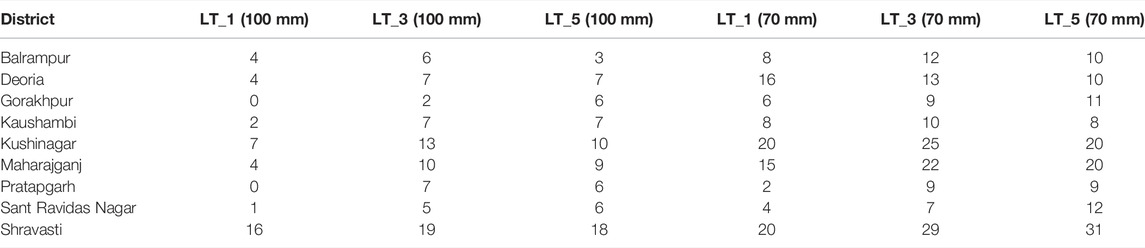
TABLE 1. Districts observed to receive frequent ERFs during 2017–2020.
4.2 Identification and Analysis of Vulnerable Districts
In this section, we perform a combined analysis of the spatial distribution of ERFs (during 2017–2020) and the socio-economic conditions to identify the broader reasons and potential impacts over the districts in case of extreme rainfall.
4.2.1 Based on Impacts on Population
Figure 3 shows the bivariate choropleth map representing the total population density (Figures 3A1–A3), female population density (Figures 3B1–B3), and children population density (Figures 3C1–C3) with the number of ERFs at the 100 mm threshold for the three lead times. The aim here is to understand the combined influence of the socio-economic characteristics and the occurrence of the ERFs on the potential impacts of respective districts. Higher population density along with a larger number of ERFs in a district would mean that a larger percentage of the population is vulnerable to adverse impacts and vice-versa. Results from LT_1 (Figure 3A1) shows that there exists a belt of districts from Kushinagar to Prayagraj which may face adverse impacts of extreme rainfall due to the combined effect of large population density and a large number of ERFs. Moreover, Figures 3B1–B3 shows the spatial distribution of the adverse impacts faced by the female population among the districts. Results show that the spatial distribution is quite similar to that observed for the impacts on the total population. Further, in the case of impacts over children population (see Figure 3C1), the number of districts showing a high probability of impacts become less in number and are relatively scattered in distribution. Further, the results have generally been similar across all three lead times, with minor variations among the districts. The results obtained using 70 mm rainfall as the threshold is presented in Supplementary Figure S5. We observe that the patterns are similar to those obtained using 100 mm as the threshold. Highly vulnerable districts are located in clusters, while those which are less vulnerable are relatively scattered.
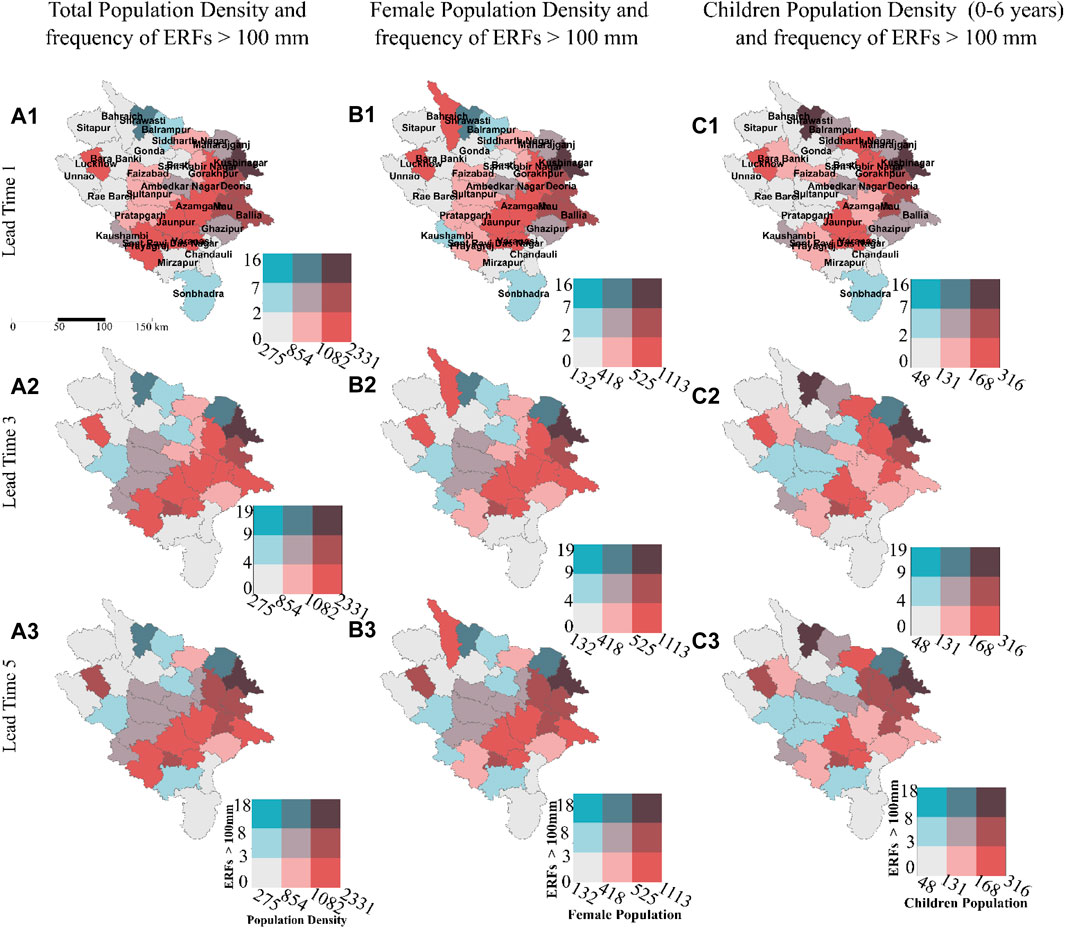
FIGURE 3. A bivariate choropleth map showing the combined effect of the number of ERFs with the total population density (Panels (A1–A3)), female population density (Panels (B1–B3)) and children population density (Panels (C1–C3)) at three lead times and 100 mm threshold.
4.2.2 Based on Impacts on Marginalized Groups
Figure 4 shows the bivariate choropleth map representing the combined influence of the percentage of population below the poverty line (Figures 4A1–A3) and the percentage of the homeless population (Figures 4B1–B3) of each district along with the frequency of ERFs at the 100 mm rainfall threshold. Figure 4A1 represents the spatial distribution of the districts where the poor population may face adverse consequences due to the extreme rainfall events for LT_1. Results from LT_1 show that a large proportion of the poor population in the northern side of the districts (district Sitapur to Maharajganj) may face adverse impacts. Moreover, we notice that a few districts in the southern part (Sonbhadra and Kaushambi) may also face negative consequences. Further, in the case of impacts over the homeless population (see Figures 4B1–B3), we observe a significantly larger number of vulnerable districts. Results show that the homeless population living towards the western side of the region (district Sitapur to Prayagraj) may face larger impacts in case of extreme rainfall events. However, with the increase in lead times, we find that the probability of impact in a few districts is low. Further, the results obtained using 70 mm rainfall as the threshold is presented in Supplementary Figure S6.
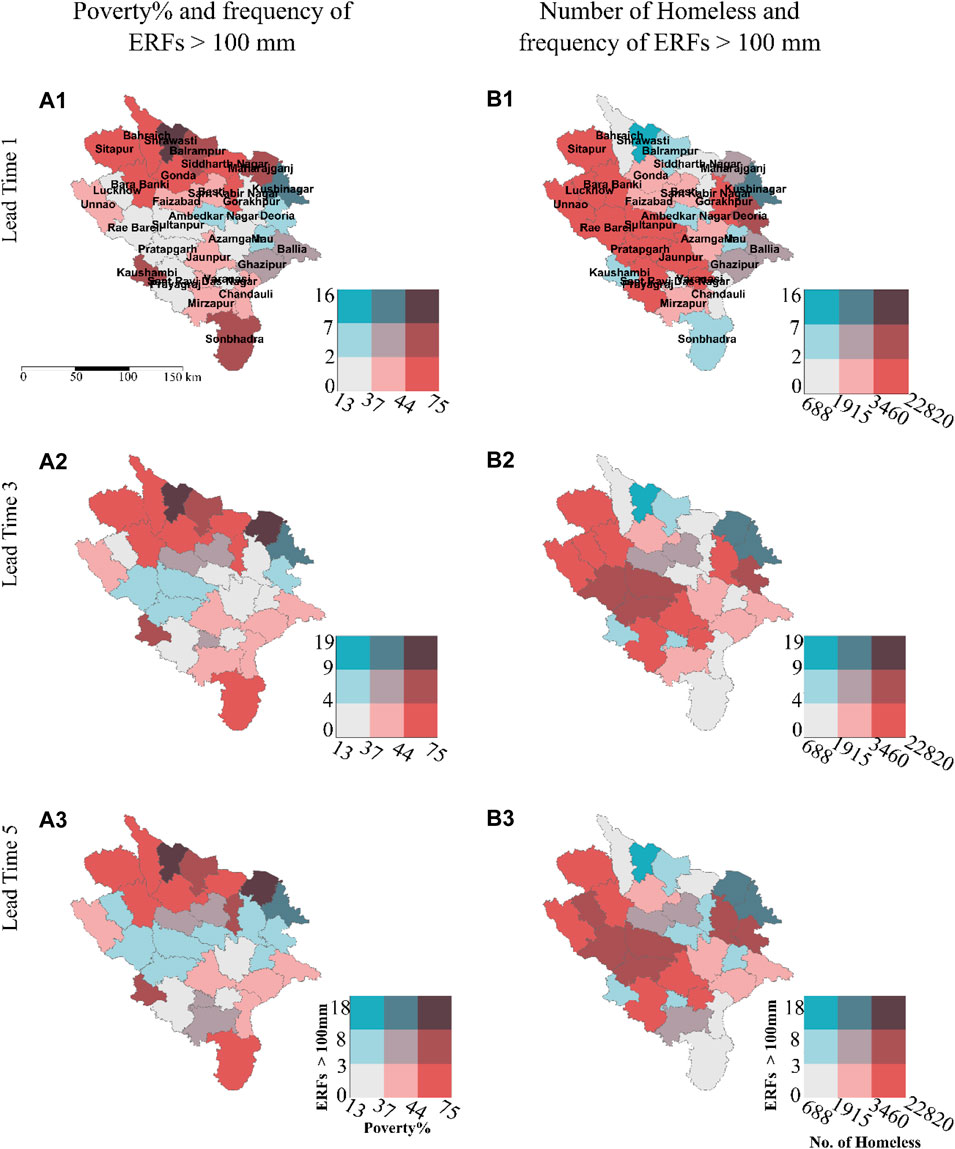
FIGURE 4. A bivariate choropleth map showing the combined effect of the number of ERFs with the poor population (Panels (A1–A3)) and homeless population (Panels (B1–B3)) across the districts at three lead times and 100 mm threshold.
4.2.3 Based on Impacts on Agriculture and Economy
Figure 5 shows the bivariate choropleth map representing the combined influence of the net sown area (Figures 5A1–A3) and the amount of GDP contribution (Figures 5B1–B3) of each district along with the frequency of ERFs at the 100 mm rainfall threshold. Results from Figure 5A1 show that there are multiple districts scattered across the region having relatively large net sown areas with a high probability of facing the adverse impacts of extreme rainfall for LT_1. Among them, districts such as Sitapur, Gonda and Barabanki show a high probability of impact across all three lead times. Further, in the case of GDP contribution, we find that the prominent districts which generally have a greater contribution of GDP in the region face a larger probability of impacts. For instance, Figure 5B1 shows that the important economic centers in the region such as Faizabad, Prayagraj and Kushinagar have a larger probability of facing adverse impacts. However, the district of Lucknow (capital of the state of Uttar Pradesh) is expected to face considerably less impact. The results obtained using 70 mm rainfall as the threshold is presented in Supplementary Figure S7. In addition, six districts of the study area (Sultanpur, Prayagraj, Gorakhpur, Lucknow, Varanasi and Kushinagar) have the facility of airports. Of these districts, we observe that Gorakhpur and Kushinagar have frequently faced ERFs in the past years. Hence, any warning or forecast must include information about the likely delay/cancellation of flights so that the passengers may accordingly modify their travel.
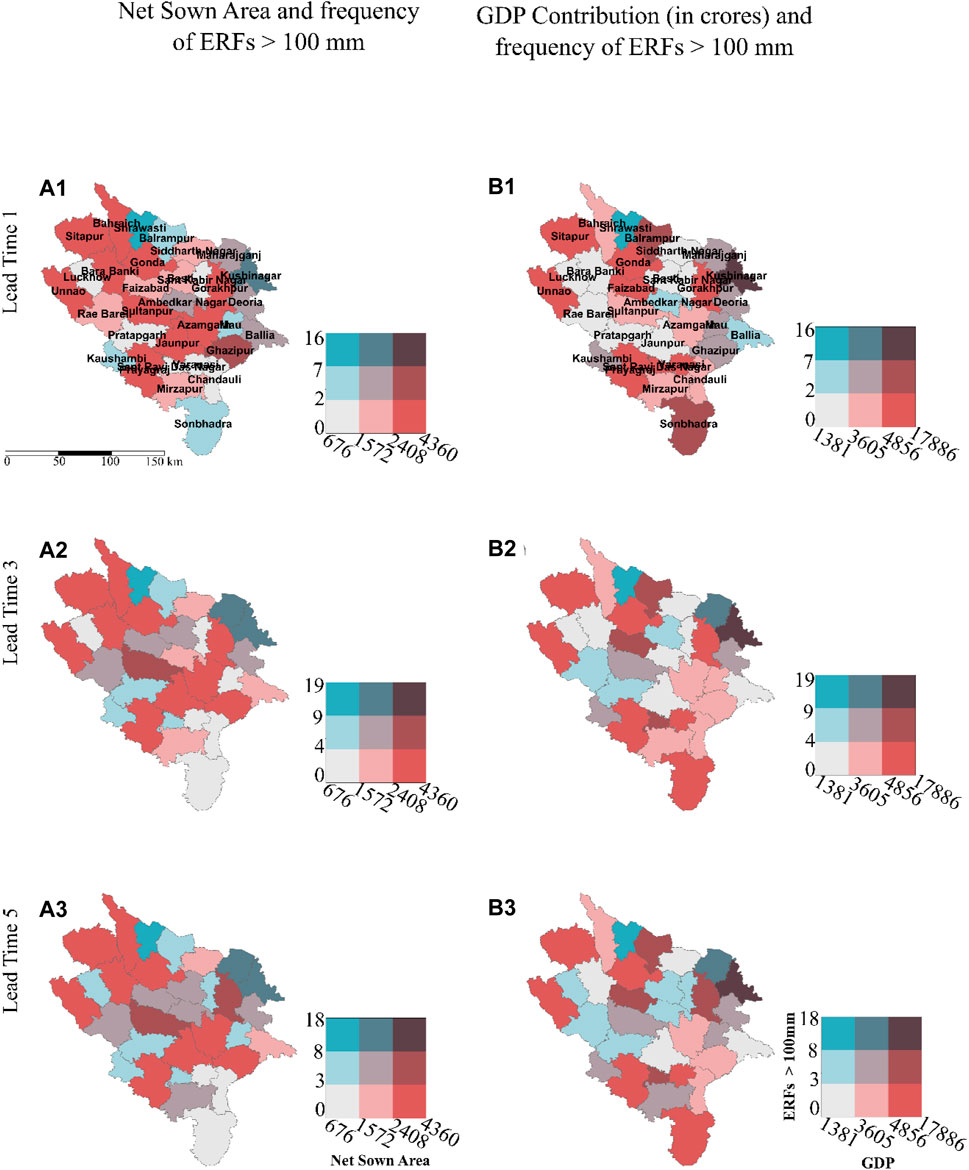
FIGURE 5. A bivariate choropleth map showing the combined effect of the number of ERFs with net sown area (Panels (A1–A3)) and total GDP contribution (Panels (B1–B3)) across the districts at three lead times and 100 mm threshold.
4.3 Generation of Impact-Based Warnings and Forecasts
In this section, we select three days when extreme rainfall was forecasted over the majority of the districts of the study area. Figure 6 shows the distribution of rainfall for three selected days (13th July 2019; 24th September 2020 and 25th September 2020). For each of the three days, one district is selected (belonging to a different category of impact). The selected districts are Shravasti (category-high), Gorakhpur (category-medium) and Jaunpur (category-low). More details about the three selected dates, along with the forecasted magnitude of rainfall, are presented in Table 2. Consequently, we generate the impact-based forecasts and the color-coded warning matrices for the districts along with appropriate actions to mitigate the potential adverse consequences.
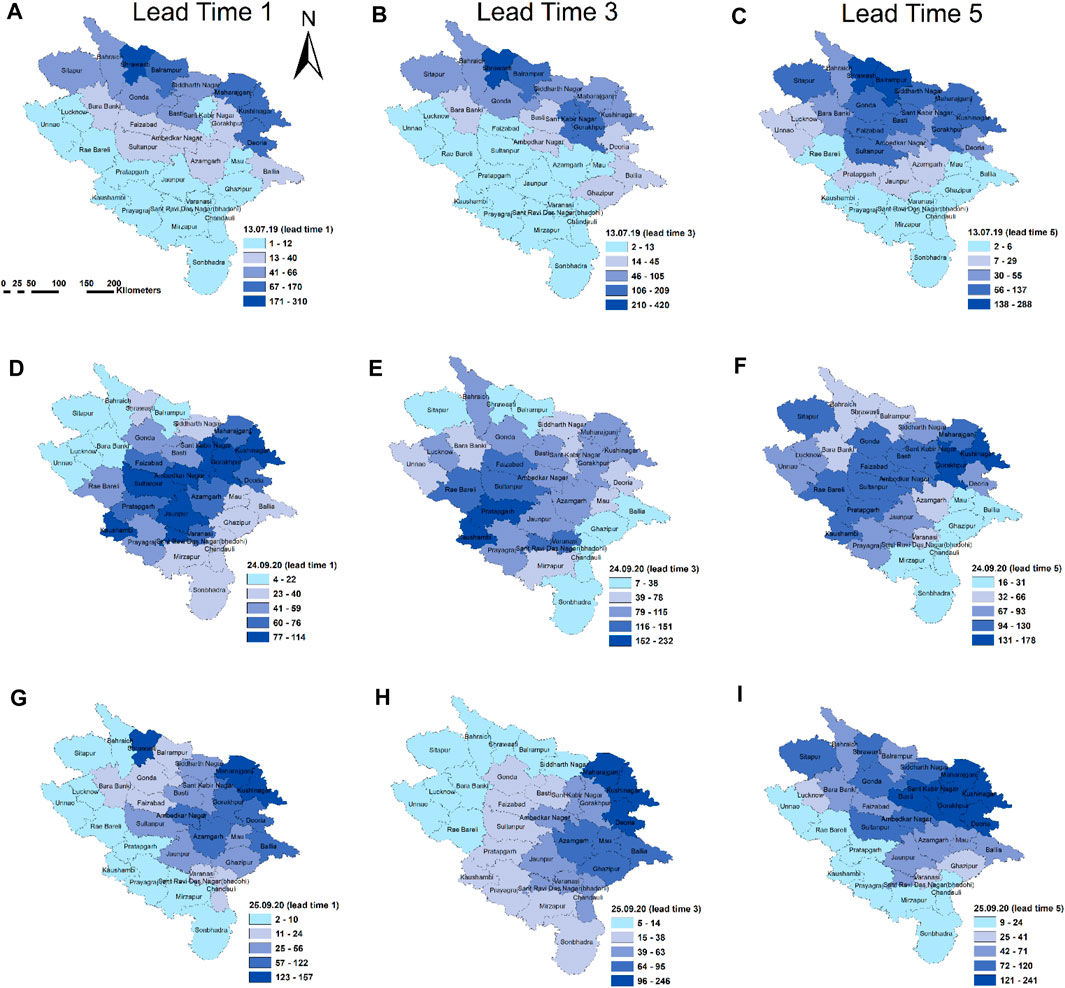
FIGURE 6. Maps showing the spatial distribution of rainfall for three selected days. Panels (A–C) shows the distribution on 13th July 2019, Panels (D–F) on 24th September 2020 and Panels (G–I) on 25th September 2020 for each of the three lead times, respectively.
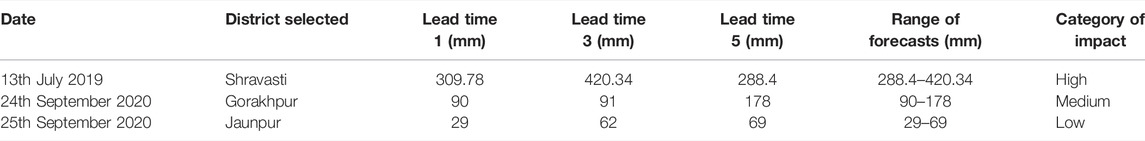
TABLE 2. Details about the three dates of extreme rainfall forecast, districts selected and category of expected impact.
4.3.1 Sample Impact-Based Forecast for “High” Category Impact
Table 3 shows a sample of the IBF generated for the district Shravasti under the “high” category of impact based on the magnitude of forecasted rainfall. The district is forecasted to receive extreme rainfall (with high magnitude), which puts it into the “high” category of impact. Moreover, results suggest that the income of a large percentage of the population in the district lies below the poverty line and could be highly vulnerable to an extreme rainfall event. Along with the general impacts that could occur (water-logging on streets, flooding in low-lying areas), the impacts of extreme rainfall on poor populations are also considered in the IBF. Alongside, possible responses are suggested based on the expected degree of impact.
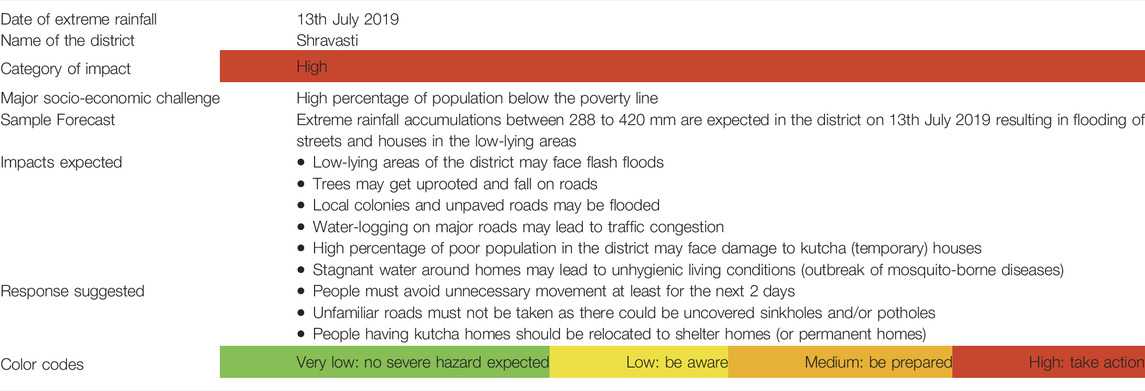
TABLE 3. A sample IBF generated for the district Shravasti.
4.3.2 Sample Impact-Based Forecasting for “Medium” Category Impact
A sample IBF is generated for the district of Gorakhpur under the “medium” category of impact for the date 24th September 2020, as presented in Table 4. A larger number of poor socio-economic parameters in the district make it more vulnerable (compared to district Shravasti) in case extreme rainfall occurs. However, in the present case, the magnitude of rainfall forecast is not as high (as in the case of Shravasti); hence the impacts are not expected to be too severe. Along with the general impacts that are expected during extreme rainfall, a large proportion of homeless people in the district are expected to be adversely impacted. Moreover, a large percentage of the net sown area means that standing and/or harvested crops could face damage, while the facility of an airport suggests that a number of flights might get delayed during the time of heavy downpour. Possible responses/mitigation measures are suggested in Table 4 to minimize the overall impact of the hazard.
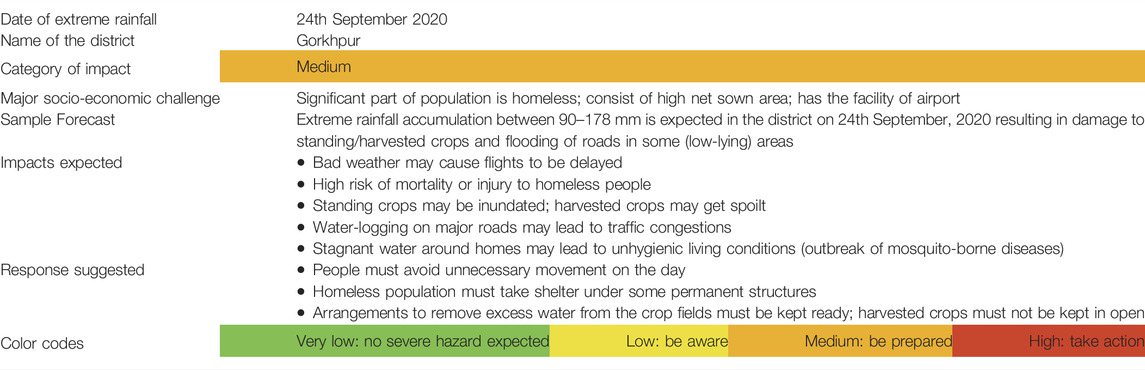
TABLE 4. A sample IBF generated for the district Gorakhpur.
4.3.3 Sample Impact-Based Forecasting for “Low” Category Impact
A sample IBF is generated for the district of Jaunpur under the “low” category of impact for the date 25th September 2020, as shown in Table 5. The district has a significant population that is homeless. Also, the net sown area in the district is comparatively higher. Since the magnitude of forecasted rainfall is not high (29–62 mm), minor impacts such as water-logging and inundation of crops are expected on the day. The suggested responses against the expected impacts may mitigate any adverse consequences due to the extreme rainfall.
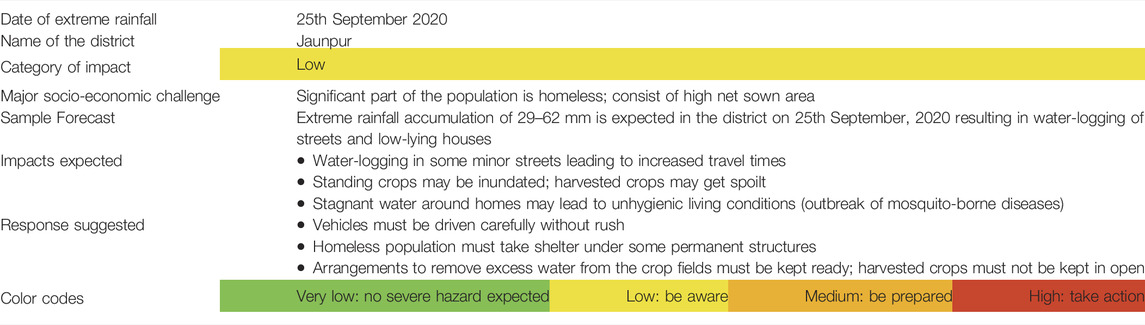
TABLE 5. A sample IBF generated for the district Jaunpur.
4.3.4 Sample Warning Matrix for the Selected Districts
The corresponding sample warning matrices for the selected districts are shown in Figure 7. Here, the magnitude of ERF determines the severity of impact while the likelihood of occurrence increases with each lead time (given that the magnitude does not sharply decrease). In the case of the district Shravasti (Figure 7A), we observe that the ERF in each of the three lead-times is consistently high in magnitude (see Table 2). The high magnitude of ERF means that the impacts could also be ‘high’ in severity. Moreover, results show that the magnitude of ERF does not decrease across the three lead-times (in fact, it increases in LT_1 as compared to LT_5); hence the likelihood of the extreme rainfall is expected to increase with the lead-times. In the case of Gorakhpur (Figure 7B), we observe that there is a sharp decrease in the magnitude of ERF in the lead-times that follow LT_5 (see Table 2). This suggests that the severity of impact could be low on the actual date of the extreme rainfall, and hence, the category of impact falls to “medium” (LT_1and LT_5) from “high” (LT_5). Moreover, the likelihood of occurrence increases from “low” to “high” as the forecasts in the lead-times approach the actual day of extreme rainfall. In the case of Jaunpur, we observe that the magnitude of ERF is the lowest among the three selected districts. Also, results show that there is a sharp decrease in the magnitude in LT_5 (compared to the other two lead-times). The likelihood of the occurrence of extreme rainfall is more in LT_5 (as compared to LT_3); however, due to the sharp decrease in the magnitude, the likelihood reduces to “low” in LT_1.
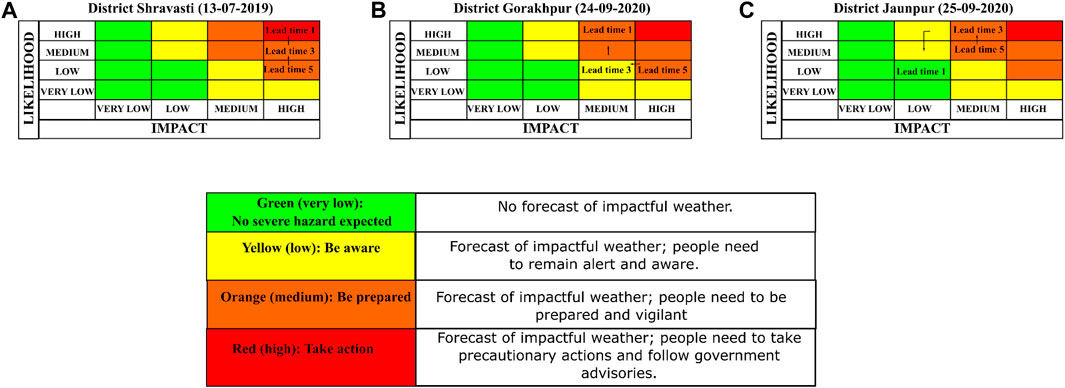
FIGURE 7. Sample warning matrices for the selected days and the selected districts based on the rainfall magnitude of the three lead times. (A) shows the sample warning matrix for the district Shravasti, (B) shows for the district Gorakhpur while (C) shows it for the district Jaunpur
4.4 Verification of the Forecast Data
In this section, we verify the occurrences of the extreme rainfall event as represented by the QPF from NCMRWF using the Integrated Multi-Satellite Retrievals for GPM (IMERG) data. IMERG is a widely used satellite-derived rainfall product used as the observation data to validate ground truth (Prakash et al., 2018; Das et al., 2022). To this end, we randomly selected four districts from the study area and plotted the time-series (by using a temporal window) of both the forecast from NCMRWF and the IMERG rainfall for a particular extreme rainfall event, as shown in Supplementary Figure S8. From the Figure, we observe that the ERF for the district Kushinagar coincides reasonably with the corresponding IMERG data for the first lead time (Supplementary Figure S8A). However, it does not coincide well with the other two lead times. Moreover, for the district, Unnao, the forecast and the observation lines match well for all the three lead times, while for the district Jaunpur, they do not match in either of the three lead times. Again, for the district Gorakhpur, the curves match well in LT_1 but fail in the other two lead times. Overall, results suggest that while the forecast data offered moderate accuracy in the study, it is still inadequate to be used by the end-users in its raw form. We suggest that post-processing methods could be applied to improve the accuracy of the forecast data before using it for operational purposes such as IBF.
5 Discussion
The study focuses on an approach to generate sample warning matrices as well as IBFs for the districts of eastern Uttar Pradesh based on rainfall forecasts and socio-economic conditions. Analysis of the frequency of ERFs in the past four years (2017–2020) show that the districts located in the eastern margin (such as Shravasti, Maharajganj, Kushinagar, Deoria etc.) have been more vulnerable to events of extreme rainfall. These districts are weak in infrastructure, have poor drainage systems and consist of relatively higher population density which makes a larger population vulnerable to mortality, injuries and displacement in the case of extreme rainfall.
Specifically, we observe that Gorakhpur has a high proportion of the female population in the study area, and it has also received frequent ERFs with high magnitude. This suggests that the female population of the district are highly exposed to extreme rainfall. In case of exposure to children population, we observe that the districts which have high children density have not been issued regular ERFs. This indicates that the children population in the region are less exposed to events of extreme rainfall in comparison to the female population. Furthermore, we find that the poor population among the districts have been highly exposed to ERFs. Population in districts such as Bahraich, Shravasti and Kaushambi are poor, and results show that these districts have been highly prone to ERFs in the past years. The concerned authorities must take into account the vulnerability of the poor population while issuing the warnings and IBFs, specifically for these districts.
In terms of impacts on agriculture and the economy, we observe that ERFs of high magnitude have been significantly issued in districts where the net sown area is large. For instance, in some districts where the severity of impact is expected to be “medium” (district Gorakhpur) or “low” (district Jaunpur), several ERFs have been issued in the past. Farmers and other stakeholders must be warned about the possible losses in case of extreme rainfall, and mitigation measures must be advised. Our results show that the GDP is high in the district of Kushinagar which is observed to be highly vulnerable to ERFs. Kushinagar is known to be a major Buddhist tourist spot and a hub of the sugar industry in Uttar Pradesh. Weather warnings and IBFs must include the possible impacts that tourists may face along with appropriate travel advisories before and during extreme rainfall occurs. Moreover, sugarcane farmers could be notified and warned of the incoming rainstorm so that their crops (standing or harvested) do not get damaged. Suitable communication must be made to industry owners and staff regarding the expected timing and duration of the extreme rainfall so that they can adjust their working hours. Furthermore, we selected three days when the ERF was highest in the study area, and one district is selected for each of those days to generate the IBF and warning matrix. The districts are purposely selected in such a way that they show varied categories of impact due to the extreme rainfall. For instance, the district Shravasti is expected to have a “high” category of impact on 13th July 2019; district Gorakhpur is expected to have a “medium” category of impact on 24th September 2020; and the district Jaunpur is expected to have “low” category of impact on 25th September 2020. Since the expected impact on the district Shravasti is “high,” it means that the forecasted extreme rainfall may cause large destruction in the district. The corresponding IBFs includes all the possible implications by taking into account the socio-economic conditions of the district. Appropriate responses to all the impacted stakeholders must be conveyed. Moreover, the district Gorakhpur is under the ‘medium’ category, which means that the approaching extreme rainfall can cause serious impacts flooding, especially in the low-lying regions. Improper communication of mitigation responses can lead to mortalities and injuries. Furthermore, the “low” category of impact (such as in Jaunpur) is not expected to cause widespread damage. Such forecast means that the traffic (especially during the rush hour) may get congested due to waterlogging on roads. Overall, the study deals with the identification of expected impacts and appropriate communication of mitigation responses to the affected population, which is crucial to reduce the widespread destruction that may be caused by the increased events of extreme rainfall in the region.
6 Conclusion
The study demonstrates, for the first time, the integration of the NWP forecast and the socio-economic data to forecast the possible impacts over a region in case of an extreme rainfall event. Results show that the population in some districts, such as Shravasti and Kaushambi, are relatively poor, and the districts have been highly vulnerable to ERFs in the past years. Warnings and IBFs for these districts must include the possible impacts and responses in order to mitigate the severity of the impact. Moreover, we selected three days (with three lead-times) when the magnitude of ERF was highest in the region. For each of the three days, one district is selected to generate a sample of an IBF and warning matrix. The IBF informs about the category of impact expected on the day (either very low, low, medium or high) along with the expected impacts based on the category of impact. The magnitude of the forecast and the socio-economic condition of the district determines the extent of possible impacts. Precautionary actions are suggested to the relevant stakeholders to mitigate the adversity of the impact. Furthermore, a warning matrix is issued, which provides information regarding the “likelihood” of occurrence of the extreme rainfall and the expected severity of impact. The warning matrix is formed on the basis of estimations of rainfall in the various lead-times. Generally, the likelihood increases as the day of extreme rainfall approaches and the severity of impact are determined by the consistency in magnitude of lead time forecasts. Overall, the study provides a novel approach to generate impact-based forecasts along with warning matrices which can benefit the meteorological agencies and emergency service providers significantly to communicate crucial weather information to the local population in order to mitigate adverse impacts.
6.1 Limitations and Future Challenges
The present work aims to generate IBFs and warning matrices at the district level. Future studies may perform impact-based forecasting at more local levels such as sub-districts, following the work of Reddy et al. (2021) to provide a better understanding to policymakers and district administrators. Moreover, fine-resolution forecast datasets can be used to understand the probability and severity of impacts at the local levels. Different forecast datasets available from various NWP models and Weather Research and Forecasting (WRF) models can also be used to substantiate the findings and consequently provide reliable probabilities of impacts. Furthermore, statistical weighting methods can be used to assign weights to the socio-economic variables which may differ with each district. Several other socio-economic variables (such as the percentage of elderly people, the road network density etc.) can also be used to broaden the scope of the study. Furthermore, post-processing of the forecast data may be explored to improve the accuracy of the forecast data (and reduce the false-alarm rate) before using it to generate IBFs.
Data Availability Statement
The original contributions presented in the study are included in the article/Supplementary Material, further inquiries can be directed to the corresponding author.
Author Contributions
AS: Conceptualization, data curation, formal analysis, methodology, writing-original draft, investigation, funding acquisition, validation, visualization. RA: Data curation, investigation, visualization, and formal analysis. SJ: Conceptualization, writing and editing manuscript, investigation, supervision, and funding acquisition.
Funding
AS acknowledges the financial support from the Department of Science and Technology, Government of India (DST/INSPIRE/03/2019/001343) (IF 190257) under the DST-INSPIRE scheme. This research was supported by the Science and Engineering Research Board (SERB), Department of Science and Technology, Government of India (project number CRG/2018/000649), awarded to SJ.
Conflict of Interest
The authors declare that the research was conducted in the absence of any commercial or financial relationships that could be construed as a potential conflict of interest.
Publisher’s Note
All claims expressed in this article are solely those of the authors and do not necessarily represent those of their affiliated organizations, or those of the publisher, the editors and the reviewers. Any product that may be evaluated in this article, or claim that may be made by its manufacturer, is not guaranteed or endorsed by the publisher.
Supplementary Material
The Supplementary Material for this article can be found online at: https://www.frontiersin.org/articles/10.3389/feart.2022.846113/full#supplementary-material
References
Basher, R. (2006). Global Early Warning Systems for Natural Hazards: Systematic and People-Centred. Phil. Trans. R. Soc. A 364, 2167–2182. doi:10.1098/RSTA.2006.1819
Bostrom, A., Morss, R., Lazo, J. K., Demuth, J., and Lazrus, H. (2018). Eyeing the Storm: How Residents of Coastal Florida See Hurricane Forecasts and Warnings. Int. J. Disaster Risk Reduct. 30, 105–119. Elsevier. doi:10.1016/J.IJDRR.2018.02.027
Casteel, M. A. (2018). An Empirical Assessment of Impact Based Tornado Warnings on Shelter in Place Decisions. Int. J. Disaster Risk Reduct. 30, 25–33. Elsevier. doi:10.1016/J.IJDRR.2018.01.036
Casteel, M. A. (2016). Communicating Increased Risk: An Empirical Investigation of the National Weather Service’s Impact-Based Warnings. Weather, Climate, and Society. Am. Meteorological Soc. 8 (3), 219–232. doi:10.1175/WCAS-D-15-0044.1
Das, S., Jain, M. K., and Gupta, V. (2022). A Step Towards Mapping Rainfall Erosivity for India Using High-Resolution GPM Satellite Rainfall Products. CATENA 212, 106067. doi:10.1016/j.catena.2022.106067
Froude, L. S. R. (2010). TIGGE: Comparison of the Prediction of Northern Hemisphere Extratropical Cyclones by Different Ensemble Prediction Systems. Weather and Forecasting. Am. Meteorological Soc. 25 (3), 819–836. doi:10.1175/2010WAF2222326.1
Goswami, B. N., Venugopal, V., Sengupta, D., Madhusoodanan, M. S., and Xavier, P. K. (2006a). Increasing Trend of Extreme Rain Events over India in a Warming Environment. Science 314 (5804), 1442–1445. doi:10.1126/science.1132027
Goswami, B. N., Venugopal, V., Sengupta, D., Madhusoodanan, M. S., and Xavier, P. K. (2006b). Increasing Trend of Extreme Rain Events Over India in a Warming Environment. Science 314 (5804), 1442–1445. doi:10.1126/SCIENCE.1132027
Jha, S. K., Shrestha, D. L., Stadnyk, T. A., and Coulibaly, P. (2018). Evaluation of Ensemble Precipitation Forecasts Generated through Post-processing in a Canadian Catchment. Hydrol. Earth Syst. Sci. 22 (3), 1957–1969. doi:10.5194/hess-22-1957-2018
Jongman, B. (2018). Effective Adaptation to Rising Flood Risk. Nat. Commun. 9 (1), 1–3. doi:10.1038/s41467-018-04396-1
Kaltenberger, R., Schaffhauser, A., and Staudinger, M. (2020). "What the Weather Will Do" - Results of a Survey on Impact-Oriented and Impact-Based Warnings in European NMHSs. Adv. Sci. Res. 17, 29–38. doi:10.5194/ASR-17-29-2020
Kox, T., Lüder, C., and Gerhold, L. (2018). Anticipation and Response: Emergency Services in Severe Weather Situations in Germany. Int. J. Disaster Risk Sci. 9 (1), 116–128. doi:10.1007/S13753-018-0163-Z
Losee, J. E., and Joslyn, S. (2018). The Need to Trust: How Features of the Forecasted Weather Influence Forecast Trust. Int. J. Disaster Risk Reduct. 30, 95–104. doi:10.1016/J.IJDRR.2018.02.032
Mendis, M. M. P. (2021). “An Approach for Impact-Based Heavy Rainfall Warning, Based on the ECMWF Extreme Forecast Index and Level of Hazard Risk,” in Multi-Hazard Early Warning and Disaster Risks. Editors D. Amaratunga, R. Haigh, and N. Dias (Cham: Springer), 543–559. doi:10.1007/978-3-030-73003-1_37
Morss, R. E., Cuite, C. L., Demuth, J. L., Hallman, W. K., and Shwom, R. L. (2018). Is Storm Surge Scary? The Influence of Hazard, Impact, and Fear-Based Messages and Individual Differences on Responses to Hurricane Risks in the USA. Int. J. Disaster Risk Reduct. 30, 44–58. Elsevier. doi:10.1016/J.IJDRR.2018.01.023
Mukherjee, S., Aadhar, S., Stone, D., and Mishra, V. (2018). Increase in Extreme Precipitation Events under Anthropogenic Warming in India. Weather Clim. Extrem. 20, 45–53. doi:10.1016/j.wace.2018.03.005
Otieno, H., Yang, J., Liu, W., and Han, D. (2014). Influence of Rain Gauge Density on Interpolation Method Selection. J. Hydrol. Eng. 19 (11), 04014024. doi:10.1061/(ASCE)HE.1943-5584.0000964
Panda, D. K., Panigrahi, P., Mohanty, S., Mohanty, R. K., and Sethi, R. R. (2016). The 20th Century Transitions in Basic and Extreme Monsoon Rainfall Indices in India: Comparison of the ETCCDI Indices. Atmos. Res. 181, 220–235. doi:10.1016/j.atmosres.2016.07.002
Pattanaik, D. R., and Rajeevan, M. (2010). Variability of Extreme Rainfall Events over India during Southwest Monsoon Season. Met. Apps 17 (1), 88–104. John Wiley and Sons Ltd. doi:10.1002/met.164
Pittore, M., Wieland, M., and Fleming, K. (2017). Perspectives on Global Dynamic Exposure Modelling for Geo-Risk Assessment. Nat. Hazards 86 (1), 7–30. doi:10.1007/S11069-016-2437-3/FIGURES/2
Potter, S. H., Kreft, P. V., Milojev, P., Noble, C., Montz, B., Dhellemmes, A., et al. (2018). The Influence of Impact-Based Severe Weather Warnings on Risk Perceptions and Intended Protective Actions. Int. J. Disaster Risk Reduct. 30, 34–43. doi:10.1016/J.IJDRR.2018.03.031
Prakash, S., Mitra, A. S., AghaKouchak, A., Liu, Z., Norouzi, H., and Pai, D. S. (2018). A Preliminary Assessment of GPM-based Multi-Satellite Precipitation Estimates Over a Monsoon Dominated Region. J. Hydrol. 556, 865–876. doi:10.1016/j.atmosres.2016.07.002
Ray, K., Giri, R. K., Ray, S. S., Dimri, A. P., and Rajeevan, M. (2021). An Assessment of Long-Term Changes in Mortalities Due to Extreme Weather Events in India: A Study of 50 years' Data, 1970-2019. Weather Clim. Extrem. 32, 100315. doi:10.1016/J.WACE.2021.100315
Reddy, A. A., Bhattacharya, A., Reddy, S. V., and Ricart, S. (2021). Farmers' Distress Index: An Approach for an Action Plan to Reduce Vulnerability in the Drylands of India. Land 10 (11), 1236. doi:10.3390/LAND10111236/S1
Rossi, C., Acerbo, F. S., Ylinen, K., Juga, I., Nurmi, P., Bosca, A., et al. (2018). Early Detection and Information Extraction for Weather-Induced Floods Using Social Media Streams. Int. J. Disaster Risk Reduct. 30, 145–157. doi:10.1016/J.IJDRR.2018.03.002
Roxy, M. K., Ghosh, S., Pathak, A., Athulya, R., Mujumdar, M., Murtugudde, R., et al. (2017). A Threefold Rise in Widespread Extreme Rain Events over Central India. Nat. Commun. 8 (1), 1–11. doi:10.1038/s41467-017-00744-9
Sai, F., Cumiskey, L., Weerts, A., Bhattacharya, B., and Haque Khan, R. (2018). Towards Impact-Based Flood Forecasting and Warning in Bangladesh: a Case Study at the Local Level in Sirajganj District. Nat. Hazards Earth Syst. Sci. Discuss., 1–20. doi:10.5194/nhess-2018-26
Salio, P., Hobouchian, M. P., García Skabar, Y., and Vila, D. (2015). Evaluation of High-Resolution Satellite Precipitation Estimates over Southern South America Using a Dense Rain Gauge Network. Atmos. Res. 163, 146–161. Elsevier. doi:10.1016/J.ATMOSRES.2014.11.017
Silvestro, F., Rossi, L., Campo, L., Parodi, A., Fiori, E., Rudari, R., et al. (2019). Impact-based Flash-Flood Forecasting System: Sensitivity to High Resolution Numerical Weather Prediction Systems and Soil Moisture. J. Hydrology 572, 388–402. Elsevier. doi:10.1016/J.JHYDROL.2019.02.055
Singh, A., Tiwari, S., and Jha, S. K. (2021). Evaluation of Quantitative Precipitation Forecast in Five Indian River Basins. Hydrological Sci. J. 66, 2216–2231. doi:10.1080/02626667.2021.1982138
Singhal, A., Cheriyamparambil, A., and Jha, S. K. (2022). Spatial Extrapolation of Statistically Downscaled Weather Data over the Northwest Himalayas at Major Glacier Sites. Environ. Model. Softw. 149, 105317. Elsevier Ltd. doi:10.1016/j.envsoft.2022.105317
Singhal, A., and Jha, S. K. (2021a). An Application of Multiple‐Point Statistics Downscaling Approach Over North‐West Himalayas in Avalanche‐Prone Areas. Intl J. Climatol. 42, 1902–1921. doi:10.1002/joc.7342
Singhal, A., and Jha, S. K. (2021b). Can the Approach of Vulnerability Assessment Facilitate Identification of Suitable Adaptation Models for Risk Reduction? Int. J. Disaster Risk Reduct. 63, 102469. Elsevier Ltd. doi:10.1016/j.ijdrr.2021.102469
Taylor, A. L., Kause, A., Summers, B., and Harrowsmith, M. (2019). Preparing for Doris: Exploring Public Responses to Impact-Based Weather Warnings in the United Kingdom. Am. Meteorological Soc. 11 (4), 713–729. doi:10.1175/WCAS-D-18-0132.1
Tozier de la Poterie, A. S., Jjemba, W. E., Singh, R., Coughlan de Perez, E., Costella, C. V., and Arrighi, J. (2018). Understanding the Use of 2015-2016 El Niño Forecasts in Shaping Early Humanitarian Action in Eastern and Southern Africa. Int. J. Disaster Risk Reduct. 30, 81–94. Elsevier. doi:10.1016/J.IJDRR.2018.02.025
Uccellini, L. W., and Ten Hoeve, J. E. (2019). Evolving the National Weather Service to Build a Weather-Ready Nation: Connecting Observations, Forecasts, and Warnings to Decision-Makers through Impact-Based Decision Support Services. Am. Meteorological Soc. 100 (10), 1923–1942. doi:10.1175/BAMS-D-18-0159.1
Verdin, A., Funk, C., Rajagopalan, B., and Kleiber, W. (2016). Kriging and Local Polynomial Methods for Blending Satellite-Derived and Gauge Precipitation Estimates to Support Hydrologic Early Warning Systems. IEEE Trans. Geosci. Remote Sens. 54 (5), 2552–2562. doi:10.1109/TGRS.2015.2502956
Weyrich, P., Scolobig, A., Bresch, D. N., and Patt, A. (2018). Effects of Impact-Based Warnings and Behavioral Recommendations for Extreme Weather Events. Weather, Clim. Soc. 10 (4), 781–796. doi:10.1175/WCAS-D-18-0038.1
Winsemius, H. C., Aerts, J. C. J. H., Van Beek, L. P. H., Bierkens, M. F. P., Bouwman, A., Jongman, B., et al. (2015). Global Drivers of Future River Flood Risk. Nat. Clim. Change 6 (4), 381–385. doi:10.1038/nclimate2893
Keywords: extreme rainfall, impact-based forecasting, vulnerability, hazard, NWP forecast, socio-economic, warning matrix, mitigation measures
Citation: Singhal A, Raman A and Jha SK (2022) Potential Use of Extreme Rainfall Forecast and Socio-Economic Data for Impact-Based Forecasting at the District Level in Northern India. Front. Earth Sci. 10:846113. doi: 10.3389/feart.2022.846113
Received: 30 December 2021; Accepted: 20 April 2022;
Published: 19 May 2022.
Edited by:
Jorge Eduardo Teixeira Leandro, University of Siegen, GermanyReviewed by:
A. Amarender Reddy, National Institute of Agricultural Extension Management (MANAGE), IndiaAhmed Kenawy, Mansoura University, Egypt
Copyright © 2022 Singhal, Raman and Jha. This is an open-access article distributed under the terms of the Creative Commons Attribution License (CC BY). The use, distribution or reproduction in other forums is permitted, provided the original author(s) and the copyright owner(s) are credited and that the original publication in this journal is cited, in accordance with accepted academic practice. No use, distribution or reproduction is permitted which does not comply with these terms.
*Correspondence: Sanjeev K. Jha, c2FuamVldmpAaWlzZXJiLmFjLmlu