 Jie Ni
 Tonghua Wu
 Xiaofan Zhu1
 Jie Chen
 Xiaodong Wu
 Guojie Hu
 Defu Zou
 Ren Li
94% of researchers rate our articles as excellent or good
Learn more about the work of our research integrity team to safeguard the quality of each article we publish.
Find out more
ORIGINAL RESEARCH article
Front. Earth Sci., 08 April 2022
Sec. Cryospheric Sciences
Volume 10 - 2022 | https://doi.org/10.3389/feart.2022.845873
This article is part of the Research TopicEcological Impacts of Degrading PermafrostView all 19 articles
Climate warming could accelerate frozen ground degradation on the Qinghai–Tibet Plateau (QTP). Quantitative analysis of the impacts of thaw-induced hazards of the frozen ground on human activities in cold regions has become one of the most important issues in current research. To identify adverse impacts of these thawing hazards on human activities, this study explores a spatially explicit, temporally consistent and quantitative method to map human activity intensity (HAI). Four categories of variables are selected to represent some of the most important human activities on the QTP, including land use, road distribution, population density, and grazing density. By improving the human footprint index method, HAI maps of the QTP in 1995, 2005, and 2015 are created, and then quantitative analysis of the HAI under different thawing hazard levels in the frozen ground of QTP is done. The results show that, for the above three periods, the mean HAI values on the QTP are 0.10, 0.11, and 0.12, respectively. Moreover, during 1995–2015, the intensity and extent of human activities increase by 15.35% and 40.64%, respectively. The superposition results of the HAI and frozen ground thawing hazard maps show that a seasonally frozen ground region has relatively larger HAI, and its mean value is more than twice that of the permafrost region. For permafrost regions, the medium-hazard area has the highest HAI (0.09), which possibly has great impacts on the linear infrastructure. The establishment of a thawing disaster warning map can effectively shield high thaw settlement hazard areas without human activities and thus can present a more accurate early warning. These results can provide important scientific references for the disaster prevention and mitigation work in frozen ground regions, including risk assessment and infrastructure maintenance.
Frozen ground is an important part of the cryosphere, which plays a critical role in ecohydrological processes, climate regulation, and engineering construction in cold regions (Qin et al., 2018; Karjalainen et al., 2019; Neill et al., 2020). At present, climate warming has led to widespread thawing of permafrost, which is mainly manifested in a rising ground temperature, a thickening active layer, an emergence and expansion of taliks, and a shrinking area of permafrost (Qin et al., 2017; Wang et al., 2018; Ni et al., 2020). The Qinghai–Tibet Plateau (QTP) has the largest areas of permafrost in the mid- and low-latitude regions. The area of permafrost and seasonally frozen ground covers approximately 1.06 × 10⁶ and 1.46 × 10⁶ km2, respectively, accounting for approximately 96% of the total area of the QTP (Figure 1, Zou et al., 2017). Compared with high-latitude regions, the permafrost on the QTP shows a higher ground temperature and a poorer hydrothermal stability (Cheng et al., 2019; Obu et al., 2019; Qin et al., 2020). These characteristics further exacerbate the degradation of permafrost in the QTP. It is noteworthy that, currently, thaw-induced hazards caused by frozen ground degradation are increasingly frequent and complex on the QTP (Ni et al., 2020; Wei et al., 2021). This poses a great threat to the ecological environment and related infrastructure (Wu et al., 2012; Hjort et al., 2018; Ni et al., 2021). Meanwhile, with the opening of the Qinghai–Tibet Railway/Highway (QTR/QTH) and the rapid development of urbanization, human activities on the QTP have been increasing (Xu et al., 2020). The impact of the rapidly degrading frozen ground on human activities has drawn considerable attention.
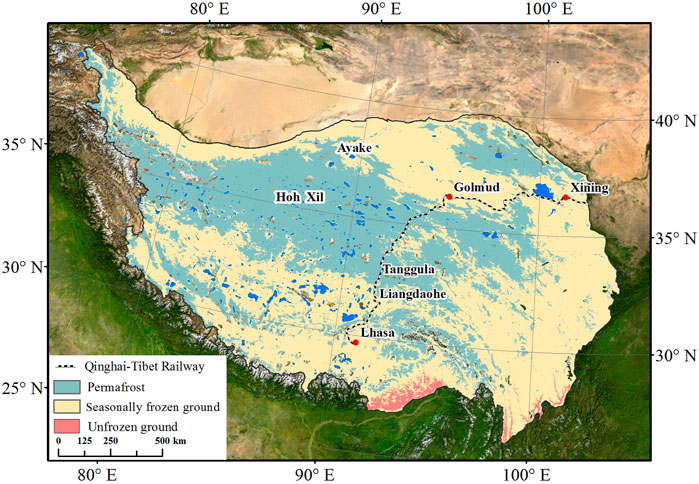
FIGURE 1. The location of the study area.
In recent years, considerable research on the negative effects of frozen ground degradation has been carried out. Wu and Niu (2013) found that thaw-induced hazards would cause huge economic losses to infrastructure engineering. Since the 21st century, the damage rate of the QTH has reached more than 30% due to freeze–thaw-related disasters in permafrost regions (Yao et al., 2013). Compared with road infrastructures, the stability of transmission lines and gas/oil pipelines with their buried foundations is more severely affected by thermal disturbances (Wang et al., 2014). With future increases in load and foundation size, the safe operation of power facilities and gas/oil pipelines will face greater threats (He and Jin, 2010). Similar evidence from recent studies based on interferometric synthetic aperture radar (In-SAR) technology suggests that the engineering corridor in the central QTP is experiencing widespread seasonal deformation and long-term subsidence due to the degradation of frozen ground (Chen et al., 2022). In addition, permafrost degradation also leads to lower groundwater levels and drying topsoil and consequently affects vegetation biomass (Fang et al., 2011a; Teufel and Sushama, 2019). The grassland is the basis for the survival of herdsmen on the QTP. Slight variations in grassland productivity will have a greater impact on the herdsmen's livelihood (Fang et al., 2011a; 2019). Relevant research showed that due to permafrost degradation, the carrying capacity of theoretical livestock was reduced by 11% in the source regions of the Yangtze and Yellow Rivers during 1980–2007 (Fang et al., 2011a; 2011b). More and more studies showed that lake outburst also may accelerate permafrost degradation around the lake and threaten the safety of linear projects (Niu et al., 2011; Lu et al., 2020). Although the investigations above have been conducted on the impact of thaw-induced hazards on the frozen ground, most of them focus on local areas or a single category of impact, such as roads, transmission lines, grasslands and animal husbandry, etc. These studies are not sufficient to reflect the comprehensive impacts on human activities under the expansion and aggravation of thaw-induced hazards (Zhang and Wu, 2012; Hjort et al., 2018). Therefore, it is necessary to conduct a comprehensive risk assessment on this scientific issue.
As a kind of human activity intensity (HAI) measurement, human footprint data were first proposed by Sanderson et al. (2002). The generation of this dataset provides an important means to study the interaction between human beings and the natural environment (Sanderson et al., 2002; Duan and Luo, 2020). The original version of the human footprint map was drawn based on nine variables as proxies for human activity; however, this version was static and time-limited (Venter et al., 2016a). Subsequently, this method was improved at regional and global scales. Etter et al. (2011) incorporated temporality and biophysical vulnerability to quantify the spatial footprint of humans on the ecosystem. Venter et al. (2016b) reintegrated human activity data and finally selected eight variables to draw a global human footprint map in 1993 and 2009. Ayram et al. (2017) adjusted the human footprint index in terms of habitat loss and fragmentation in Mexico. By considering the regional characteristics of the QTP, Li et al. (2018) ultimately selected four types of human activity data to illustrate the human influence intensity data for the three periods of 1990, 2000, and 2010. Duan and Luo (2020) extended and refined the datasets of Li et al. (2018) from 1990 to 2015 (every 5 years). Based on the above analyses, the human footprint map was mainly used to study the negative impacts of human activities on the ecological environment. However, to some extent, the human footprint dataset can reflect the importance of the region. As we all know, while using and transforming nature, human beings are inevitably threatened by natural disasters (Sanderson et al., 2002). Based on these characteristics, this study revised the human footprint map to objectively reflect the importance of human activities in a given area and further provide empirical support for the quantitative analysis of the impact of frozen ground thawing on human activities.
As mentioned above, frozen ground degradation and consequential thaw-induced hazards have become widespread during recent decades. Therefore, it is necessary to quantitatively analyze the intensity of human activities under the thawing hazards of the frozen ground in the QTP. As such, the objectives of this study are 1) to select and assign human activity data, 2) to draw multiperiod human footprint maps and analyze change trends on the QTP, and 3) to quantitatively analyze the intensity of human activities under different thawing hazard levels in the frozen ground and assess their impacts. The created warning map can specifically highlight areas with intense human activities and great thawing hazards. This study can provide a scientific reference for preventing the losses caused by the thawing of frozen ground and is of great significance to regional sustainable development.
In this study, the human footprint is called the HAI, which represents the importance of a given region in terms of the intensity of human activity. Compared with previous studies, we chose four categories of data as proxies for human activity, which represent some of the most important actions taken by humans, including land use, road distribution, population density, and grazing density (Figure 2, step 1). To more objectively reflect the HAI, we assigned a score to each type of HAI dataset; the higher the score was, the greater the importance. Then, we normalized the scores within a 0–1 scale (Figure 2, step 2). The normalized data were weighted and summed to create the standardized HAI map for the QTP in 1995, 2005, and 2015 (Figure 2, step 3). The four categories of HAI are not mutually exclusive, and some co-occurred in the same location. Finally, according to the results of the frozen ground thawing hazards, we analyzed the human activities in the QTP (Figure 2, step 4). To intuitively display the HAI under different thawing hazard levels on the frozen ground of the QTP to achieve an early warning effect, we normalized the thawing hazard levels and then multiplied them with the HAI layer to obtain the thawing disaster warning index. Based on the Jenks Natural Breaks algorithm (Jenks, 1967), the warning index was divided into four risk levels, from low to high risk, as low, medium, high, and warning zones. During the above research, all layers were resampled to a matching spatial resolution (∼1 km) using Albers conical equal-area projection. It should be noted that this study analyzes the HAI under different thawing hazard levels in the frozen ground. The thawing hazards do not occur in the unfrozen ground area. Hence, the region of unfrozen ground is excluded in the study.
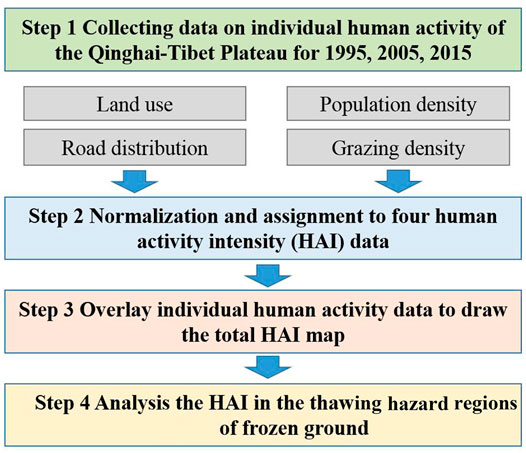
FIGURE 2. The workflow of this study.
(1) Land use
Land use is an important manifestation of human activities, and its changes reflect the magnitude of human activities (Otto et al., 2016; Zhang et al., 2020). The land use data on the QTP were obtained from the Resource and Environment Science and Data Center (available at http://www.resdc.cn/), which covers the years 1995, 2005, and 2015. The dataset includes six land use classes and 25 subclasses. Based on the HAI, recent studies have reclassified the initial land use types and then assigned scores to each new type (Table 1) (Zhao et al., 2015; Li et al., 2018). A maximum score of 10 was assigned to built-up land, which means that this type of land use was the most important area for human activities, while lower scores (8, 8, and 7) were allocated to rural settlements, reservoirs/ponds, and croplands, respectively. The traditional nomadic lifestyle of Tibetan herdsmen enables dense grasslands to have the best grazing potential, followed by moderate grasslands (Fang et al., 2011a; Li et al., 2018). Therefore, scores of 2 and 1 were assigned to these grasslands, respectively. A minimum score of 0 was assigned to all other land cover types, which had the lowest intensity of human activities.
(2) Roads and railways
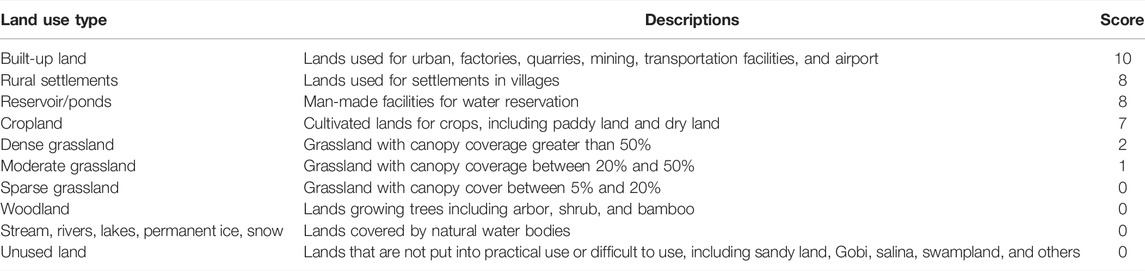
TABLE 1. Land use types and their human influence scores (Li et al., 2018).
As some of the most prolific linear infrastructures, roads/railways are important drivers of habitat conversion by humans (Trombulak and Frissell, 2000), especially on the QTP. The data for 2005 and 2015 on the QTP were vectorized from road traffic maps and combined with OpenStreetMap (OSM, http://download.geofabrik.de/). Since the data for 1995 were not available, we used the global roads open access dataset (Center for International Earth Science Information Network Columbia University, and Information Technology Outreach Services University of Georgia, 2013) from 2000 instead. Detailed information can be found in Table S1. The data for the above three periods all included expressways; national-, provincial-, county-, and rural-level highways; and railways. Since the thermal disturbance of frozen ground threatens the surrounding infrastructure within a certain distance, this study added a buffer analysis to the road importance assignment. The further away from the road, the less harmful and less important the impact. The buffer range was ultimately set as 7 km in this study, instead of the 10 km used in previous studies (Li et al., 2018), and the intensity score diminished gradually to either side of the road (Table 2). A detailed explanation is provided in the Discussion section.
(3) Population density
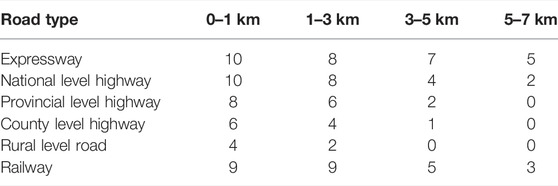
TABLE 2. Human activity intensity scores for roads and railways revised from Li et al. (2018).
Population density is a direct reflection of the importance of a region (Ellis and Ramankutty, 2008). The 1 km population density datasets of the QTP for 1995, 2005, and 2015 were obtained from the Resource and Environment Science and Data Center (Table S1). The population density was established based on the land use type, nighttime light, and the population distribution weight of residential density (Xu, 2017). Compared with the cities on the east coast, the QTP was extremely sparsely populated (Fang, 2013). To reasonably reflect the distribution of population density in this study, we modified the formula proposed by Venter et al. (2016a). For locations with more than 100 people per square kilometer, we assigned an intensity score of 10. For more sparsely populated areas, we logarithmically scaled the intensity score using the following formula:
(4) Grazing density
The QTP is a major pastoral area of China (Li et al., 2018). Although long-term grazing activities affect the grassland vegetation biomass, they can also stimulate plant growth and improve soil fertility through excrement (Lin et al., 2010; Zhao et al., 2019). Therefore, grazing activities in the QTP were considered a key indicator in this study. The grazing density data were acquired from the United Nations Food and Agricultural Organization (UN FAO, https://data.apps.fao.org/). We overlaid the cattle and sheep densities to represent the grazing density. Since only the grazing data from 2010 were obtained, a trend extrapolation method (Duan and Luo, 2020) was used to obtain the grazing density data for 1995, 2005, and 2015. First, we calculated the change rates of cattle and sheep production from 1995 to 2015 based on the statistical yearbooks of the Qinghai Province and the Tibet Autonomous Region. Then, we used the cattle and sheep density layer from 2010 to calculate the cattle and sheep density data in these two areas for 1995, 2005, and 2015. Considering the impact of different herds on the ecological environment in this calculation, the grazing intensity of one cattle was regarded as equivalent to that of five sheep (Ouyang, et al., 2016). Finally, we converted the cattle data into the equivalent intensity of sheep and overlaid them together. Referring to the conversion method of population density, we also logarithmically scaled the intensity score using the following formula:
(5) Thawing hazard regions of frozen ground
Frozen ground degradation poses a huge threat to human activities on the QTP. However, the value of the HAI varies with different thawing hazard levels of the frozen ground. The data of the thawing hazard regions of the frozen ground were derived from our previous research results (Supplementary Figure S1; Ni et al., 2021). It should be noted that the seasonally frozen ground only experiences a periodic seasonal thaw settlement that has a lower hazard. However, in addition to seasonal settlement, permafrost also experiences a long-term, absolute ground settlement (due to the thawing of ground ice, Supplementary Figure S2) that has a relatively large hazard. Therefore, we classified seasonally frozen ground as a minimal hazard region. We divided the permafrost regions into low-, medium-, and high-hazard areas (the low hazard area in this study included the stable area) according to the hazard level of the thawing settlement.
(1) Normalization method
To eliminate the impact of the dimensions and magnitudes of each factor (various physical properties and conditions) and to effectively overlay the four types of data, we normalized the intensity score of the human activity in each type to 0–1. The following standardized processing formula was performed:
where i is the factor number,
(2) The analytic hierarchy process
The analytic hierarchy process (AHP) is a multiobjective, multicriteria decision-making approach that is used to analyze complex problems (Saaty and Kearns, 1985; Niu et al., 2011). This model requires the creation of a reciprocal pairwise comparison matrix used to determine weighted coefficients for the computation of HAI scores. Generally, the pairwise comparison is subjective, and the quality of the results is dependent on the experts' judgment. Hence, a consistency ratio was proposed to evaluate the accuracy of the results (Saaty and Kearns, 1985; Niu et al., 2015). In a successful expert judgement, the consistency ratio should be <0.1. In our AHP model, the consistency ratio was 0.04, indicating an acceptable assessment. The weight coefficients obtained by this method are shown in Table S2. Subsequently, we computed the total HAI on the QTP based on the AHP method:
Based on the above methods, we obtained the individual HAI maps of four categories of variables (Figure 3). The statistical results showed that the mean values of land use, road distribution, population density, and grazing density were 0.06, 0.08, 0.10, and 0.18, respectively (Table 3), which indicated that the HAI values of the four variables were low on the QTP during the study period. The high values of these individual HAIs were mainly distributed in the eastern and southern QTP. Two regions with high HAI values could be easily identified in Xining, Lhasa, and the surrounding areas (Figures 1and 3). Low HAI values were mainly distributed in the western QTP.
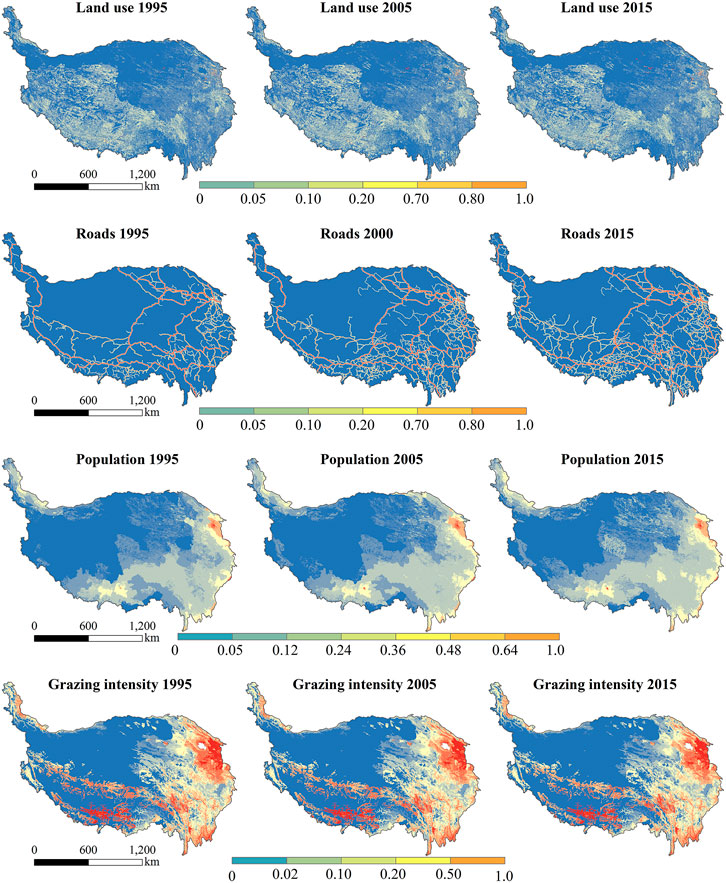
FIGURE 3. Spatial distribution of four individual human activity intensity datasets in 1995, 2005, and 2015 on the Qinghai–Tibet Plateau.
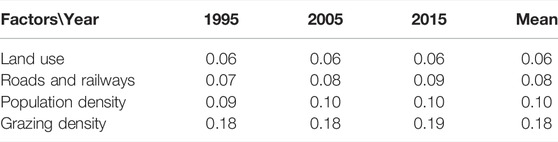
TABLE 3. The mean values of four individual human activity intensity datasets in 1995, 2005, and 2015 on the Qinghai–Tibet Plateau.
Through the weighted average of the four categories of individual HAI datasets, we obtained the total HAI map of the QTP for 1995, 2005, and 2015 (Figure 4). The statistical results showed that the mean HAI values were 0.10, 0.11, and 0.12, respectively. Since the theoretical maximum was 1.00, the QTP had a relatively low HAI for 1995–2015. In addition, during the study period, the percentages of grids where the HAI value was lower than the mean value were 59.12%, 58.89%, and 58.85%, respectively. These conclusions can be seen in Figure 3.
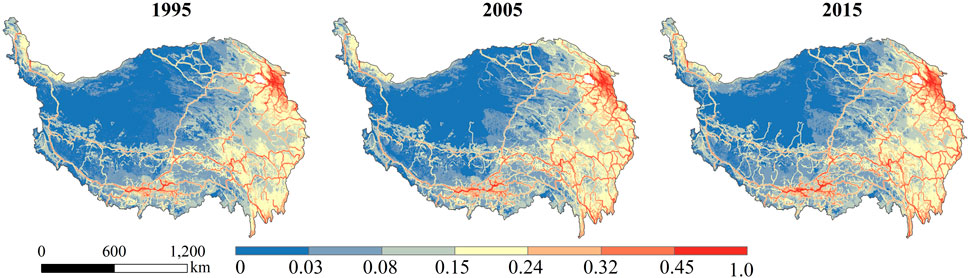
FIGURE 4. Spatial distribution of total human activity intensity in 1995, 2005, and 2015 on the Qinghai–Tibet Plateau.
In terms of the spatial patterns of the HAI, the largest value was mainly located around the city of Xining, followed by Lhasa (city locations can be seen in Figure 1). Overall, the eastern and southeastern QTP had high HAI values for all 3 years studied. In the central part of the QTP, the extent of human activities was mainly concentrated in the QTH/QTR and other transportation corridors. In the western QTP, the HAI value was low. The main reason for this was that the region is one of the least populated regions of China due to high altitude, thin air, and permafrost. Relatively wilder areas existed on the Hoh Xil and Changtang Plateau, which were once known as “no-man's land” (Figure 1).
From 1995 to 2015, the mean value of the HAI increased by 15.35%. Grids with an increased HAI value accounted for 40.64% of the total grids, while grids with decreased HAI values accounted for 10.09%. The increased HAI regions were mostly located in the eastern and southern QTP. The detailed reasons for the increase in HAI can be obtained from Table 3. During the study period, roads and railways had the largest growth rate (28.6%); followed by population density with a growth rate of 11.1%; the smallest change was the land use, and its value remained basically stable from 1995 to 2015. No obvious HAI changes were detected in the mid-western QTP. The changes in the above data illustrated the development trend of human activities in the different areas of the QTP, and the new human footprint map can well illustrate these characteristics.
The spatial overlay of the frozen ground map and HAI map (Figure 5) showed that the permafrost region generally occurs in the hinterland and northwest of the QTP with an average altitude of more than 4,000 m. Its distribution corresponds well with the low-value regions of the HAI, except for the G219 and G109 highways and the surrounding areas. The HAI statistical results under the different thaw settlement hazard levels in the permafrost regions showed higher value of 0.09 in medium-hazard areas, while the HAIs of low-hazard areas and high-hazard areas were 0.06 and 0.03, respectively (Table 4). In contrast, seasonally frozen ground regions had relatively large HAIs, and their mean values were more than twice that of the permafrost area.
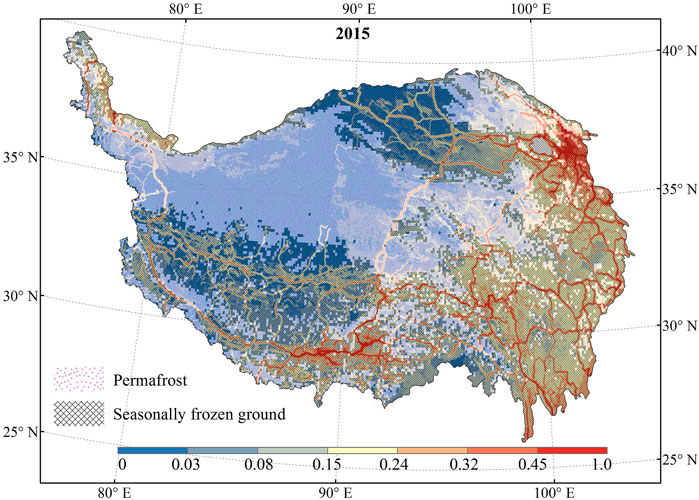
FIGURE 5. Human activity intensity within the frozen ground in 2015.
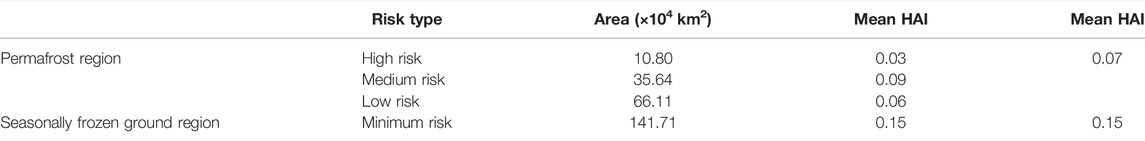
TABLE 4. Mean human activity intensity (HAI) in different thaw settlement risk regions of frozen ground in 2015.
According to Figure 6, the mean value of the HAI in seasonally frozen ground areas was not only the highest but also the most dispersed. This indicated that the overall level of development in the region was relatively high but unevenly distributed. The main reason for this is that the region has favorable natural conditions and is suitable for human habitation, working, grazing, and farming compared with other parts of the QTP (Li et al., 2018). In the different thaw settlement hazard levels of the permafrost, the HAI in the high-hazard areas was the lowest, while that of the medium-hazard areas was the highest, which was mainly because most sections of the roads and railways pass through the medium-hazard areas. Overall, the HAI in the seasonally frozen ground areas was higher; however, this region only experienced periodic seasonal thaw settlement, and the hazard was relatively lower. For the permafrost areas, although the HAI value was relatively low, the roads and railways were more affected because they were more sensitive to permafrost thawing.
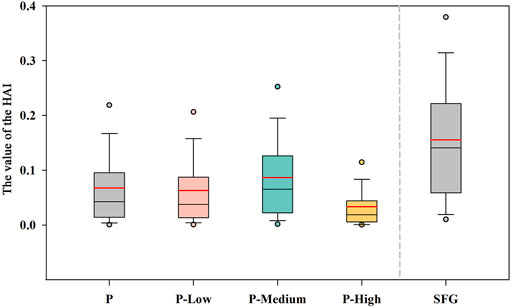
FIGURE 6. The boxplots depict the human activity intensity (HAI) under different thawing hazard levels in the frozen ground of the Qinghai–Tibet Plateau. The gray boxes represent the HAI statistics of the permafrost (P) and seasonally frozen ground (SFG) regions, the colored boxes represent the HAI statistics under different thawing hazard in the permafrost regions, and the red line shows the average.
The map (Figure 7) of the thawing disaster warning index of the frozen ground of the QTP integrates two kinds of information: the location information related to the thawing hazard of the frozen ground and the intensity information related to human activities. We can see that the warning index in the eastern part of the QTP was obviously higher than that in the western part. The warning areas in the permafrost region were mainly distributed in the Qilian Mountains, the G219 section in the northwest, and the G109 section from Xidatan to Tanggula in the central part. Among these three typical areas, the warning indices varied between different road sections, but the main levels were high risk and warning area. In addition, the Qilian Mountains had a high or warning risk level due to the higher grazing density and road density (Figure 3). It should be noted that the previous study on thawing risk by Ni et al. (2021) was aimed at permafrost regions, so this study focused on those regions. Moreover, the warning map considered seasonally frozen ground regions due to the high intensity of human activity in these regions. However, the accuracy of the warning index in seasonally frozen ground regions needs to be further verified.
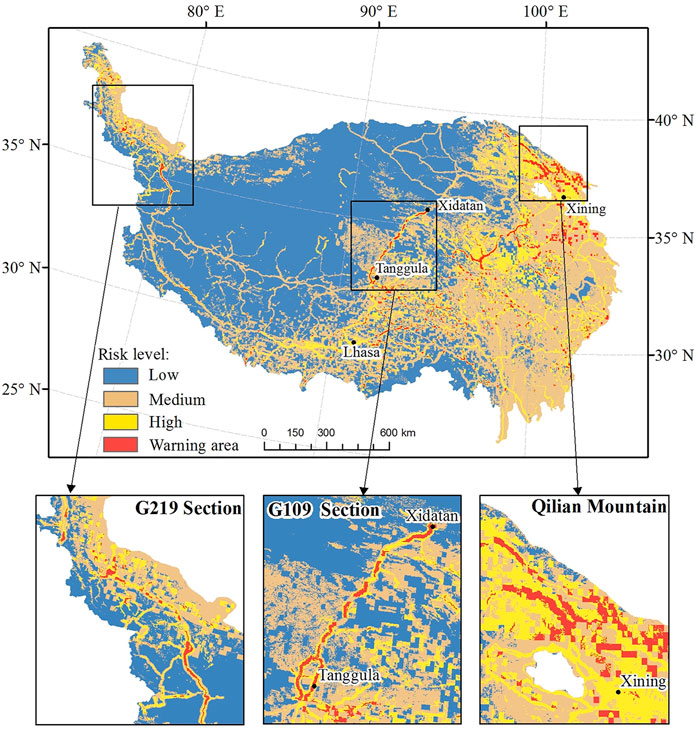
FIGURE 7. The thawing disaster warning map of the frozen ground of the QTP.
To ensure the accuracy of our results, we compared our results of the HAI map of the QTP to those of previous studies, including the global human footprint (HF, 2009; Venter et al., 2016b) and the human influence intensity (HII, 2010; Li et al., 2018) maps of the QTP. Since these two results were cumulative HAI measures, normalization was undertaken before comparison. The results revealed that the distribution patterns of the three maps were basically consistent, with high values in the eastern QTP and low values in the western QTP (Figure 8).
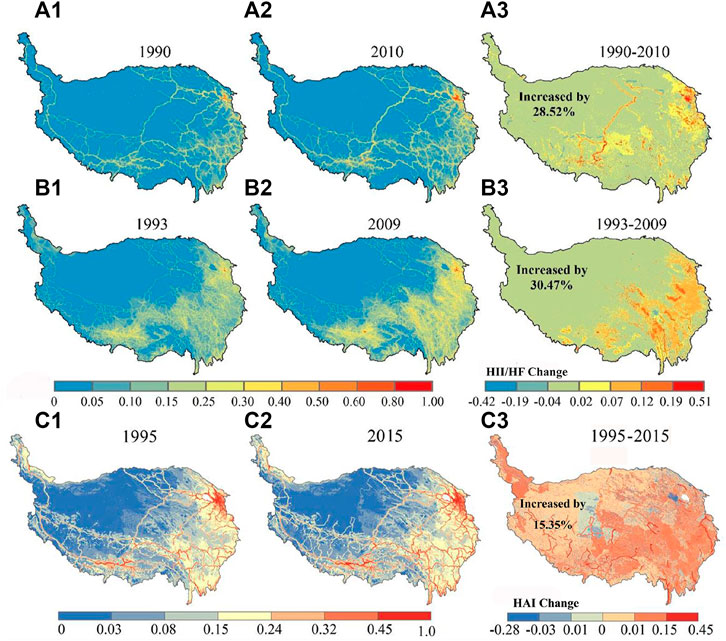
FIGURE 8. Comparison of the human activity intensity results of different studies on the QTP. (A) The results of the global human footprint on the QTP (HF, 2009; Venter et al., 2016b); (B) the results of the human influence intensity (HII, 2010; Li et al., 2018); (C) the results of the HAI map in this study.
However, there were still some region-specific differences among the three results. In terms of our results, the mean HAI on the QTP increased by 15.35% in 1995–2015, while the corresponding increases in the HF and HII on the QTP were 30.47% and 28.52% in the 1990s to 2010s, respectively. The main reasons for these differences were the following factors: 1) The results of previous studies were a direct summation of individual layers of human activities. We comprehensively analyzed the impact of different human activity factors on the QTP and ultimately used the AHP model to assign weights to each layer, which inevitably led to different results. 2) There was a gap between the research periods. In our study, the human activity variables we considered were updated at different time scales. 3) The pasture, road, and railway data in the previous studies were static and could not reflect the dynamic information well. However, in our study, all the datasets were dynamic, which was more likely to reflect changes in human activity over time. 4) For the grazing intensity data, our study used the cattle and sheep density. Based on the statistical yearbook, we found that the grazing intensity on the QTP increased slowly (with an annual change rate of 0.45%) from 1995 to 2015. However, the 2010 HII dataset used the county-scale statistical data to represent pixel-scale data, and the 2009 HF dataset used the percentage of the pasture area in the unit pixel to represent the grazing intensity. In fact, the grazing intensity in the 2009 HF dataset was not a good representation of the grazing density, which may have led to a large bias in the results.
Accurate understanding of the spatial distribution of human activities and their changes over time is the first step to protecting human beings from natural threats. The above comparison showed that our methodology and results were reliable. This approach can be applied in other case studies as long as their characteristics are considered at a regional scale that is consistent with previous studies (Li et al., 2018).
(1) The implications of thawing disaster warning map
In a previous study, the high-hazard areas of thawing frozen ground were mainly distributed in the northwest and central parts of the QTP (Supplementary Figure S1) and were mainly affected by the distribution pattern of the ground ice content, ground temperature levels, and changes in the active layer thickness (Ni et al., 2021). However, these areas generally had low HAI values, and the potentially high-hazard areas would not cause much trouble for human activities. Therefore, the potential thaw settlement hazard map still has certain limitations for actual risk management. In this study, the thawing disaster warning map can shield high-hazard areas of thawing frozen ground without human activities and can provide a more accurate early warning. The analysis of the four individual HAI maps, combined with the thawing of frozen ground, can provide important decision support for different departments. The results from Result section showed that permafrost thawing had the greatest impact on roads and railways. Hence, early warning is needed to take effective measures, such as air-cooled ripraps, rubble slopes, ventilated pipes, and thermosyphons, to reduce economic losses (Wu and Niu, 2013).
(2) The new discovery of human activity intensity data
The updated HAI map in this study more clearly showed the location information and activity intensity. It helps to track economic development and provides more useful information for science-based protection of human activities. This study also found a series of additional uses for the HAI dataset. It can serve as an important input for ecosystem models to assess human-induced losses of ecosystem services. In addition, it can be used as a proxy for human disturbance, species extinction risk and distribution analyses, and conservation science and decision-making, among others (Venter et al., 2016a). In fact, one of the interesting uses of the HAI map may be to identify places where sensitive species thrive despite high levels of human activities and determine which human behaviors permit coexistence. The HAI map provides an important foundation for understanding conservation work at regional and global scales.
In summary, climate warming will aggravate the occurrence of thawing settlement hazards in the frozen ground regions of the QTP, which would cause detrimental effects on human activities. Research on the impacts of frozen ground degradation on human activities is a topic worthy of consideration. Collaboration among permafrost scientists, hazard specialists, and policy experts is critical for a timely and effective response to the problems associated with a thawing frozen ground. As a preliminary research, this study only considered the thawing hazard of the frozen ground brought by the slow warming of the climate and did not consider some disaster incidents. The sudden thawing of permafrost and the outburst of lakes will pose a huge threat to human activities, although they may not be common and may rarely occur (Lu et al., 2020). The results provide basic data for the study of the impact of thawing frozen ground on human activities. However, the relationship between humans and nature is mutually reinforcing. While developing the economy, humans have also caused damage to the natural environment, which has exacerbated the thawing risk of frozen ground. Nevertheless, the consequences of long-term impacts of human activities on any particular location are complex, positive or negative, benign or catastrophic, depending on the history of the location, the current type of impacts, and our willingness to shoulder responsibility for our stewardship (Sanderson, et al., 2002; Redford and Richter, 1999).
There are some uncertainties in the results that need to be understood to improve HAI assessments in the QTP in future studies. First, poor data availability on the QTP is the main reason for the limited reliability of the results. For example, the road vector data for 1995 was not available, so we had no choice but to use the data from 2000 as an alternative. For some rural roads, due to the limitation of the dataset, there are still some missing data. The grazing intensity data for 1995, 2005, and 2015 were also unavailable. In this study, these data were interpolated using data from 2010, but the impacts of subsequent policy interventions were not considered. Due to the implementation of ecological restoration projects (e.g., the Grain for Green Project and the Grazing Withdrawal Program) and the establishment of nature reserves (Fang, 2013; Ren et al., 2016; Zhang et al., 2018), grazing intensity has changed locally. To some extent, the above factors may have weakened the reliability of the results at the local scale.
In addition, we did not account for all human activity data, including wind power stations, transmission lines, and gas/oil pipelines. In general, this type of infrastructure is always distributed on the periphery of the roads. To make the results more realistic, we added a buffer analysis to the road and set the maximum distance to 7 km for a conservative estimation (in Data section). Meanwhile, traffic volumes can also represent different intensities of human activity, but the unavailability of these data forced us to omit this indicator, which may lead to a conservative assessment of activity intensity. Therefore, the QTP may have a greater HAI than we have demonstrated. More human activity datasets need to be considered in future works. Additionally, with the development of new technologies such as big data, mobile internet, and crowdsourcing platforms, data acquisition means will be effectively increased. Compared with the traditional GIS (Geographic Information System)-based mapping method, these approaches have obvious advantages.
Third, the weight assignment method also requires refinement. The semiquantitative method based on the AHP is subjective, and more accurate evaluation models need to be used in the future. In addition, more evidence shows that a reasonable allocation of activity intensity within a local scale would improve the accuracy of the results (Li et al., 2018). We treated the land surface as a blank slate, but we know that is not the case in reality. The overlay of multiple layers and the omission of some intensity data result in the same HAI region not representing the same degree of importance. Therefore, we suggest that the HAI in different areas should be interpreted with caution. In general, although the abovementioned factors may affect the accuracy of the assessment, the basic pattern of HAI will not change, and our results are representative in the current study.
In this study, four categories of HAI data were selected as key indicators in a HAI map for 1995, 2005, and 2015. The dataset provided a cumulative measure of HAI with a resolution of 1 km on the QTP. We also analyzed the HAI in the thaw settlement hazard area of frozen ground and discussed the impacts of thawing settlement of frozen ground on human activities.
The results showed that except for in Lhasa and Xining, the mean values of the HAI in the QTP were very low for 1995, 2005, and 2015, which were 0.10, 0.11, and 0.12, respectively. In total, the HAI in the eastern QTP was higher than that in the west, which means that more suitable natural conditions facilitated more human activities. Moreover, during the period from 1995 to 2015, the intensity and extent of human activities increased by 15.35% and 40.64%, respectively.
The seasonally frozen ground region of the QTP had the highest HAI, and the value was twice that of the permafrost region. In the permafrost regions, the HAI in medium-risk areas was the highest (0.09), which mainly had a great impact on linear infrastructures such as roads and railways. The newly established thawing disaster warning map can effectively shield the high thaw settlement hazard areas without human activities, for more accurate warnings.
The raw data supporting the conclusion of this article will be made available by the authors, without undue reservation.
TW and XW designed the study. JN led the manuscript writing. XZ, GH, RL, and JC contributed to data analysis. YD and DZ produced the figures.
This work was financially supported by the National Natural Science Foundations of China (41771076, 41690142, and 42001072), the CAS “Light of West China” Program, and the State Key Laboratory of Cryospheric Science (SKLCS-OP-2021-04). The logistical support from the Cryosphere Research Station on the Qinghai–Tibet Plateau are especially appreciated.
The authors declare that the research was conducted in the absence of any commercial or financial relationships that could be construed as a potential conflict of interest.
All claims expressed in this article are solely those of the authors and do not necessarily represent those of their affiliated organizations, or those of the publisher, the editors and the reviewers. Any product that may be evaluated in this article, or claim that may be made by its manufacturer, is not guaranteed or endorsed by the publisher.
The Supplementary Material for this article can be found online at: https://www.frontiersin.org/articles/10.3389/feart.2022.845873/full#supplementary-material
Ayram, C. A., Mendoza, M. E., Etter, A., and Pérez Salicrup, D. R. (2017). Anthropogenic Impact on Habitat Connectivity: A Multidimensional Human Footprint index Evaluated in a Highly Biodiverse Landscape of Mexico. Ecol. Indicators 72, 895–909. doi:10.1016/j.ecolind.2016.09.007
Center for International Earth Science Information Network Columbia University, and Information Technology Outreach Services University of Georgia, (2013). Global Roads Open Access Data Set, Version 1 (gROADSv1). Palisades, NY: NASA Socioeconomic Data and Applications Center SEDAC. doi:10.7927/H4VD6WCT
Chen, J., Wu, T., Zou, D., Liu, L., Wu, X., Gong, W., et al. (2022). Magnitudes and Patterns of Large-Scale Permafrost Ground Deformation Revealed by Sentinel-1 InSAR on the central Qinghai-Tibet Plateau. Remote Sensing Environ. 268, 112778. doi:10.1016/j.rse.2021.112778
Duan, Q., and Luo, L. (2020). A Dataset of Human Footprint over the Qinghai-Tibet Plateau during 1990–2015. Chin. Sci. Data 5 (3), 303–321. doi:10.11922/csdata.2019.0082.zh
Ellis, E. C., and Ramankutty, N. (2008). Putting People in the Map: Anthropogenic Biomes of the World. Front. Ecol. Environ. 6 (8), 439–447. doi:10.1890/070062
Etter, A., Mcalpine, C. A., Seabrook, L., and Wilson, K. A. (2011). Incorporating Temporality and Biophysical Vulnerability to Quantify the Human Spatial Footprint on Ecosystems. Biol. Conservation 144 (5), 1585–1594. doi:10.1016/j.biocon.2011.02.004
Fang, Y. (2013). Managing the Three-Rivers Headwater Region, China: From Ecological Engineering to Social Engineering. Ambio 42 (5), 566–576. doi:10.1007/s13280-012-0366-2
Fang, Y., Qin, D., and Ding, Y. (2011b). Frozen Soil Change and Adaptation of Animal Husbandry: a Case of the Source Regions of Yangtze and Yellow Rivers. Environ. Sci. Pol. 14 (5), 555–568. doi:10.1016/j.envsci.2011.03.012
Fang, Y., Qin, D., Ding, Y., Yang, J., and Xu, K. (2011a). The Impacts of Permafrost Change on NPP and Implications: A Case of the Source egions of Yangtze and Yellow Rivers. J. Mt. Sci. 8, 437–447. doi:10.1007/s11629-011-1004-3
He, R., and Jin, H. (2010). Permafrost and Cold-Region Environmental Problems of the Oil Product Pipeline from Golmud to Lhasa on the Qinghai-Tibet Plateau and Their Mitigation. Cold Regions Sci. Techn. 64 (3), 279–288. doi:10.1016/j.coldregions.2010.01.003
Hjort, J., Karjalainen, O., Aalto, J., Westermann, S., Romanovsky, V. E., Nelson, F. E., et al. (2018). Degrading Permafrost Puts Arctic Infrastructure at Risk by Mid-century. Nat. Commun. 9 (1), 1–9. doi:10.1038/s41467-018-07557-4
Jenks, G. F. (19671967). The Data Model Concept in Statistical Mapping. Int. Yearb. Cartography 7, 186–190.
Karjalainen, O., Aalto, J., Luoto, M., Westermann, S., Romanovsky, V. E., Nelson, F. E., et al. (2019). Circumpolar Permafrost Maps and Geohazard Indices for Near-Future Infrastructure Risk Assessments. Sci. Data 6 (1), 190037. doi:10.1038/sdata.2019.37
Li, R., Wu, Q., Li, X., Sheng, Y., Hu, G., Cheng, G., et al. (2019). Characteristic, Changes and Impacts of Permafrost on Qinghai-Tibet Plateau. Chin. Sci. Bull. 64 (27), 2783–2795. (in Chinese). doi:10.1360/TB-2019-0191
Li, S., Zhang, Y., Wang, Z., and Li, L. (2018). Mapping Human Influence Intensity in the Tibetan Plateau for Conservation of Ecological Service Functions. Ecosystem Serv. 30, 276–286. doi:10.1016/j.ecoser.2017.10.003
Lin, Y., Hong, M., Han, G., Zhao, M., Bai, Y., and Chang, S. X. (2010). Grazing Intensity Affected Spatial Patterns of Vegetation and Soil Fertility in a Desert Steppe. Agric. Ecosyst. Environ. 138 (4), 282–292. doi:10.1016/j.agee.2010.05.013
Lu, P., Han, J., Li, Z., Xu, R., Li, R., Hao, T., et al. (2020). Lake Outburst Accelerated Permafrost Degradation on Qinghai-Tibet Plateau. Remote Sensing Environ. 249, 112011. doi:10.1016/j.rse.2020.112011
Ni, J., Wu, T., Zhu, X., Hu, G., Zou, D., Wu, X., et al. (2021). Simulation of the Present and Future Projection of Permafrost on the Qinghai‐Tibet Plateau with Statistical and Machine Learning Models. Geophys. Res. Atmos. 126, e2020JD033402. doi:10.1029/2020JD033402
Ni, J., Wu, T., Zhu, X., Wu, X., Pang, Q., Zou, D., et al. (2021). Risk Assessment of Potential Thaw Settlement hazard in the Permafrost Regions of Qinghai-Tibet Plateau. Sci. Total Environ. 776, 145855. doi:10.1016/j.scitotenv.2021.145855
Niu, F., Lin, Z., Liu, H., and Lu, J. (2011). Characteristics of Thermokarst Lakes and Their Influence on Permafrost in Qinghai-Tibet Plateau. Geomorphology 132 (3), 222–233. doi:10.1016/j.geomorph.2011.05.011
Niu, F., Lin, Z., Lu, J., and Wang, H. N. (2015). Assessment of Terrain Susceptibility to Thermokarst lake Development along the Qinghai–Tibet Engineering Corridor, China. Environ. Earth Sci. 73, 5631. doi:10.1007/s12665-014-3818-0
Obu, J., Westermann, S., Bartsch, A., Berdnikov, N., Christiansen, H. H., Dashtseren, A., et al. (2019). Northern Hemisphere Permafrost Map Based on TTOP Modelling for 2000-2016 at 1 Km2 Scale. Earth-Science Rev. 193, 299–316. doi:10.1016/j.earscirev.2019.04.023
O'Neill, H. B., Burn, C. R., Allard, M., Arenson, L. U., Bunn, M. I., Connon, R. F., et al. (2020). Permafrost Thaw and Northern Development. Nat. Clim. Chang. 10, 722–723. doi:10.1038/s41558-020-0862-5
Otto, C. R. V., Roth, C. L., Carlson, B. L., and Smart, M. D. (2016). Land-use Change Reduces Habitat Suitability for Supporting Managed Honey Bee Colonies in the Northern Great Plains. Proc. Natl. Acad. Sci. USA 113 (37), 10430–10435. doi:10.1073/pnas.1603481113
Ouyang, Z., Zheng, H., Xiao, Y., Polasky, S., Liu, J., Xu, W., et al. (2016). Improvements in Ecosystem Services from Investments in Natural Capital. Science 352 (6292), 1455–1459. doi:10.1126/science.aaf2295
Qin, D., Ding, Y., Xiao, C., Kang, S., Ren, J., Yang, J., et al. (2018). Cryospheric Science: Research Framework and Disciplinary System. Natl. Sci. Rev. 5 (02), 255–268. doi:10.1093/nsr/nwx108
Qin, Y., Wu, T., Zhao, L., Wu, X. D., Li, R., Xie, C. W., et al. (2017). Numerical Modeling of the Active Layer Thickness and Permafrost thermal State across Qinghai‐Tibetan Plateau. J. Geophys. Res. Atmos. 122 (21), 11604–11620. doi:10.1002/2017jd026858
Qin, Y., Zhang, P., Liu, W., Guo, Z., and Xue, S. (2020). The Application of Elevation Corrected MERRA2 Reanalysis Ground Surface Temperature in a Permafrost Model on the Qinghai-Tibet Plateau. Cold Regions Sci. Techn. 175, 103067. doi:10.1016/j.coldregions.2020.103067
Redford, K. H., and Richter, B. D. (1999). Conservation of Biodiversity in a World of Use. Conservation Biol. 13 (6), 1246–1256. doi:10.1046/j.1523-1739.1999.97463.x
Ren, Y., Lü, Y., and Fu, B. (2016). Quantifying the Impacts of Grassland Restoration on Biodiversity and Ecosystem Services in China: A Meta-Analysis. Ecol. Eng. 95, 542–550. doi:10.1016/j.ecoleng.2016.06.082
Saaty, T. L., and Kearns, K. P. (1985). Systems Characteristics and the Analytic Hierarchy Process. Anal. Plann., 63–86. doi:10.1016/B978-0-08-032599-6.50008-810.1016/b978-0-08-032599-6.50009-x
Sanderson, E. W., Jaiteh, M., Levy, M. A., Redford, K. H., Wannebo, A. V., and Woolmer, G. (2002). The Human Footprint and the Last of the Wild. BioScience 52 (10), 891–904. doi:10.1641/0006-3568(2002)052[0891:thfatl]2.0.co;2
Teufel, B., and Sushama, L. (2019). Abrupt Changes across the Arctic Permafrost Region Endanger Northern Development. Nat. Clim. Chang. 9 (11), 858–862. doi:10.1038/s41558-019-0614-6
Trombulak, S. C., and Frissell, C. A. (2000). Review of Ecological Effects of Roads on Terrestrial and Aquatic Communities. Conservation Biol. 14 (1), 18–30. doi:10.1046/j.1523-1739.2000.99084.x
Venter, O., Sanderson, E. W., Magrach, A., Allan, J. R., Beher, J., Jones, K. R., et al. (2016a). Global Terrestrial Human Footprint Maps for 1993 and 2009. Sci. Data 3, 160067. doi:10.1038/sdata.2016.67
Venter, O., Sanderson, E. W., Magrach, A., Allan, J. R., Beher, J., Jones, K. R., et al. (2016b). Sixteen Years of Change in the Global Terrestrial Human Footprint and Implications for Biodiversity Conservation. Nat. Commun. 7 (1), 1–11. doi:10.1038/ncomms12558
Wang, S., Yu, Q. H., Guo, L., You, Y. H., Wang, S. J., and Yu, Y. (2014). Prevention and Control of Freezing and Thawing Disasters in Electric Transmission Lines Constructed in Permafrost Regions. J. Glaciology Geocryology 36 (01), 137–143. doi:10.7522/j.issn.1000-0240.2014.0017
Wang, W., Wu, T., Zhao, L., Li, R., Zhu, X., Wang, W., et al. (2018). Exploring the Ground Ice Recharge Near Permafrost Table on the central Qinghai-Tibet Plateau Using Chemical and Isotopic Data. J. Hydrol. 560, 220–229. doi:10.1016/j.jhydrol.2018.03.032
Wei, Z., Du, Z., Wang, L., Lin, J., Feng, Y., Xu, Q., et al. (2021). Sentinel‐Based Inventory of Thermokarst Lakes and Ponds across Permafrost Landscapes on the Qinghai‐Tibet Plateau. Earth Space Sci. 8 (11), e2021EA001950. doi:10.1029/2021EA001950
Wu, Q., and Niu, F. (2013). Permafrost Changes and Engineering Stability in Qinghai-Xizang Plateau. Chin. Sci. Bull. 58 (02), 1079–1094. (in Chinese). doi:10.1007/s11434-012-5587-z
Wu, Q., Zhang, T., and Liu, Y. (2012). Thermal State of the Active Layer and Permafrost along the Qinghai-Xizang (Tibet) Railway from 2006 to 2010. The Cryosphere 6 (3), 607–612. doi:10.5194/tc-6-607-2012
Xu, T., Zhao, X., Zhang, X., Wang, X., Geng, Q. Y., Hu, L. Y., et al. (2020). Sustainable Development of Ecological Grass-Based Livestock Husbandry in Qinghai-Tibet Plateau Alpine Area: Principle, Technology and Practice. Acta Ecol. Sin. 40 (18), 6324–6337. doi:10.5846/stxb201912142705
Xu, X. L. (2017). A Dataset of Population Spatial Distribution of the People's Republic of China. Beijing: Data Center for Resources and Environmental Sciences, Chinese Academy of Sciences.
Yao, T., Qin, D., Shen, Y., Zhao, L., Wang, N., and Lu, A. (2013). Cryospheric Changes and Their Impacts on Regional Water Cycle and Ecological Conditions in the Qinghai-Tibetan Plateau. Chin. J. Nat. 35 (03), 179–186. (in Chinese). doi:10.3969/j.issn.0253-9608.2013.03.004
Zhang, H., Fan, J., Cao, W., Zhong, H., Harris, W., Gong, G., et al. (2018). Changes in Multiple Ecosystem Services between 2000 and 2013 and Their Driving Factors in the Grazing Withdrawal Program, China. Ecol. Eng. 116, 67–79. doi:10.1016/j.ecoleng.2018.02.028
Zhang, X. R., Zhou, J., and Li, M. M. (2020). Analysis on Spatial and Temporal Changes of Regional Habitat Quality Based on the Spatial Pattern Reconstruction of Land Use. Acta Geographica Sinica 75 (01), 160–178. (in Chinese). doi:10.11821/dlxb202001012
Zhang, Z., and Wu, Q. (2012). Thermal Hazards Zonation and Permafrost Change over the Qinghai-Tibet Plateau. Nat. Hazards 61 (2), 403–423. doi:10.1007/s11069-011-9923-4
Zhao, G., Liu, J., Kuang, W., Ouyang, Z., and Xie, Z. (2015). Disturbance Impacts of Land Use Change on Biodiversity Conservation Priority Areas across China: 1990-2010. J. Geogr. Sci. 25, 515–529. doi:10.1007/s11442-015-1184-9
Zhao Wanglin, 赵., Luo Tianxiang, 罗., and Zhang Lin, 张. (2019). Relative Impact of Climate Change and Grazing on NDVI Variations in Typical alpine Desert Grasslands in Tibet. Acta Eco Sin 39 (22), 8494–8503. (in Chinese). doi:10.5846/stxb201811192509
Keywords: frozen ground, human activity intensity, climate warming, thaw-induced hazard, Qinghai–Tibet plateau
Citation: Ni J, Wu T, Zhu X, Chen J, Wu X, Hu G, Zou D, Li R and Du Y (2022) Quantifying the Relationship Between Human Activities Intensity and Thawing Hazards of the Frozen Ground on the Qinghai–Tibet Plateau. Front. Earth Sci. 10:845873. doi: 10.3389/feart.2022.845873
Received: 30 December 2021; Accepted: 21 February 2022;
Published: 08 April 2022.
Edited by:
Guo Donglin, Institute of Atmospheric Physics (CAS), ChinaCopyright © 2022 Ni, Wu, Zhu, Chen, Wu, Hu, Zou, Li and Du. This is an open-access article distributed under the terms of the Creative Commons Attribution License (CC BY). The use, distribution or reproduction in other forums is permitted, provided the original author(s) and the copyright owner(s) are credited and that the original publication in this journal is cited, in accordance with accepted academic practice. No use, distribution or reproduction is permitted which does not comply with these terms.
*Correspondence: Tonghua Wu, dGh1YXd1QGx6Yi5hYy5jbg==
Disclaimer: All claims expressed in this article are solely those of the authors and do not necessarily represent those of their affiliated organizations, or those of the publisher, the editors and the reviewers. Any product that may be evaluated in this article or claim that may be made by its manufacturer is not guaranteed or endorsed by the publisher.
Research integrity at Frontiers
Learn more about the work of our research integrity team to safeguard the quality of each article we publish.