 Ningyuan Zhang
 Suping Yao
 Yuhui Wang
- Key Laboratory of Surficial Geochemistry, Ministry of Education, School of Earth Sciences and Engineering, Nanjing University, Nanjing, China
Tectonically deformed coals (TDCs) are of great importance to coalbed methane exploitation and coal mining safety. Compared to primary coals, reservoir properties of TDCs have been transformed greatly by tectonic stress. Here, the pore structure and mechanical properties of primary coal and brittle TDCs were obtained with atomic force microscopy and software. The results showed that tectonic stress generally promotes pore development and Young’s modulus of brittle TDCs. According to the variation in pore structure and Young’s modulus, two stages were identified: weak brittle deformation stage (primary coal–cataclastic coal–schistose coal–mortar coal) and strong brittle deformation stage (mortar coal–granulitic coal–flaky coal). The extent of tectonic impact varies greatly between these two stages. In weak brittle deformation stage, tectonic stress has little impact on coal pore structure. The mean pore number increases slowly, and the mean pore size decreases slowly. In this stage, half of the pore number increment is provided by macropores of 100–200 nm diameter. In strong brittle deformation stage, tectonic stress has a major impact on coal pore structure. The mean pore number increases quickly, and the mean pore size decreases quickly. Most of the pore number increment comes from mesopores of 10–50 nm diameter and macropores of 50–100 nm diameter. In addition, the Young’s modulus of primary coal and different brittle TDCs varies from 1.5 to 2.0 GPa. In weak brittle deformation stage, the Young’s modulus of different samples levels off. While in strong brittle deformation stage, the Young’s modulus increases gradually. Combined with former studies, it is inferred that tectonic stress can influence coal’s Young’s modulus by transforming its chemical structure.
1 Introduction
Coal is an organic-rich sedimentary rock formed by plant debris under high temperature and high pressure. During the coalification process, coalbeds can be crushed or even pulverized by tectonic stress, producing tectonically deformed coals (TDCs) (Frodsham and Gayer 1999; Cao et al., 2003; Jiang et al., 2010; Ren et al., 2021). Affected by tectonism, TDCs differ greatly from primary coals in reservoir properties, including permeability, pore structure, and mechanical properties (Li 2013; Zhu 2014). It has been found that TDCs are the major cause of coal and gas outbursts, and are closely related to the production of coalbed methane (CBM) (Cao et al., 2003; Zhang 2014; Yao 2017; Cheng and Pan 2020). Therefore, it is of great importance to deepen the understanding of TDCs reservoir properties, namely the nanopore structure and mechanical properties.
Commonly-used methods to characterize nanopores include scanning electron microscopy (SEM), transmission electron microscopy (TEM), X-ray computed tomography (CT), atomic force microscopy (AFM), high-pressure mercury injection (HPMI), low-temperature N2/CO2 adsorption (LTN2A/LTCO2A), synchrotron small-angle X-ray scattering (SAXS) and small-angle neutron scattering (SANS). Among these methods, AFM has gained more attention in recent years because of its convenience (Zhu 2014; Pan et al., 2015a; Wang et al., 2017; Jiao et al., 2018; Liu et al., 2019; Zhao et al., 2019; Li et al., 2020). As an image analysis method, AFM is not confined to two-dimensional imaging. It provides high-resolution three-dimensional imaging without damaging samples. Besides, AFM allows quantitative analysis through image-processing software (Liu et al., 2019). However, previous AFM studies targeted mainly on coals of different maturity. Few AFM studies have concerned the nanopore structure in different TDCs.
Coal’s mechanical properties is another major concern because it is critical in controlling the stabilization of coal and the formation and extension of hydraulic fractures (Li et al., 2020). Traditionally, uniaxial or triaxial rock mechanics experiments were carried out to obtain macromechanical parameters. As it is difficult to obtain core from TDC, the method of secondary forming is often used for the preparation of TDC core sample (Cheng and Pan 2020). However, the preparation of TDC sample destroys the original sample and cannot restore the field conditions. In addition, there is no standard experimental procedure to prepare TDC sample, causing the results from different laboratories to be not comparable (Cheng and Pan 2020). Nanoindentation techniques have also been used to characterize mechanical properties of coal and shale (Kumar et al., 2012; Meng et al., 2020; Sun et al., 2020). However, nanoindentation is a destructive technique that provides micron scale—rather than nanometer scale—resolution (Eliyahu et al., 2015). Currently, AFM offers a more advanced method—Peakforce Quantitative Nanomechanical Mapping (PeakForce QNM), to investigate mechanical properties of coal or shale.
In this study, AFM is used to explore the nanopore structure and mechanical properties of primary coal and different TDCs. First, three-dimensional images of coal samples were captured in ScanAsyst mode. Next, these AFM images were processed with Nanoscope Analysis and Gwyddion software (RRID:SCR_015583) to obtain nanopore parameters such as the pore number and pore size. Then, we used PeakForce QNM mode to obtain the mechanical properties of the samples. Finally, tectonic stress impact on the nanopore structure and mechanical properties were discussed, improving our understanding of TDCs reservoir properties and promoting safe mining.
2 Samples and Methods
2.1 Sample Preparation and Experiment Procedure
Various classification schemes of TDCs have been discussed in the long term (Li 2013; Yao 2017; Song et al., 2020b; Cheng and Pan 2020). Among them, the classification proposed by Ju et al. has been widely accepted (Song et al., 2013; Zhang 2014; Yu et al., 2017; Liu and Jiang 2019; Song et al., 2020a; Song et al., 2020b), where TDCs are classified into three series (brittle-, transitional-, ductile series) (Ju et al., 2004). Ju et al.’s classification scheme is also adopted here. Coal samples in this study were collected from Suxian mining area and Linhuan mining area, Huaibei coalfield, Anhui Province. The samples are primary coal and brittle TDCs. And the latter includes cataclastic coal, schistose coal, mortar coal, granulitic coal, and flaky coal. Coals’ vitrinite reflectance (Ro) values range from 0.93 to 1.22% (Table 1).
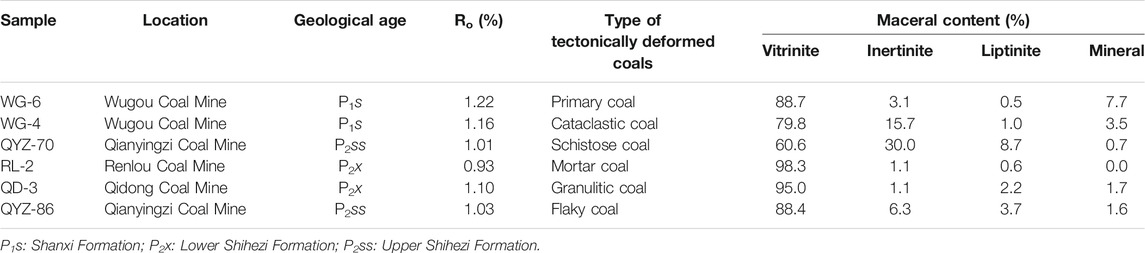
TABLE 1. General information of coal samples.
Macrographs and micrographs of coal samples are presented in Figure 1. For primary coal, its original structure is unaltered. The coal band is clear, with few fractures developed (Figures 1A,B). For cataclastic coal, the original structure is relatively intact with several fractures developed (Figures 1C,D). For schistose coal, the coal body is plate-like, and the stratification is stable (Figure 1E). Two sets of parallel fractures can be seen in the micrograph (Figure 1F). For mortar coal, the coal body is broken, and the coal band can hardly be identified (Figure 1G). Fractures are densely developed, and the coal matrix is cut into grains of different sizes (Figure 1H). For granulitic coal, the coal body is pulverized into small grains and powder by intensive fractures, and grains are of similar size compared to mortar coal (Figures 1I,J). For flaky coal, the coal body is broken and sheet-like (Figure 1K). Smooth friction surfaces are widely developed. Several long tortuous fractures can be identified in the micrograph (Figure 1L).
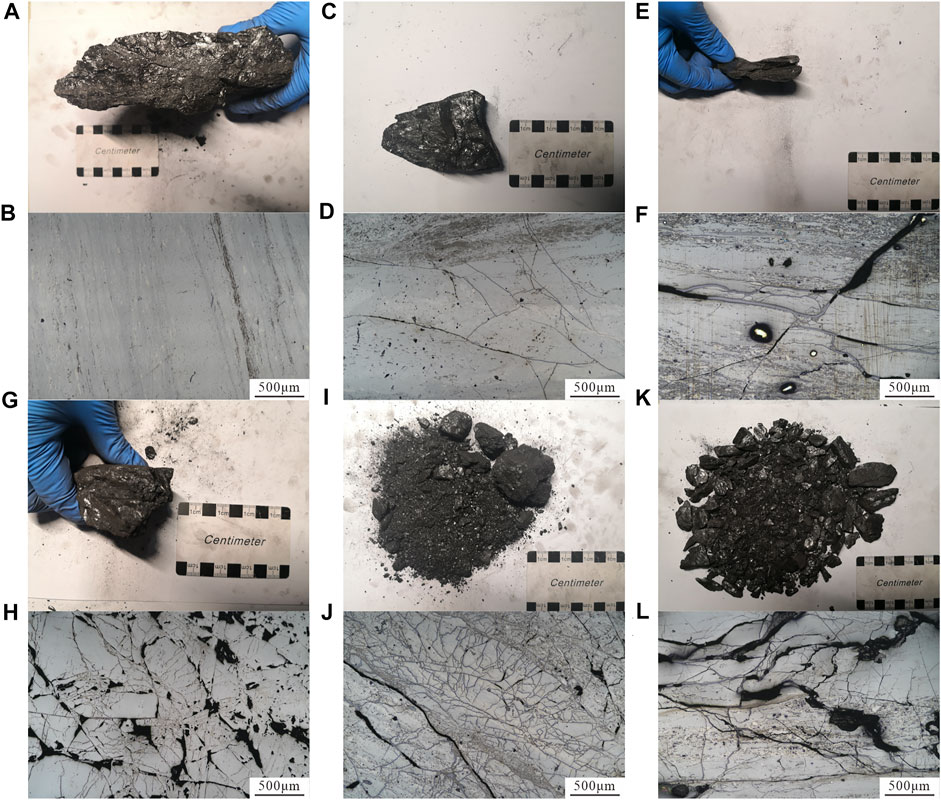
FIGURE 1. The micro- and macrodeformation characteristics of coal samples. (A)–(B) sample WG-6, primary coal; (C)–(D) sample WG-4, cataclastic coal; (E)–(F) sample QYZ-70, schistose coal; (G)–(H) sample RL-2, motar coal; (I)–(J) sample QD-3, granulitic coal; (K)–(L) sample QYZ-86, flaky coal; (A),(C),(E),(G),(I),(K) photos of hand specimens; (B),(D),(F),(H),(J),(L) photos obtained under the reflected light of the optical microscope, ×50.
Coal samples need to be polished to a smooth surface because AFM has high requirement for sample roughness. As the TDC can be easily broken in the sample-preparation process, the following procedures were taken: 1) Samples were glued with resin and cut into small pieces of several millimeters; 2) Glued coal pieces were inset into epoxy resin in molds; 3) Samples were polished with sandpapers of different particle size; 4) Argon ion polishing (Leica EM TIC 3X, 4 kV, 30 min) was conducted to produce a smooth surface.
The AFM instrument used in this study is the Multimode 8 AFM from the Bruke Company, Germany. The maximum scan range is 125 × 125 × 5 μm. The resolution is 0.1 nm in the lateral direction and 0.01 nm in the vertical direction. ScanAsyst mode was adopted to obtain microtopography images while PeakForce QNM mode was used to analyze the mechanical properties of samples. A scanning range of 5 × 5 μm is taken in both modes.
2.2 Quantitative Evaluation of Pores
Gwyddion is a modular, multiplatform, open-source software for scanning probe microscopy data processing (NeČas and Klapetek 2012), which is used to calculate pore parameters here. The “Grain Analysis” module was used to mark and quantify grains on the surface. Pore parameters calculation can be realized by clicking the “Invert Height” function to invert pores to grains (Jiao et al., 2018; Zhao et al., 2019). There are several grain-related algorithms in Gwyddion, and the watershed algorithm was chosen in this study. The basic theory of the watershed algorithm is as follows: 1) The virtual water drop was placed at each point of the inverted surface; 2) The water drop followed the steepest descent path to minimize its potential energy and reached a local minimum; 3) The first two steps were repeated several times, and a system of lakes of different sizes filling the inverted surface depressions was obtained; 4) Then, the position, area and volume of each of the lakes could be identified (Figure 2). Ten topography images were analyzed to produce average pore parameters for each sample.
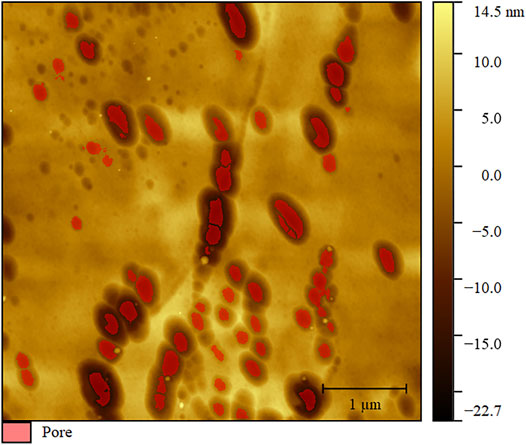
FIGURE 2. Pores marked by the watershed algorithm.
2.3 Quantitative Evaluation of Mechanical Properties
PeakForce QNM is an imaging mode that produces topography images and quantitative nanomechanical properties images at the same time. PeakForce QNM is based on force curves analysis. While the probe is scanning the sample surface, the deflection of the cantilever is measured to produce Force-Distance curves (Figure 3) (Li et al., 2017). These curves are then analyzed to obtain the properties of the sample (adhesion, modulus, deformation, and dissipation) (Bruker 2012). To obtain Young’s modulus, the retract curve is fit (the bold green line in Figure 3) using the Derjaguin–Muller–Toporov model (Bruker 2012):
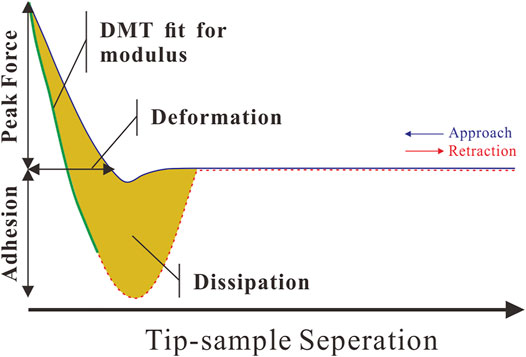
FIGURE 3. Force curves and information that can be obtained from them (Bruker 2012).
Ftip–Fadh is the force on the cantilever relative to the adhesion force, R is the tip end radius, and d–d0 is the deformation of the sample. The result of the fit is the reduced modulus E*. If the Poisson’s ratio is known, the software can use that information to calculate the Young’s modulus of the sample (Es). This is related to the sample modulus by the equation:
νt and Et are Poisson’s ratio and Young’s modulus of the tip, respectively. νs and Es are Poisson’s ratio and Young’s modulus of the sample, respectively. We assume that the tip modulus Et is infinite. Therefore, the Young’s modulus of the sample can be calculated using the sample’s Poisson’s ratio. Here, we chose a Poisson’s ratio of 0.3 for organic matter (OM) in coals.
In PeakForce QNM mode, choosing a suitable probe is crucial for accurate measurement. As the reported Young’s modulus of OM in coals is under 10 GPa in most literature (Li et al., 2020; Meng et al., 2020; Sun et al., 2020), RTESPA-525 probe was selected in this study because it is suitable for samples with modulus between 1 and 20 GPa (Figure 4A). Probe calibration was conducted using a sapphire standard and a highly-ordered pyrolytic graphite standard (HOPG, 18 GPa). After the calibration, coal samples were scanned at a resolution of 256 × 256 pixels at 0.977 Hz. Data analysis was carried out using the “Roughness” module in Nanoscope Analysis software (Figures 4C,D). Five modulus images were analyzed to obtain the average Young’s modulus for each sample.
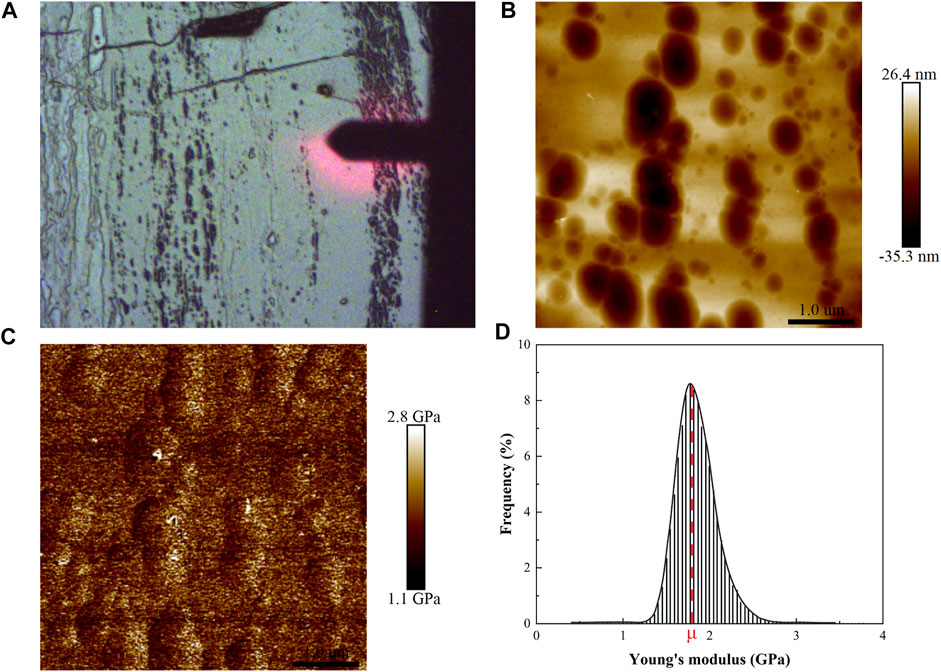
FIGURE 4. Microscope and AFM images in the same region of sample WG-6. (A) Scanning probe on the vitrinite; (B) AFM topography image; (C) AFM Young’s modulus image; (D) Histogram of Young’s modulus from the “Roughness” module.
3 Results
3.1 Nanopore Structure of Primary Coal and Brittle Tectonically Deformed Coals
Figure 5 shows typical topography images of primary coal and different brittle TDCs. For primary coal, pores are ellipse or circle. Most pores are macropores >200 nm in diameter. Pores are unevenly distributed on the surface (Figure 5A). For cataclastic coal, the pore number increases slightly compared to primary coal (Figure 5B). For schistose coal, the pore number increases to a higher extent and mesopores can be seen (Figure 5C). For mortar coal, pores are densely developed. Macropores and mesopores <100 nm in diameter begin to increase (Figure 5D). For granulitic coal, intensive pores are arranged on the surface. Most pores’ diameter are under 100 nm (Figure 5E). For flaky coal, small mesopores are highly developed with few macropores interspersed (Figure 5F). In summary, the pore number increases gradually, and the mean pore size decreases with enhancing tectonic deformation. From primary coal to schistose coal, this trend is relatively mild. The changes of pore number and pore size become much more obvious since mortar coal.
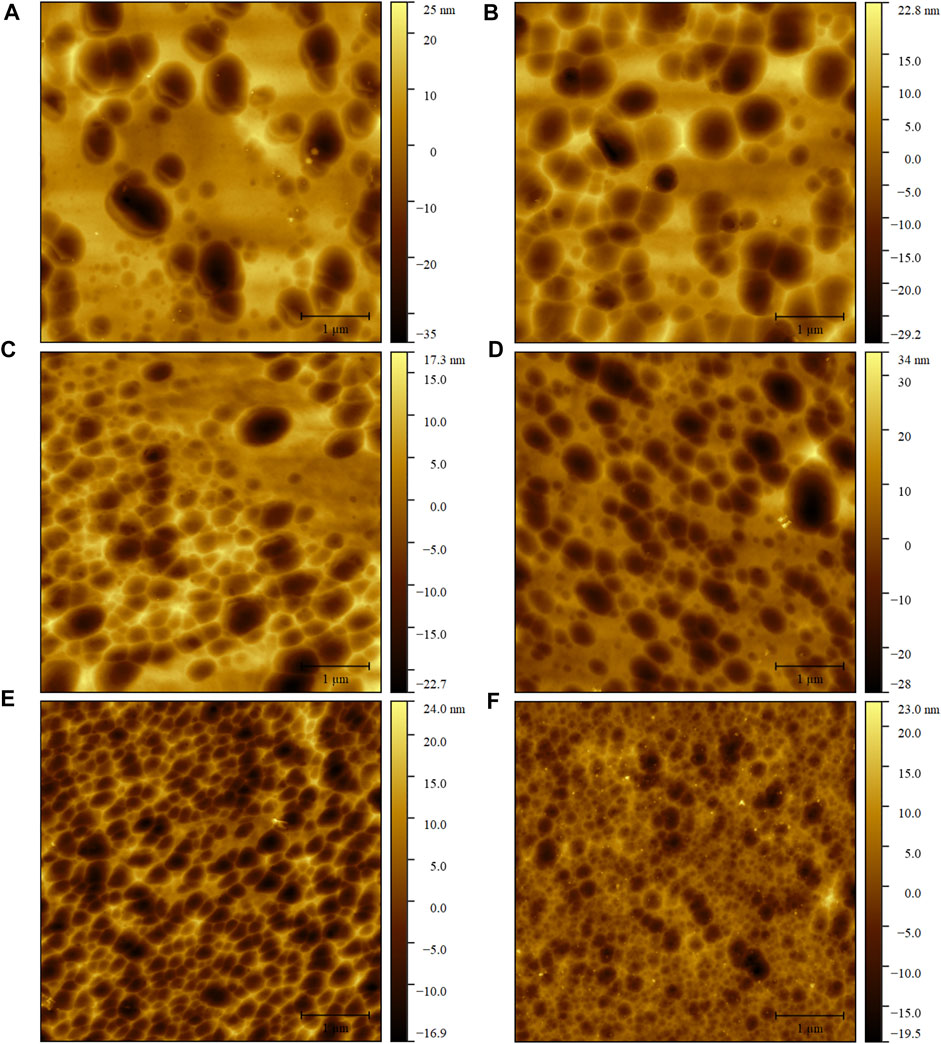
FIGURE 5. Typical AFM topography images of coal samples. (A) sample WG-6, primary coal; (B) sample WG-4, cataclastic coal; (C) sample QYZ-70, schistose coal; (D) sample RL-2, motar coal; (E) sample QD-3, granulitic coal; (F) sample QYZ-86, flaky coal; The scanning range is 5 × 5 μm and the scanning lines are 512 × 512 in all images.
Nanopore parameters, including mean pore number, mean pore size, mean pore area and plane porosity, are listed in Table 2. It should be noted that the pore size here is equivalent disc diameter—the diameter of the disc with the same projected area as the pore. The mean pore number per image of coal samples ranges from 86 to 685. The mean pore size varies from 68.8 to 131.4 nm. And the plane porosity varies from 8.13 to 17.06%. It is clear that the mean pore number increases and the mean pore size decreases as the tectonic deformation deepens.
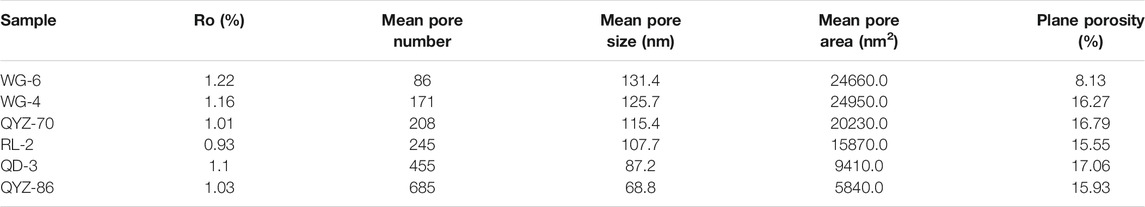
TABLE 2. Nanopore structural parameters of coal samples.
3.2 Mechanical Properties of Primary Coal and Brittle Tectonically Deformed Coals
The topography images and Young’s modulus images of sample WG-4, RL-2 and QYZ-86 are shown in Figure 6. It can be seen that the Young’s modulus of coal matrix and pores are actually the same, indicating that the mechanical properties of vitrinite is homogeneous. Most of the Young’s modulus histograms obey a normal distribution. As a result, the mean (μ) of the normal distribution can be used to represent the Young’s modulus value per image (Figure 4D). Different samples generally have a Young’s modulus of 1.5–2 GPa. And the sectional analyses show that the modulus mode is not strongly affected by milling ridges and other topographic features, so the overall effect of topography on modulus values is relatively minor (Figures 6C,F,L) (Eliyahu et al., 2015; Liu 2019).
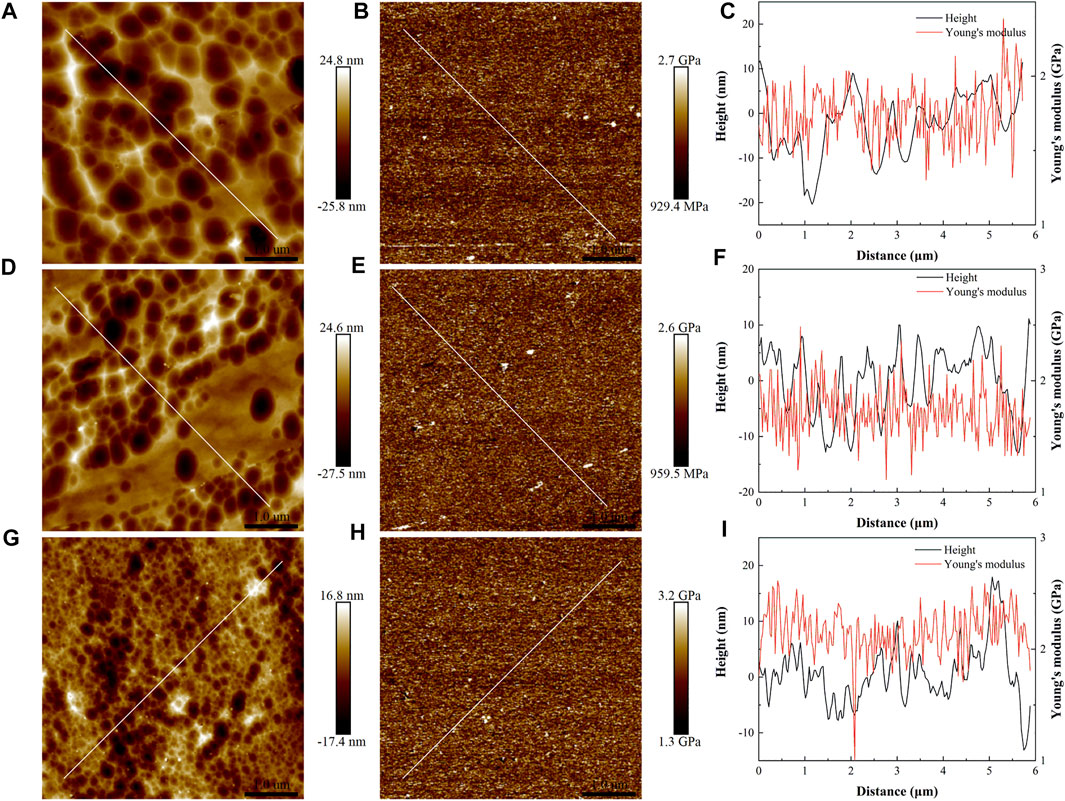
FIGURE 6. (A),(D),(G) Topography images of samples WG-4, RL-2 and QYZ-86, respectively; (B),(E),(H) Young’s modulus maps of samples WG-4, RL-2 and QYZ-86, respectively; (C),(F),(L) Sectional analyses along the white lines in topography images and Young’s modulus maps.
4 Discussion
4.1 The Impact of Tectonic Stress on Brittle Tectonically Deformed Coals’ Pore Structure
Figure 7 shows the variation in the mean pore number and mean pore size in primary coal and different brittle TDCs. From primary coal to flaky coal, the pore number increases while the pore size decreases. The line graph can be distinctly divided into two stages of different gradients. From primary coal to mortar coal is the first stage, while from mortar coal to flaky coal is the second stage. Here, we name these two stages weak brittle deformation stage (WBDS) and strong brittle deformation stage (SBDS). In WBDS, the mean pore number per image increases from 86 to 245, while the mean pore size decreases from 131.4 to 107.7 nm. However, in SBDS, the mean pore number increases from 245 to 685, while the mean pore size decreases from 107.7 to 68.8 nm. The mean pore number and mean pore size in SBDS change at a higher rate, which indicates that tectonic stress has a more profound impact on pore structure in SBDS than that in WBDS.
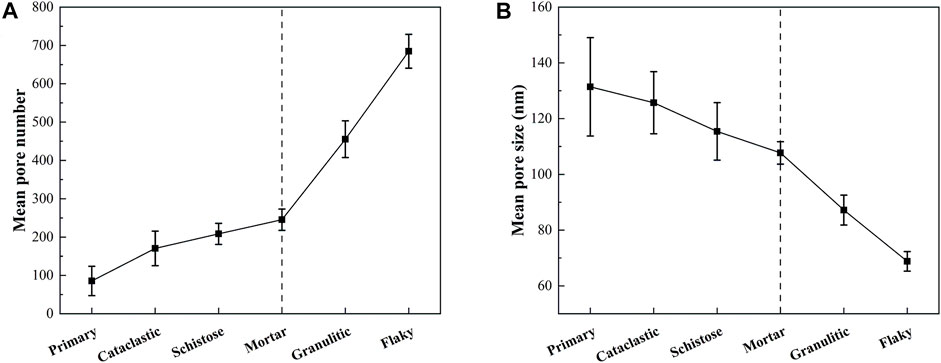
FIGURE 7. Relationships between mean pore number, mean pore size and tectonic deformation degree. (A) Mean pore number of coal samples; (B) Mean pore size of coal samples.
To further explore the nanopore structure in primary coal and different brittle TDCs, we plotted the curves of the pore number of four pore-size intervals—10–50 nm, 50–100 nm, 100–200 nm and >200 nm (Figure 8). In WBDS, the pore number increases gradually. 49% of the pore number increment is provided by macropores of 100–200 nm diameter. The pore number of pores with 10–50 nm and 50–100 nm diameter increases slightly, while macropores of >200 nm diameter levels off. In SBDS, the pore number increases quickly. 68% of the pore number increment is provided by macropores of 50–100 nm diameter, and 24% of the pore number increment is provided by mesopores of 10–50 nm diameter. The pore number of 100–200 nm increases slightly, while pores >200 nm in diameter disappear. As shown in Figure 8, tectonic stress generally promotes pore development in brittle TDCs. And the extent of tectonic impact varies greatly among different brittle TDCs. In WBDS, tectonic stress mainly helps to increase macropores of 100–200 nm diameter. In SBDS, tectonic stress mainly helps to increase macropores of 50–100 nm and mesopores of 10–50 nm diameter.
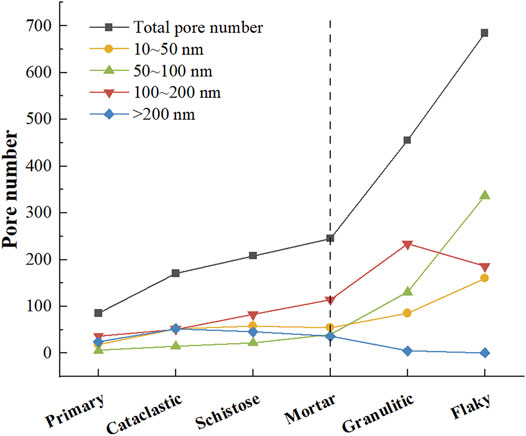
FIGURE 8. Pore size distribution of coal samples from AFM.
Low-temperature N2 adsorption (LTN2A) has been widely used to characterize coal’s pore structure, and its reliable testing range is between 2 and 100 nm (Ju et al., 2005a; Ju et al., 2005b; Ju and Li 2009). The pore size identified from AFM in this study ranges from 10 nm to several hundred nanometers. Therefore, we calculated the total pore area of pores between 10 and 100 nm in diameter and compared the results with that of LTN2A in previous studies (Figure 9). Figure 9A shows that with increasing tectonic deformation, the total pore area increases accordingly. The graph shows a trend similar to that in Figure 7A. In WBDS, the total pore area increases from 0.0361 to 0.222 μm2. In SBDS, the total pore area increases rapidly from 0.222 to 1.66 μm2.
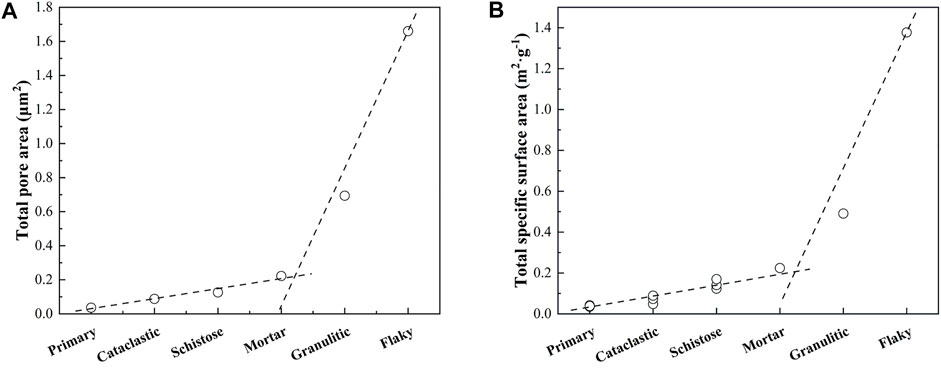
FIGURE 9. (A) Total pore surface area from AFM in this study; (B) Total Specific surface area from LTN2A in Ju et al.’s studies (Ju et al., 2005a; Ju et al., 2005b; Ju and Li 2009).
LTN2A results collected from Ju et al. are shown in Figure 9B. Samples in Ju et al.’s studies were collected from Huainan coalfield and Huaibei coalfield, Anhui Province, whose Ro, max ranges from 0.76 to 1.51% (Ju et al., 2005a; Ju et al., 2005b; Ju and Li 2009). These samples are in the same coal rank and deformation degree as ours, making the results of AFM and LTN2A comparable. From primary coal to mortar coal, the total pore area between 2 and 100 nm increases from 0.0383 m2/g to 0.224 m2/g, while the total pore area increases from 0.224 m2/g to 1.377 m2/g. The variation in the total pore area obtained by LTN2A can also be divided into two stages, indicating that brittle TDCs pore structure does not evolve linearly with tectonic deformation.
4.2 The Impact of Tectonic Stress on Brittle Tectonically Deformed Coals’ Mechanical Properties
Eliyahu et al. (2015) first utilized AFM to map mechanical properties of OM in shales. Since then, AFM has gained increasing attention in characterizing mechanical properties of rocks (Emmanuel et al., 2016; Li et al., 2017; Yang et al., 2017; Khatibi et al., 2018; Liu 2019; Li et al., 2020; Tan et al., 2021). Many of these studies have focused on the relationship between OM’s Young’s modulus and its maturity (Emmanuel et al., 2016; Khatibi et al., 2018; Liu 2019; Tan et al., 2021). However, the relationship between OM’s Young’s modulus and the deformation degree remains poorly understood. Here, we measured the mechanical properties of primary coal and brittle TDCs series, and the results are presented in Figure 10. The Young’s modulus of primary coal and different brittle TDCs varies from 1.5 to 2.0 GPa, which is similar to the Young’s modulus in Li et al.’s study (Li et al., 2020). Overall, the Young’s modulus increases with tectonic deformation degree except for sample QYZ-70. From primary coal to flack coal, the Young’s modulus increases by approximately 20%. In WBDS, the Young’s modulus of different samples levels off. In SBDS, the Young’s modulus increases gradually.
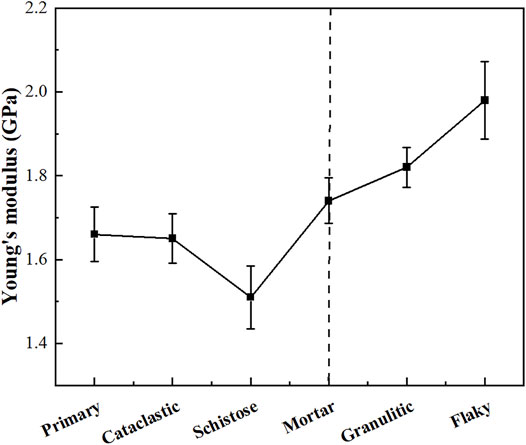
FIGURE 10. Young’s modulus of coal samples.
In previous studies concerning OM’s Young’s modulus and its maturity, it has been found that the OM’s Young’s modulus increases with increasing maturity (Emmanuel et al., 2016; Khatibi et al., 2018; Liu, 2019). Moreover, the OM’s Young’s modulus relates well with certain chemical structure indexes. For example, by utilizing atomic force microscopy-based spectroscopy (AFM-IR), Yang et al. (2017) found that macerals enriched in aromatic carbon and lean in aliphatic carbon have relatively high mechanical stiffness. Khatibi et al. (2018) found that OM’s Young’s modulus positively correlates with the D band position and G-D band separation. Liu (2019) found that there is a strong positive correlation between Young’s modulus and the carbon aromaticity (fa). Tan et al. (2021) also found that the increase in aromatic groups and the decrease in CH2/CH3 ration can be regarded as potential reasons for the rise in OM’s modulus. All of these results indicate that the evolution of OM’s chemical structure leads to a modulus change in the maturation process. As OM’s macromolecule arrangements gradually transform from chaotic and mixed layers to an ordered arrangement, the Young’s modulus increases (Khatibi et al., 2018; Tan et al., 2021).
It is generally considered that temperature plays a dominant role in the evolution of OM. However, tectonic stress can also have an impact on the macromolecular structure of coal (Cao et al., 2007). Some researchers have quantified the structural transitions triggered by tectonic stress. Combining Fourier transformation infrared microspectroscopy (FTIR) and X-ray diffraction (XRD), Cao et al. (2007) found that compared to non-deformed coals, deformed coals exhibit weaker aliphatic absorbance peak, stronger aromatic absorbance peak, smaller carbon atomic surface network distance (d002) and larger basic structural unit of coal (BSU) height (Lc) and width (La). Li (2013) found that shear stress can greatly increase the carbon aromaticity (fa) using nuclear magnetic resonance spectroscopy (NMR). Utilizing high-resolution transmission electron microscopy (HRTEM), Pan et al. (2015b) found that with increases in tectonic deformation, the coal fringe length increased and the fringe separation and fringe tortuosity decreased. Pan et al. (2017) also conducted Raman experiments using coals with different deformation degrees. The results showed that strong TDCs exhibit smaller full width at half maximum for the G-peak (fwhm-G) and smaller intensity ratio between the D and G-peaks (ID/IG), indicating that tectonic deformation can promote the ordering of coal molecular structure. Song et al. (2020a) found that compared to brittle deformation, ductile deformation can improve poorly ordered BSU to a more ordered BSU.
The above studies indicate that tectonic stress promotes BSU rearrangement and ordering in coal. Since geothermal metamorphism can increase the Young’s modulus of OM by transforming its chemical structure, it is reasonable to consider that tectonic stress has the potential to influence coal mechanical properties. The AFM results here partially confirm this hypothesis. In WBDS, the Young’s modulus level off because tectonic stress has little impact on OM’s chemical structure. Note that the average vitrinite reflectance of sample QYZ-70 is only 1.01. Hence, the lower Young’s modulus of sample QYZ-70 may be attributed to a low coal rank as well as a weak deformation degree. In SBDS, the Young’s modulus increases gradually because strong brittle deformation has a more significant impact on OM’s chemical structure. However, the overall increase in Young’s modulus here is 20%, indicating that coal’s macromolecular ordering improvement contributed by brittle deformation is relatively limited. This finding corresponds well with the results of Li (2013) and Song et al. (2020a).
5 Conclusion
1) AFM is an effective method for exploring coal reservoir properties. Combining AFM with Nanoscope Analysis and Gwyddion software, coal reservoir properties including pore number, pore size, and Young’s modulus, can be quantitively analyzed.
2) Tectonic stress generally promotes pore development and Young’s modulus of brittle TDCs. However, the extent of tectonic impact varies greatly among different brittle TDCs, and two deformation stages were identified accordingly: WBDS (primary coal–cataclastic coal–schistose coal–mortar coal) and SBDS (mortar coal–granulitic coal–flaky coal).
3) In WBDS, the mean pore number increases slowly, and the mean pore size decreases slowly. Tectonic stress mainly promotes macropores of 100–200 nm diameter in this stage. In SBDS, the mean pore number increases quickly, and the mean pore size decreases quickly. Most of the pore number increment comes from mesopores of 10–50 nm diameter and macropores of 50–100 nm diameter.
4) The Young’s modulus of primary coal and different brittle TDCs varies from 1.5 to 2.0 GPa. In WBDS, the Young’s modulus of different samples levels off. In SBDS, the Young’s modulus increases gradually. Combined with former studies, it is believed that tectonic stress has the potential to influence coal’s mechanical properties via transforming its chemical structure.
Data Availability Statement
The original contributions presented in the study are included in the article/Supplementary Material, further inquiries can be directed to the corresponding author.
Author Contributions
ZN was in charge of the experiments and writing of this manuscript. YS revised the manuscript. WY was in charge of data analysis.
Funding
This work was supported by the National Natural Science Fund (42072152).
Conflict of Interest
The authors declare that the research was conducted in the absence of any commercial or financial relationships that could be construed as a potential conflict of interest.
Publisher’s Note
All claims expressed in this article are solely those of the authors and do not necessarily represent those of their affiliated organizations, or those of the publisher, the editors, and the reviewers. Any product that may be evaluated in this article, or claim that may be made by its manufacturer, is not guaranteed or endorsed by the publisher.
References
Bruker (2012). Quantitative Mechanical Property Mapping at the Nanoscale with PeakForce QNM. Available at https://www.bruker.com/en/products-and-solutions/microscopes/materials-afm/afm-modes/peakforce-qnm.html (Accessed November 27, 2021).
Cao, D., Li, X., and Zhang, S. (2007). Influence of Tectonic Stress on Coalification: Stress Degradation Mechanism and Stress Polycondensation Mechanism. Sci. China Ser. D 50 (1), 43–54. doi:10.1007/s11430-007-2023-3
Cao, Y., Davis, A., Liu, R., Liu, X., and Zhang, Y. (2003). The Influence of Tectonic Deformation on Some Geochemical Properties of Coals-A Possible Indicator of Outburst Potential. Int. J. Coal Geology. 53 (2), 69–79. doi:10.1016/S0166-5162(02)00077-0
Cheng, Y., and Pan, Z. (2020). Reservoir Properties of Chinese Tectonic Coal: A Review. Fuel 260, 116350. doi:10.1016/j.fuel.2019.116350
Eliyahu, M., Emmanuel, S., Day-Stirrat, R. J., and Macaulay, C. I. (2015). Mechanical Properties of Organic Matter in Shales Mapped at the Nanometer Scale. Mar. Pet. Geology. 59, 294–304. doi:10.1016/j.marpetgeo.2014.09.007
Emmanuel, S., Eliyahu, M., Day-Stirrat, R. J., Hofmann, R., and Macaulay, C. I. (2016). Impact of thermal Maturation on Nano-Scale Elastic Properties of Organic Matter in Shales. Mar. Pet. Geology. 70, 175–184. doi:10.1016/j.marpetgeo.2015.12.001
Frodsham, K., and Gayer, R. A. (1999). The Impact of Tectonic Deformation upon Coal Seams in the South Wales coalfield, UK. Int. J. Coal Geology. 38 (3–4), 297–332. doi:10.1016/S0166-5162(98)00028-7
Jiang, B., Qu, Z., Wang, G. G. X., and Li, M. (2010). Effects of Structural Deformation on Formation of Coalbed Methane Reservoirs in Huaibei coalfield, China. Int. J. Coal Geology. 82 (3–4), 175–183. doi:10.1016/j.coal.2009.12.011
Jiao, K., Yao, S., Zhang, K., Hu, W., and Cao, J. (2018). The Evolution of Nanopores and Surface Roughness in Naturally Matured Coals in South China: An Atomic Force Microscopy and Image Processing Study. Fuel 234, 1123–1131. doi:10.1016/j.fuel.2018.07.102
Ju, Y., Jiang, B., Hou, Q., Wang, G., and Fang, A. (2005b). Structual Evolution of Nano-Scale Pores of Tectonic Coals in Southern North China and its Mechanism. Acta Geologica Sinica 79 (2), 269–285.
Ju, Y., Jiang, B., Hou, Q., and Wang, G. (2005a). Relationship between Nano-Scale Deformation of Coal Rock Structure and Metamorphic Deformation Environment. Chin. Scie Chin. Sci. Bull. 50 (17), 1884–1892. doi:10.1360/04wd0205
Ju, Y., Jiang, B., Hou, Q., and Wang, G. (2004). The New Structure-Genetic Classification System in Tectonically Deformed Coals and its Geological Significance. J. China Coal Soc. 29 (5), 513–517. doi:10.13225/j.cnki.jccs.2004.05.001
Ju, Y., and Li, X. (2009). New Progress in the Study of Microstructure of Deformed Coal. Prog. Nat. Sci. 19 (2), 131–140. doi:10.1016/j.pnsc.2009.03.013
Khatibi, S., Ostadhassan, M., Tuschel, D., Gentzis, T., Bubach, B., and Carvajal-Ortiz, H. (2018). Raman Spectroscopy to Study thermal Maturity and Elastic Modulus of Kerogen. Int. J. Coal Geology. 185, 103–118. doi:10.1016/j.coal.2017.11.008
Kumar, V., Curtis, M. E., Gupta, N., Sondergeld, C. H., and Rai, C. S. (2012). Estimation of Elastic Properties of Organic Matter and Woodford Shale through Nano-Indentation Measurements. Houston, Texas: SPE.
Li, C., Ostadhassan, M., and Kong, L. (2017). “Nanochemo-mechanical Characterization of Organic Shale through AFM and EDS,” in Proceedings of the SEG International Exposition and 87th Annual Meeting, Houston, Texas, September 2017, 3837–3840. doi:10.1190/segam2017-17797862.1
Li, M. (2013). “Structure Evolution and Deformation Mechanism of Tectonically Deformed Coal,” (Xuzhou: China University of Mining and Technology). Doctor’s thesis.
Li, Y., Yang, J., Pan, Z., and Tong, W. (2020). Nanoscale Pore Structure and Mechanical Property Analysis of Coal: An Insight Combining AFM and SEM Images. Fuel 260, 116352. doi:10.1016/j.fuel.2019.116352
Liu, H., and Jiang, B. (2019). Stress Response of Noncovalent Bonds in Molecular Networks of Tectonically Deformed Coals. Fuel 255, 115785. doi:10.1016/j.fuel.2019.115785
Liu, X., Song, D., He, X., Wang, Z., Zeng, M., and Deng, K. (2019). Nanopore Structure of Deep-Burial Coals Explored by AFM. Fuel 246, 9–17. doi:10.1016/j.fuel.2019.02.090
Liu, Y. (2019). “Nanopore Development, Chemical Structure and Mechanical Properties of OM in Highly Matured Shale,” (Guangzhou: University of Chinese Academy of Sciences). Doctor’s thesis.
Meng, Y., Niu, J., Xia, J., and Que, L. (2020). Study on Mechanical Properties and Failure Mechanisms of Coal at the Nanometer Scale. Chin. J. Rock Mech. Eng. 39 (1), 84–92. doi:10.13722/j.cnki.jrme.2019.0659
Nečas, D., and Klapetek, P. (2012). Gwyddion: an Open-Source Software for SPM Data Analysis. Cent. Eur. J. Phys. 10 (1), 181–188. doi:10.2478/s11534-011-0096-2
Pan, J., Lv, M., Bai, H., Hou, Q., Li, M., and Wang, Z. (2017). Effects of Metamorphism and Deformation on the Coal Macromolecular Structure by Laser Raman Spectroscopy. Energy Fuels 31, 1136–1146. doi:10.1021/acs.energyfuels.6b02176
Pan, J., Wang, S., Ju, Y., Hou, Q., Niu, Q., Wang, K., et al. (2015a). Quantitative Study of the Macromolecular Structures of Tectonically Deformed Coal Using High-Resolution Transmission Electron Microscopy. J. Nat. Gas Sci. Eng. 27, 1852–1862. doi:10.1016/j.jngse.2015.11.012
Pan, J., Zhu, H., Hou, Q., Wang, H., and Wang, S. (2015b). Macromolecular and Pore Structures of Chinese Tectonically Deformed Coal Studied by Atomic Force Microscopy. Fuel 139, 94–101. doi:10.1016/j.fuel.2014.08.039
Ren, J., Song, Z., Li, B., Liu, J., Lv, R., and Liu, G. (2021). Structure Feature and Evolution Mechanism of Pores in Different Metamorphism and Deformation Coals. Fuel 283, 119292. doi:10.1016/j.fuel.2020.119292
Song, X., Tang, Y., Li, W., Wang, S., and Yang, M. (2013). Fractal Characteristics of Adsorption Pores of Tectonic Coal from Zhongliangshan Southern Coalmine. J. China Coal Soc. 38 (1), 134–139. doi:10.13225/j.cnki.jccs.2013.01.002
Song, Y., Jiang, B., Li, M., Hou, C., and Mathews, J. P. (2020a). Macromolecular Transformations for Tectonically-Deformed High Volatile Bituminous via HRTEM and XRD Analyses. Fuel 263, 116756. doi:10.1016/j.fuel.2019.116756
Sun, C., Li, G., Gomah, M. E., Xu, J., and Rong, H. (2020). Experimental Investigation on the Mechanical Properties of Crushed Coal Samples Based on the Nanoindentation Technique. J. China Coal Soc. 45, 682–691. doi:10.13225/j.cnki.jccs.2020.0351
Tan, X., Gilliland, E., Tang, X., and Ripepi, N. (2021). Integrated Experimental Characterization of Shales of Varying Thermal Maturation in the Central Appalachian Basin Using Raman and Fourier Transform Infrared Spectroscopy and Atomic Force Microscopy. Energy Fuels 35, 201–212. doi:10.1021/acs.energyfuels.0c01836
Wang, S., Liu, S., Sun, Y., Jiang, D., and Zhang, X. (2017). Investigation of Coal Components of Late Permian Different Ranks Bark Coal Using AFM and Micro-FTIR. Fuel 187, 51–57. doi:10.1016/j.fuel.2016.09.049
Yang, J., Hatcherian, J., Hackley, P. C., and Pomerantz, A. E. (2017). Nanoscale Geochemical and Geomechanical Characterization of Organic Matter in Shale. Nat. Commun. 8, 2179. doi:10.1038/s41467-017-02254-0
Yao, Y. (2017). Physical Properties of Brittle Deformation Series Tectonically Defromed Coal and Quantitative Characterization of its Structure (Xuzhou: China University of Mining and Technology). Master’s thesis.
Yu, S., Bo, J., and Jie-gang, L. (2017). Nanopore Structural Characteristics and Their Impact on Methane Adsorption and Diffusion in Low to Medium Tectonically Deformed Coals: Case Study in the Huaibei Coal Field. Energy Fuels 31, 6711–6723. doi:10.1021/acs.energyfuels.7b00512
Yu, S., Bo, J., Ming, L., Chenliang, H., and Shaochun, X. (2020b). A Review on Pore-Fractures in Tectonically Deformed Coals. Fuel 278, 118248. doi:10.1016/j.fuel.2020.118248
Zhang, X. (2014). The fine Characterization of Pore Structure of Tectonically Deformed Coals from Hancheng Mining Area on Multiscale (Taiyuan: Taiyuan University of Technology). Master’s thesis.
Keywords: atomic force microscopy, tectonically deformed coal, brittle deformation, pore structure, mechanical properties
Citation: Zhang N, Yao S and Wang Y (2022) Nanopore Structure and Mechanical Properties in Brittle Tectonically Deformed Coals Explored by Atomic Force Microscopy. Front. Earth Sci. 10:844120. doi: 10.3389/feart.2022.844120
Received: 27 December 2021; Accepted: 07 February 2022;
Published: 28 February 2022.
Edited by:
Jienan Pan, Henan Polytechnic University, ChinaReviewed by:
Jiangang Ren, Henan University of Engineering, ChinaNiu Qinghe, Shijiazhuang Tiedao University, China
Yu Song, China University of Mining and Technology, China
Copyright © 2022 Zhang, Yao and Wang. This is an open-access article distributed under the terms of the Creative Commons Attribution License (CC BY). The use, distribution or reproduction in other forums is permitted, provided the original author(s) and the copyright owner(s) are credited and that the original publication in this journal is cited, in accordance with accepted academic practice. No use, distribution or reproduction is permitted which does not comply with these terms.
*Correspondence: Suping Yao, c3B5YW9Abmp1LmVkdS5jbg==