- 1Xinjiang Oilfield Company, PetroChina, Karamay, China
- 2Turpan-Hami Oilfield Company, PetroChina, Hami, China
The Junggar Basin is rich in natural gas resources, but it has hardly been explored, with the proven rate being less than 9.0%. Although the hinterland of the Junggar Basin has a favorable condition for natural gas accumulation, the complex gas sources cause great trouble in the selection of zones and belts for exploration. Based on the molecular composition and stable carbon and hydrogen isotope data of 95 natural gas samples from 72 wells in this area, combined with the characteristics of structural evolution history, burial history, hydrocarbon generation and expulsion history, and fluid inclusions, this paper clarified the geneses and sources of natural gas, identified the secondary alteration of natural gas, and restored the process of natural gas accumulation. Natural gas in the hinterland was divided into four types: Type I was oil-type gas from the Lower Permian Fengcheng Formation; Type II was coal-type gas derived from the Carboniferous source rock; Type III was the mixture of Type I and II gases, which constituted the major fraction of natural gases in the hinterland; and Type IV that referred to secondary microbial gas formed by the biodegradation of crude oil. During the Late Cretaceous, the Carboniferous and Fengcheng source rocks entered the gas generation peak and a series of natural gas reservoirs were formed. However, affected by the later tectonic movements, some gas reservoirs were damaged or adjusted, and natural gas leakage and biodegradation occurred. This study has shifted the focus of natural gas exploration in the study area from the petroleum system associated with the Middle Permian source rocks to that with the Lower Permian and Carboniferous source rocks, which is of great significance for natural gas exploration in the Junggar Basin. Further, it provides an example to identify the geneses and sources of natural gas under complex conditions based on integrated geological and geochemical assessments.
1 Introduction
The Junggar Basin, a late Paleozoic–Cenozoic superimposed basin, is located in the north of Xinjiang Uyghur Autonomous Region in northwest China (Figure 1A), covering an area of about 130 × 103 km2 (He et al., 2018; Cao et al., 2020; Xia et al., 2021). In 2017, the proven oil reserves and the annual oil production in the basin reached 33.6 × 10⁸ and 12.88 × 10⁶ t (Hu S. Y. et al., 2020; Zhi et al., 2021), respectively, making the Junggar Basin one of the most important oil production bases in China. In contrast, the proven natural gas reserves in the basin are only 209.25 × 10⁹ m3, which comes to less than 9% (Hu S. Y. et al., 2020).
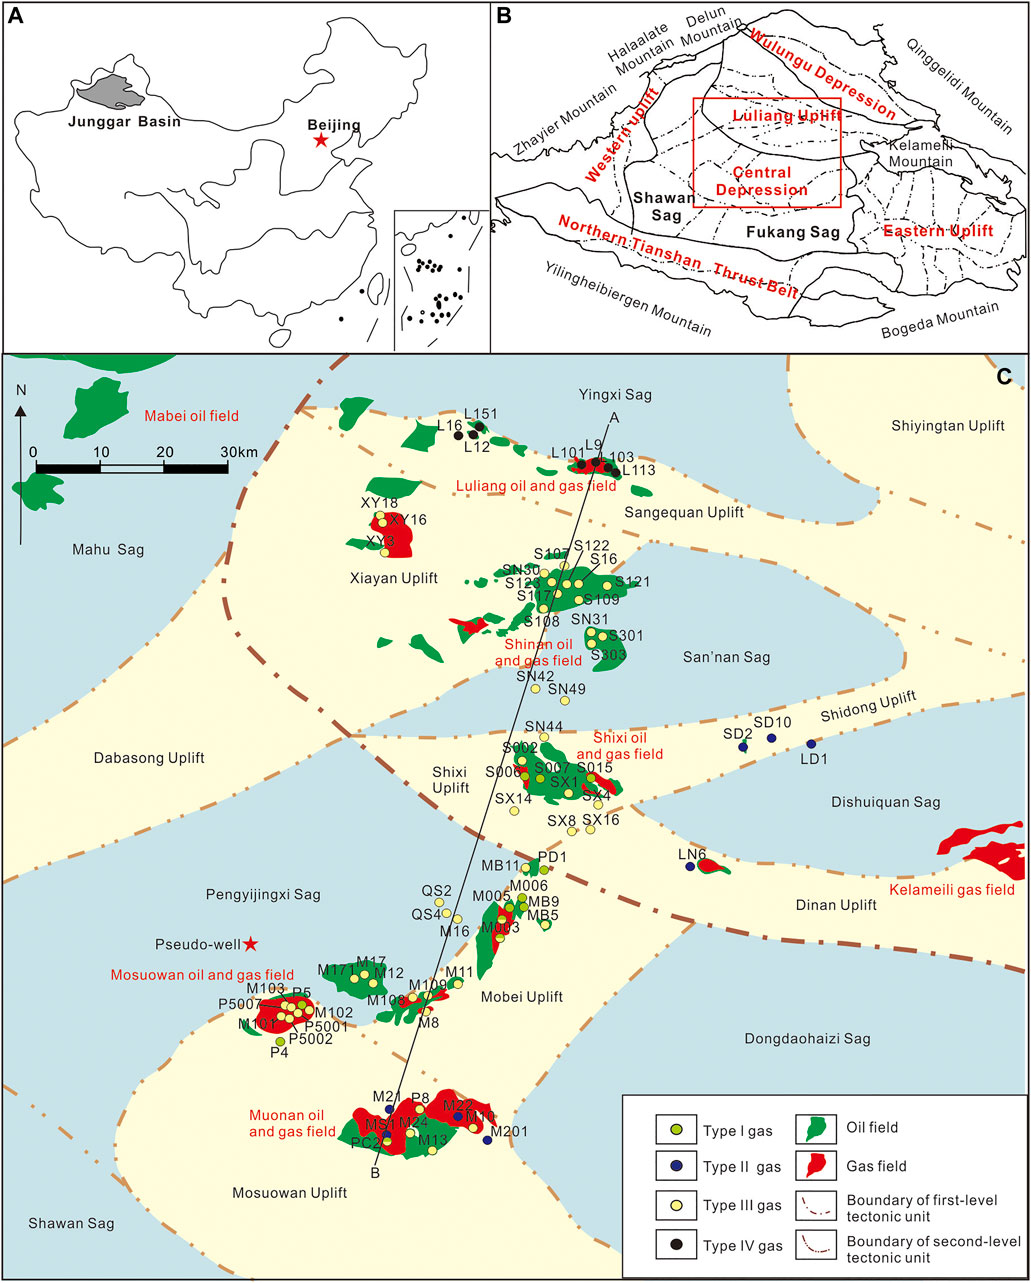
FIGURE 1. Geological background in the hinterland of Junggar Basin. (A) Location of the Junggar Basin in China; (B) Characteristics of tectonic units in Junggar Basin; (C) Distribution of natural gas of different origins in the hinterland of Junggar Basin.
At present, gas reservoirs in the Junggar Basin are mainly in the east (e.g., Kelameili and Wucaiwan gas fields), in the southern edge (e.g., Mahe and Hutubi gas fields), and in the northwestern edge (e.g., 561, 581, Ke 84, Jinlong 4 and Zhongjia 2 gas reservoirs) (Wang et al., 2013; Chen et al., 2014, Dai et al., 2016; Sun et al., 2016; Tao et al., 2016; Gong et al., 2018; Chen et al., 2019). The gas-producing reservoirs in the eastern region are mainly volcanic rocks characterized by strong heterogeneity and poor physical properties (Dai et al., 2016; Gong et al., 2019a, Gong et al., 2019b; Gong et al., 2021). The thermal evolution degree of source rocks in the northwestern region is relatively low, resulting in limited distribution range of gas sources kitchen (Chen et al., 2014; Tao et al., 2016). The southern edge has a complex structure, large reservoir burial depth, poor surface conditions, and increased development difficulty (Dai et al., 2016; Chen et al., 2019; Hu S. Y. et al., 2020). Such problems have hindered profitable exploration and development of natural gas in the Junggar Basin. Since 2007, the annual natural gas production in the Junggar Basin has been hovering at 2 × 10⁹ m3–3 × 10⁹ m3.
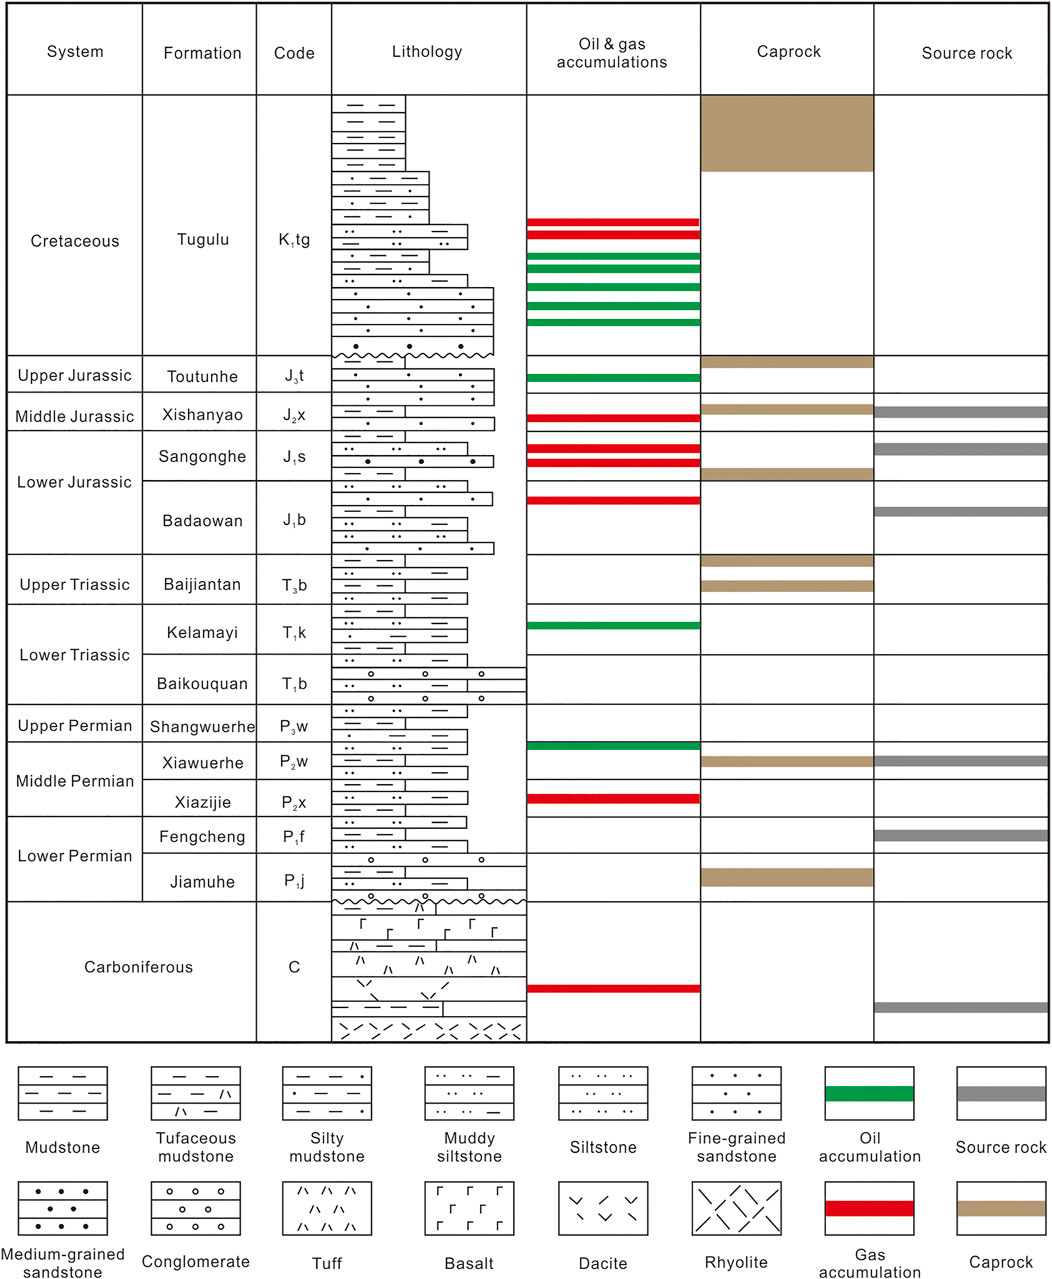
The total area of the hinterland is about 36 × 103 km2. It is adjacent to the Pengyijingxi Sag in the west and Dishuiquan Sag in the east (Figures 1B,C). Four sets of source rocks developed in the study area, the Middle–Lower Jurassic Formation (J1–2), Middle Permian Xiawuerhe Formation (P2w), Lower Permian Fengcheng Formation (P1f), and Carboniferous Formation (C), promising a favorable hydrocarbon source condition (Figure 2) (Cao et al., 2012; Wang et al., 2013). The gas layers are shallow (generally <4,000 m) and have conducive physical properties (Liu G et al., 2019) for rapidly building the production capacity. Thus, exploration and development of natural gas in the study area can have tremendous economic benefits. Although several gas-producing wells were drilled in this area (Figure 1C) (Cao et al., 2012), no significant reserves have been found yet. In 2019, Well QS2 drilled in the Qianshao Salient (Figure 1C) obtained high-yield industrial oil and gas flow in the Lower Jurassic Sangonghe Formation (J1s), with a daily gas and oil production of 203.6 × 10³ m3 and 39.3 t, respectively. In 2020, 6.5 × 10⁹ m3 of proven geological reserves of natural gas were confirmed, shedding light on great potential for gas exploration in this area.
There are two main viewpoints on the geneses and sources of the natural gas in the hinterland: one proposed the gases were mainly derived from the J1–2 coaly source rock (Dai et al., 2009; Li et al., 2009), and the other argued that gases were derived from the P2w lacustrine source rock (Cao et al., 2012; Sun et al., 2012; Gong et al., 2018). More significant disputes regarding the gas sources of different reservoirs also exist (Song, 1996; Wu et al., 2003; Liao et al., 2004; Li et al., 2011; Sun et al., 2012; Lu et al., 2014). There are several reasons for this diversity of perceptions. 1) Because the organic matter of the source rocks in J1–2, P2w, and Carboniferous are all humic types (Cao et al., 2012; Wang et al., 2013; Dai et al., 2016), the geochemical characteristics of the generated natural gas are difficult to distinguish. 2) The superimposition of the multiple sets of source rocks makes natural gas more likely to mix. 3) Because the Cenozoic, the Junggar Basin has tilted southward, resulting in the adjustment or destruction of early formed petroleum reservoirs (Xiang et al., 2015; Liu G et al., 2019). In addition, natural gas may suffer secondary alteration, which further increases the difficulty of gas source identification.
In addition to the three sets of humic source rocks, P1f sapropelic lacustrine source rock was also developed in the study area (Wang et al., 2013; Cao et al., 2020). In the past, it was mainly considered as a set of oil source rocks (Cao et al., 2020; Xia et al., 2021). Recently, highly mature oil-type gas derived from the P1f source rock was found in the southwest of the basin (Zhi et al., 2021). However, there is no systematic study on the gas generation potential of P1f source rocks in the hinterland of the basin.
Given these problems, we systematically analyzed the molecular composition and stable carbon (δ13C) and hydrogen (δ2H) isotope ratios of 95 natural gas samples in the hinterland of the Junggar Basin. It clarifies the geneses, sources, and secondary alteration of the natural gas. The natural gas accumulation process is rebuilt with the structural evolution history, burial history, hydrocarbon generation and expulsion history, and fluid inclusion characteristics in the study area. The research results are of great significance for natural gas exploration in the Junggar Basin and provide an example to identify the geneses and sources of natural gas under complex conditions based on integrated geological and geochemical information.
2 Geological Setting
Located at the junction of three paleo-plates (i.e., Siberia, Tarim, and Kazakhstan), the Junggar Basin is composed of the Junggar massif and its surrounding fold belts (He et al., 2018). The basin is approximately rhombic on the plane, with the Qinggelidi Mountains and Kelameili Mountains in the northeast, the Zhayier Mountains, Halaalate Mountains, and Delun Mountains in the northwest, and the Yilingheibiergen Mountains and Bogeda Mountains in the south (Figure 1B). Based on the Permian paleo-structures, the Junggar Basin can be roughly divided into six first-order tectonic units (i.e., Central Depression, Wulungu Depression, Luliang Uplift, West Uplift, East Uplift, and Northern Tianshan thrust belt), and can be further subdivided into 44 secondary tectonic units (Figure 1B) (Gong et al., 2019a; Zhi et al., 2021). The study area is mainly located in the Luliang Uplift and the Central Depression (Figures 1B,C).
After the Hercynian (∼268 Ma) tectonic movement, the Junggar Basin formed large uplifts and depressions dominated by NW- and NWW-striking directions under regional SN compression and collision (Hu et al., 2006; Qi et al., 2010). The study area began to take shape at this time. During the Yanshanian period (∼200 Ma), large-scale uplifting occurred in the study area, and the J1–2 strata were denuded (Yang et al., 2002). Since then, the basin entered a stable depositional period during which the early-formed structures were better preserved (Li et al., 2002; Hu et al., 2006). During the Himalayan period (∼23 Ma), the basin’s southern part subsided sharply (Liu Q et al., 2019). The structural amplitude in the study area gradually decreased with the high point moving northward. Only a series of low-amplitude bulges were retained (Qi et al., 2010; Cao et al., 2012) (Figure 1C).
The discovered natural gas in the study area is mainly distributed in the Sangequan, Xiayan, Shixi, Mobei, and Mosuowan Salients (Figure 1C). Gas producing zones are mainly in the Jurassic and Cretaceous sandstone reservoirs and Carboniferous volcanic reservoirs (Figure 2; Table 1). Four significant sets of reservoir–seal assemblages were developed in the study area: 1) the reservoir–seal assemblage with the Carboniferous volcanic weathering crust as reservoir and the Lower Permian mudstone as seal, 2) the reservoir–seal assemblage with glutenite in the Middle Permian Xiazijie Formation (P2x) as a reservoir and the P2w mudstone as seal, 3) the reservoir–seal assemblage with glutenite of the Lower Triassic Baikouquan Formation (T1b) and Karamay Formation (T2k) as reservoirs, and the mudstone of the Upper Triassic Baijiantan Formation (T3b) as seal, and 4) the reservoir–seal assemblage composed of interbedded sandstone and mudstone in the Jurassic and Cretaceous strata (Figure 2) (Cao et al., 2012; Liu Q et al., 2019).
3 Sample and Methods
3.1 Sampling
Ninety-five natural gas samples were collected from 72 wells in the hinterland of the Junggar Basin, of which 55 samples were newly collected, and the rest were from the previous researches (Li et al., 2009; Cao et al., 2012; Sun et al., 2012). The planar distribution positions and analysis results are shown in Figure 1C and Table 1. In addition, this study also conducted geochemical analysis of 437 source rock samples from 129 wells in the basin and on crude oil samples associated with natural gas.
3.2 Analytical Processes
3.2.1 Geochemical Analysis of Natural Gas
The geochemical analysis of the natural gas was conducted at the Experimental and Testing Institute of PetroChina Xinjiang Oilfield Company and Northwest Institute of Eco-Environment and Resources, Chinese Academy of Sciences. A Hewlett Packard 6890 II gas chromatograph (GC) was used for the analysis of the natural gas components. The hydrocarbon gas component was separated with capillary columns (Plot Al2O3 50 m × 0.53 mm). The furnace temperature of the GC was first set to be 30°C and held for 10 min. Then the temperature was ramped up to 180°C at a rate of 10°C/min. Stable carbon isotope analysis of alkane gas (C1–C4) was conducted with a Finnigan Mat Delta S mass spectrometer interfaced with an HP 6890II gas chromatograph. The alkane gas components (C1–C3) and CO2 were separated by using a chromatographic column (Plot Q 30 m × 0.32 mm). The column heating process was as follows: the heating rate was 8°C/min at temperatures of 35–80°C; the temperature was then increased to 260°C at a heating rate of 5°C/min. The final temperature was held for 10 min. Each sample was analyzed three times with an accuracy of ±0.3‰ (VPDB).
The hydrogen isotopic compositions of natural gas were determined on a MAT253 isotopic mass spectrometer (Thermo Fisher Scientific) equipped with a Trace GC Ultra™ using the gas chromatography pyrolysis interface and the water removing device. Helium was used as the carrier gas and a 30 m × 0.32 mm × 20 µm HP–PLOT Q column was used with flow rate of 1.4 ml/min. The inlet temperature was set at 180°C. A split injection mode (split ratio 1:7) was used for the methane hydrogen isotope measurement and a splitless injection mode for the ethane and propane hydrogen isotopes. The initial temperature was 40°C and held for 5 min, then heated from 40 to 80°C at 5°C/min, from 80 to 140°C at 10°C/min and from 140 to 260°C at 30°C/min, respectively. The temperature of the pyrolysis oven was 1,450°C, and gaseous hydrocarbon components were transformed into C and H2. The H2 went into mass spectrometer to be measured. The δ2H was calculated relative to VSMOW. The reproducibility and precision of hydrogen isotope value are less than ±3‰.
3.2.2 Geochemical Analysis of Oil
The GC analysis of oils was performed in an Agilent 7890A gas chromatograph fitted with a 60 m × 0.25 mm × 0.25 µm capillary column with nitrogen (99.999%) as the carrier gas. The GC oven temperature was initially held at 40°C for 10 min, then ramped from 40 to 70°C at 4°C/min and to 300°C at 8°C/min, and finally held at 300°C for 40 min.
The GC–MS analysis was performed in an Agilent 7890–5975C with the same column type as used in the GC analysis, but with helium (99.999%) as the carrier gas. During the GC–MS analysis, the GC oven temperature was initially held at 50°C for 1 min, then ramped to 120°C at 20°C/min, from 120 to 250°C at 4°C/min, and from 250 to 310°C at 3°C/min. Finally, it was held at 310°C for 30 min.
3.2.3 Basin Modelling
The burial and thermal histories of the source rocks in the study area were reconstructed using PetroMod software. The current heat flow and thermal conductivity values of the source rocks were adopted from previous studies (Wang et al., 2000a, Wang et al., 2000b; Qiu et al., 2000; Qiu et al., 2001; Qin, 2002). The vitrinite reflectance (Ro) values were calculated with the Easy%Ro model proposed by Sweeney and Burnham (1990). This model was proved to be applicable for a Ro range of 0.3%–4.6%.
3.2.4 Total Organic Carbon and Rock–Eval Analysis
The analyses were carried out at the China University of Petroleum (Beijing). The 146 rock samples were crushed to powder for total organic carbon (TOC) analysis (Table 1). The powdered samples were split into 200-mg sub-samples and treated with HCl at 60°C to remove the carbonates, then washed with distilled water to remove the HCl. The washed sub-samples were dried overnight at 50°C, and their carbon contents were determined using a LECO CS–230 analyzer.
For rock–eval pyrolysis, 100 g of each crushed rock sample was placed in the vessel of an OGE-II instrument. These samples were heated from 300 to 600°C in a helium atmosphere at a heating rate of 50°C/min, and their Rock–Eval parameters (S1, S2, and Tmax) were measured. Here S1 is the amount of free hydrocarbon that can be volatilized from the rock sample (mg HC/g rock), and S2 is the amount of hydrocarbon produced by the cracking of organic matter (mg HC/g rock). Tmax (oC) is the temperature at which the S2 yield is maximized, which roughly estimates the thermal maturity of the sediment (Peters, 1986).
4 Results
4.1 Molecular Compositions of the Natural Gas
The alkane content of the natural gas was relatively concentrated, ranging from 72.87% to 99.01% (95.30% on average) (Table 1), the majority of which was within 90%–100% (Table 1). The methane content varied significantly from 36.89% to 95.89% (87.16% on average), with its primary span being 80%–100%. Except for samples SD10 and LN6 (K1q), whose methane content was only 36.89% and 44.99%, respectively, most samples had methane content higher than 70% (Table 1). The contents of heavy hydrocarbon (C2–4) gas components in natural gas were 0.12%–42.66% (averaging 8.14%), and the dominant frequency was distributed between 0% and 20%. The samples with C2–4 gas contents were mainly distributed in the Shidong and Lunan Salients and sporadically distributed in the Mosuowan and Shixi Salients (Table 1). Natural gas’s drying coefficient (C1/∑C1–4) was 0.51–1.00 (0.91 on average) with a primary interval of 0.85–0.95. Dry gas (C1/∑C1–4 > 0.95) and wet gas (C1/∑C1–4 < 0.95) constituted 15.4% and 84.6% of the total data, respectively (Table 1).
The contents of non-hydrocarbon gases varied from 0.46% to 19.38% (averaging 3.45%) (Table 1). 78.9% of the samples have non-hydrocarbon gas contents less than 5% (Table 1). Except for SD10, whose nitrogen content reached 19.20%, most samples had a nitrogen content of 0%–5% (3.00% on average) (Table 1). Carbon dioxide content was mainly between 0 and 1% (0.47% on average) (Table 1).
4.2 Stable Carbon Isotopic Composition of Natural Gas
Stable carbon isotopic compositions of methane (δ13C-CH4) varied broadly (from –54.8‰ to –31.8‰, –37.7‰ on average) with a primary interval of –45.0‰ to –30‰ (Table 1). Among them, the relatively 13C-depleted samples (δ13C-CH4 < –45‰) were mainly distributed in the Luliang oil and gas field, while the relatively 13C-enriched samples were mainly in the Lunan, Shidong, and Monan Salients (Figure 1C; Table 1). Stable carbon isotopic compositions of ethane (δ13C-C2H6) ranged from –32.4‰ to –24.2‰ (–27.1‰ on average) with the dominant interval between –28‰ and –24.0‰. Among them, 78.9% of the samples have δ13C-C2H6 ratios more than –28.0‰, and the samples with δ13C-C2H6 < –28.0‰ are mainly distributed in the Mobei and Mosuowan Salients (Figure 1C; Table 1). Stable carbon isotopic compositions of propane (δ13C-C3H8) varied from –30.1‰ to –14.8‰ (–25.6‰ on average), and their dominant frequency was between –28.0‰ and –24.0‰. Four samples (i.e., L9, SN30, L113, and L151) have the most 13C-enriched δ13C-C3H8 ratios (–14.8‰, –16.4‰, –17.8‰ and –17.9‰, respectively), presenting an apparent difference from the other samples (Figure 1C; Table 1).
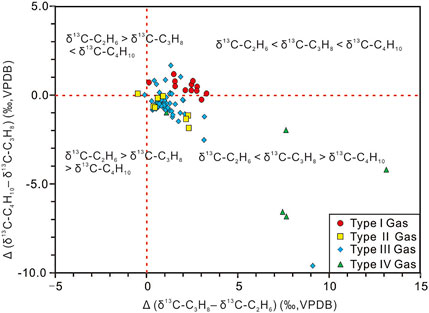
Generally, the natural gas samples in the study area showed a distribution pattern of δ13C-CH4 < δ13C-C2H6 < δ13C-C3H8 (Figure 3; Table 1). The reversals between δ13C-C2H6 and δ13C-C3H8 ratios were only observed in L102, P8, and M21 (Figure 3; Table 1). Some samples have reversed carbon isotopic composition of propane and butane. Except for SN30, which had the maximum the Δδ13C-(C4H10 – C3H8) ratio (9.6‰), most of other samples have ratios less than 1.0‰ (Figure 3; Table 1).
5 Discussion
5.1 Geneses of the Natural Gas
The δ13C ratios are the most common and practical tools to distinguish the genetic types of natural gas (Liu G. et al., 2019). Based on the δ13C data of thousands of natural gas samples from major petroliferous basins around the world, (Dai et al., 1992, Dai et al., 2014) proposed a δ13C-CH4–δ13C-C2H6–δ13C-C3H8 genetic identification chart for natural gas. The natural gas in the study area can be divided into four types in the chart. Type I gas generally has relatively 13C-depleted δ13C ratios, with average δ13C-CH4, δ13C-C2H6 and δ13C-C3H8 values being –42.6‰, –29.5‰ and –27.5‰, respectively, falling within the domain of oil-type gas (Figure 4; Table 1). Type II and Type III gases generally had relatively 13C-enriched δ13C ratios, both falling in the domain of coal-type gas (Figure 4; Table 1). Although Type II and Type III gas had similar δ13C ratios, they could still be distinguished from their δ13C-CH4 ratios. The δ13C-CH4 ratios of Type II gas were between –34.1‰ and –31.8‰, while those of Type III were between –39.0‰ and –34.0‰ (Figure 4; Table 1). The average value of the former was 3.4‰ more than that of the latter. Because the C1/∑C1–4 ratios of these two types of natural gases were similar (mainly 0.90–0.95) (Table 1), their δ13C-CH4 difference was primarily affected by their distinct geneses, rather than the difference in maturities. The distribution position of Type IV gas in Figure 4 was different from the other types of natural gases. Type IV gas had the most 13C-depleted δ13C-CH4 value, and most of them were within the range of low mature oil-type gas (Figure 4). However, its C1/∑C1–4 ratios were very high (0.97 on average, Table 1), significantly different from thermogenic gas, reflecting possible secondary alteration.
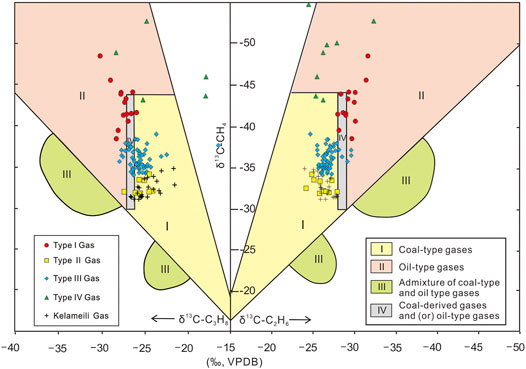
FIGURE 4. Using the δ13C-CH4–δ13C-C2H6–δ13C-C3H8 diagram to identify the genesis of natural gas in the hinterland of Junggar Basin (diagram modified after Dai et al., 1992, Dai et al., 2014).
5.2 Sources of Natural Gas
5.2.1 Type I Gas
Four sets of source rocks were developed in the study area (i.e., J1–2, P2w, P1f, and Carboniferous source rocks) (Cao et al., 2012; Wang et al., 2013). The J1–2, P2w, and Carboniferous source rocks are humic, characterized by kerogen types II2–III with their carbon isotopic composition of kerogen (δ13Ckerogen) mainly varying from –26.0‰ to –20.0‰ (Figure 5). These source rocks primarily generate coal-type gases (Dai et al., 1992; Liu G. et al., 2019). The P1f source rock was deposited under a saline lacustrine environment, with algae and lower aquatic organisms as the primary organic input (Cao et al., 2020; Xia et al., 2021; Zhi et al., 2021). It is a set of oil-prone source rock characterized by kerogen type II1 with their δ13Ckerogen mainly varying from –28.0‰ and –24.0‰ (Figure 5). The Mahu super-giant oil field’s petroleum in the Junggar Basin was mainly generated from the P1f source rock (Wang et al., 2013; Cao et al., 2020). Besides oil, the P1f source rock can also generate a considerable amount of oil-type gas. As discussed in Section 5.1, Type I gas was an oil-type gas with relatively 13C-depleted δ13C ratios (Figure 4; Table 1), which was generated from the P1f source rock, the only sapropelic source rock in the study area.
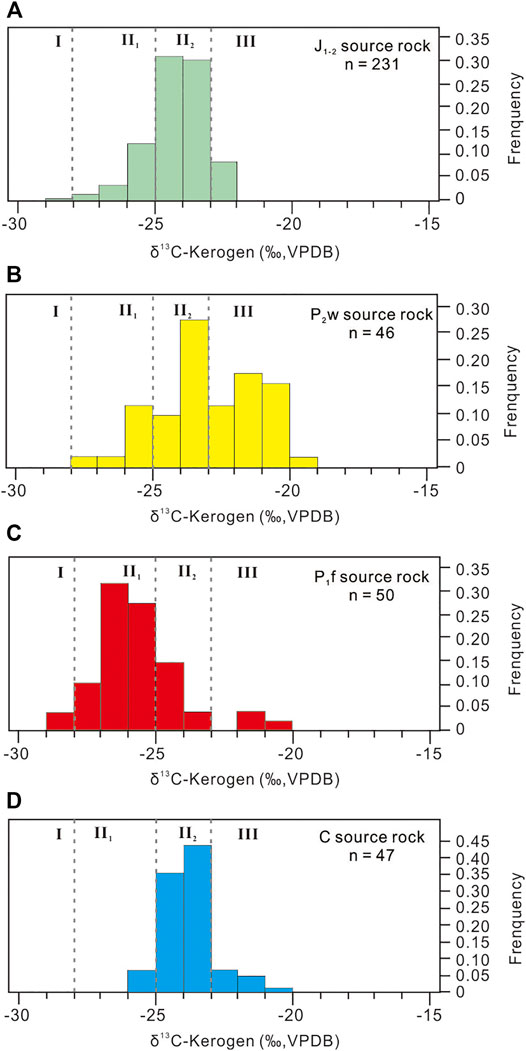
FIGURE 5. Histogram of δ13Ckerogen values of primary (A) J1-2, (B) P2w, (C) P1f, and (D) C source rocks in the hinterland of Junggar Basin.
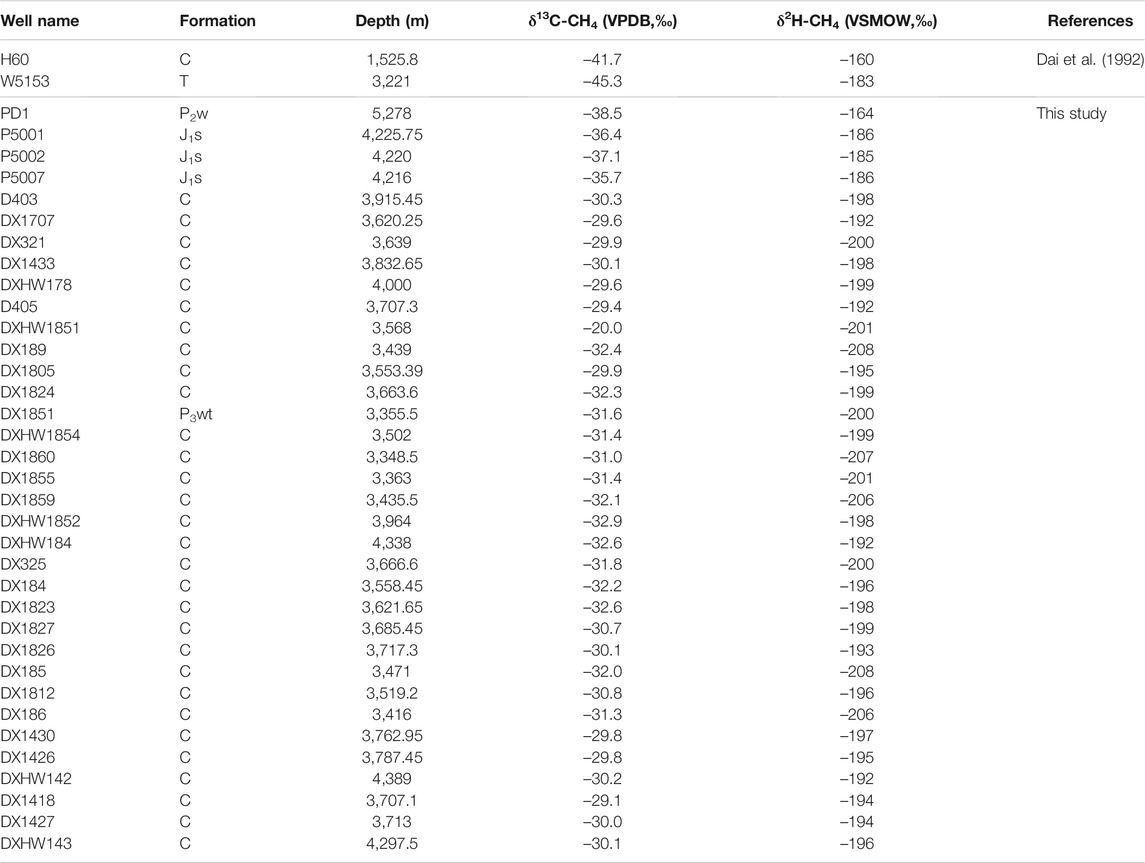
This conclusion was supported by evidence from the δ2H ratios of natural gas. Identical to δ13C ratios, the δ2H ratios of alkane gases also have parent material inheritance (Schoell, 1980, Schoell, 1984; Ni et al., 2011). Under the same or similar thermal evolution conditions, the δ2H ratios of the natural gas generated by marine or saline lacustrine source rocks are usually more enriched in 2H (Liu et al., 2008a; Wang et al., 2015; Liu Q. et al., 2019). Therefore, the δ2H ratios of alkane gas can be used to judge the geneses and sources of natural gas (Schoell, 1980; Wang et al., 2015). Gases from Well PD1 have δ2H-CH4 and δ13C-CH4 ratios of –164‰ and –38.5‰, respectively, and was located within the distribution area of oil-type gas generated from the saline sapropelic source rock (Wang et al., 2015; Figure 6; Table 2). Two gas samples derived from the P1f source rock in the Mahu Sag (Dai et al., 1992) were also located in this area (Figure 6; Table 2).
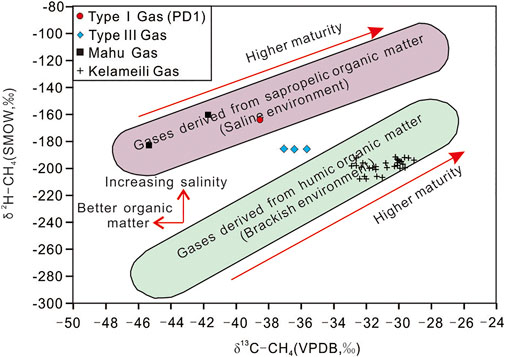
FIGURE 6. The δ13C-CH4 vs. δ2H-CH4 plot of natural gas in the Junggar Basin (diagram modified after Wang et al., 2015).
5.2.2 Type II Gas
As mentioned in Section 5.1, the Type II gas is a highly mature coal-type gas generated from the humic source rock. Unfortunately, however, three sets of humic source rocks (i.e., J1–2, P2w, and Carboniferous) developed in the study area (Figure 5), which brought added complications in identifying the gas source.
In northwestern China, the J1–2 source rock is a set of high-quality coaly source rock, and a large number of giant gas fields related to the J1–2 source rock were discovered (Dai et al., 2009, 2014). Some researchers once pointed out that the study area’s natural gas was mainly generated from the J1–2 source rock (Dai et al., 2009; Li et al., 2009). In this study, the limiting thermal evolution conditions of the four sets of source rocks were simulated (Figure 7A) based on a pseudo well in the deepest part of the Pengyijingxi Sag (for well location see Figure 1C). When the Lower Jurassic Badaowan (J1b) source rock reached the maximum burial depth, it was still in the immature–low mature stage (Ro = 0.5%–0.7%) (Figure 7A). In other words, this set of source rock in the study area has never entered the main oil generation window, let alone the main gas generation window. Therefore, the contribution of J1–2 source rock was excluded.

FIGURE 7. Burial history and geothermal evolution history of (A) virtual well and (B) Well SX16 in the Pengyijingxi Sag.
Type II gas from Wells MS1, SD2, and LD1 were produced from the Carboniferous reservoirs (Table 1). The P2x was interbedded between the Carboniferous and P2w with a thickness of approximately 200 m in Well MS1. Besides, the gas-producing zone was approximately 400 m lower from the top Carboniferous in Well MS1. Moreover, Permian strata were absent in the area where Well SD2 and Well LD1 were drilled. Therefore, it is inferred from geological conditions that the Type II gas was derived from the Carboniferous source rock rather than from the P2w source rock. Previous studies have shown that the natural gas of the Kelameili gas field in the eastern Junggar Basin was generated from the Carboniferous source rock (Sun et al., 2016; Gong et al., 2019a, Gong et al., 2019b, Gong et al., 2021). It shared similar δ13C ratios with the Type II gas (Figure 4), further supporting our conclusion.
5.2.3 Type III Gas
Generally, the δ13Ckerogen values of P2w source rocks were more enriched in 13C than Carboniferous source rocks, although the former has a broader distribution range (Figure 5). The δ13Ckerogen ratios revealed that the P2w source rock has more terrigenous organic input and poorer kerogen type (Hunt et al., 1996). When the maturities of natural gas were similar (the C1/∑C1–4 ratios were similar) (Table 1), the δ13C-CH4 values of natural gas generated from the P2w source rocks should theoretically be more enriched in 13C than those generated from the Carboniferous source rocks (Liu et al., 2008b; Gai et al., 2018). However, the actual condition was just the opposite (Figure 4). We also noticed that a small number of P2w source rock samples had relatively 13C-depleted δ13Ckerogen values (–28‰ to –25‰) (Figure 5). Thus, the contribution to Type III gas by P2w source rock could not be totally excluded, entirely based on δ13Ckerogen values (Figure 5).
However, evidence from the fluid inclusions further precluded the significant contribution from the P2w source rock. SX16 was a high yield well drilled in 2011 in the study area (Figure 1C). The producing layer was the Carboniferous volcanic rocks, and the daily gas production was 86.27 × 10³ m3. Abundant oil and gas inclusions and associated contemporaneous brine inclusions were detected in the calcite-filled fractures in the producing interval (Figure 8). Through microscopic observation, one period of oil charging and one period of gas charging were identified. The oil inclusions mainly emitted blue or blue-green fluorescence (Figures 8A,B). Most natural gas inclusions are circular/oval-shaped and appear black under transmitted light with no fluorescence (Figures 8C,D). The homogenization temperature of the brine inclusions associated with natural gas inclusions ranged from 92.7 to 106.6°C. Combined with the thermal evolution history of Well SX16, the natural gas filling period was mainly the Late Cretaceous (Figure 7B). At that time, the deepest P2w source rock in the Pengyijingxi Sag was still in the main oil generation window (Ro = 1.0%–1.3%) and had not entered the gas generation stage (Figure 7A). On the contrary, the P1f and Carboniferous source rocks had entered a high mature–overmature stage in the deep part of the sag (Figure 7A). They could have generated a large amount of natural gas, which accumulated in suitable traps. Therefore, type III gas was most likely a mixture of natural gases generated from the P1f and Carboniferous source rocks.
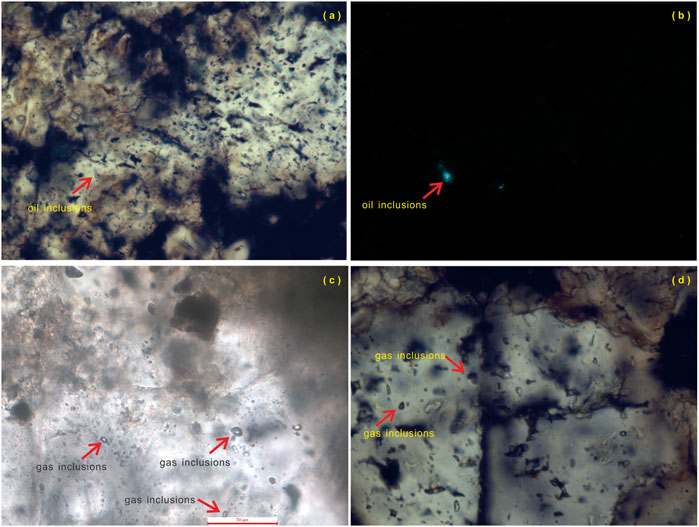
FIGURE 8. Micrographs of fluid inclusions in the Carboniferous reservoir of Well SX16 ((A,C,D) under plane polarized light; (B) under fluorescence).
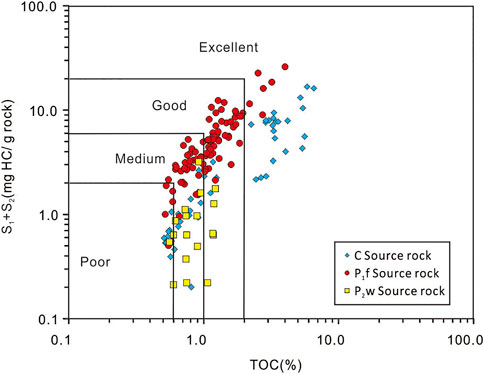
In addition, the TOC, S1 + S2, and hydrogen index (HI) of P2w source rock were 0.1%–1.2% (0.5% on average), 0.08–3.16 mg HC/g rock (0.82 mg HC/g rock on average), and 7–103 mg HC/g TOC (53 mg HC/g TOC on average), respectively, indicating poor source rock–non-source rock (Figure 9). The P2w source rock had a hydrocarbon generation capacity far inferior to P1f and Carboniferous source rocks (Figure 9). Thus, it did not have the potential to form a large-scale natural gas field (reservoir).
Based on the hypotheses, it was believed that Type III gas was a mixture of natural gas generated from the Carboniferous and P1f source rocks. The mixing gas (Type III) had δ13C-CH4 values between Type I and Type II gases (Figure 4; Table 1). The δ13C ratios of C2–4 of Type III gas were relatively 13C-enriched, similar to those of Type II natural gas (Figure 4; Table 1). Under similar maturity, the oil-type gas usually had a lower content of C2–4 than the coal-type gas (Dai et al., 1992; Whiticar, 1994; Liu Q et al., 2019), causing the δ13C ratios of C2–4 gas in type III to be closer to those in type II, rather than in Type I gas.
The evidence from hydrogen isotopes further confirmed our conclusion. The δ2H-CH4 values of three samples from Peng5 gas field were –186‰, –185‰ and –186‰, respectively (Figure 6; Table 2), which was significantly different from those of gases generated from the fresh (humic) source rocks such as Carboniferous or P2w (Wang et al., 2013). The three samples were located in the transitional area between the coal-type gas (from fresh humic source rock) and oil-type gas (from saline sapropelic source rock) (Figure 6). Considering the number and planar distribution of the samples, the Type III natural gas constituted the main part of the natural gas in the hinterland.
However, recent researches indicated that Well JT 1 in the Shawan Sag has encountered high-quality P2w source rocks with their TOC, HI and δ13Ckerogen being 4.15%, 671 mg HC/g TOC and –28.6‰, respectively (Zhi et al., 2021; Gong et al., 2022). Thus, the locally developed high-quality P2w source rocks cannot be excluded in the hinter land of Junggar Basin. Since the P2w source rock has entered condensate-generating period in the Pengyijingxi Sag nowadays (Figure 3A), it may also made some contribution to the Type III gas.
5.2.4 Type IV Gas
Compared with the δ13C ratio of C2–4 gas, methane is generally more sensitive to the change of maturity (Stahl and Carey, 1975; Dai et al., 1992; Berner and Faber 1996). Thus, the Δδ13C-(CH4 – C2H6) ratio is often used to reflect the maturity of natural gas (Prinzhofer and Huc, 1995; Dai et al., 2014; Wu et al., 2019). For primary thermogenic gas, the increase of Δδ13C-(CH4 – C2H6) reflected the increase of maturity. However, with the increase of Δδ13C-(CH4 – C2H6), the ln(C1/C2) of Type IV gas showed a decreasing trend, which was not in line with the characteristics of primary thermogenic gas (Figure 10A).
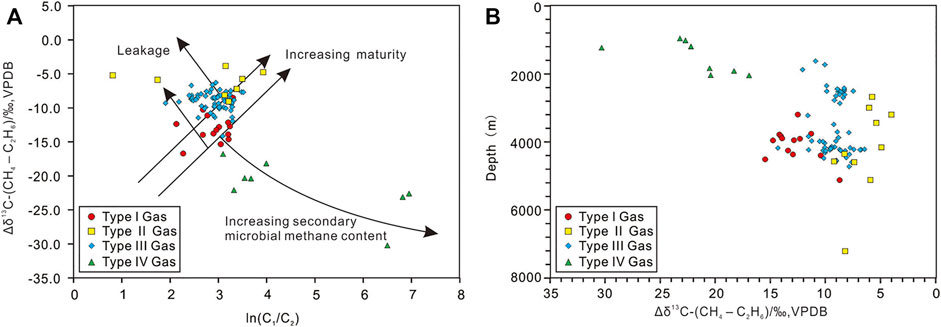
FIGURE 10. Cross plots of (A) Δδ13C-(CH4 – C2H6) vs. ln(C1/C2) (the chart is modified after Prinzhofer and Huc, 1995), and (B) depth vs. Δδ13C-(CH4 – C2H6) of natural gas in the hinterland of Junggar Basin.
We believe that Type IV gas was mainly a secondary microbial gas. Natural gas generated via bacterial alteration of organic matter is called primary microbial gas, whose δ13C-CH4 values are generally lower than –55‰ to –60‰ (James and Burns, 1984). The δ13C-CH4 of Type IV natural gas was more enriched in 13C than this threshold (Table 1). Secondary microbial gas refers to the natural gas formed by the biodegradation (anaerobic biodegradation in most cases) of crude oil (Head et al., 2003; Etiope et al., 2009; Milkov, 2010; Milkov, 2011). Generally, secondary microbial gas has the following characteristics: 1) δ13C-CO2 > +2‰; 2) Natural gas is associated with biodegraded crude oil; 3) δ13C-CH4 = –55‰ to –35‰; 4) High methane content; 5) Low reservoir temperature (<70–90°C); 6) The reservoirs are mostly sandstone formations with high porosity and permeability; and 7) The reservoirs are usually characterized by normal pressures with poor sealing conditions (Bernard et al., 1992; Milkov, 2010; Milkov, 2011).
The crude oil associated with Type IV gas is generally subjected to biodegradation (Figure 11). The 25-norhopanes are formed by the loss of methyl group at C–10 position of hopanes via the alteration of microorganisms (Seifert and Moldowan, 1979). Their appearance has been widely used as a sign of severe biodegradation to crude oil (Moldowan et al., 1984; Tian et al., 2012). In the study area, abundant C28 and C29 25-norhopane were detected in the m/z 177 mass chromatogram of crude oil associated with the Type IV gas, indicating that the crude oil had suffered severe biodegradation (Figure 11). In addition, when crude oil was subjected to biodegradation, the compounds with strong resistance to biodegradation formed bulges (i.e., unresolved complex mixtures, UCM) in gas chromatography of saturated hydrocarbons or FID diagram (Killops and Al-Juboori, 1990; Gouch et al., 1992; Hu S. Z. et al., 2020). Noticeable UCM bulges were observed in the FID diagram in the current samples, which also reflected the biodegradation of crude oil (Figure 11).
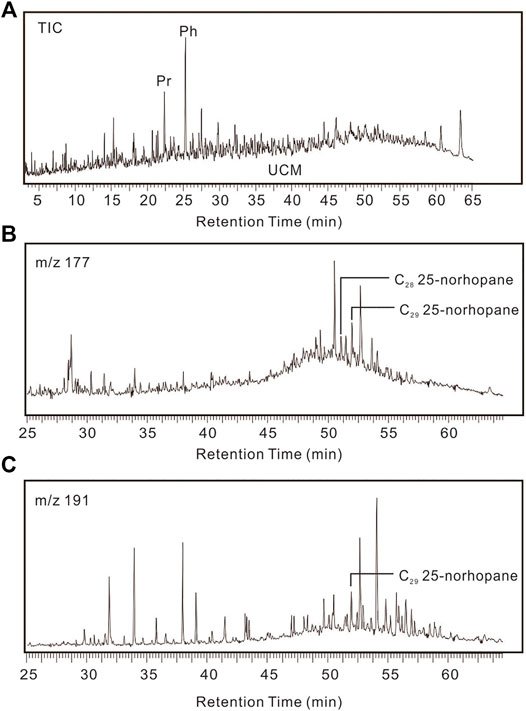
FIGURE 11. Biomarker characteristics of crude oil associated with Type IV gas in Well L103. (A) TIC; (B) m/z 177; (C) m/z 191.
The δ13C-CH4 and C1/∑C1-4 ratios of Type IV gas were –54.8‰ to –43.2‰ (–48.7‰) and 0.93–1.0 (0.97 on average), respectively, which are well in accordance with those of the typical secondary microbial gas (Table 1). The gas-producing zones of Type IV gas had favorable physical properties, with their porosity and permeability being 20.7%–31.0% (24.9% on average) and 313 × 10−3 μm2–4,760 × 10−3 μm2 (1,180.6 × 10−3 μm2 on average), respectively. All gas-producing zones had normal pressures, with the formation pressure coefficients (obtained by the DST test) being 0.77–1.04 (0.92 on average). The burial depths of the producing zones were 960–2,041.5 m. Assuming the current surface temperature was 20°C and the geothermal gradient was 22.3°C/km (Qiu, 2002; Wang et al., 2013), the current formation temperatures were 41.4–65.5°C (Figure 10B; Table 1). Although δ13C-CO2 data were not obtained in this study, considering other characteristics, the Type IV gas was identified as a secondary microbial gas in this study。
It should be noted that laboratory simulation and field examples showed that the main component of the pure secondary microbial gas was methane, and the content of C2–4 gas was extremely low (Pallasser, 2000; Milkov and Dzou, 2007; Jones et al., 2008). However, a certain amount of C2–4 gas components were found in Type IV natural gas (Table 1), indicating the gases were also mixed with a small amount of thermogenic gas.
5.3 Secondary Alteration of Natural Gas
5.3.1 Biodegradation
Bacteria may alter C1–4 gaseous hydrocarbons in gas reservoirs (Davis, 1967; Whiticar, 1994; Clayton et al., 1997; Pallasser, 2000). In most cases, the alteration on C2–4 gas components tends to be more prominent (James and Burns, 1984). The selective degradation of a specific gas component by bacteria will reduce its relative content. At the same time, as 12C is less stable than 13C, it is often degraded first, resulting in a more 13C-enriched δ13C ratio of natural gas (Dai et al., 1992; Galimov, 2006). The carbon isotopic reversal of ethane and propane were observed in natural gas in Wells L102 and M11, with Δδ13C-(C2H6 – C3H8) values being 2.0 and 0.08‰, respectively (Figure 12A). Meanwhile, the C2/C3 ratios of the two samples were relatively low, at 2.25 and 1.76, respectively (Figure 12A). The above characteristics inferred that the ethane was selectively degraded by bacteria.
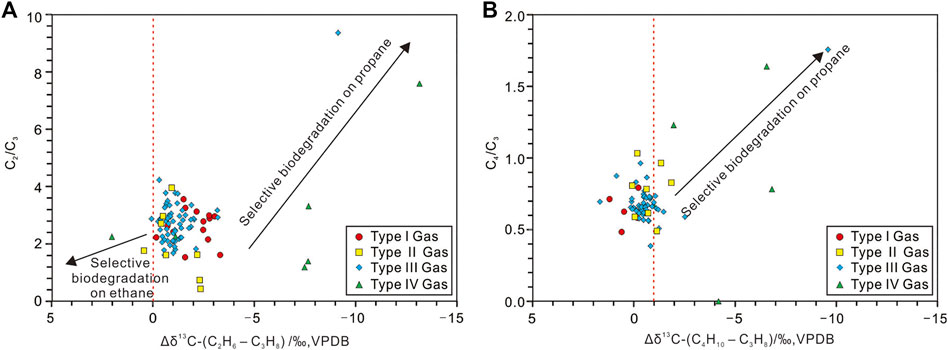
FIGURE 12. Cross plots of (A) Δδ13C-(C2H6 – C3H8) vs. C2/C3 and (B) Δδ13C-(C4H10 – C3H8) vs. C4/C3 of natural gas in the hinterland of Junggar Basin.
Similarly, some samples had significant carbon isotopic reversal between propane and butane [Δδ13C-(C4H10 – C3H8) < 1‰], accompanied by a decrease in C4/C3 ratio (Figure 12B). The propane in this part of the natural gas was selectively degraded by bacteria. This process also resulted in the abnormal decrease of Δδ13C-(C2H6 – C3H8) (<–5‰) and the increase of C2/C3 in these natural gas (Figure 13A; Table 1). We noted differences in the degraded gas components in different samples, which may be caused by different types of bacterial strains involved in the degradation processes (Connan et al., 1996; Wilkes et al., 2000; Gong et al., 2017). Moreover, some natural gas samples also displayed δ13C-C3H8 and δ13C-C4H10 inversion, but the amplitude was relatively small (<1‰), and the C4/C3 ratio had not increased significantly (Figure 12B). The carbon isotopic reversal of these samples was more likely caused by the mixing of natural gas with different maturity or different geneses (Dai et al., 2004; Liu et al., 2016).
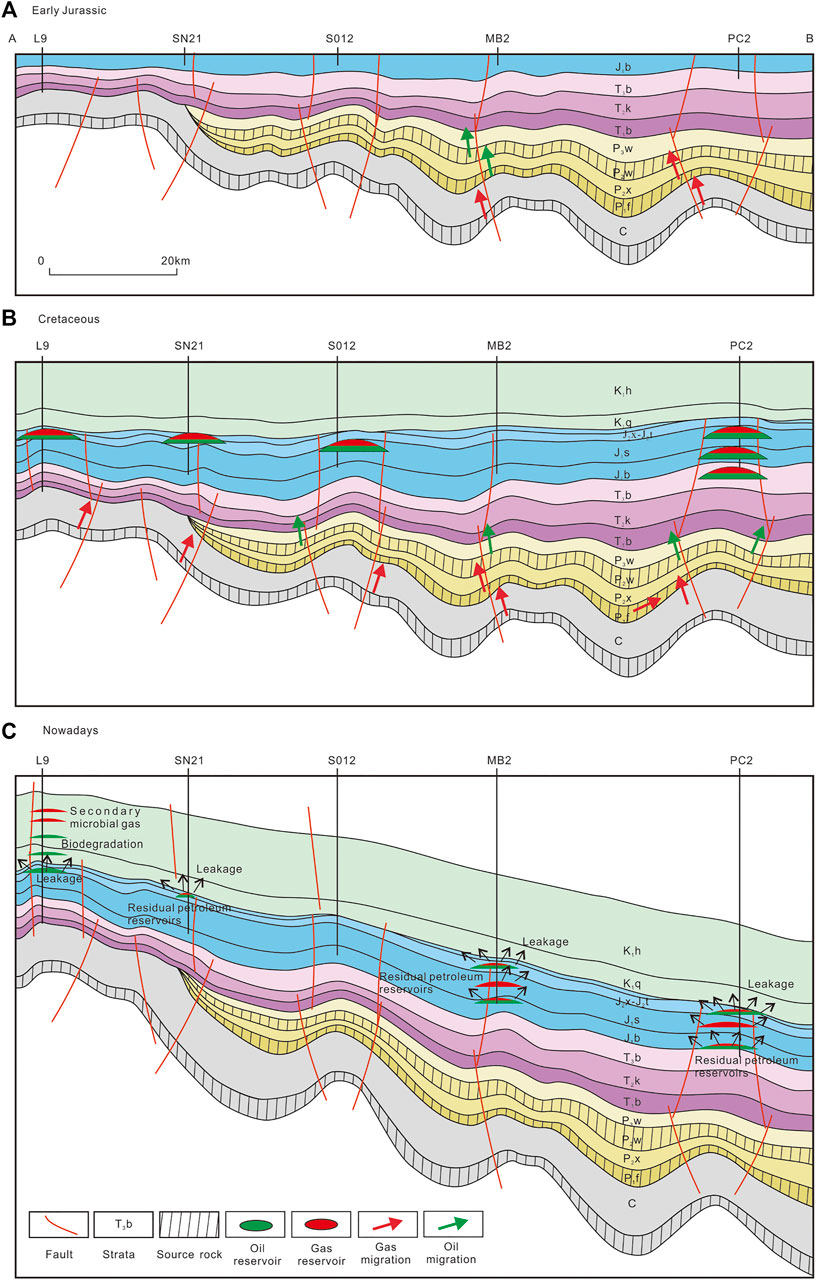
FIGURE 13. Accumulation model of natural gas in (A) early Jurassic, (B) Cretaceous, and (C) nowadays in the hinterland of Junggar Basin.
5.3.2 Gas Leakage
Gas leakage often occurs in the reservoir when the sealing condition is poor. In this case, the gases in the leakage phase will be rich in methane, and its δ13C ratios tend to be depleted in 13C (Prinzhofer and Huc, 1995). In contrast, the residual gas in the reservoir tends to show lower C1/C2 ratio and higher δ13C-CH4 values [decreasing δ13C-(CH4 – C2H6) values] (Prinzhofer and Huc, 1995). As shown in Figure 10A, considerable part of natural gas in the study area deviated from the evolution trend of primary thermogenic gas and showed the characteristics of residual phase gas after leakage. Thus, the leakage process reflected a poor preservation condition of gas reservoirs in the study area, and intense modifications occurred after the formation of these reservoirs. Wells LN6 and SD10 are two typical examples. The extremely low C1/C2 values in natural gases (Table 1) indicated that the two gas reservoirs had been completely destroyed after reconstruction. Furthermore, the oil test data showed that LN6 and SD10 only produced more than 100 m3 of natural gas per day, which also confirmed our analysis.
5.4 Gas Accumulation Process
From the Late Permian to the Early Triassic, the Carboniferous and P1f source rocks in the Penyijingxi Sag became mature successively (Figure 6B). During the Jurassic, the P1f source rock had entered the stage of generating condensate/wet gas, while the Carboniferous source rock began generating dry gas (Figure 7A). The early natural gas reservoirs were formed at that time. It is speculated that gases derived from the Carboniferous source rock account for most (Figure 13A). During the same time, the P2w source rock was still in the early stage of the oil generation window (Figure 7A), which corresponded to the early crude oil filling reflected by fluid inclusions (Figure 7B).
During the Late Cretaceous, the P1f source rock also entered the gas generating peak. The generated oil-type gas and the coal-type gas from the Carboniferous source rock constituted the main body of natural gas in the hinterland of the Junggar Basin (Figure 13B). The process corresponded to the second stage of natural gas filling reflected by fluid inclusions (Figure 7B). At that time, the P2w source rock entered the late stage of the oil generation window and was still dominated by oil generation (Figure 7A).
During the Himalayan period, the Junggar Basin totally tilted southward, resulting in different degrees of adjustment or destruction of early formed petroleum reservoirs (Figure 13C). This process resulted in a widespread leakage in gas reservoirs in the hinterland (Figure 10A and Figure 13C). Meanwhile, some oil reservoirs suffered severe biodegradation (Figure 13C), with the residual crude oil generally rich in 25-norhopane (Figure 11). During the biodegradation process, a large amount of secondary microbial gas (Type IV gas) was formed, and the latter accumulated in suitable traps (Figure 13C).
6 Conclusion
Four types of natural gas have been identified in the hinterland of the Junggar Basin. The Type I gas was derived from the P1f saline lacustrine source rock in the Pengyijingxi Sag. It had relatively 13C-depleted δ13C ratios with an average C1/ƩC1–4 value of 0.92. The δ2H ratios of Type I gas were enriched in 2H. Type II gas was coal-type gas derived from the Carboniferous source rock. It had relatively 13C-enriched δ13C ratios with C1/ƩC1–4 values mainly varying from 0.90 to 0.95. The Type III natural gas was a mixture of Type I and Type II gases, which constituted the main part of the natural gas in the study area. The Type IV gas was a secondary microbial gas generally occurring in the shallow reservoirs (960–2,041.5 m), with the δ13C-CH4 values and C1/ƩC1–4 ratios being –54.8‰ to –43.2‰ and 0.96, respectively. Abundant 25-norhopane and UCM bulges were found in its associated crude oil. One period of oil charging and one period of gas charging were identified in the study area. The homogenization temperature range of the latter was 92.7–106.6°C, corresponding to the gas generation peak of P1f and Carboniferous source rocks (Late Cretaceous). Affected by the late tectonic movements, some gas reservoirs were damaged and adjusted, and natural gas leakage and biodegradation widely occurred.
The research results shifted the focus of natural gas exploration in the study area from the petroleum systems associated with the P2w source rocks to those associated with the P1f and Carboniferous source rocks. This is of great significance for natural gas exploration in the Junggar Basin. When the geochemical characteristics alone cannot accurately determine the gas genesis, the geological characteristics of the gas reservoir can often be used as an effective auxiliary tool.
Data Availability Statement
The original contributions presented in the study are included in the article/supplementary material, further inquiries can be directed to the corresponding author.
Author Contributions
DZ: Conceptualization, Resources, Project administration; XW: Writing Original Draft, Formal analysis; ZQ: Writing Original Draft, Formal analysis, Methodology.
Funding
This work is funded by Chinese National Natural Science Foundation (No. 41802177).
Conflict of Interest
Authors DZ, XW, and ZQ were employed by the company Xinjiang Oilfield Company. Author DZ was employed by the company Turpan-Hami Oilfield Company.
Publisher’s Note
All claims expressed in this article are solely those of the authors and do not necessarily represent those of their affiliated organizations, or those of the publisher, the editors and the reviewers. Any product that may be evaluated in this article, or claim that may be made by its manufacturer, is not guaranteed or endorsed by the publisher.
References
Bernard, F. P., Connan, J., and Magot, M. (1992). “Indigenous Microorganisms in Connate Water of Many oil Fields: A New Tool in Exploration and Production Techniques,” in 67th Annual Technical Conference and Exhibition of the Society of Petroleum Engineers, Washington, DC, October, 1992. (Washington, DC: SPE Paper), 467–476.
Berner, U., and Faber, E. (1996). Empirical Carbon Isotope/maturity Relationships for Gases from Algal Kerogens and Terrigenous Organic Matter, Based on Dry, Open-System Pyrolysis. Org. Geochem. 24, 947–955. doi:10.1016/s0146-6380(96)00090-3
Cao, J., Wang, X., Sun, P. a., Zhang, Y., Tang, Y., Xiang, B., et al. (2012). Geochemistry and Origins of Natural Gases in the central Junggar Basin, Northwest China. Org. Geochem. 53, 166–176. doi:10.1016/j.orggeochem.2012.06.009
Cao, J., Xia, L., Wang, T., Zhi, D., Tang, Y., and Li, W. (2020). An Alkaline lake in the Late Paleozoic Ice Age (LPIA): A Review and New Insights into Paleoenvironment and Petroleum Geology. Earth-Science Rev. 202, 103091. doi:10.1016/j.earscirev.2020.103091
Chen, Z., Cao, Y., Ma, Z., and Zhen, Y. (2014). Geochemistry and Origins of Natural Gases in the Zhongguai Area of Junggar Basin, China. J. Pet. Sci. Eng. 119, 17–27. doi:10.1016/j.petrol.2014.05.007
Chen, J., Wang, X., Ni, Y., Xiang, B., Liao, F., Liao, J., et al. (2019). Genetic Type and Source of Natural Gas in the Southern Margin of Junggar Basin, NW China. Pet. Exploration Development 46, 482–495. doi:10.1016/s1876-3804(19)60029-7
Clayton, C. J., Hay, S. J., Baylis, S. A., and Dipper, B. (1997). Alteration of Natural Gas during Leakage from a North Sea Salt Diapir Field. Mar. Geology. 137, 69–80. doi:10.1016/s0025-3227(96)00080-1
Connan, J., Lacrampe-Coulome, G., and Magot, M. (1996). “Origin of Gases in Reservoirs,” in Proceedings of the 1995 International Gas Research Conference. Editor D. Dolenc (Rockville: Government Institutes), 21–62.
Dai, J. X., Pei, X. G., and Qi, H. F. (1992). Natural Gas Geology of China. Beijing: Petroleum Industry Press, 46–50. (in Chinese with English abstract).
Dai, J., Xia, X., Qin, S., and Zhao, J. (2004). Origins of Partially Reversed Alkane δ 13 C Values for Biogenic Gases in China. Org. Geochem. 35, 405–411. doi:10.1016/j.orggeochem.2004.01.006
Dai, J., Zou, C., Li, J., Ni, Y., Hu, G., Zhang, X., et al. (2009). Carbon Isotopes of Middle-Lower Jurassic Coal-Derived Alkane Gases from the Major Basins of Northwestern China. Int. J. Coal Geology. 80, 124–134. doi:10.1016/j.coal.2009.08.007
Dai, J., Gong, D., Ni, Y., Huang, S., and Wu, W. (2014). Stable Carbon Isotopes of Coal-Derived Gases Sourced from the Mesozoic Coal Measures in China. Org. Geochem. 74, 123–142. doi:10.1016/j.orggeochem.2014.04.002
Dai, J. X., Zou, C. N., Li, W., and Hu, G. Y. (2016). Giant Coal-Derived Gas Fields and Their Gas Sources in China. New York: Academic Press.
Etiope, G., Feyzullayev, A., Milkov, A. V., Waseda, A., Mizobe, K., and Sun, C. H. (2009). Evidence of Subsurface Anaerobic Biodegradation of Hydrocarbons and Potential Secondary Methanogenesis in Terrestrial Mud Volcanoes. Mar. Pet. Geology. 26, 1692–1703. doi:10.1016/j.marpetgeo.2008.12.002
James, A. T., and Burns, B. J. (1984). Microbial Alteration of Subsurface Natural Gas Accumulations. Am. Assoc. Petroleum Geol. Bull. 68, 957–960.
Gai, H., Tian, H., and Xiao, X. (2018). Late Gas Generation Potential for Different Types of Shale Source Rocks: Implications from Pyrolysis Experiments. Int. J. Coal Geology. 193, 16–29. doi:10.1016/j.coal.2018.04.009
Galimov, E. M. (2006). Isotope Organic Geochemistry. Org. Geochem. 37, 1200–1262. doi:10.1016/j.orggeochem.2006.04.009
Gong, D., Ma, R., Chen, G., Ma, W., Liao, F., Fang, C., et al. (2017). Geochemical Characteristics of Biodegraded Natural Gas and its Associated Low Molecular Weight Hydrocarbons. J. Nat. Gas Sci. Eng. 46, 338–349. doi:10.1016/j.jngse.2017.07.027
Gong, D., Li, J., Ablimit, I., He, W., Lu, S., Liu, D., et al. (2018). Geochemical Characteristics of Natural Gases Related to Late Paleozoic Coal Measures in China. Mar. Pet. Geology. 96, 474–500. doi:10.1016/j.marpetgeo.2018.06.017
Gong, D., Song, Y., Wei, Y., Liu, C., Wu, Y., Zhang, L., et al. (2019a). Geochemical Characteristics of Carboniferous Coaly Source Rocks and Natural Gases in the Southeastern Junggar Basin, NW China: Implications for New Hydrocarbon Explorations. Int. J. Coal Geology. 202, 171–189. doi:10.1016/j.coal.2018.12.006
Gong, D. Y., Lan, W. F., Xiang, H., Ding, J., Wu, W. A., and Hu, Z. L. (2019b). Genetic Types and Origins of Natural Gases from the Eastern Junggar basin. J. China Univ. Mining Technology 48 (01), 142–152. (in Chinese with English abstract).
Gong, D. Y., Wang, X. L., Zhou, C. M., Zheng, M. L., Jiang, W. L., and Wu, W. A. (2021). Discovery of Large-Scale Carboniferous Source Rocks and Natural Gas Exploration Potential in the Southeast of Junggar Basin. Acta Petrolei Sinica 42, 836–852. (in Chinese with English abstract).
Gong, D. Y., Zhao, C. Y., He, W. J., Zhao, L., Kong, Y. M., Ma, L. Y., et al. (2022). Genetic Types and Exploration Potential of Natural Gas at Northwestern Margin of Junggar Basin. Oil Gas Geology. 43, 162–175. (in Chinese with English abstract).
Gouch, M. A., Rhead, M. M., and Rowland, S. J. (1992). Biodegradation Studies of Unresolved Complex Mixtures of Hydrocarbons: Model UCM Hydrocarbons and the Aliphatic UCM. Org. Geochem. 18, 17–22. doi:10.1016/0146-6380(92)90139-o
He, D. F., Zhang, L., Wu, S. T., Li, D., and Zhen, Y. (2018). Tectonic Evolution Stages and Features of the Junggar Basin. Oil Gas Geol. 39, 845–861. (in Chinese with English abstract).
Head, I. M., Jones, D. M., and Larter, S. R. (2003). Biological Activity in the Deep Subsurface and the Origin of Heavy Oil. Nature 426, 344–352. doi:10.1038/nature02134
Hu, S. Y., Wei, Y. J., Dong, D. Z., Li, F., and Wang, Y. M. (2006). Control of Fault Activity on Hydrocarbon in central Junggar Basin. Acta Petrolei Sinica 27, 1–7. (in Chinese with English abstract).
Hu, S. Y., Wang, X. J., Cao, Z. L., Li, J. Z., Gong, D. Y., and Xu, Y. (2020). Formation Conditions and Exploration Direction of Large and Medium Gas Reserviors in the Junggar Basin, NW China. Petrol. Explor. Dev. 47 (1), 1–13. doi:10.1016/s1876-3804(20)60045-3
Hu, S. Z., Li, S. F., Wang, J. H., and Cao, J. (2020). Origin of Unresolved Complex Mixtures (UCMs) in Biodegraded Oils: Insights from Artificial Biodegradation Experiments. Fuel 231, 53–60.
Jones, D. M., Head, I. M., Gray, N. D., Adams, J. J., Rowan, A. K., Aitken, C. M., et al. (2008). Crude-oil Biodegradation via Methanogenesis in Subsurface Petroleum Reservoirs. Nature 451, 176–180. doi:10.1038/nature06484
Killops, S. D., and Al-Juboori, M. A. H. A. (1990). Characterisation of the Unresolved Complex Mixture (UCM) in the Gas Chromatograms of Biodegraded Petroleums. Org. Geochem. 15, 147–160. doi:10.1016/0146-6380(90)90079-f
Li, Z. H., Tang, L. J., Ding, W. L., and Yao, S. P. (2002). Fault Characteristic Analysis for the Hinterland of Junggar Basin. Petrol. Explor. Dev. 29, 40–42. (in Chinese with English abstract).
Li, J., Jiang, Z., Luo, X., Wang, D., and Han, Z. (2009). Geochemical Characteristics of Coalmeasure Source Rocks and Coal-Derived Gas in Junggar Basin, NW China. Pet. Exploration Development 36, 365–374.
Li, L., Chen, S. J., Yang, D. S., Lu, J. G., Zhao, K. B., and Xu, H. M. (2011). Petroleum Origin and Source in Shidong Area, Junggar Basin. Pet. Geology. Exp. 33, 536–538. (in Chinese with English abstract).
Liao, J. D., Wang, X. L., Xiang, B. L., Cheng, X. S., Liu, C. M., Ling, Y., et al. (2004). Oil and Gas Origin and Reservoir Analyses of Mosuowan Region in Junggar Basin. Nat. Gas Industry 24, 15–18. (in Chinese with English abstract).
Liu, Q., Dai, J., Li, J., and Zhou, Q. (2008a). Hydrogen Isotope Composition of Natural Gases from the Tarim Basin and its Indication of Depositional Environments of the Source Rocks. Sci. China Ser. D-earth Sci. 51, 300–311. doi:10.1007/s11430-008-0006-7
Liu, Q., Qin, S., Li, J., Liu, W., Zhang, D., Zhou, Q., et al. (2008b). Natural Gas Geochemistry and its Origins in Kuqa Depression. Sci. China Ser. D-earth Sci. 51, 174–182. doi:10.1007/s11430-008-5003-3
Liu, Q., Dai, J., Jin, Z., Li, J., Wu, X., Meng, Q., et al. (2016). Abnormal Carbon and Hydrogen Isotopes of Alkane Gases from the Qingshen Gas Field, Songliao Basin, China, Suggesting Abiogenic Alkanes? J. Asian Earth Sci. 115, 285–297. doi:10.1016/j.jseaes.2015.10.005
Liu, G., Wei, Y. Z., Chen, G., Jia, K. F., Gong, D. Y., Wang, F., et al. (2019). Genetic Mechanism and Distribution Characteristics of Jurassic–Cretaceous Secondary Reservoirs in the Hinterland of Junggar Basin. Acta Petrolei Sinica 35, 914–927. (in Chinese with English abstract).
Liu, Q., Wu, X., Wang, X., Jin, Z., Zhu, D., Meng, Q., et al. (2019). Carbon and Hydrogen Isotopes of Methane, Ethane, and Propane: A Review of Genetic Identification of Natural Gas. Earth-Science Rev. 190, 247–272. doi:10.1016/j.earscirev.2018.11.017
Lu, J. G., Chen, Y. Y., Wang, L., Yao, Y. T., Chen, S. J., Yang, D. S., et al. (2014). Origin and Source of Oil and Gas in Lunan Area of Junggar Basin. Acta Petrolei Sinica 35, 429–438. (in Chinese with English abstract).
Milkov, A. V., and Dzou, L. (2007). Geochemical Evidence of Secondary Microbial Methane from Very Slight Biodegradation of Undersaturated Oils in a Deep Hot Reservoir. Geol 35, 455–458. doi:10.1130/g23557a.1
Milkov, A. V. (2010). Methanogenic Biodegradation of Petroleum in the West Siberian basin (Russia): Significance for Formation of Giant Cenomanian Gas Pools. Bulletin 94, 1485–1541. doi:10.1306/01051009122
Milkov, A. V. (2011). Worldwide Distribution and Significance of Secondary Microbial Methane Formed during Petroleum Biodegradation in Conventional Reservoirs. Org. Geochem. 42, 184–207. doi:10.1016/j.orggeochem.2010.12.003
Moldowan, J. M., Seifert, W. K., Arnold, E., and Clardy, J. (1984). Structure Proof and Significance of Stereoisomeric 28,30-bisnorhopanes in Petroleum and Petroleum Source Rocks. Geochimica et Cosmochimica Acta 48, 1651–1661. doi:10.1016/0016-7037(84)90334-x
Ni, Y. Y., Ma, Q. S., Ellis, G., Dai, J. X., Katz, B., Zhang, S. C., et al. (2011). mFundamental Studies on Kinetic Isotope Effect (KIE) of Hydrogen Isotope Fractionation in Natural Gas Systems. Geochimica et Cosmochimica Acta 75, 2270–2696. doi:10.1016/j.gca.2011.02.016
Pallasser, R. J. (2000). Recognising Biodegradation in Gas/oil Accumulations through the δ 13 C Compositions of Gas Components. Org. Geochem. 31, 1363–1373. doi:10.1016/s0146-6380(00)00101-7
Peters, K. E. (1986). Guidelines for Evaluating Petroleum Source Rock Using Programmed Pyrolysis. AAPG Bull. 70, 318–329. doi:10.1306/94885688-1704-11d7-8645000102c1865d
Prinzhofer, A. A., and Huc, A. Y. (1995). Genetic and post-genetic Molecular and Isotopic Fractionations in Natural Gases. Chem. Geology. 126, 281–290. doi:10.1016/0009-2541(95)00123-9
Qi, X. F., Wu, X. Z., and Liu, D. G. (2010). The Deep Structural Features and Hydrocarbon prospect in Hinterland of Junggar Basin. Xinjiang Pet. Geology. 31, 111–114. (in Chinese with English abstract).
Qiu, N. S., Zha, M., and Wang, X. L. (2000). Simulation of Geothermal Evolution History in Junggar Basin. Xinjing Pet. Geol. 21, 39–41. (in Chinese with English abstract).
Qiu, N. S., Wang, X. L., Yang, H. B., and Xiang, Y. (2001). The Characteristics of Temperature Distribution in the Junggar Basin. Chin. J. Geology. 36, 350–358. (in Chinese with English abstract).
Qiu, N. S. (2002). Characters of thermal Conductivity and Radiogenic Heat Production Rate in Basins of Northwest China. Chin. J. Geology. 37, 196–206. (in Chinese with English abstract).
Schoell, M. (1980). The Hydrogen and Carbon Isotopic Composition of Methane from Natural Gases of Various Origins. Geochimica et Cosmochimica Acta 44, 649–661. doi:10.1016/0016-7037(80)90155-6
Schoell, M. (1984). Recent Advances in Petroleum Isotope Geochemistry. Org. Geochem. 6, 645–663. doi:10.1016/0146-6380(84)90086-x
Seifert, W. K., and Michael Moldowan, J. (1979). The Effect of Biodegradation on Steranes and Terpanes in Crude Oils. Geochimica et Cosmochimica Acta 43, 111–126. doi:10.1016/0016-7037(79)90051-6
Song, (1996). The Geological Characteristics of Natural Gas Accumulations in the Junggar Basin. Beijing: Petroleum Industry Press. (in Chinese).
Stahl, W. J., and Carey, B. D. (1975). Source-rock Identification by Isotope Analyses of Natural Gases from fields in the Val Verde and Delaware Basins, West Texas. Chem. Geology. 16, 257–267. doi:10.1016/0009-2541(75)90065-0
Sun, P. A., Wang, X. L., Tang, Y., Wan, M., and Cao, J. (2012). Geochemical Constraints on the Multiple Origins of Shallow-Buried Natural Gases in the Junggar Basin. Geochimica 41, 109–121. (in Chinese with English abstract).
Sun, P. a., Wang, Y., Leng, K., Li, H., Ma, W., and Cao, J. (2016). Geochemistry and Origin of Natural Gas in the Eastern Junggar Basin, NW China. Mar. Pet. Geology. 75, 240–251. doi:10.1016/j.marpetgeo.2016.04.018
Sweeney, J. J., and Burnham, A. K. (1990). Evaluation of a Simple Model of Vitrinite Reflectance Based on Chemical Kinetics. AAPG (Am. Assoc. Pet. Geol. Bull. 74, 1559–1570. doi:10.1306/0c9b251f-1710-11d7-8645000102c1865d
Tao, K., Cao, J., Wang, Y., Ma, W., Xiang, B., Ren, J., et al. (2016). Geochemistry and Origin of Natural Gas in the Petroliferous Mahu Sag, Northwestern Junggar Basin, NW China: Carboniferous marine and Permian Lacustrine Gas Systems. Org. Geochem. 100, 62–79. doi:10.1016/j.orggeochem.2016.08.004
Tian, H., Cheng, P., Zhou, Q., Xiao, X., and Wilkins, R. W. T. (2012). A Complete Series of C31-C34 25-norbenzohopanes in the Devonian and Jurassic Bitumen Sands, NW Sichuan Basin. Org. Geochem. 45, 1–6. doi:10.1016/j.orggeochem.2012.01.003
Wang, S. J., Hu, S. B., and Wang, J. Y. (2000a). The Characteristics of Heat Flow and Geothermal fields in Junggar Basin. Chin. J. Geophys. 43, 771–779. (in Chinese with English abstract). doi:10.1002/cjg2.98
Wang, S., Hu, S., Li, T., Wang, J., and Zhao, W. (2000b). Terrestrial Heat Flow in Junggar Basin, Northwest China. Chin.Sci.Bull. 45, 1808–1813. doi:10.1007/bf02886273
Wang, X. L., Zhi, D. M., Wang, Y. T., Chen, J. P., and Qin, Z. J. (2013). Organic Geochemistry of Source Rocks and Hydrocarbons in the Junggar Basin. Beijing: Petroleum Industry Press. (in Chinese).
Wang, X., Liu, W., Shi, B., Zhang, Z., Xu, Y., and Zheng, J. (2015). Hydrogen Isotope Characteristics of Thermogenic Methane in Chinese Sedimentary Basins. Org. Geochem. 83-84, 178–189. doi:10.1016/j.orggeochem.2015.03.010
Whiticar, M. J. (1994). “Correlation of Natural Gases with Their Sources,” in The Petroleum System – from Source to Trap. Editors L. Magoon, and W. Dow (AAPG Memoir 60), 261–284.
Wilkes, H., Boreham, C., Harms, G., Zengler, K., and Rabus, R. (2000). Anaerobic Degradation and Carbon Isotopic Fractionation of Alkylbenzenes in Crude Oil by Sulphate-Reducing Bacteria. Org. Geochem. 31, 101–115. doi:10.1016/s0146-6380(99)00147-3
Wu, X. H., Yin, H. S., and Wang, C. S. (2003). Oil and Gas Sources from the Luliang Oil Field in the Junggar Basin, Xinjiang. Sediment. Geology. Tethyan Geology. 23, 96–102. (in Chinese with English abstract).
Wu, X., Liu, Q., Liu, G., and Ni, C. (2019). Genetic Types of Natural Gas and Gas-Source Correlation in Different Strata of the Yuanba Gas Field, Sichuan Basin, SW China. J. Asian Earth Sci. 181, 103906. doi:10.1016/j.jseaes.2019.103906
Xia, L., Cao, J., Hu, W., Zhi, D., Tang, Y., Li, E., et al. (2021). Coupling of Paleoenvironment and Biogeochemistry of Deep-Time Alkaline Lakes: A Lipid Biomarker Perspective. Earth-Science Rev. 213, 103499. doi:10.1016/j.earscirev.2020.103499
Xiang, B., Zhou, N., Ma, W., Wu, M., and Cao, J. (2015). Multiple-stage Migration and Accumulation of Permian Lacustrine Mixed Oils in the central Junggar Basin (NW China). Mar. Pet. Geology. 59, 187–201. doi:10.1016/j.marpetgeo.2014.08.014
Yang, Y. T., Wang, S. J., Pei, D. H., and Xing, Y. (2002). An Analysis of Deep Hydrocarbon Accumulation Conditions and Exploratory Realms in the Heartland of Junggar Basin. Explor. Dev. 29, 32–34. (in Chinese with English abstract).
Keywords: Junggar Basin, natural gas, stable carbon isotope, stable hydrogen isotope, fluid inclusion, hydrocarbon accumulation process
Citation: Zhi D, Wang X and Qin Z (2022) Geneses, Sources and Accumulation Process of Natural Gases in the Hinterland of the Junggar Basin. Front. Earth Sci. 10:843245. doi: 10.3389/feart.2022.843245
Received: 25 December 2021; Accepted: 03 February 2022;
Published: 28 February 2022.
Edited by:
Yunyan Ni, Research Institute of Petroleum Exploration and Development (RIPED), ChinaReviewed by:
Qingtao Wang, Guangzhou Institute of Energy Testing, ChinaJianping Chen, Research Institute of Petroleum Exploration and Development (RIPED), China
Bin Cheng, China University of Petroleum, Qingdao, China
Copyright © 2022 Zhi, Wang and Qin. This is an open-access article distributed under the terms of the Creative Commons Attribution License (CC BY). The use, distribution or reproduction in other forums is permitted, provided the original author(s) and the copyright owner(s) are credited and that the original publication in this journal is cited, in accordance with accepted academic practice. No use, distribution or reproduction is permitted which does not comply with these terms.
*Correspondence: Dongming Zhi, ZG9uZ21pbmdfemhpQDEyNi5jb20=
 Dongming Zhi
 Xiaojun Wang1