 Zhanlei Wang1,2Bingzheng Guo3Chan Jiang4Lin Qi5Yuqiang Jiang1,2*
 Yifan Gu1,2Yonghong Fu1,2Demin Liang1
- 1School of Geoscience and Technology, Southwest Petroleum University, Chengdu, China
- 2The Unconventional Reservoir Evaluation Department, PetroChina Key Laboratory of Unconventional Oil and Gas Resources, Chengdu, China
- 3PetroChina Coalbed Methane Company, Beijing, China
- 4Exploration Division, PetroChina Southwest Oil and Gas Field Company, Chengdu, China
- 5Geology Exploration and Development Research Institute, CNPC Chuanqing Drilling Engineering Co., Ltd., Chengdu, China
The Lower Permian Shanxi Formation in the Eastern Ordos Basin is a set of transitional facies shale, and it is also a key target for shale gas exploration in China. Based on lithofacies classification by X-ray diffraction and kerogen type identification, nanoscale reservoir space, pore volume, pore size distribution, surface area, and fractal characterization were studied using comprehensive methods including N2 and CO2 adsorption, mercury injection capillary pressure, field emission-scanning electron microscopy (FE-SEM), and nuclear magnetic resonance. The results indicate that Shanxi Formation shale can be subdivided into five types of lithofacies: clayey shale (lithofacies I), siliceous clayey shale (lithofacies II), siliceous shale (lithofacies IV), calcareous siliceous shale (lithofacies V), and siliceous calcareous shale (lithofacies VI). Lithofacies V and lithofacies VI are the best lithofacies in terms of organic pore morphology, connectivity, and development degree, followed by lithofacies II. Inorganic pores and microfractures are well developed in all lithofacies. The majority of pores in lithofacies I comprise organic mesopores, but pore volume is contributed by a few inorganic macropores. The pore types and pore volume contributors of lithofacies II are organic macropores. The pore size distribution of lithofacies IV is very similar to that of lithofacies I. The pore size distribution of lithofacies V shows typical bimodal characteristics. It is suggested that the inorganic pores of lithofacies V are mainly macropores, which have the greatest contribution to pore volume, followed by organic mesopores. Total organic carbon (TOC) and thermal maturity do not present obvious controls on pore structure. Vitrinite is the main kerogen type in lithofacies II and IV, and this is associated with disfavored morphology, low connectivity, and poor development degree of organic pores. In contrast, sapropelinite is observed in other shale lithofacies, and it is suggested to be an effective kerogen type that contributes to better development of organic pores.
Introduction
Marine–continental transitional facies shale is an important field of unconventional oil and gas exploration in China, which accounts for 25% of shale gas resources in China (Kuang et al., 2020). It has a wide distribution area and great resource potential (Yang et al., 2017). However, the exploration, development, and geological evaluation of marine–continental transitional facies shale gas are still in the initial stage and require further improvement (Zhang et al., 2018; Dong et al., 2021). Although transitional facies shale including Shanxi Formation shale is characterized by large cumulative thickness, high organic matter abundance, and large exploration potential (Liang et al., 2018), its changeable sedimentary environment, complex mineral composition, and multiple sources of organic matter lead to more complex nanoscale pore characteristics than marine shale. Many study cases of marine shale suggested organic matter abundance is the main factor controlling nanoscale pore structure (Huo et al., 2020), while the mineral composition and diagenetic intensity are indicated to play a secondarily important role in determining the pore structure (Wang et al., 2019; Jia et al., 2020). Therefore, it is of great significance for exploration evaluation and development plan-making to clarify different shale lithofacies types and pore structure characteristics. However, previous studies on transitional facies shale focus on the characteristics of shale gas reservoirs such as total organic carbon (TOC) content, mineral composition, pore type, and gas content (Li et al., 2019). Meanwhile, many studies have been carried out on the sedimentary environment, sedimentary model, and high-quality lithofacies types of transitional facies shale (Luo et al., 2018; Liu et al., 2018), but systematic studies on pore structure of nanoscale pore system is rare. Liu et al. (2020) proposed that there are about 20–30% organic pores in the shale of Shanxi Formation. The pore diameter is generally less than 100 nm, mainly distributed in the range of 2–50 nm. Wu et al. (2021) proposed that Type II2 kerogen is the key factor leading to better nanopore structure of favorable lithofacies than other lithofacies in Shanxi Formation transitional shale.
On the basis of the above understanding, the purpose of this work is to provide the nanoscale pore characteristics of different lithofacies of the Lower Permian Shanxi Formation shale in Eastern Ordos Basin. Qualitative evaluation of pore and microfracture characteristics is obtained by field emission-scanning electron microscopy (FE-SEM) and nuclear magnetic resonance (NMR) analyses. Quantitative evaluation of pore volume (PV), surface area (SA), and pore size distribution (PSD) is obtained by N2 and CO2 gas adsorption and mercury injection capillary pressure (MICP) analyses. Moreover, the fractal dimensions of pores were calculated from nitrogen adsorption data and interpreted to discuss the complexity and heterogeneity of pore structure and assume controlling factors of pore structure.
Geological Setting
The study area is located in the eastern Ordos Basin (Figures 1A, B). As a part of Ordos Basin, the study area experienced multiple episodes of regression event, accompanied by deposition of marine, transitional, and continental sediments during the Late Carboniferous to the Middle Permian (Chen et al., 2011). The Lower Permian Shanxi Formation, as the target of this study, is in conformable contact with both the underlying Taiyuan Formation and the overlying Shihezi Formation (Figure 1C) (Li et al., 2019). The top of the Taiyuan Formation is suggested to be formed in the open platform sedimentary environment of the shallow shelf facies (Kuang et al., 2020), because it is lithologically dominated by the micritic bioclastic limestone with normal-size fusulinid, echinoderms, and brachiopods as the main bioclastic particles. During the sedimentary period of Early Permian Shanxi Formation, the study area is dominated by marine–continental transitional sedimentary environment consisting of tide-dominated estuarine bay facies and tide-dominated delta facies (Wu et al., 2021). The bottom of Shihezi Formation is mainly medium sandstone, indicating braided river systems (Li et al., 2018; Kuang et al., 2020).
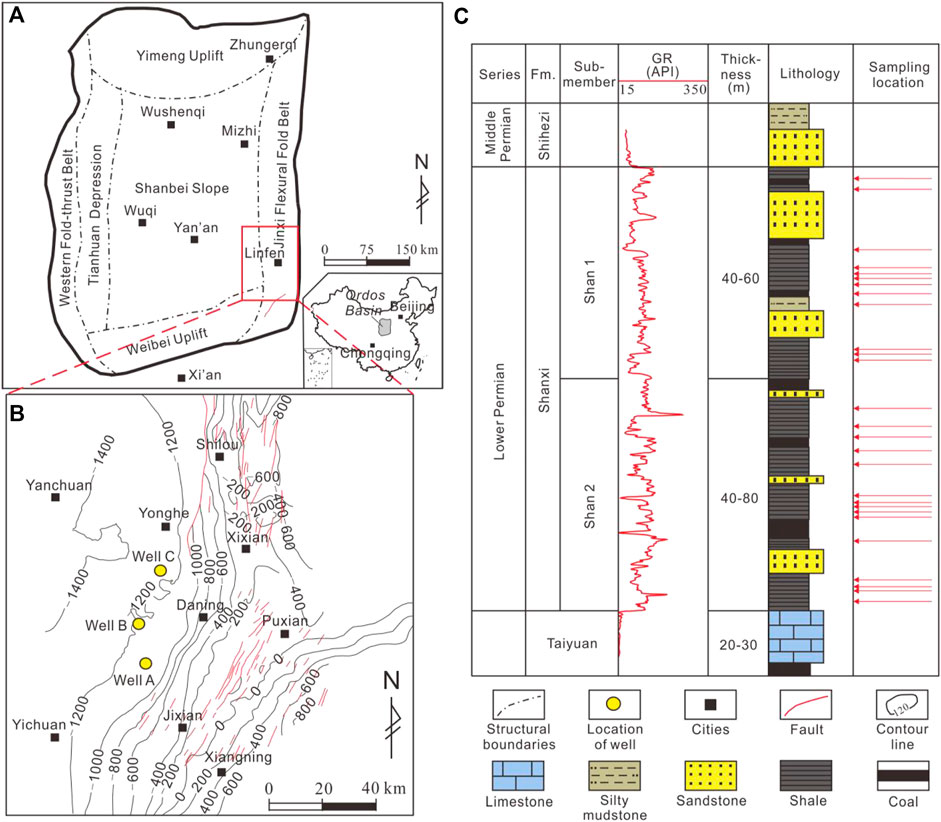
FIGURE 1. (A) Location of study area, North China. (B) Distribution map showing the burial depth of Shanxi Formation. (C) Generalized stratigraphy of Eastern Ordos Basin.
Sample and Method
A total of 175 core samples of Shanxi Formation shale were collected from Wells A, B, and C for thin-section identification, X-ray diffraction, and TOC measurement. The whole-rock and clay mineral X-ray diffraction analysis was completed at the PetroChina Research Institute of Petroleum Exploration and Development on a Japan-made physical-science X-ray diffractometer. TOC analysis was performed at the Unconventional Experimental Center of CNOOC Energy Development Co. Ltd using a CS744-MHPC carbon/sulfur analyzer. Ten core-plug samples of different shale lithofacies were implemented with NMR analysis in both dry and saturated fluid states (including n-dodecane and brine) using a c12-010 V low-field NMR device manufactured by the Suzhou Newmai Company. Mercury intrusion was performed using a Quantachrome Poremaster. Samples were prepared to have an approximate size of 20 mm × 20 mm, weighed out to 10–20 g, and then dried at 110°C for at least 24 h under vacuum in an oven. The mercury injection pressure ranged from 0 to 215 MPa in this experiment. The remaining samples were divided into three parts for maceral identification after kerogen extraction, FE-SEM identification, and N2 and CO2 adsorption experiments. N2 and CO2 adsorption experiments were carried out by crushing the sample into 60–80 mesh, dried in an oven at 110°C for 12 h, and then placed in the Autosorb-IQ3 specific surface and PSD analyzer manufactured by the Cantor Company of the United States. The pretreatment was completed by degassing at 110°C for 12 h in the vacuum condition, and then nitrogen carbon adsorption was carried out. After the experiment, the Brunauer–Emmett–Teller (BET) model was used to calculate the specific SA, and the Barrett–Joyner–Halenda (BJH) model was employed to obtain the PSD and volume. The pore size was divided into three categories according to the pore size classification scheme (Loucks et al., 2012), namely, micropores (<2 nm), mesopores (2–50 nm), and macropores (>50 nm). Hysteresis loops were observed at the relative pressure (P/PO) of approximately 0.5 in adsorption–desorption curves, which indicates the presence of great differences in pore size and pore morphology among shale samples that cause such adsorption behaviors at this pressure. This relative pressure was set as the threshold to divide the transitional facies shale into two groups. The first group with P/PO = 0–0.5 is subjected to the monolayer–multilayer adsorption process controlled by van der Waals force, while the second group with P/PO = 0.5–1.0 experiences the capillary condensation adsorption process controlled by surface tension (Wang M. et al., 2015; Sun et al., 2015). In this paper, the Frenkel–Halsey–Hill (FHH) model is used to calculate the fractal dimensions of these two groups of samples separately, which are denoted as D2 and D1 for the first and second groups, respectively.
Results
Lithofacies Classification
Lithofacies refers to the mineral composition, color, grain size distribution, and other characteristics of sedimentary rocks (Wang and Carr 2012), which is importantly helpful for the reconstruction of depositional processes and environments (Singh et al., 2009; Jiang et al., 2013). The lithofacies is divided according to the following steps: 1) clay >75%, divided into clayey shale (lithofacies I) using contents of clay, carbonate, and siliceous (quartz + feldspar) minerals as three end members; 2) according to RQC (ratio of siliceous mineral/carbonate mineral) (Jiang et al., 2016), the lithofacies with clay mineral content <75% are divided into siliceous clayey shale (lithofacies II), calcareous clayey shale (lithofacies III), siliceous shale (lithofacies IV), calcareous siliceous shale (lithofacies V), siliceous calcareous shale (lithofacies VI), and calcareous shale (lithofacies VII), while the non-shale facies are siliceous rock (lithofacies VIII) and carbonate rock (lithofacies IX). As shown in Figure 2, Shanxi Formation shale of the study area comprises lithofacies I, II, IV, V, and VI. There were no positive correlations between the contents of siliceous minerals and TOC in all samples (Figure 3A) and no negative correlations between the contents of clay minerals and TOC (Figure 3B). Therefore, the main source of siliceous materials in Shanxi Formation shale is not of biogenic origin (Liu et al., 2017; Huo et al., 2020).
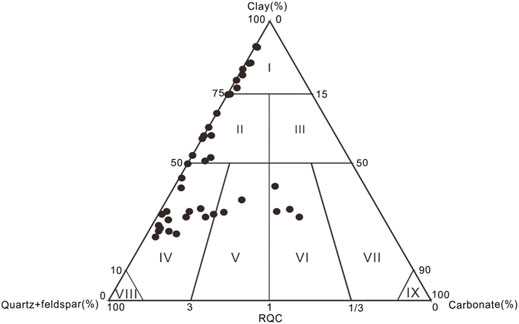
FIGURE 2. Ternary plot for Shanxi Formation shale lithofacies classification.
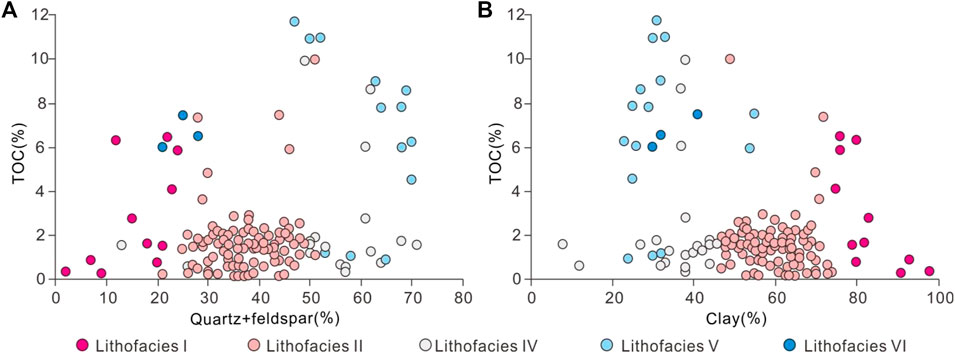
FIGURE 3. (A) Correlations between siliceous mineral and TOC content. (B) Correlations between clay mineral and TOC content.
Qualitative Description of Reservoir Space Morphology
Organic and Inorganic Pores
There are obvious differences in pore morphology and development degree of organic pores among different shale lithofacies. Very few organic pores are developed in the lithofacies I, and they are mainly rounded small pores (Figure 4A), with the pore size ranging from 20 to 50 nm (Figure 4B). Organic pores in lithofacies II are more abundant than those in lithofacies I (Figure 4C), and they are mostly crescent-shaped, with a pore size range of 100–400 nm (Figure 4D). The organic pores of lithofacies IV are rarely developed (Figure 4E), and they are all rounded small pores with a pore size of only 20–50 nm (Figure 4F). Organic pores in lithofacies V and lithofacies VI are the most developed (Figure 4G), with beaded organic pores of hundreds of nanometers (Figure 4H).
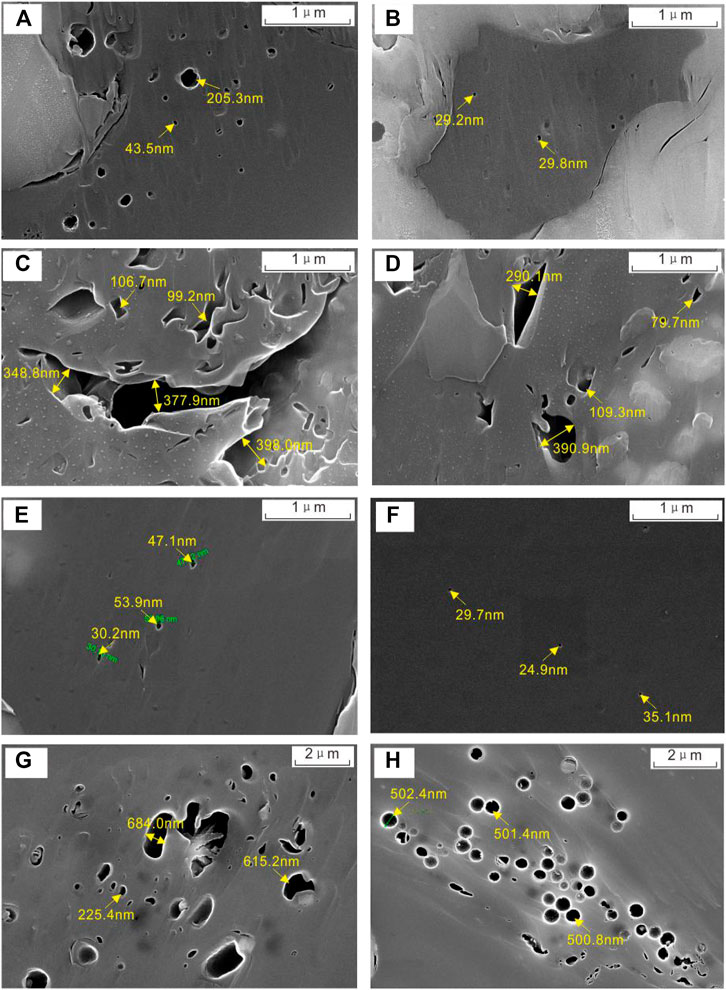
FIGURE 4. FE-SEM images of organic pores in Shanxi Formation transitional facies shale. (A),(B) Organic matter contained some rounded organic matter pores with small sizes (20–50 nm size), and larger organic pores are about 200 nm, lithofacies I, Well C, 2,180.95 m. (C),(D) Crescent-shaped organic pores ranging from 100 to 400 nm, lithofacies II, Well A, 2,281.5 m. (E),(F) Rounded small pores ranging from 20 to 50 nm, lithofacies IV, Well C, 2,187.91 m. (G),(H) Beaded organic pores ranging from 200 to 700 nm, lithofacies VI, Well A, 2,294.1 m.
Various types of inorganic pores can be observed in different lithofacies, which can be divided into three types: 1) Intergranular pores mainly refer to the residual space between mineral grains after sedimentation or later diagenesis (Ji et al., 2016). They are normally distributed among clay minerals, brittle minerals, and organic matter (Figure 5A), with dominant triangular and polygonal pore shapes under the influence of mineral morphology as well as contact relationship and arrangement (Figure 5B). The good connectivity between intergranular pores can provide a good seepage channel for methane (Ji et al., 2016). 2) Interlaminar pores are mainly formed in the interior of minerals (Figure 5C), and most of them are relatively regular in shape. Flocculent illite interlaminar pores and book-leaf-like chlorite interlaminar pores (Figures 5C, D) are dominant, and they usually occur together. These interlaminar pores can provide large gas storage space, and they contribute significantly to the specific SA and thus adsorption when they are finer than 50 nm (Ji et al., 2012). 3) Intercrystalline pores mainly refer to the pores between grains in mineral aggregates with a diameter range of 5–300 μm (Figure 5F). Due to the widespread development of pyrite, most of these pores appear as microsphere and strawberry-like crystal clusters (Figure 5E). The interior of these pores is composed of many pyrite grains, among which some nanopores are not tightly packed in the process of crystal growth. Moreover, the interior of these pores has certain connectivity, especially in pyrite coarser than 10 μm (Figure 5E). Different from intergranular pores of pyrite in the marine shale (Wang et al., 2019), these in the transitional shale in the study area are not filled with organic matter (Figure 5F).
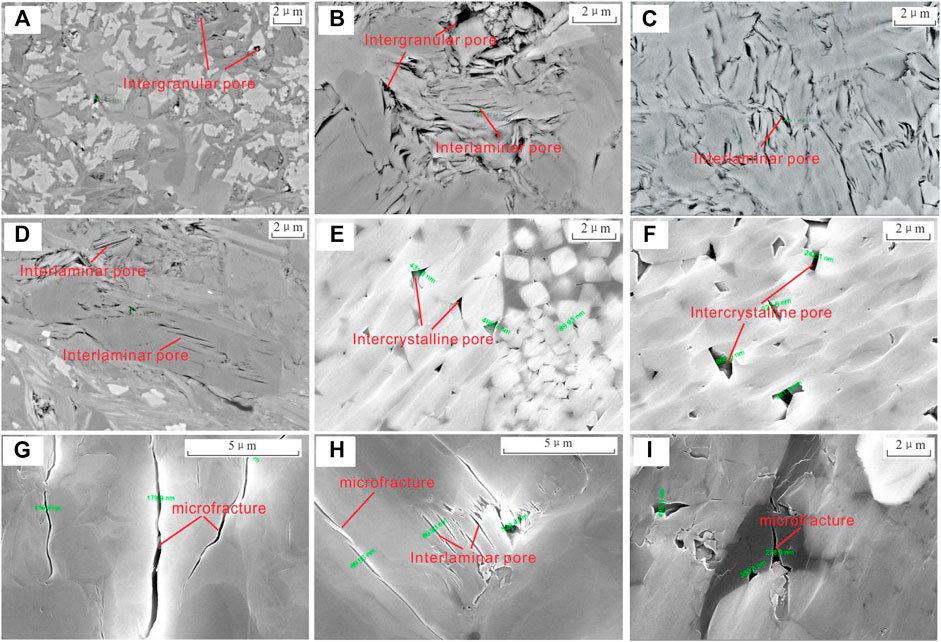
FIGURE 5. FE-SEM images of inorganic pores and microfractures in Shanxi Formation transitional facies shale. (A),(B) Intergranular pores between brittle minerals and clay minerals, Well C, 2,162.08 m. (C),(D) Large number of interlaminar pores in clay minerals, Well C, 2,161.23 m. (E),(F) A large number of intercrystalline pores in pyrite, Well A, 2,281.5 m. (G),(H) Microfracturres in clay minerals, Well A, 2,281 m. (I) Microfracturres inside organic matter, Well A, 2,290.6 m.
Microfracture
The formation of microfractures in the Shanxi Formation transitional facies shale is often related to the late diagenesis of clay minerals and organic matter. Interlaminar microfractures are commonly developed among clay minerals (Figure 5G), which are formed by internal stress caused by water loss, uniform shrinkage, dry cracking, and recrystallization of clay minerals under overlying formation pressure during diagenesis. Their genesis is similar to that of interlaminar pores (Figure 5H). These interlaminar microfractures normally have flat and smooth or slightly curved shapes and good extensibility, with their length of more than 10 μm and width of less than 200 nm (Figure 5G). In addition, a small number of microfractures are produced by hydrocarbon generation in the interior of organic particles, and contraction fractures are developed at the mineral boundaries. In contrast, organic pores are poorly developed (Figure 5I), which can be attributed to the dominance of vitrinite in kerogen (Cao et al., 2018). The width of these microfractures is relatively large, generally in the range of 500–1,000 nm, and the elongation is short, generally several microns (Figure 5I). Microfractures are generally open and can be connected with other types of pores to form complex three-dimensional pore networks, which are conducive to both free gas enrichment and shale gas seepage and migration, thereby playing a key role in the exploitation and development of shale gas.
Development degree of organic pore, inorganic pore, and microfracture.
Organic pores are generally lipophilic, while inorganic pores are mostly hydrophilic (Li et al., 2016). Accordingly, NMR experiments were carried out under water- and oil-saturated conditions, respectively, to observe the signal characteristics on the transverse relaxation time (T2) distribution spectra of two types of pores. The presence of three peaks in the T2 spectra of lipophilic pores indicates three types of organic pores, namely, volumetrically dominant small pores with short T2, large pores with long T2, and microfracture developed in organic matter (Figure 6). The development degree of the three types of lipophilic pores varies significantly in different shale lithofacies, with a higher degree seen in lithofacies V, lithofacies VI, and lithofacies I.
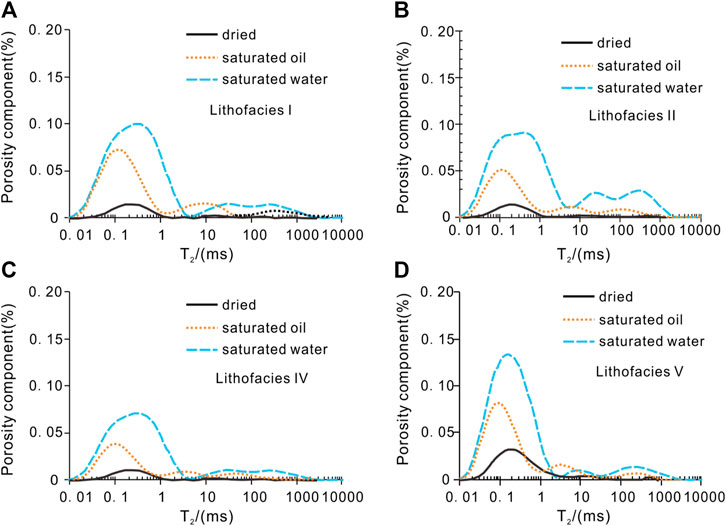
FIGURE 6. NMR T2 spectra under different states for Lithofacies I (A), Lithofacies II (B), Lithofacies IV (C) and Lithofacies V (D).
The main peak at a T2 value of 0.5 ms in the water-saturated condition represents the hydrophilic pores, while the secondary peak stands for the microfractures with large pore sizes and small volumes (Figure 6). The development degree of microfractures significantly varies from one lithofacies to another (Figure 6). Specifically, the development degree of inorganic microfractures is the lowest in lithofacies IV and the highest in lithofacies II. The Image J software was used to scan and identify different pore types in FE-SEM images, and results show that organic pores are the most abundant in lithofacies V and lithofacies VI, with an average proportion of 32.7%, while their proportions in other lithofacies range from 24.8% to 28.6%. Inorganic pores are the most developed in lithofacies IV, accounting for 63.2% on average, while their proportions in other lithofacies vary in the range of 46.3–57.7% (Table 1).
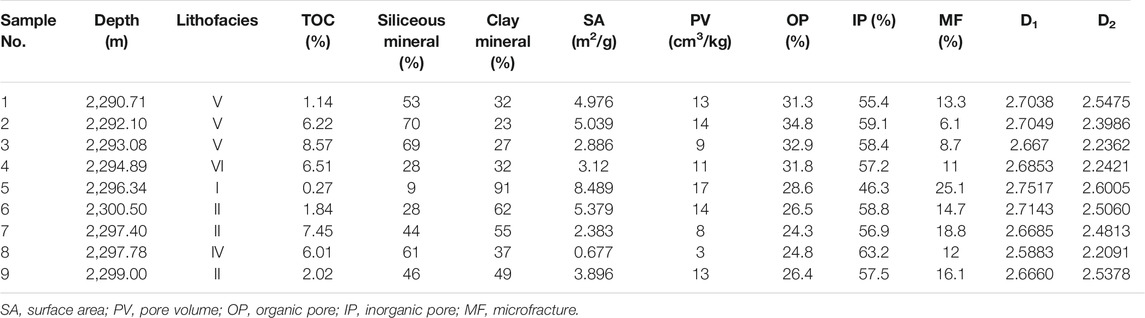
TABLE 1. Main parameters of pore structure of Shanxi Formation transitional facies shale.
Quantitative Analyses of Pore Volume and Pore Size Distribution
N2 Adsorption–Desorption Isotherms and Pore Geometry
Different shale lithofacies present various features in their adsorption–desorption isotherms (Figure 7). Meanwhile, they also share similarities since they all have a certain amount of macropores, which is indicated by the fact that no saturated absorption is reached even when the vapor pressure is saturated (Ji et al., 2016). The unobvious nitrogen adsorption–desorption hysteresis loop of the lithofacies IV (Figure 7A) shows affinity to the H4 type according to the International Union of Pure and Applied Chemistry (IUPAC) classification scheme (Liu et al., 2005). The adsorption and desorption curves of the lithofacies IV are horizontal and parallel to each other in a wide pressure range, indicating the dominance of ink bottle-like macropores with narrow opening and poor connectivity (Chen et al., 2012). The other shale lithofacies have more obvious hysteresis loops (Figure 7), indicating the presence of more open surface pores (Chen et al., 2012).
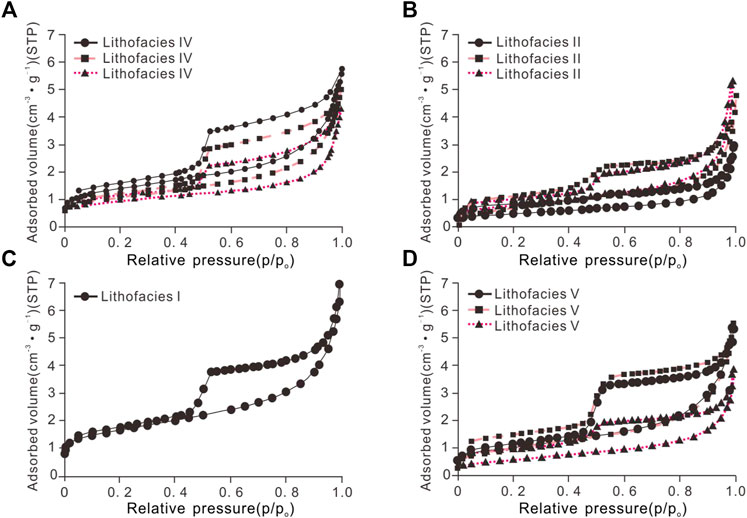
FIGURE 7. The N2 gas adsorption-desorption characteristics for Lithofacies IV (A), Lithofacies II (B), Lithofacies I (C) and Lithofacies V (D).
The hysteresis loop of the lithofacies II is similar to that of the typical H3 type and also carries certain signatures of the H4 type (Figure 7B), which indicates the presence of irregular (amorphous) nanopores. The intergranular pores are featured by their slit-like shapes with parallel walls, which are related to the flaky structure of clay minerals (Han et al., 2007; Sun et al., 2008).
The hysteresis loop of the lithofacies I shows affinity to that of the H3 type and also carries certain signatures of the H2 type (Figure 7C). Various types of pores are found during the scanning electron microscopy (SEM) observations, including slit-like interlaminar pores of clay minerals as well as a certain number of fracture-type and crescent-shaped organic pores (Zhao et al., 2017).
The hysteresis loops of lithofacies V and lithofacies VI are similar to those of both H1 and H3 types (Figure 7D), indicating the presence of relatively developed interlaminar pores and cylindrical organic pores with good opening.
Surface area and pore volume.
The fractal dimension of different lithofacies samples was calculated by using the fractal FHH model, and the results are shown in Table 1 and Figure 8.
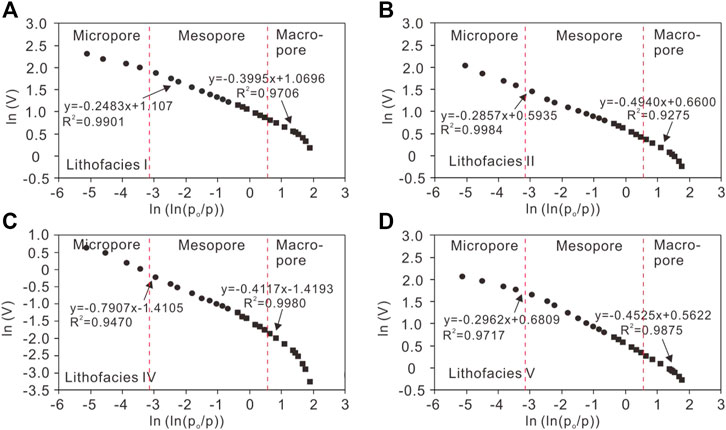
FIGURE 8. Schematic diagram of fractal fitting for Lithofacies I (A), Lithofacies II (B), Lithofacies IV (C) and Lithofacies V (D).
According to the BET model, the specific SA of different shale lithofacies samples were calculated (Table 1). The specific SA of the lithofacies IV is as low as 0.68 m2/g, that of the lithofacies II is 2.38–5.38 m2/g (averaging 3.89 m2/g), that of the lithofacies V and lithofacies VI, 2.89–5.04 m2/g (averaging 4.01 m2/g), and that of the lithofacies I is 8.49–10.50 m2/g (averaging 9.07 m2/g). The total PV of the transitional facies shale in the study area ranges from 3 to 17 cm3/kg (averaging 13.2 cm3/kg), with that of the lithofacies IV the lowest, while the others are all more than 10 cm3/kg (Table 1). The fractal characteristics indicate a strong relationship between the specific SA and D1 as well as a moderate relationship between the specific SA and D2 (Figure 9A). Similar relationships are found between the total PV and the two fractal dimensions (Figure 9B). Therefore, micropores and small pores should have major contributions to the relative SA and the total PV, while large pores and macropores play secondary roles.
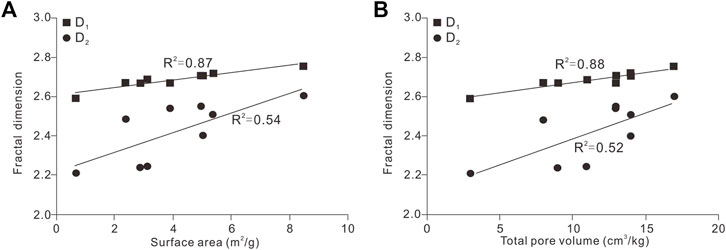
FIGURE 9. (A) Correlation between fractal dimension and surface area. (B) Correlation between fractal dimension and total pore volume.
Pore size distribution.
The PSD was characterized by MICP, CO2, and N2 adsorption. FE-SEM images show that the pores of lithofacies I comprise organic mesopores ranging from 20 to 50 nm (Figures 4A,B), but the PV is contributed by a few macropores ranging from 100 to 800 nm based on PSD (Figure 10A). Most of the macropores contributing PV of lithofacies I are inorganic pores. Organic pores in lithofacies II ranges from 100 to 400 nm (Figures 4C, D). Meanwhile, The PV of lithofacies II is also contributed by the organic macropores in this interval (Figure 10B). The PSD of lithofacies IV is very similar to that of lithofacies I (Figure 4E). Organic pores are micropores with pore sizes ranging from 20 to 50 nm (Figure 4F), but the PV contribution is mainly inorganic macropores (Figure 10C). PSD of lithofacies V shows typical bimodal characteristics. Pores with size ranges of 3–260 nm and >1,000 nm both contribute significantly to the total PV in lithofacies V (Figure 10D). Combined with FE-SEM observation (Figures 4G, H), it is suggested that the inorganic pores of lithofacies V are mainly macropores, which have the greatest contribution to PV, followed by organic mesopores (Figure 10D).
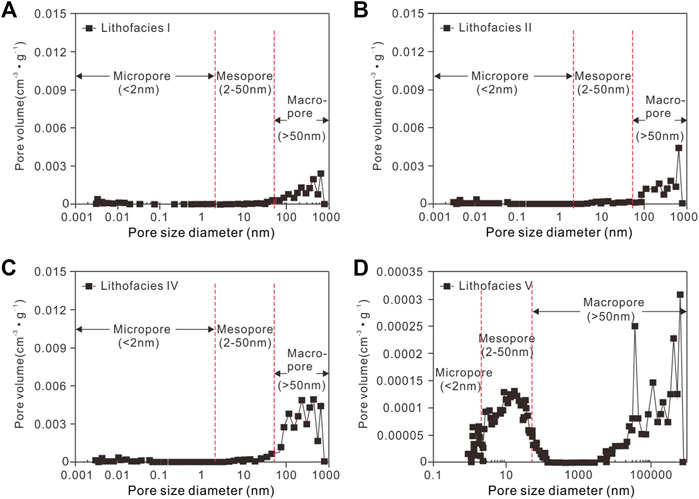
FIGURE 10. Pore size distribution with MICP, CO2, and N2 adsorption for Lithofacies I (A), Lithofacies II (B), Lithofacies IV (C) and Lithofacies V (D).
Discussion
Organic-rich shale is featured by its complex pore structure that is controlled by various geological factors, including diagenesis, mineral composition, TOC content, and organic matter thermal maturity. Among these factors, the influence of thermal maturity is eliminated, since the thermal maturity of the Shanxi Formation transitional shale has already reached 2.58–2.69%, which favors organic pore development (Curtis et al., 2012).
TOC has been suggested in previous studies to be the main factor controlling the pore structure of marine shale in the Longmaxi formation. Specifically, organic matter contributes a lot of micropores and mesopores to the total pores, while clay minerals mainly control the development of mesopores and macropores (Liang et al., 2012; Wang et al., 2019; Huo et al., 2020; Jia et al., 2020). However, this argument is not supported by our correlation analysis. In our analysis, TOC has a reverse or insignificant correlation with the specific SA and total PV (Figure 11A), no correlation with the total PV (Figure 11B), a weak negative correlation with D1 (R2 = 0.30, Figure 11C), and an obvious reverse correlation with D2 (R2 = 0.63, Figure 11C). As shown in various studies on marine–continental transitional shale (Loucks et al., 2012; Wang Z. et al., 2015; Bao et al., 2016; Cao et al., 2018), the existence of vitrinite can result in high TOC contents. However, organic pores are not developed in the interior, even under the condition of suitable maturity, with only some contraction microfractures developed in the interior and at the margin. In lithofacies IV and lithofacies II, vitrinite accounts for 80.5–85.7%, while inertinite takes the remaining proportion, resulting in the fact that TOC has no obvious control effect on the pore structure. In lithofacies V and lithofacies VI as well as lithofacies I, beaded organic pores are greatly developed within the sapropelinite, presenting much better pore structures than those in the other shale lithofacies. Therefore, sapropelinite is speculated to favor the pore structure development.
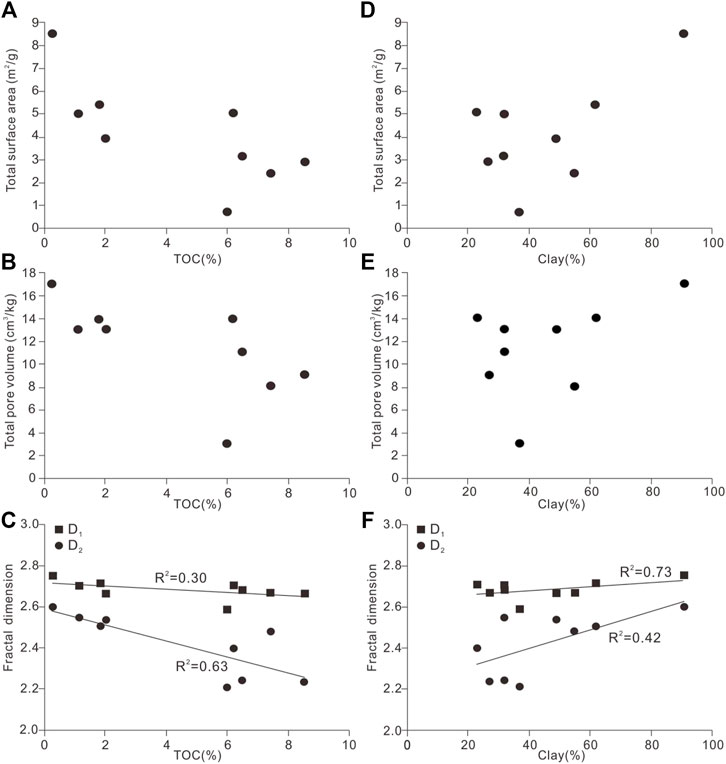
FIGURE 11. (A) Correlations between TOC and total surface area. (B) Correlations between TOC and total pore volume. (C) Correlations between TOC and fractal dimension. (D) Correlations between clay and total surface area. (E) Correlations between clay and total pore volume. (F) Correlations between clay and fractal dimension.
In Shanxi Formation Transitional Facies Shale
Compared with marine shale, the transitional facies shale has higher clay mineral contents as well as more diverse and developed inorganic pore types. The clay mineral content presents a slightly positive correlation with the specific SA (R2 = 0.37, Figure 11D), no significant correlation with the total PV (Figure 11E), a positive correlation with D1 (R2 = 0.73, Figures 11A,F), and a weak positive correlation with D2 (R2 = 0.42, Figure 11F). Therefore, the clay mineral content has overall significant controls on the pore structure of the Shan23 shale, especially on the development of inorganic pores.
Conclusion
1) The Shanxi Formation transitional facies shale is featured by a TOC content of 0.14–11.68%, a high clay mineral content, and dominance of terrigenous quartz as the siliceous source. The transitional facies shale of Shanxi Formation is divided into five lithofacies according to the contents of siliceous minerals, clay minerals, and carbonate minerals, namely, lithofacies I (clayey shale), lithofacies II (siliceous clayey shale), lithofacies IV (siliceous shale), lithofacies V (calcareous siliceous shale), and lithofacies VI (siliceous calcareous shale).
2) Lithofacies V and lithofacies VI are the best lithofacies in terms of organic pore morphology, connectivity, and development degree, followed by lithofacies II and lithofacies IV in descending order. Inorganic pores and microfractures are well developed in all lithofacies. The majority of pores in lithofacies I comprise organic mesopores, but PV is contributed by a few inorganic macropores. Pore types and PV contributors of lithofacies II are organic macropores. The PSD of lithofacies IV is very similar to that of lithofacies I. The PSD of lithofacies V shows typical bimodal characteristics. It is suggested that the inorganic pores of lithofacies V are mainly macropores, which have the greatest contribution to PV, followed by organic mesopores.
3) TOC and organic matter thermal maturity present no obvious control effects on pore structure. Vitrinite is the main organic maceral in siliceous and lithofacies II, and this is associated with disfavored morphology, low connectivity, and poor development degree of organic pores. In contrast, sapropelinite is observed in other shale lithofacies, and it is suggested to be an effective kerogen type that contributes to the better development of organic pores.
Data Availability Statement
The original contributions presented in the study are included in the article/supplementary material, further inquiries can be directed to the corresponding author.
Author Contributions
ZW contributed as the major author of the article. BG conceived the project. CJ, DL, and YJ collected the samples. YG, LQ, and YF analyzed the samples. All authors contributed to the article and approved the submitted version.
Funding
This study was funded by the Science and Technology Cooperation Project of the CNPC-SWPU Innovation Alliance (Grant No. 2020CX030101).
Conflict of Interest
Author BG was employed by PetroChina Coalbed Methane Company. Author CJ was employed by PetroChina Southwest Oil and Gas Field Company. Author LQ was employed by CNPC Chuanqing Drilling Engineering Co., Ltd.
The remaining authors declare that the research was conducted in the absence of any commercial or financial relationships that could be construed as a potential conflict of interest.
The handling editor declared a shared affiliation with authors ZW, YJ, YG, YF, DL at the time of review.
Publisher’s Note
All claims expressed in this article are solely those of the authors and do not necessarily represent those of their affiliated organizations or those of the publisher, the editors, and the reviewers. Any product that may be evaluated in this article, or claim that may be made by its manufacturer, is not guaranteed or endorsed by the publisher.
References
Bao, S., Lin, T., Nie, H., and Ren, S. (2016). Preliminary Study of the Transitional Facies Shale Gas Reservoir Characteristics: Taking Permian in the Xiangzhong Depression as an Example. Earth Sci. Front. 23 (1), 44–53. doi:10.13745/j.esf.2016.01.004
Cao, T., Liu, G., Cao, Q., and Deng, M. (2018). Influence of Maceral Composition on Organic Pore Development in Shale: A Case Study of Transitional Longtan Formation Shale in Eastern Sichuan Basin. Oil Gas Geology. 39 (1), 40–53. doi:10.11743/ogg20180105
Chen, H., Li, J., Zhang, C., Cheng, L., and Cheng, L. (2011). Discussion of Sedimentary Environment and its Geological Enlightenment of Shanxi Formation in Ordos Basin. Acta Petrologica Sinica 27 (8), 2213–2229.
Chen, S., Zhu, Y., Wang, H., Liu, H., Wei, W., and Fang, J. (2012). Structure Characteristics and Accumulation Significance of Nanopores in Longmaxi Shale Gas Reservoir in the Southern Sichuan Basin. J. China Coal Soc. (3), 438–444. doi:10.1016/10.13225/j.cnki.jccs.2012.03.007
Curtis, M. E., Cardott, B. J., Sondergeld, C. H., and Rai, C. S. (2012). Development of Organic Porosity in the Woodford Shale with Increasing thermal Maturity. Int. J. Coal Geology. 103 (23), 26–31. doi:10.1016/j.coal.2012.08.004
Dong, D., Qiu, Z., Zhang, L., Li, S., Zhang, Q., Li, X., et al. (2021). Progress on Sedimentology of Transitional Facies Shales and New Discoveries of Shale Gas. Acta Sedimentologica Sinica 39 (1), 28–44. doi:10.14027/j.issn.1000-0550.2021.002
Han, X., Jiang, X., Wang, D., Cui, Z., and Yu, L. (2007). Effect of Combustion Process on Pore Structure of Oil Shale Ash. Joumal Chem. Industry Engineering(China) 58 (5), 1296–1300. doi:10.2514/1.26230
Huo, J., Gao, J., Guo, X., Yi, J., Shu, Z., Bao, H., et al. (2020). Characteristics and Controlling Factors of Pore Structures of Various Lithofacies in Shales of Longmaxi Formation,eastern Sichuan Basin. Oil Gas Geology. 41 (6), 48–61. doi:10.11743/ogg20200605
Ji, L., Qiu, J., Xia, Y., and Zhang, T. (2012). Micro-pore Characteristics and Methane Adsorption Properties of Common clay Minerals by Electron Microscope Scanning. Acta Petrolei Sinica 33 (2), 249–256. doi:10.7623/syxb201202009
Ji, W., Song, Y., Jiang, Z., Chen, L., Wang, P., Liu, Q., et al. (2016). Micro-nano Pore Structure Characteristics and its Control Factors of Shale in Longmaxi Formation, southeastern Sichuan Basin. Acta Petrolei Sinica 37 (2), 182–195. doi:10.7623/syxb201602004
Jia, A., Hu, D., He, S., Guo, X., Hou, Y., Wang, T., et al. (2020). Variations of Pore Structure in Organic-Rich Shales with Different Lithofacies from the Jiangdong Block, Fuling Shale Gas Field, SW China: Insights into Gas Storage and Pore Evolution. Energy Fuels 34, 12457–12475. doi:10.1021/acs.energyfuels.0c02529
Jiang, Y., Song, Y., Qi, L., Chen, L., Tao, Y., Gan, H., et al. (2016). Fine Lithofacies of China's marine Shale and its Logging Prediction: A Case Study of the Lower Silurian Longmaxi marine Shale in Weiyuan Area, Southern Sichuan Basin, China. Earth Sci. Frontier 23 (1), 107–118. doi:10.13745/j.esf.2016.01.010
Jiang, Z., Liang, C., Wu, J., Zhang, J., Zhang, W., Wang, Y., et al. (2013). Several Issues in Sedimentological Studies on Hydrocarbon-Bearing fine-grained Sedimentary Rocks. Acta Petrolei Sinica 34 (6), 1031–1039. CNKI:SUN:SYXB0.2013-06-001.
Kuang, L., Dong, D., He, W., Wen, S., Sun, S., Li, S., et al. (2020). Geological Characteristics and Development Potential of Transitional Shale Gas in the East Margin of the Ordos Basin, NW China. Pet. Exploration Development 47 (3), 471–482. doi:10.1016/S1876-3804(20)60066-0
Li, J., Jin, W., Wang, L., Wu, Q., Lu, J., and Hao, S. (2016). Quantitative Evaluation of Organic and Inorganic Pore Size Distribution by NMR: A Case from the Silurian Longmaxi Formation Gas Shale in Fuling area,Sichuan Basin. Oil Gas Geology. 37 (1), 129–134. doi:10.11743/ogg20160118
Li, Y., Jia, A., Ji, G., Guo, J., Wang, G., Guo, Z., et al. (2018). Reservoir Architecture of Braided River in Member 8 of Xiashihezi Formation, central-Eastern Ordos Basin. Acta Petrolei Sinica 39 (9), 1037–1050. doi:10.7623/syxb201809008
Li, Y., Yang, J., Pan, Z., Meng, S., Wang, K., and Niu, X. (2019). Unconventional Natural Gas Accumulations in Stacked Deposits: A Discussion of Upper Paleozoic Coal‐Bearing Strata in the East Margin of the Ordos Basin, China. Acta Geologica Sinica ‐ English Edition 93 (1), 111–129. doi:10.1111/1755-6724.1363810.1111/1755-6724.13767
Liang, C., Jiang, Z., Yang, Y., and Wei, X. (2012). Characteristics of Shale Lithofacies and Reservoir Space of the Wufeng-Longmaxi Formation, Sichuan Basin. Pet. Exploration Development 39 (6), 691–698. doi:10.1016/s1876-3804(12)60098-6
Liang, Q., Zhang, X., Tian, J., Sun, X., and Chang, H. (2018). Geological and Geochemical Characteristics of marine-continental Transitional Shale from the Lower Permian Taiyuan Formation, Taikang Uplift, Southern North China Basin. Mar. Pet. Geology. 98, 229–242. doi:10.1016/j.marpetgeo.2018.08.027
Liu, H., Wang, H., Zhang, H., Zhao, W., Liu, Y., and Liu, D. (2020). Geological Characteristics and Exploration Countermeasures of Shale Gas in the Shanxi Formation of the Ordos basin. Acta Geologica Sinica 94 (3), 905–915. doi:10.1111/1755-6724.14302
Liu, H., Wu, S., Jiang, X., Wang, G., Cao, Q., Qiu, P., et al. (2005). The Configuration Analysis of the Adsorption Isothem of Nitrogen in Low Temperature with the lignite Char Produced under Fast Pyrolysis. Joumal China Coal Soc. 30 (4), 507–510. doi:10.3321/j.issn:0253-9993.2005.04.023
Liu, J., Li, Y., Zhang, Y., Liu, S., and Cai, Y. (2017). Evidences of Biogenic Silica of Wufeng-Longmaxi Formation Shale in Jiaoshiba Area and its Geological Significance. J. China Univ. Pet. (Edition Nat. Science) 41 (1), 34–41. doi:10.3969/j.issn.1673-5005.2017.01.004
Liu, S., Wu, C., Li, T., and Wang, H. (2018). Multiple Geochemical Proxies Controlling the Organic Matter Accumulation of the marine-continental Transitional Shale: A Case Study of the Upper Permian Longtan Formation, Western Guizhou, China. J. Nat. Gas Sci. Eng. 56, 152–165. doi:10.1016/j.jngse.2018.06.007
Loucks, R. G., Reed, R. M., Ruppel, S. C., and Hammes, U. (2012). Spectrum of Pore Types and Networks in Mudrocks and a Descriptive Classification for Matrix-Related Mudrock Pores. Bulletin 96 (6), 1071–1098. doi:10.1306/08171111061
Luo, W., Hou, M., Liu, X., Huang, S., Chao, H., Zhang, R., et al. (2018). Geological and Geochemical Characteristics of marine-continental Transitional Shale from the Upper Permian Longtan Formation, Northwestern Guizhou, China. Mar. Pet. Geology. 89, 58–67. doi:10.1016/j.marpetgeo.2017.06.029
Singh, P., Slatt, R., Borges, G., Perez, R., Portas, R., and Marfurt, K. (2009). Reservoir Characterization of Unconventional Gas Shale Reservoirs: Example from the Barnett Shale,Texas,U.S.A. Okla. City Geol. Soc. Shale Shaker 60 (1), 15–31.
Sun, B., Wang, Q., Li, S., Wang, H., and Sun, B. (2008). Analysis of Specific Area and Porous Structure of Oil Shale and Semicoke. J. Power Eng. 28 (1), 163–167. doi:10.3321/j.issn:1000-6761.2008.01.035
Sun, W., Feng, Y., Jiang, C., and Chu, W. (2015). Fractal Characterization and Methane Adsorption Features of Coal Particles Taken from Shallow and Deep Coalmine Layers. Fuel 155, 7–13. doi:10.1016/j.fuel.2015.03.083
Wang, G., and Carr, T. R. (2012). Methodology of Organic-Rich Shale Lithofacies Identification and Prediction: A Case Study from Marcellus Shale in the Appalachian basin. Comput. Geosciences 49, 151–163. doi:10.1016/j.cageo.2012.07.011
Wang, M., Xue, H., Tian, S., Wilkins, R. W. T., and Wang, Z. (2015a). Fractal Characteristics of Upper Cretaceous Lacustrine Shale from the Songliao Basin, NE China. Mar. Pet. Geology. 67, 144–153. doi:10.1016/j.marpetgeo.2015.05.011
Wang, X., Liu, L., Wang, Y., Sheng, Y., Zheng, S., and Luo, Z. (2019). Control of Lithofacies on Pore Space of Shale from Longmaxi Formation.Southern Sichuan Basin. Acta Petrolei Sinica 40 (10), 1192–1201. doi:10.7623/syxb201910005
Wang, Z., Zhang, J., Sun, R., Liu, C., Du, X., and Lu, Y. (2015b). The Gas-Bearing Characteristics Analysis of the Longtan Formation Transitional Shale in Well Xiye 1. Earth Sci. Front. 22 (2), 243–250. doi:10.13745/j.esf.2015.02.022
Wu, J., Wang, H., Shi, Z., Wang, Q., Zhao, Q., Dong, D., et al. (2021). Favorable Lithofacies Types and Genesis of marine-continental Transitional Black Shale:A Case Study of Permian Shanxi Formation in the Eastern Margin of Ordos Basin, NW China. Pet. Exploration Development 48 (6), 1–13. doi:10.11698/PED.2021.06.0610.1016/s1876-3804(21)60289-6
Yang, C., Zhang, J., Tang, X., Ding, J., Zhao, Q., Dang, W., et al. (2017). Comparative Study on Micro-pore Structure of marine, Terrestrial, and Transitional Shales in Key Areas, China. Int. J. Coal Geology. 171, 76–92. doi:10.1016/j.coal.2016.12.001
Zhang, J., Li, X., Zhang, X., Zhang, M., Cong, G., Zhang, G., et al. (2018). Geochemical and Geological Characterization of marine-continental Transitional Shales from Longtan Formation in Yangtze Area, South China. Mar. Pet. Geology. 96, 1–15. doi:10.1016/j.marpetgeo.2018.05.020
Keywords: Lower Permian, transitional facies, shale lithofacies, pore structure, Shanxi Formation, Ordos Basin
Citation: Wang Z, Guo B, Jiang C, Qi L, Jiang Y, Gu Y, Fu Y and Liang D (2022) Nanoscale Pore Characteristics of the Lower Permian Shanxi Formation Transitional Facies Shale, Eastern Ordos Basin, North China. Front. Earth Sci. 10:842955. doi: 10.3389/feart.2022.842955
Received: 24 December 2021; Accepted: 10 January 2022;
Published: 11 February 2022.
Edited by:
Kun Zhang, Southwest Petroleum University, ChinaReviewed by:
Mengdi Sun, Northeast Petroleum University, ChinaCaifang Wu, China University of Mining and Technology, China
Chenggong Zhang, Chengdu University of Technology, China
Copyright © 2022 Wang, Guo, Jiang, Qi, Jiang, Gu, Fu and Liang. This is an open-access article distributed under the terms of the Creative Commons Attribution License (CC BY). The use, distribution or reproduction in other forums is permitted, provided the original author(s) and the copyright owner(s) are credited and that the original publication in this journal is cited, in accordance with accepted academic practice. No use, distribution or reproduction is permitted which does not comply with these terms.
*Correspondence: Yuqiang Jiang, eG5zeWp5cTMwNTVAMTI2LmNvbQ==