 Yongchao Xue
 Longjun Wang
 Xiaoliang Zhao
95% of researchers rate our articles as excellent or good
Learn more about the work of our research integrity team to safeguard the quality of each article we publish.
Find out more
ORIGINAL RESEARCH article
Front. Earth Sci. , 03 March 2022
Sec. Economic Geology
Volume 10 - 2022 | https://doi.org/10.3389/feart.2022.841456
This article is part of the Research Topic Advances in Multi-scale Multi-physics Geophysical Modelling and Fluid Transport in Unconventional Oil and Gas Reservoir View all 15 articles
With the development of the petroleum industry, the importance of low-permeability reservoirs becomes clear. The fracture, which serves as the notable characteristic of a low-permeability reservoir, controls the flow system of reservoir fluid and restrains the development effect. Finding ways to recognize the fracture by using the normal data and building the fracture 3-D model are the important and difficult points of low-permeability development. According to this problem, the authors use a helpful probe. First, from similar outcrop and drilling core study of the fractured original model, the knowledge base of the fracture was built. Second, based on the analysis of the principle of dual-later log identification fracture, the core calibration was used to make logging, and using dual-later log, the fracture in wells was recognized. Third, based on the analysis of the principle of the fractal kriging method, the inter-well fractures were predicted. Finally, the 3-D model of fracture was built with fractural random simulation. The result shows that the 3-D model is in accordance with the fact of the development. So, the method is correct.
Oil and gas in tight and low-permeability reservoirs is an important replacement resource and development field in China (Ding et al., 2015; Sun et al., 2019). Tight and low-permeability reservoirs have poor physical properties and strong heterogeneity. Natural fractures generally develop under the action of multistage structural deformation (Wu et al., 2021a). Natural fracture characterization methods include natural fracture description methods and prediction methods, among which natural fracture characterization methods include qualitative and quantitative description methods, which can be divided into 1) geological methods, including field similar outcrops, core observation, thin slices, scanning electron microscope, CT layer analysis and scanning technology, and core MRI scanning image analysis technology (Xiong et al., 2019; Liu et al., 2020; Wu et al., 2021b; Jia et al., 2021; Rao et al., 2022); 2) well logging methods, including special logging and conventional logging methods (Tang et al., 2012; Zhao et al., 2012; Wu et al., 2021c); 3) reservoir engineering methods, including well test analysis, pressure analysis, tracer analysis, water injection dynamic analysis, and microseismic monitoring (Clarkson and Qanbari, 2015; Fang et al., 2017; Jia et al., 2017; Chen et al., 2019; Li et al., 2020). The prediction methods of natural fractures mainly include the following: 1) The geological data method predicts fractures, mainly based on the geological data such as cores, logging, and seismic data of the oil field to predict the development of fractures. Core analysis is the most accurate and intuitive way to reflect the development of underground fractures. Due to the high cost of coring, core data are generally scarce. Imaging logging uses high-resolution two-dimensional images to display fracture information, but imaging logging costs are relatively high, and imaging logging implemented in actual production is limited. Using conventional logging data to accurately identify and predict fractures in the entire well section requires maximum use of drilling core and imaging logging data to calibrate conventional logging data. At present, the main technologies for predicting fractures through seismic methods include coherence analysis technology, tracking technology, seismic inversion technology, and shear wave splitting technology (Wang et al., 2014; Su et al., 2017; Teng and Li, 2019). 2) The numerical simulation method is used to predict fractures. Based on geological knowledge, the distribution law of the fractures is studied theoretically by establishing a mathematical model. The numerical simulation method is based on certain geological knowledge and establishes a mathematical model to analyze and predict the fractures theoretically. Numerical simulation methods mainly include finite element tectonic stress field numerical simulation method, rock fracture method, curvature method, energy method, and statistical method (Li et al., 2013; Wang et al., 2013; Ju et al., 2014; Dong et al., 2018). 3) Other qualitative methods are used to predict fractures, that is, based on the relationship between fracture development and structure and lithology, to qualitatively understand the distribution characteristics of fractures. Qualitative methods to predict fractures are mainly based on the relationship between fracture development and structure and lithology, to qualitatively understand fractures and distribution characteristics. Predecessors believed through analysis that fractures are more likely to develop in high structural positions and near faults. Rocks with more brittle components are more likely to develop fractures than rocks with less brittle components (Ju et al., 2013; Liu et al., 2017). 4) The non-linear theory method predicts fractures. Non-linear theoretical methods are mainly a series of technical methods emerging in the 1990s, mainly including fractal theory, gray relation theory, backpropagation neural network, and other methods (Gong et al., 2012; Wang et al., 2015; Dong et al., 2016).
After years of fracture research, although great progress has been made in the characterization of reservoir natural fractures, the current research on 3-D geological modeling of reservoir fractures is still relatively weak, which cannot meet further needs of tight and low-permeability oil and gas exploration and development.
Xinli oil field is located on the westernmost Xinli anticline in the central depression of the Songliao Basin, Fuyu-Xinmu uplift zone. It is a dome anticline complicated by faults, with two groups of normal faults in the NNW direction and NNE direction. The Fuyu reservoir is of meandering river facies, mainly composed of fine sandstone, siltstone, and largely siltstone. The average porosity of the matrix reservoir is 12.8%, and the average permeability is 2.5 × 10⁻³ μm2. Xinli oil field was discovered by exploration in 1973, opened a production experimental area in 1980, and carried out a comprehensive infill adjustment stage from 1997 to 1999. At present, the oil field has entered the stage of ultrahigh water cut development. Exploration indicates that there are large amounts of high-angle fractures in a shaft of the oil field. Unclear understanding of fracture characteristics and distribution seriously constrains the highly efficient oil field development.
The original fracture model is mainly studied by fracture investigation in similar outcrop areas and core fracture observations.
From a study of a similar crop in the research area, we find the following characteristics of fractures (Table 1) (Figure 1).
1) There are four groups of high-angle fractures (nearly EW, SN, NW, and NE direction). The group of fractures in nearly SN direction is developed earlier than the other three groups. Fractures in nearly EW direction are main fractures. NW and NE direction fractures show as conjugate shear fractures of the nearly SN direction fractures.
2) Fractures in the study area are mainly high-angle fractures, and 80% of the fractures are with angles larger than 70°.
3) Fracture density in the study area is mainly affected by lithology and tectonic stress. The measured data show that there are 14.6 fractures per meter in fine sandstone, 10.4 per meter in siltstone, and 3.8 fractures per meter in pelitic siltstone. The density of fractures in nearly EW direction is dramatically larger than that of fractures in nearly SN direction.
4) Length of tectonic fissures in similar outcrops ranges in a large scope from few centimeters to tens of meters. Fracture aperture also varies widely. Fractures in nearly EW direction have largest apertures up to several centimeters, followed by fractures in nearly NE and NW direction, and fractures in nearly SN direction have apertures of only a few millimeters. This is affected by the orientation of principal stress (nearly EW direction) in the area.
5) Fractures in nearly SN direction are commonly filled with calcite, while those in nearly EW direction have fewer fillings.
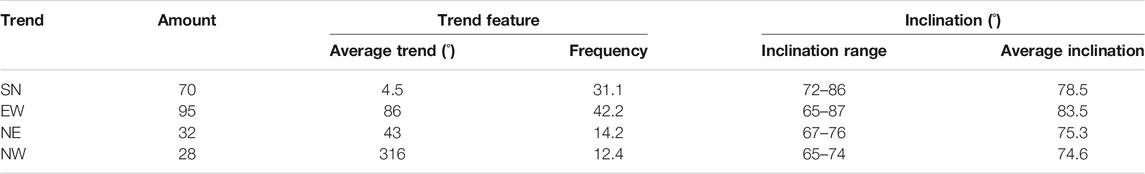
TABLE 1. Strike distribution characteristics of similar outcrop fractures in the target reservoir.
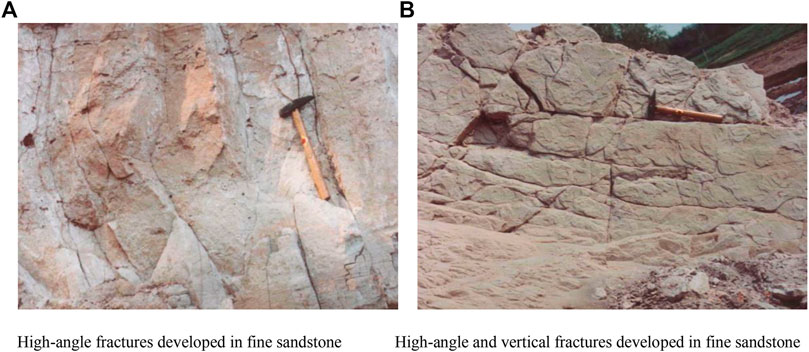
FIGURE 1. Fracture inclination observed by similar outcrops. (A) High-angle fractures developed in fine sandstone. (B) High-angle and vertical fractures developed in fine sandstone.
From the observation of drilling cores of Xinli oil field, we get the following results (Figure 2A):
1) Fuyang reservoir in Xinli oil field develops multiple groups of fractures with different angles, aperture, and cutting depth. For example, the core drilled from the well section 1,359.5–1,359.85 m of Xin 318 shows groups of fractures and their spatial relationships.
2) Statistics of core fracture density indicate that there are 0.23 fractures per meter in sandstone, 0.1 in pelitic siltstone barrier, and 0.88 fractures per meter in calcareous sandstone at the bottom of the reservoir.
3) Core fracture aperture ranges in a large scope from few micrometers to millimeters and is filled with calcium or argillite (Figure 2B).
4) The study area has a good oil-bearing ability, which benefits from the developed fractures (Figure 2C).
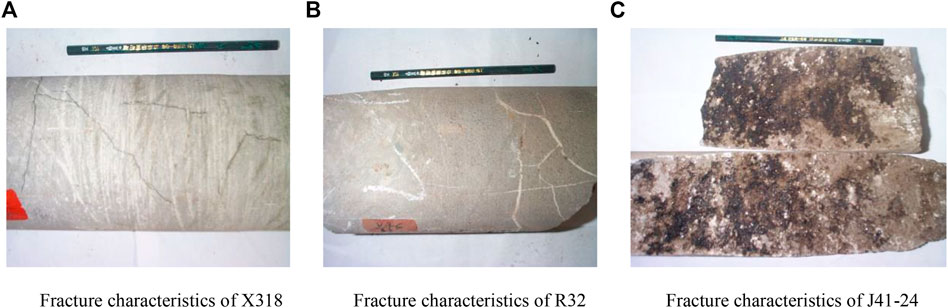
FIGURE 2. Observation of typical fracture characteristics in the target reservoir core. (A) Fracture characteristics of X318. (B) Fracture characteristics of R32. (C) Fracture characteristics of J41-24.
Using logging methods to detect fractures is mainly based on the fact that fractures and matrices have different geophysical characteristics. Therefore, when fractures develop in the formation, different logging responses may be caused. Based on these response characteristics, fractures can be identified and analyzed.
The study area is mainly based on compensated acoustic logging, and the detected longitudinal wave head waves are more sensitive to horizontal fractures and low-angle fractures, and cycle jumps and abnormal high-value characteristics of acoustic waves may occur in the fracture section. However, the fractures in this area are dominated by high-angle fractures. At the same time, the length of the fractures observed by the core is basically between 20 and 30 cm. Therefore, there are no obvious acoustic anomalies and cycle skipping characteristics in the sonic logging section of the fracture development section.
Density logging, natural gamma, neutron, and other radioactive logging have a certain response to fractures. In the fracture section, it is characterized by low density, high neutron porosity, and low gamma. Due to the changes in stratum lithology and radiation intensity in the target area, these curves are irregular in the fracture section and have no response to the fracture.
The hole diameter is also a method to identify fractures. When drilling into fracture-developed zones, it will generally cause diameter expansion or well wall collapse. Well temperature logging is also a means of identifying fractures. Usually, mud invades and the formation temperature gradually decreases, which causes a local temperature drop in the well and a negative well temperature anomaly. In the logging series in this area, there are no caliper and temperature logging curves, so these curves cannot be used to identify fractures.
Theoretical study (Quillan, 1973; Philippe and Roger, 1990; Jian and Li, 2001) indicates that when fractures developed in low-permeability reservoirs, the anisotropy coefficient of electrical resistivity can be given as follows:
where
where
From Eq. 1 and Eq. 2 we can see that
Eq. 2 can be rewritten as follows:
According to Eq. 3, we know that
Both theory and practice indicate that the electrical resistivity of a fractured reservoir is lower than that of a normal reservoir. From Figure 3 which is the fracture identification result of well Ji 10–17, we know that there is a high-angle fracture with few fillings in oil-immersed fine sandstone in section 1,176.00–1,176.50 m. The characteristic of a dual-later log is as follows: deep and shallow resistivities of sections where fractures developed are about 18 Ω m and 16 Ω m, respectively, while those of the near sections without fractures are larger than 35 Ω m; difference on a dual later log of fracture sections changes from normal value 5 Ω m–10 Ω m to 2 Ω m–3 Ω m, even 0 Ω m locally. The characteristic of a micro log is as follows: micro-resistivity of sections with fractures is lower than 7 Ω m, while that of the near sections without fracture is higher than 10 Ω m; difference on a micro-log of fracture sections changes from 4 Ω m–10 Ω m for normal sections to 1 Ω m–3 Ω m, and even 0 Ω m locally.
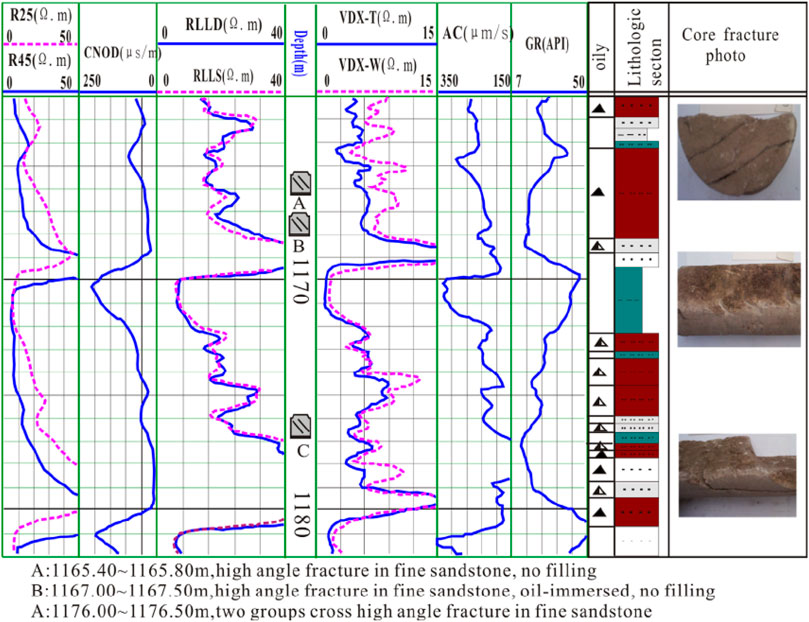
FIGURE 3. Lithology electric fracture response analysis of Well Ji10-17.
According to the logging response characteristics of fractures, based on selecting the best response curve of fractures, the double lateral and its amplitude difference and the microelectrode and its amplitude difference are used to make plates (Figure 4, Figure 5, Figure 6). There is a clear difference between the fracture and non-fracture sections on the chart. The resistivity of the fracture sections is generally low, and they are concentrated in the lower left of the chart. Table 2 is the statistical data table of the fracture identification resistivity lower limit, the positive judgment rate of the microelectrode system and its amplitude difference, the double-lateral curve, and its amplitude difference determined by each interpretation plate. It can be seen from the table that the standards for identifying fractures by the difference between the bilateral lateral amplitude and the microelectrode amplitude are both no more than 5 Ω m, and the correct rate of the two cross-platforms for identifying fractures is as high as 94%; the standards for micro-gradient and micro-potential identification of fractures are, respectively, as follows: if greater than 8 Ω m and no greater than 12 Ω m, the correct rate of the two intersecting plates to identify fractures is 91%; the standard for identifying fractures in shallow and deep lateral directions is not greater than 28 Ω m and not greater than 30 Ω m in the shallow side. The correct rate of fractures identified by the cross-directional and double-lateral amplitude difference plates was 89%, and the correct rate of the fractures by the deep-lateral and double-lateral amplitude difference cross plates was 90%. The quantitative identification of fractures using these standard plates is accurate and credible.
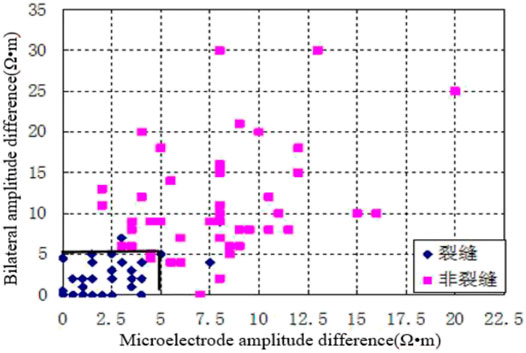
FIGURE 4. Intersection chart of bilateral lateral amplitude difference and microelectrode amplitude.
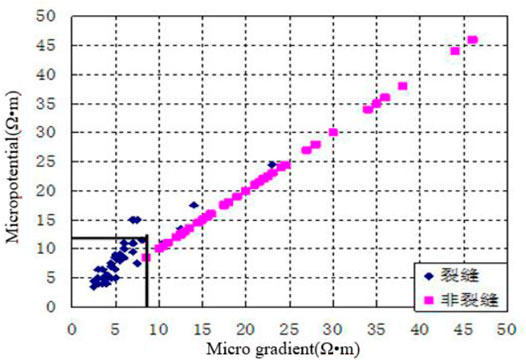
FIGURE 5. Intersection diagram of micro-gradient and micro-potential.
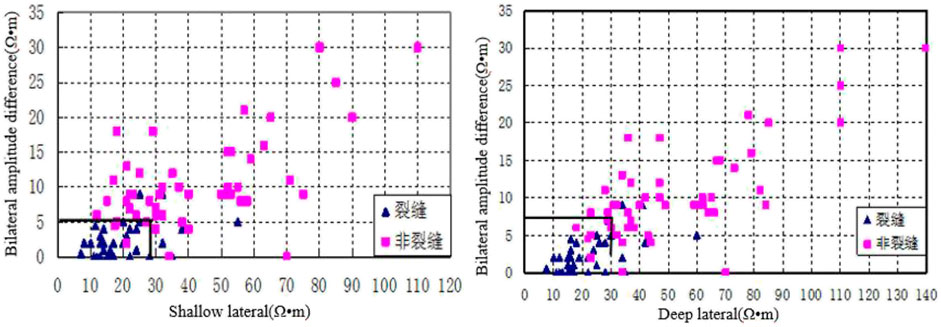
FIGURE 6. Shallow deep lateral and bilateral lateral amplitude difference intersection chart.
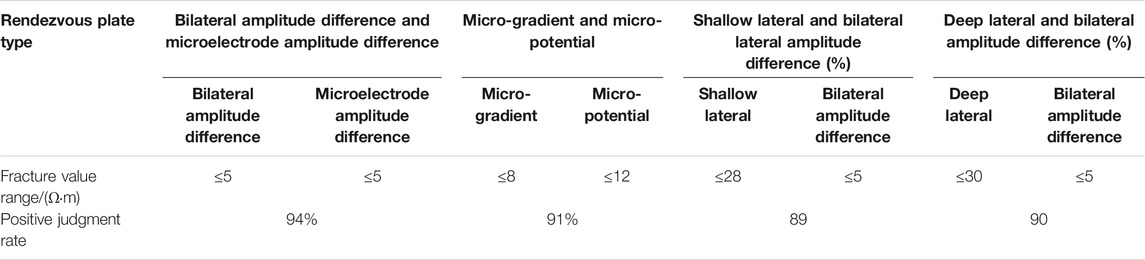
TABLE 2. Standards for fractures in the plate method.
Discriminant analysis is an analysis method to find the discriminant function based on the variable values that indicate the characteristics of things and their categories and to classify things with unknown categories according to the discriminant function.
Although all the aforementioned multiple logging curves respond to fractures, they do not have the same effect. To retain the main characteristic curves and eliminate the secondary characteristic curves, the discriminant function tends to be simplified, and the stepwise judgment analysis method is adopted.
The selected 85 samples are divided into two parts, of which 1 to 55 samples are used to establish the discriminant function, and the 56 to 85 samples are used to test the reliability of the discriminant function.
Using the stepwise discriminant analysis procedure, the core calibration results are processed, and through the introduction and removal of several variables, several logging curves that play a major role in fracture discrimination are finally selected. Here, the dual lateral direction and its amplitude difference and micro-scale are mainly used. The electrode and its amplitude difference are used as the discriminant function:
where X1 is the micro-gradient logging value, Ω m; X2 is the micro-potential logging value, Ω m; X3 is the microelectrode system amplitude difference, Ω m; X4 is the shallow lateral logging value, Ω m; X5 is the deep lateral logging value, Ω m; X6 is the double-lateral logging amplitude difference, Ω m; and y1 and y2 are the fracture and non-fracture discriminant function values, respectively.
Using the discriminant function established by samples 1 to 55, the accuracy of the discriminant function is nearly 92.7%, and only four samples are judged wrong. The positive judgment rate of the inspection samples 56 to 85 is 90%, and there are three samples wrong. The accuracy of the discriminant function is relatively high.
This fracture study uses the BP network to predict. The BP network realizes forward mapping by weights. For a multilayer network with hidden units added between the input and output, when there is an error in the output, the error of the output layer unit is propagated back to the input layer by layer to “apportion” to each layer unit, to obtain the reference error of each layer unit. To adjust the corresponding connection rights, the cycle continues until the error of the output layer unit meets the requirements.
The characteristic parameters of the samples that have identified fractures and non-fractures are input into the computer to form a training set for the network to learn, to obtain the classification knowledge of fractures and non-fractures, and then use the classification knowledge to identify the samples to be discriminated, and the network will, according to the learned knowledge, judge whether the sample has fractured. Samples from 1 to 55 are still used to establish the discriminant function, and samples from 56 to 85 are used to test the reliability of the discriminant function.
The trained network is used to judge the learning samples, and the positive judgment rate is 96%, while the trained network has a positive judgment rate of 93% for the known samples to be judged, which proves the reliability of the network.
According to Table 3 that among all the methods, the intersection method of microelectrode amplitude difference and bilateral amplitude difference has the highest positive judgment rate; the lowest positive judgment rate is the shallow lateral and bilateral amplitude difference intersection pattern method.
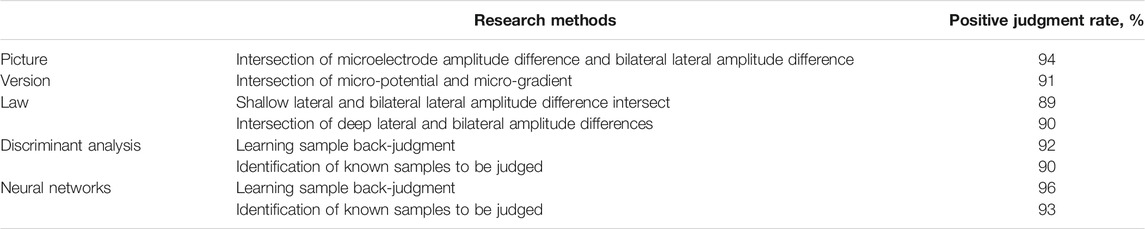
TABLE 3. Comparative analysis of discriminant errors of various research methods.
Theoretical bases of the fractural kriging method are fractional Brownian motion and the geostatistical method. Fractional Brownian motion is a Gaussian process with an average value of 0 and variance
This formula is highly similar to the variation function in geostatistics, that is,
Suppose the linear estimate z*(x) is the linear combination of several given points, kriging equations are follows:
where
By substituting
where
If all the parameters provided by logging information are distributed vertically, then how to predict the laterally distributed fracture parameters? Hardy’s research suggests that vertical fractal dimensions are nearly equal to lateral fractal dimensions, so the parameters provided by logging can also be used to predict inter-well fractures. Fractal dimensions of fracture are generally obtained by using the “box-counting method”. Figure 7 is the prediction result of the distribution of the fracture of the study area, from which we know that if fracture fractal dimensions of two wells are close, then the characteristic of the fractures, genetic mechanism, and fracture properties would also be close, and the inter-well continuity will be good; on the contrary, if fracture fractal dimensions of two wells have great difference from each other, then the characteristics of the fractures, genetic mechanism, and fracture properties will also be highly different, and the inter-well continuity will be bad.
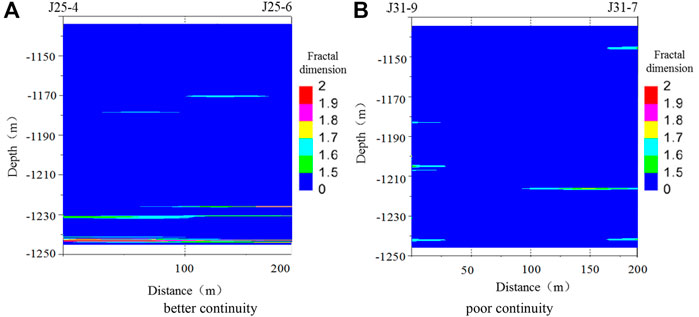
FIGURE 7. Predicting map of fracture distribution in Xinli oil field. (A) Better continuity. (B) Poor continuity.
A demonstration tracer test was conducted in the J25-4 well group, and the distance between the J25-4 well and the J25-6 well was 200 m. The tracer was injected into Well J25-4, and the peak of the tracer quantity was displayed in Well J25-6 after 3 days. For reservoirs with good reservoir quality in this area, the peak detection time of tracer quantity is more than 60 days. Such a fast tracer shows that it can be determined that it is due to the existence of high permeability fractures.
Tracer testing was also carried out in the J31-9 well group, and the distance between the J31-9 well and the J31-7 well was 200 m. The tracer was injected into Well J31-9, and the tracer display was seen in Well J31-7 only 55 days later, indicating that there is no fracture communication between Well J31-9 and Well J31-7.
Figure 8 is the fracture 3-D model of the study area developed with the fractal stochastic method based on the study of the fractured original model. From the figure, we can see that fracture density in the local area is large and inter-well continuity is good. This is consistent with the actual development of the study area, which has a higher production in the early stage and is severely flooded later. All of these show that the developed model is precise enough.
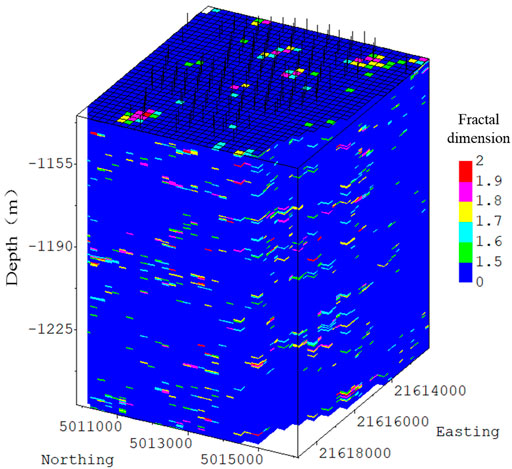
FIGURE 8. Fracture’s 3-D model of the study area.
1. Synthesize similar outcrops and drilling cores, explore the fracture development characteristics of the target reservoir, and establish a prototype model of the target reservoir.
2. Using the fracture described by the core and scaling it to the logging curve, and it is found that among all logging curves of the target reservoir, only the resistivity logging curve has a good response to the fracture.
3. The fusion of multiple methods carried out the quantitative identification of the fractures at the target reservoir well points, and the application of dynamic data to verify the reliability of the identified fractures.
4. Applying the fractal theory to predict the development characteristics of inter-well fractures in the target reservoir, and establishing a three-dimensional fracture distribution model.
The raw data supporting the conclusion of this article will be made available by the authors, without undue reservation.
YX: thesis ideas and three-dimensional fracture model. LW: data collation, data analysis, calibration model, and writing the first draft of the manuscript. XZ: investigation of fracture identification methods, collection of core fracture photos of Xinli oil field, and the trend of target oil fracture count. HT: investigation of the principle of logging method and translation of the first draft of the manuscript.
The authors declare that the research was conducted in the absence of any commercial or financial relationships that could be construed as a potential conflict of interest.
All claims expressed in this article are solely those of the authors and do not necessarily represent those of their affiliated organizations, or those of the publisher, the editors, and the reviewers. Any product that may be evaluated in this article, or claim that may be made by its manufacturer, is not guaranteed or endorsed by the publisher.
We acknowledge that this partially funded by the Strategic Cooperation Technology Projects of CNPC and CUPB (No.ZLZX2020-02–04). We would further like to acknowledge financial support of the National Natural Science Foundation of China (No. U1762210).
Barnsley, M. F. (1986). Fractal Function and Interpolation[J]. Constructive Proximaton 29 (2), 303–329. doi:10.1007/bf01893434
Barton, C. C., and La Pointe, P. R. (1995). Fractals in the Earth sciences[M]. New York: Plenum Press, 1–88.
Cello, G. (1997). Fractal Analysis of a Quaternary Fault Array in the central Apennines, Italy. J. of Structural Geology. 19 (7), 945–953. doi:10.1016/s0191-8141(97)00024-2
Chen, Z., Liao, X., and Chu, H. (2019). A Boundary Element Model for Falloff Testing in Unconventional Reservoirs by Considering Natural Fractures. Eng. Anal. Boundary Elem. 108, 71–81. doi:10.1016/j.enganabound.2019.08.005
Clarkson, C. R., and Qanbari, F. (2015). An Approximate Semi-analytical Two-phase Forecasting Method for Multi-Fractured Tight Light-Oil wells with Complex Fracture Geometry[J]. J. Can. Pet. Technology 54 (6), 489–508. doi:10.2118/178665-pa
Ding, W. L., Wang, X. H., Hu, Q. J., Yin, S., Cao, X. Y., Liu, J. J., et al. (2015). Research Progress of Fractures in Tight sandstone Reservoirs. Earth Sci. Prog. 30 (7), 737–750
Dong, F. J., Lu, X. F., Liu, M. Y., and Rao, X. J. (2016). Correlation Analysis of Micro-geological Factors and Micro-fracture Development Degree Based on gray Correlation[J]. Geology. Exploration 52 (5), 950–955. doi:10.13712/j.cnki.dzykt.2016.05.017
Dong, S. Q., Zeng, L. B., and Cao, R. (2018). Discrete Fracture Network Modeling Method and Realization Constrained by Fracture Density. Geol. Rev. 64 (5), 1302–1314. doi:10.16509/j.georeview.2018.05.020
Fang, S., Cheng, L., and Ayala, L. F. (2017). A Coupled Boundary Element and Finite Element Method for the Analysis of Flow through Fractured Porous media. J. Pet. Sci. Eng. 152, 375–390. doi:10.1016/j.petrol.2017.02.020
Gong, L., Zeng, L. B., Miao, F. B., Wang, Z. S., Wei, Y., Zu, K. W., et al. (2012). Application of Fractal Geometry Method in the Description of the Complex Fracture System. J. Hunan Univ. Sci. Technology (Natural Sci. Edition) 27 (4), 6–10. doi:10.13712/j.cnki.dzykt.2016.05.017
Jia, P., Cheng, L., Clarkson, C. R., and Williams-Kovacs, J. D. (2017). Flow Behavior Analysis of Two-phase (Gas/water) Flowback and Early-Time Production from Hydraulically-Fractured Shale Gas wells Using a Hybrid Numerical/analytical Model. Int. J. of Coal Geology. 182, 14–31. doi:10.1016/j.coal.2017.09.001
Jia, P., Ma, M., Cao, C., Cheng, L. S., Yin, H. F., Li, Z., et al. (2021). Capturing Dynamic Behavior of Propped and Unpropped Fractures during Flowback and Early-Time Production of Shale Gas wells Using a Novel Flow-Geomechanics Coupled Model. J. Pet. Sci. Eng. 208, 109412. doi:10.1016/j.petrol.2021.109412
Jian, Q., and Li, S. J. (2001). An Interpretation Method for Identifying and Evaluating Fractured Sand Oil Reservoirs in Deep Zone in Bohai Gulf Using Dual Laterolog Responses[J]. WLT 25 (4), 282–286. doi:10.16489/j.issn.1004-1338.2001.04.009
Ju, W., Hou, G. T., Feng, S. B., Zhao, S. B., Zhang, J. T., You, Y., et al. (2014). Quantitative Prediction of Structural Fractures in Chang 63 Reservoir of Yanchang Formation in Qingcheng-Heshui Area, Ordos Basin. Frontier Earth Sci. 221 (6), 310–320. doi:10.13745/j.esf.2014.06.030
Ju, W., Hou, G. T., Huang, S. Y., and Reng, K. X. (2013). Prediction of Structural Fracture Distribution in sandstone of Lower Jurassic Ahe Formation in Yinan-Tuzi Area, Kuqa Depression. Tectonics and mineralization 37 (4), 592–602. doi:10.16539/j.ddgzyckx.2013.04.002
Li, C., Zhao, L., Liu, B., and Sun, M. (2020). Origin, Distribution, and Implications on Production of Bedding-Parallel Fractures: A Case from the Carboniferous KT-I Formation in the NT Oilfield, Precaspian Basin, Kazakhstan. J. Pet. Sci. Eng. 196, 107655. doi:10.1016/j.petrol.2020.107655
Li, Z. J., Zhang, Y., and Dou, Y. (2013). Prediction of Fractures in Tight sandstone Reservoirs by Curvature Method. J. Southwest Pet. Univ. (Natural Sci. Edition) 35 (6), 57–63. https://kns.cnki.net/kns8/manage/FileToText.
Liu, H., Rao, X., and Xiong, H. (2020). Evaluation of CO2 Sequestration Capacity in Complex-Boundary-Shape Shale Gas Reservoirs Using Projection-Based Embedded Discrete Fracture Model (pEDFM). Fuel 277, 118201. doi:10.1016/j.fuel.2020.118201
Liu, J. J., Wu, M. Y., Song, R., et al. (2017). Research on Modeling Method of Multi-Scale Fractures in Low Permeability Reservoirs. J. Southwest Pet. Univ. (Natural Sci. Edition) 39 (4), 90–103.
Malek, A., and Maryam, Y. (2010). Image Fusion Algorithms for Color and gray Level Images Based on LCLS Method and Novel Artificial Neural Network. Neurocomputing 73 (4-6), 937–943. doi:10.1016/j.neucom.2009.09.002
Philippe, A. P., and Roger, N. A. (1990) Situ Measurements of Electrical Resistivity, Formation Anisotropy and Tectonic Context[C]. SPWLA 31st Annual Logging Symposium. Louisiana: Lafayette, 24–27.
Quillan, H. (1973). Small Scale Fracture Density in Asmari Formation of Southwest Iran and its Relation to Bed Thickness and Structural Setting. AAPG Bull. 57 (4), 2367–2385. doi:10.1306/83d9131c-16c7-11d7-8645000102c1865d
Rao, X., Xin, L., He, Y., Fang, X., Gong, R., Wang, F., et al. (2022). Numerical Simulation of Two-phase Heat and Mass Transfer in Fractured Reservoirs Based on Projection-Based Embedded Discrete Fracture Model (pEDFM). J. Pet. Sci. Eng. 208, 109323. doi:10.1016/j.petrol.2021.109323
Su, H., Lei, Z. D., Zhang, D. D., Li, J. C., Zhang, Z. R., Ju, B. S., et al. (2017). Dynamic and Static Comprehensive Prediction Method of Natural Fractures in Fractured Reservoirs[J]. Pet. exploration Dev. 44 (6), 919–929. doi:10.1016/s1876-3804(17)30109-x
Sun, L. D., Zhou, C. N., Jia, A. L., et al. (2019). Characteristics and Direction of Tight Oil and Gas Development in China. Pet. Exploration Development 46 (6), 1015–1026. doi:10.1016/s1876-3804(19)60264-8
Tang, X. M., Tang, L. B., and Feng, Y. (2012). Fracture Characteristics of Shale Oil Reservoirs in the Triassic Yanchang Formation in the Ordos Basin and Conventional Logging Identification Methods. J. Pet. Nat. Gas 34 (6), 95–99. https://kns.cnki.net/kns8/manage/FileToText.
Teng, B., and Li, H. A. (2019). Pressure-transient Behavior of Partially Penetrating Inclined Fractures with a Finite Conductivity[J]. SPE J. 24 (2), 811–833. doi:10.2118/194189-pa
Wang, G. C., Zhang, C. G., Tang, J., Zhu, L., Ju, D. H., Cao, J. N., et al. (2015). Application of Fractal Dimension in Identifying Deep-Seated Tight sandstone Fractures[J]. J. Yangtze Univ. (Self Sci. Edition) 12 (8), 33–36. doi:10.16772/j.cnki.1673-1409.2015.08.008
Wang, H. Q., Yang, W. Y., Xie, C. H., Zheng, D. M., Wang, H. L., Zhang, X. M., et al. (2014). Azimuth Anisotropy Analysis of Different Seismic Attributes and Fracture Prediction. Pet. Geophys. exploration 49 (5), 925–931. doi:10.13810/j.cnki.issn.1000-7210.2014.05.043
Wang, J., Li, Y. D., and Gan, L. D. (2013). Fracture Characterization Method Based on Ant Body Anisotropy. Pet. Geophys. prospecting 48 (5), 763–769. doi:10.13810/j.cnki.issn.1000-7210.2013.05.022
Wu, H., Ma, D., and Spearing, A. J. S. (2021). Fracture Phenomena and Mechanisms of Brittle Rock with Different Numbers of Openings under Uniaxial Loading. Geomechanics Eng. 25 (6), 481–493. doi:10.12989/gae.2021.25.6.481
Wu, Y., Cheng, L., Killough, J., Huang, S., Fang, S., Jia, P., et al. (2021). Integrated Characterization of the Fracture Network in Fractured Shale Gas Reservoirs-Stochastic Fracture Modeling, Simulation and Assisted History Matching. J. Pet. Sci. Eng. 205, 108886. doi:10.1016/j.petrol.2021.108886
Wu, Y., Cheng, L., Ma, L., Huang, S., Fang, S., Killough, J., et al. (2021). A Transient Two-phase Flow Model for Production Prediction of Tight Gas wells with Fracturing Fluid-Induced Formation Damage. J. Pet. Sci. Eng. 199, 108351. doi:10.1016/j.petrol.2021.108351
Xiong, H., Devegowda, D., and Huang, L. (2019). EOR Solvent-Oil Interaction in Clay-Hosted Pores: Insights from Molecular Dynamics Simulations. Fuel 249, 233–251. doi:10.1016/j.fuel.2019.03.104
Keywords: prototype model, low permeability, fractural kriging, fracture, 3D model
Citation: Xue Y, Wang L, Zhao X and Tian H (2022) The Fractured Model Study of Low-Permeability Reservoir in Xinli Oil Field. Front. Earth Sci. 10:841456. doi: 10.3389/feart.2022.841456
Received: 22 December 2021; Accepted: 03 February 2022;
Published: 03 March 2022.
Edited by:
Wenhui Song, China University of Petroleum, Huadong, ChinaReviewed by:
Jianhui Han, Chengdu University of Technology, ChinaCopyright © 2022 Xue, Wang, Zhao and Tian. This is an open-access article distributed under the terms of the Creative Commons Attribution License (CC BY). The use, distribution or reproduction in other forums is permitted, provided the original author(s) and the copyright owner(s) are credited and that the original publication in this journal is cited, in accordance with accepted academic practice. No use, distribution or reproduction is permitted which does not comply with these terms.
*Correspondence: Yongchao Xue, eHljNzVAY3VwLmVkdS5jbg==
†ORCID ID: Yingchao Xue, orcid.org/0000-0003-1903-7519
Disclaimer: All claims expressed in this article are solely those of the authors and do not necessarily represent those of their affiliated organizations, or those of the publisher, the editors and the reviewers. Any product that may be evaluated in this article or claim that may be made by its manufacturer is not guaranteed or endorsed by the publisher.
Research integrity at Frontiers
Learn more about the work of our research integrity team to safeguard the quality of each article we publish.