 Ke Wu
Ke Wu Dezhao Chen3
 Yiqian Qu
- 1State Key Laboratory of Continental Dynamics, Department of Geology, Northwest University, Xi’an, China
- 2Xi’an Key Laboratory of Tight Oil (Shale Oil) Development (Xi’an Shiyou University), Xi’an, China
- 3No.8 Oil Production Plant, PetroChina Changqing Oilfield Company, CNPC, Xi’an, China
- 4School of Petroleum Engineering, Xi’an Shiyou University, Xi’an, China
Tight sandstone reservoirs have smaller pore throats, complex structures, strong heterogeneity in the pore throat system, and significant differences in fluid distribution. To reveal the occurrence characteristics of movable fluids in tight sandstone reservoirs, the typical tight sandstone core samples from the Chang 4+5 reservoir of the Upper Triassic Yanchang Formation of the Ordos Basin were selected and the micro pore throat classification standard was established by using casting thin slices, field emission scanning electron microscopy (FE-SEM), high-pressure mercury injection (HPMI), and nuclear magnetic resonance (NMR) technology. The test analysis results showed that the Chang 4+5 tight sandstone reservoir can be divided into Type I, II, and III reservoirs by the different pore throat structure. Type I reservoirs have well-developed pore throats, good connectivity, low threshold pressure (0.42 MPa on average), high movable fluid saturation (46.82% on average), and a minimum pore throat radius of movable fluid (0.056 μm on average). The pore throat structure and fluid production degree of the other two reservoir types gradually deteriorated. Note that the tight sandstone reservoirs of the Chang 4+5 reservoirs have smaller pore throats but high movable fluid content in smaller pore throats (17% on average). With the deterioration of the pore throat structure in reservoir, the degree of fluid utilization in larger pore throats decreases (74.33%–57.33%), whereas the degree of fluid utilization in smaller pore throats does not change significantly (25.67%–13.82%). Many factors affect movable fluid parameters. The movable fluid parameters of tight sandstone reservoirs in the Chang 4+5 reservoir have a good positive correlation with permeability (R2 = 0.85) and sorting coefficients (R2 = 0.88). The movable fluid parameters of smaller and larger pore throats have no obvious correlation with a single factor. Multiple factors affect the fluid occurrence characteristics of different scale pore throats.
1 Introduction
Recently, with the decrease of conventional oil and gas resources, the exploration and development of unconventional energy, especially tight oil and gas, has been increased worldwide. The global tight oil reservoirs are about 9.294 × 10¹¹ t, and the technically recoverable reserves are about 4.6 × 10¹¹ t (Ji et al., 2015; Zhang et al., 2020a, 2020b; Chen et al., 2021; Meng et al., 2022). Simultaneously, because of the successful development of many tight oil reservoirs in North America, such as Bakken, Eagle Ford, and Barnet, tight oil production in the United States reached 1.5 × 10⁸ t in 2020 and energy independence should be achieved in 2022 (Gao et al., 2018a; Hu et al., 2018; Chen et al., 2019; Ji et al., 2019; Zou et al., 2021). Tight oil reservoirs are rich in resources, but generally have low recovery rates. The average recovery factor of natural depletion in Bakken tight oil reservoir is only 5%–10% (Luo et al., 2017; Wang et al., 2017). China possesses many tight oil resources. Among them, the tight oil in the Ordos Basin is a typical representative of Chinese continental tight oil. It has the advantages of wide distribution, high oil saturation, and large total resources (Yang et al., 2013; Yao et al., 2013; Zou et al., 2013). However, tight oil reservoirs have small pore throats and complex structures (Camp, 2011; Desbois et al., 2011; Shanley and Cluff, 2015). The pore throat size of crude oil extends from micrometer to nanometer, and the pore throat system is highly heterogeneous. Tight oil has development value and is challenging to develop (Jia et al., 2012; Fu et al., 2015; Wu et al., 2019).
Currently, the main methods for studying the structural characteristics of pore throats range from commonly used scanning electron microscopy, environmental scanning electron microscopy, casting thin slices, high-pressure mercury intrusion, and other technologies to the current, advanced nuclear magnetic resonance, constant speed mercury intrusion, Nano-CT scanning, and field emission scanning electron microscopy (Schmitt et al., 2013; Tiwari et al., 2013; Li et al., 2018; Huang et al., 2020a; Zhang et al., 2020c; Meng et al., 2021). Various techniques have their advantages and limitations in characterizing microscopic pore throat characteristics (Schmitt et al., 2015; Qu et al., 2019; Huang et al., 2020b; Wang J. et al., 2021). NMR technology has the advantages of continuous testing, high accuracy, and nondestructive samples and can reflect fluid in pore throats of varied sizes (Brai et al., 2007; Nelson, 2009). The movable fluid parameters obtained using the NMR technology test are an important index to evaluate the degree of fluid utilization and characterize the physical properties and seepage characteristics of tight reservoirs (Gao et al., 2018b; He et al., 2021; Huang et al., 2021). However, a single method to characterize pore throats has limitations. Micropore throat structure studies have gradually transformed into combining multiple methods and fields to adapt to the complexity and particularity of the pore throat system of tight sandstone reservoirs and reflect the reality, system, and comprehensiveness of the structural characteristics of the microscopic pore throat system (Ren et al., 2019; Zhu et al., 2019; Wang W. et al., 2021).
For the Chang 4+5 reservoirs in the Yanchang Formation of the Tiebiancheng area of the Ordos Basin, scholars have analyzed and evaluated the reservoirs from the macro-geological perspectives such as sedimentary characteristics, sand body distribution, and oil-water relationship, but lack of research on the microscopic control mechanism. Therefore, to reveal the microscopic pore throat structure and movable fluid occurrence characteristics of tight sandstone reservoirs, this study focuses on the Chang 4+5 tight oil layer sandstone samples in the Tiebiancheng area of the Ordos Basin, combining casting thin sections, field emission scanning electron microscopy, high-pressure mercury injection, and NMR. From the test results, we classify and evaluate the pore throat structural characteristics of tight sandstone samples, quantitatively characterize the fluid occurrence status of different pore throat structures and tight sandstone sample types, and clarify the influence of reservoir physical properties, clay minerals, and the pore throat structure, explain reservoir development problems from a microscopic perspective. It has guiding significance for exploring and developing the Chang 4+5 reservoirs in the Tiebiancheng area.
2 Geological Profile
The Ordos Basin is located in the central and western regions of China. It is the second largest sedimentary basin in China. The administrative area spans five provinces: Shaanxi, Gansu, Ningxia, Inner Mongolia, and Shanxi. PetroChina Changqing Oilfield is the largest oil and gas field in China, and its exploration and production area is mainly in the Ordos Basin. The geographical location of the Tiebiancheng area is in the Wuqi County, Yan’an City, Shaanxi Province, and is structurally in the middle and western parts of the Yishan Slope Structural Belt in the Ordos Basin (Figure 1). Under the background of the west-dipping monoclinic, a low-amplitude nose-like bulge has developed by differential compaction. Bottom-up drilling encounters Permian, Triassic, Jurassic, and other strata developed from the bottom to the top, and the strata are complete and without shortages (Fu et al., 2020). The Tiebiancheng area is rich in resources and has the large distribution. It is a key oil and gas exploration and development area of the Changqing Oilfield. The Triassic Yanchang Formation Chang 4+5 reservoirs is the main development layer (Wu et al., 2020). The origin system in the northeast controls it, developing a set of delta-front subfacie deposits (Li et al., 2016). The facies-controlled sand bodies have distinct characteristics, and the sand bodies have good connectivity and superimposition. The average sand body thickness is 26.59 m. Feldspar lithic quartz sandstone dominates the lithology, with more than 95% fine sandstone.

FIGURE 1. Geographical location of the Tiebiancheng area.
3 Experimental Section
3.1 Materials
The core samples of this study were collected from the tight sandstone of the Chang 4+5 oil layer of the Yanchang Formation in the Tiebiancheng area in the Ordos Basin (Table 1). From the results of cast thin sections of seven core samples, the clastic components of the Chang 4+5 reservoirs are mainly quartz (44.04%), feldspar (14.17%), rock cuttings (17.91%), and interstitials (16.9%). The porosity is 3.27%–11.60%, with an average value of 7.63%. The permeability is 0.05–0.77 mD, with an average value of 0.30 mD.
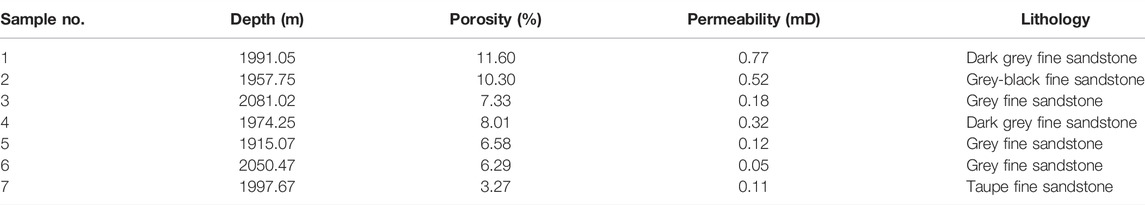
TABLE 1. Petro-physical properties of the seven samples.
3.2 Experimental Setup
The main equipment used in the experiment includes mercury intrusion porosimetry (MIP), NMR, and centrifuge. MIP uses the PoreMaster 60 GT automatic mercury intrusion instrument developed by the Quantachrome Corporation. The working pressure is 0–206.7 MPa, the contact angle is 140°, and the surface tension is 480 mN/m. The technical parameters are as follows: the measurable aperture is 3 nm–1,080 μm, the maximum pressure is 60,000 PSI, the resolution is 0.916 PSIA, the volume accuracy is ±1%, the balance rate is 0–1,000 μl/s, and the balance time is 1–21,600 s. The NMR test uses the MesoMR23-60H-I NMR instrument developed by the Suzhou Niumai Analytical Instrument Corporation, with a magnetic field strength of 0.5 ± 0.05 T and a resonance frequency of 11.854 MHz. The experimental parameters are as follows: the waiting time is 6,000 ms, echo time is 0.2 ms, number of echoes is 18,000, number of scans is 64, radio frequency delay is 0.005 ms, and radio frequency pulse width is divided into 90°pulse width (P1 = 4.6 μs) and 180°pulse width (P2 = 10.4 μs). The centrifuge model is YC-1C, which can be used for rock samples with a diameter of 2.54 cm × 3.00 cm. The maximum speed is 10,000 rpm, and the external rotation radius of the rock samples is 78 mm.
3.3 Experimental Procedures
A core was drilled with a diameter into approximately 2.5 cm on the standard coring. It was placed in alcohol and benzene after numbering, and the extraction container was used to perform the oil-washing. After oil washing, the core was placed in a thermostat and heated to 105°C to maintain the temperature for 48 h. The dry weight of the core was measured, and the air permeability was measured using the steady-state method. After the physical properties of the sample are measured, the drilled core column was cut longitudinally into two parts and, respectively, used for high-pressure mercury intrusion and the NMR movable fluid test. The diameter of each sample remained unchanged after cutting. The length of the high-pressure mercury intrusion sample was between 2.0 and 2.5 cm, and the length of NMR movable fluid test sample was between 4.9 and 5.4 cm.
Before the mercury intrusion experiment, the sample was dried at 150°C for 1 h. The sample was evacuated and filled with mercury, pressurized stepwise and continuously until the maximum mercury inlet pressure (30 MPa) was reached, and decompressed to obtain the mercury removal curve at the end of the experiment. According to the volume and pressure of mercury, the mercury-in-mercury-removal curve was obtained.
Using the high-pressure displacement device, the prepared simulated formation water was used to saturate the core sample at a constant flow rate of 0.1 ml/min. When the liquid volume at the outlet end of the core holder was 3-4PV, the core sample was considered to be completely saturated with water. The core sample was measured for wet weight and the porosity was calculated. The NMR test was performed as the NMR T2 spectrum of the initial state. The core in the water state was put into a high-speed centrifuge and centrifugal force at 1.40 MPa for 3 h (Huang et al., 2019), the core was re-weighed. Measured the NMR T2 spectrum of the core after centrifugation, and calculate the T2cutoff, the movable fluid saturation, and the movable fluid porosity. The T2cutoff is the abscissa value of the intersection of the reverse extension line of the signal accumulation curve after centrifugation and the signal accumulation curve before centrifugation.
4 Results
4.1 Pore Size Characterization
4.1.1 Microcosmic Characterization
The X-ray diffraction whole-rock analysis showed that the tight sandstone clay mineral content of the Chang 4+5 reservoirs is 8.03%–18.79%, with an average of 13.26% (Table 2). Clay minerals are mainly chlorite, illite, and an Illite/Smectite layer with a small amount of kaolinite.
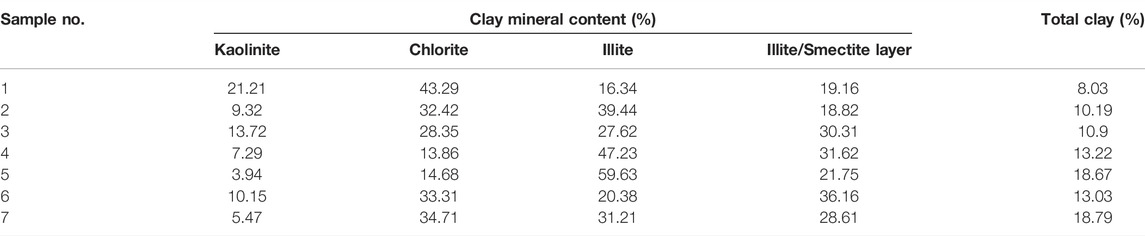
TABLE 2. Clay mineral content of tight sandstone samples of the Chang 4+5 reservoirs.
From the results of the casting thin section (Table 3), the face rate of Type I samples ranged from 5.2% to 7.9%, with an average of 6.6%, the face rate of Type II samples ranged from 1.5% to 6.1%, with an average of 4.1%, and the face rate of Type III samples ranged from 1.2% to 2.8%, with an average of 2.0%. The pore types of the Type I samples are mainly intergranular pores, among which Sample 1 developed microfractures. The pore types of Type II samples are mainly intergranular and intergranular dissolved pores. The pore types of the Type III samples are mainly intergranular and intragranular dissolved pores.
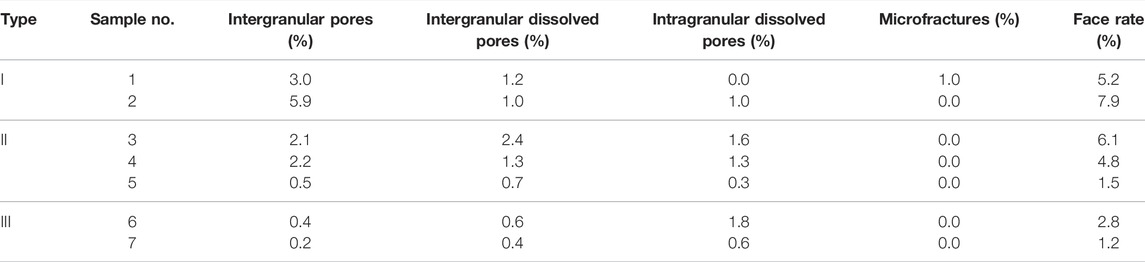
TABLE 3. Pore types of tight sandstone samples of the Chang 4+5 reservoirs.
4.1.2 Relationship Between T2 Response and Pore Throat Radius
The low-field NMR method can nondestructively and effectively identify the occurrence characteristics of reservoir fluids and evaluate the petrophysical parameters of unconventional oil and gas reservoirs. When a core sample containing fluid in a porous medium is placed in a uniform magnetic field, the hydrogen nuclei in the fluid will be polarized by the magnetic field to generate nuclear magnetic resonance. The nuclear magnetic moment of the hydrogen nuclei in the oil and water produces energy-level splitting in a uniformly distributed external static magnetic field. The hydrogen nuclei in the pore throat fluid collide with the pore throat wall during the lateral relaxation movement. The pore throat size in the formation directly determines collision frequency. Therefore, the pore throat size is inversely proportional to the relaxation time of hydrogen nuclei, the theoretical basis for studying rock pore throat structures using NMR T2 relaxation time spectroscopy (Lai et al., 2018; Gao et al., 2019; Zhong et al., 2021). MIP and NMR are vital to quantitatively characterize microscopic pore throats in this study (Hubner 2014; Aliyev et al., 2016). To study the pore throat structure characteristics of core samples under two test methods, the NMR relaxation time and the pore throat radius must be converted (Xiao et al., 2016; Huang et al., 2019; Qu et al., 2020).
Based on the NMR principle, the relaxation time of the rock surface is calculated using
In Eq. 1, ρ2 is the relaxation rate (μm/ms), S/V is the specific surface of the pore throat, FS is the pore throat shape factor (dimensionless), and r is the pore throat radius (μm).
Typically, the relaxation rate and the pore throat shape factor of the porous media are constants and Eq. 1 can be written as
In Eq. 2, C is the conversion constant. Take the logarithm of both ends of Eq. 2 to obtain
In Eq. 3, by setting different C values, the pore throat distribution based on NMR obtained under different C values is calculated. It is compared with the core pore throat distribution obtained using MIP and the deviation coefficient of the pore throat radius under different C values is calculated
Using Eq. 4, the deviation coefficient δ of the pore throat radius under different C values can be calculated. When δ is the smallest, the C value is more reasonable, and the pore throat radius distribution calculated using the C value is the pore throat distribution feature of cores.
Taking Sample 2 as an example, Figure 2 shows the deviation and pore throat size distributions of the conversion coefficient between the calculated value and the mercury injection test value under different conversion coefficients C of the core. The calculation results show that the C value corresponding to the minimum pore throat radius deviation coefficient of the core is 0.073.
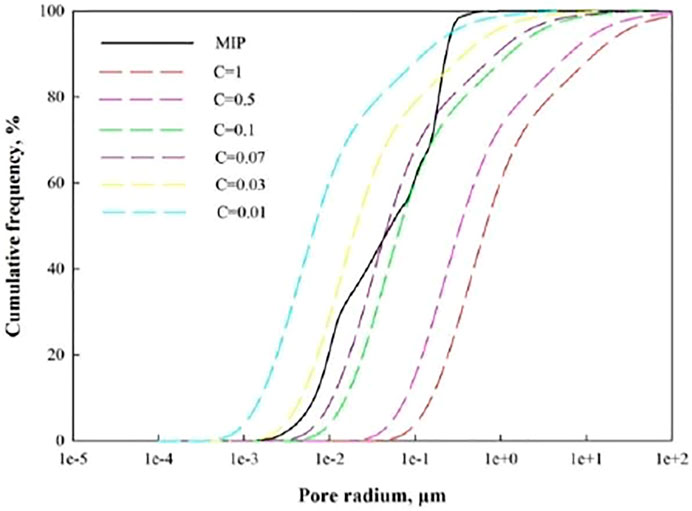
FIGURE 2. Different conversion coefficient C and cumulative frequency of mercury intrusion.
From Figure 3, draw the T2 spectrum distribution and capillary pressure curves of three typical core samples in the same logarithmic coordinate system. Ensure that the relaxation time position corresponding to the T2 spectrum peak coincides with the position of the pore throat radius corresponding to the capillary pressure curve peak (Xiao et al., 2017). Taking Sample 2 as an example, from the converted capillary pressure curve and T2 spectrum, the left and right peaks of the converted T2 spectrum curve correspond to the left and right peaks of the capillary pressure curve one-to-one, indicating that the NMR T2 spectrum distribution can characterize the rock pore throat structure (Fang et al., 2017; Wang et al., 2020). In Figure 4, the pore throat radius distribution range of the capillary pressure curves is narrower than that corresponding to the T2 spectrum. This is mainly because the T2 spectrum distribution reflects all the pore throat spaces in the core sample and has no relation to the connectivity between the pore throats, whereas the mercury injection curve more reflects the connectivity between the pore throats. However, because mercury belong to a strong nonwetting phase, the capillary pressure when it enters the pore throat is much higher than that of the water phase, which may prevent mercury from entering part of the pore throat with high capillary pressure.
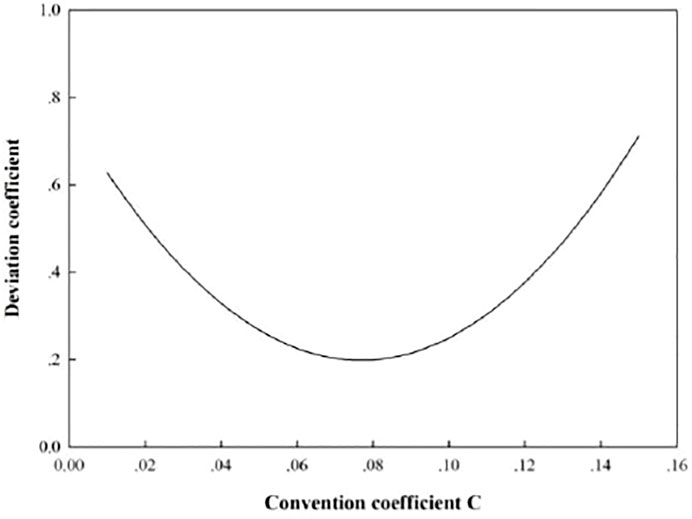
FIGURE 3. The deviation distribution of the conversion coefficient between the calculated and test values.
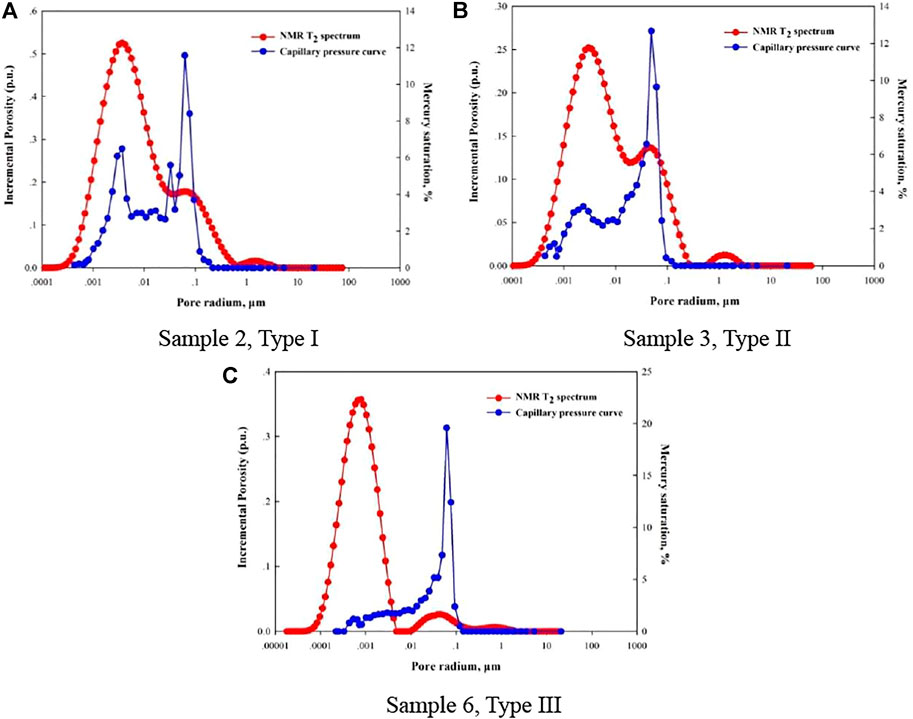
FIGURE 4. T2 spectrum distribution curve and capillary pressure curve of a typical core sample [Panel (A–C) are the relationship between incremental porosity and pore radium of sample 2, sample 3 and sample 6].
Figure 5 shows the mercury advance and retreat curves of tight sandstone core samples of the Chang 4+5 reservoirs and the mercury injection curves of different samples exhibit different curve shapes. The mercury inlet curve position of Samples 1 and 2 tends to move toward the lower left of the figure, the platform range is wide and gentle, and the hysteresis loop of mercury advance and retreat is not obvious. The curve distribution positions of Samples 3, 4, and 5 are slightly higher than those of Samples 1 and 2. The platform range is narrowed, and the hysteresis loop of the mercury advance and retreat curve is narrow. The mercury entry curves of Samples 6 and 7 tend to move toward the upper right of the figure. The plateau range is narrow, and the mercury entry and exit hysteresis loop range is wide. Therefore, based on the characteristics of the advance and retreat mercury curve and the characteristic parameters of mercury intrusion and the pore throat size distribution curve, the mercury intrusion test samples of the tight sandstone of the Chang 4+5 reservoirs in Ordos can be divided into three types.
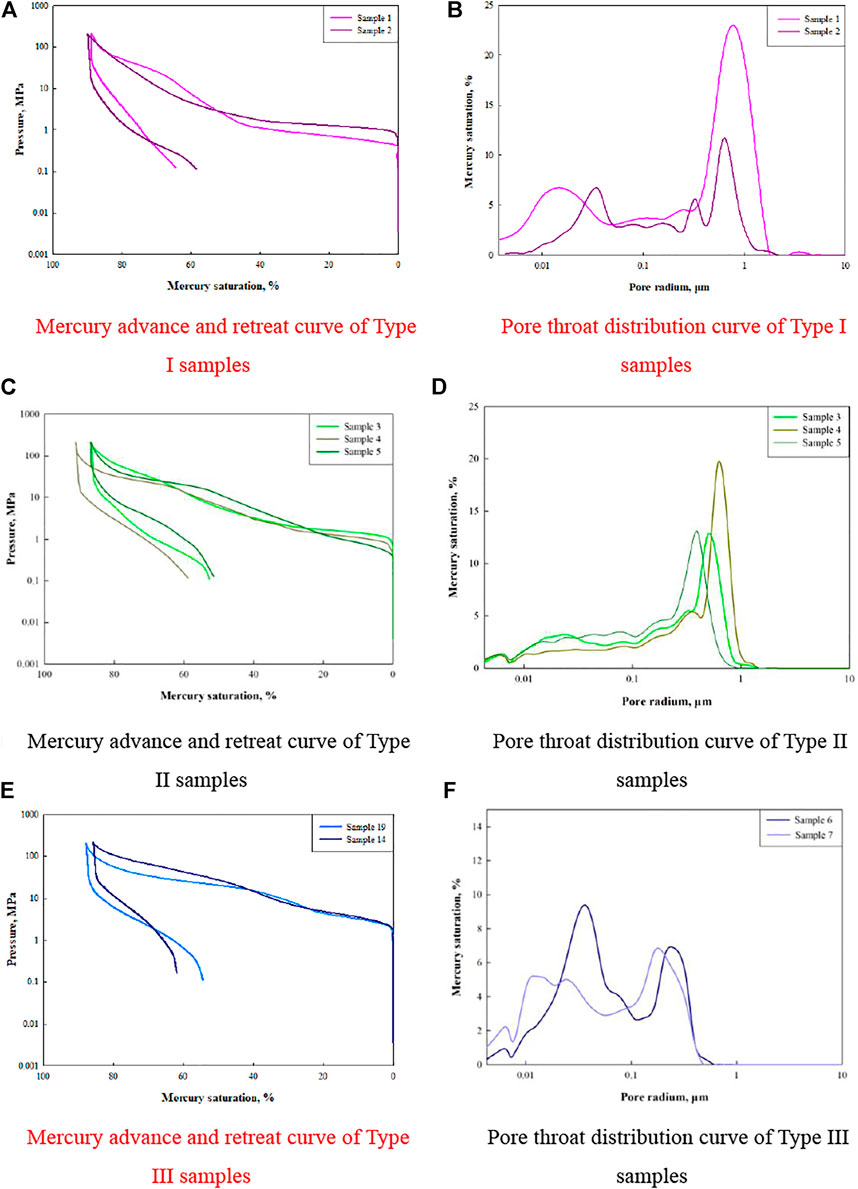
FIGURE 5. Mercury advance and retreat curve and pore throat distribution of tight sandstone samples of the Chang 4+5 reservoirs [Panel (A,C,E) are the relationship between pressure and mercury saturation of type I, type II and type III samples; Panel (B,D,F) are the relationship between mercury saturation and pore radium of type I, type II and type III samples].
Type I contains Samples 1 and 2, and the characteristics of the advance and retreat mercury curve reflect the larger pore throats. The characteristic parameters of mercury intrusion indicate that the average porosity coefficient of this sample type is 0.92, the average sorting coefficient is 2.43, and the throat average is 10.95. Type I samples have larger pore throats and are well sorted. They have a wide pore throat size distribution range, from 0.0043 to 1.83 μm. The pore throat size curve is bimodal, with high macropore throat content and a certain number of smaller pore throats.
Type II includes Samples 3, 4, and 5. The average porosity distortion coefficient is 0.50, the average sorting coefficient is 2.04, and the throat average is 11.87. The pore throat size of Type II samples decreases, and the sorting is worse than that of Type I samples. The pore throat size distribution range of Type II sample is wide (0.0043–1.20 μm). The pore throat size curve is unimodal, the larger pore throat content is high, and the smaller pore throats are undeveloped.
Type III includes Samples 6 and 7. The samples have a certain number of smaller pore throats. The average pore throat distortion coefficient is −0.11, the average sorting coefficient is 1.74, and the throat average is 13.33. Type III samples have smaller pore throats and poor sorting. The pore throat size distribution range of Type III samples is narrow, from 0.0043 to 0.49 μm, the pore throat size curve is bimodal, and the development of smaller pore throats is high.
The threshold pressure in the core samples of the tight sandstone reservoirs of the Chang 4+5 reservoirs is between 0.40 and 2.26 MPa, with an average of 1.10 MPa. The median radius is between 0.03 and 0.32 μm, with an average of 0.15 μm. The maximum mercury saturation is relatively high, between 85.75 and 91.07%, with an average of 88.55%. The mercury removal efficiency is low, from 27.48% to 40.86%, with an average of 34.90%. The lower mercury removal efficiency is related to the substantial number of micropores–nanopores in the reservoir and the high clay mineral content of the sandstone.
Type I samples have a low threshold pressure, an average of 0.42 MPa; a high maximum mercury saturation, an average of 89.85%; and a low mercury removal efficiency, an average of 31.34%. The threshold pressure of Type II samples is between 0.78 and 1.19 MPa, with an average of 0.92 MPa. The maximum mercury saturation is between 86.83 and 89.92%, with an average of 88.85%, and the mercury removal efficiency is higher than Type I, with an average of 38.43%. Type III samples have a high threshold pressure, an average of 2.06 MPa, a low maximum mercury saturation, an average of 86.79%, and a mercury removal efficiency of 33.08%, not significantly different from those of Type I and II samples (Table 4).
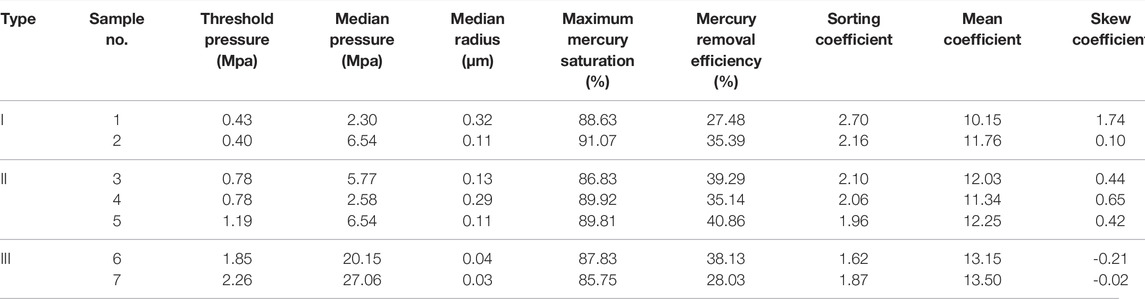
TABLE 4. Pore throat characteristic parameters of tight sandstone samples of the Chang 4+5 reservoirs.
4.1.3 Pore Throat Size Characterization Using NMR
Figure 6 shows the NMR T2 spectrum of the tight sandstone core samples of the Chang 4+5 reservoirs in the initial state. The pore throats of the Type I sample have a wide distribution range, and the T2 spectrum curve is bimodal with a high left and a low right, indicating that the sample contains a certain number of larger pore throats; however, overall, the smaller pore throat content is higher than the larger pore throat content. The pore throat distribution range of the Type II samples is narrower than those of the Type I samples. The amplitude of T2 spectrum curve decreases, is approximately bimodal, and the left peak is higher than the right peak, indicating a high smaller pore throat content. The macropore throat content of Type II samples is significantly lower than that in Type I samples. The amplitude of NMR T2 spectrum curve of the Type III sample has decreased, and the pore throat distribution range is narrow. Among them, the NMR T2 spectrum of the Sample 6 has two peaks, among which the left peak has a high peak and a narrow distribution range, indicating that the core sample has a high development degree of smaller pore throats, but the diameter of the smaller pore throats is limited. The right peak is not obvious, indicating that the larger pore throats of the Sample 6 are hardly developed. The development degree of the pore throat of Sample 7 is poorer than Sample 6. Based on the initial state NMR T2 spectrum of the three core sample types, there is a good correlation with the above mercury intrusion test results, indicating that the classification method for core samples in this article is reliable.
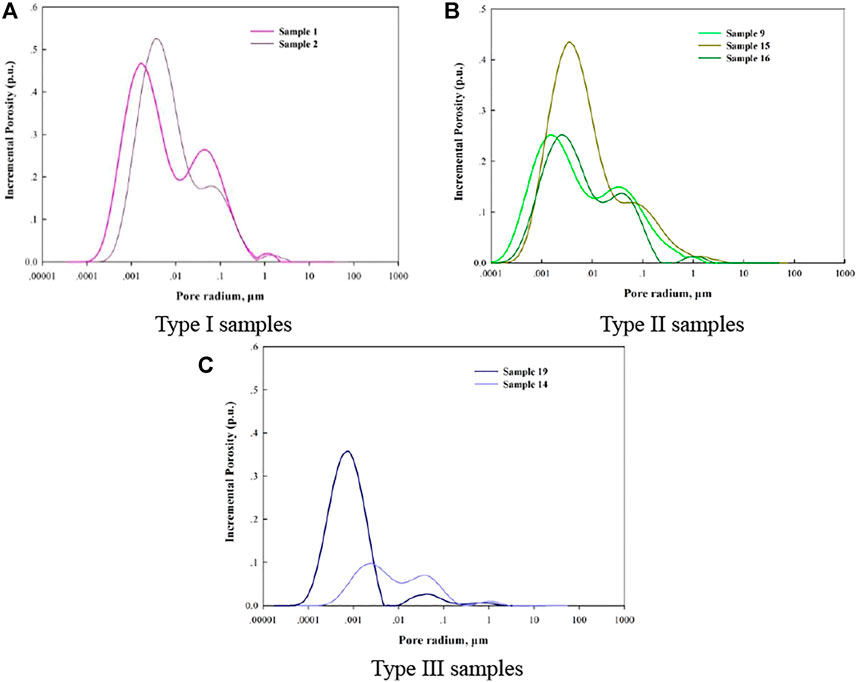
FIGURE 6. NMR T2 spectra in the initial state [Panel (A–C) are the relationship between incremental porosity and pore radium of type I, type II and type III samples].
4.2 NMR T2 Spectrum and Parameters
Figure 7 shows the NMR T2 spectrum of the tight sandstone core samples of the Chang 4+5 reservoirs before and after centrifugation. In the Type I samples, the NMR T2 spectrum curve of Sample 1 after centrifugation showed a bimodal state. The left and right peaks exhibit a certain degree of decrease, the right peak exhibits a significant decrease, and the left peak exhibits a small decrease, indicating that the movable fluid is mainly endowed in larger pore throat. The NMR T2 spectrum curve of Sample 2 after centrifugation also showed a bimodal state. The T2 spectrum change characteristics are similar to Sample 1, indicating that the movable fluid content of Type I samples was highest. Furthermore, the movable fluid is mainly contained in the larger pore throat, and the fluid in the smaller pore throat is challenging to be used passively.
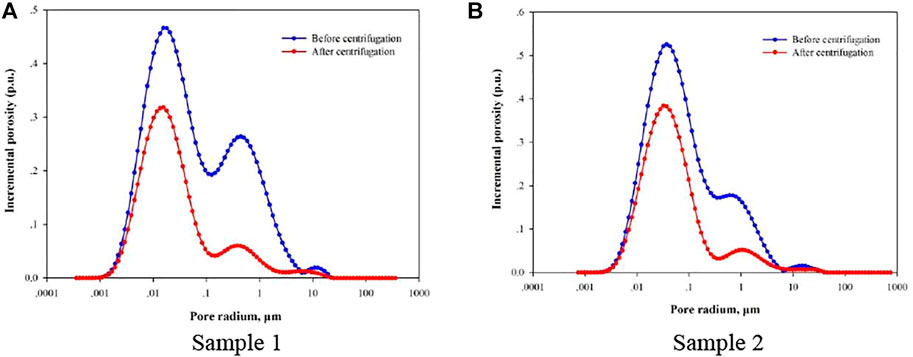
FIGURE 7. NMR T2 spectrum of Type I Samples [Panel (A,B) are the relationship between incremental porosity and pore radium of sample 1, sample 2].
In Type II samples (Figure 8), the NMR T2 spectrum curve of Sample 3 after centrifugation showed an approximately bimodal state, with the left and right peaks decreasing to a certain extent, the right peak decreasing clearly, and the left peak decreasing insignificantly, indicating that the movable fluid is mainly contained in the larger pore throat and the fluid in the smaller pore throat is almost unused. The NMR T2 spectrum curves of Samples 4 and 5 after centrifugation have a small overall change range, and the curve shows an approximately bimodal state. The result shows that the movable fluid content in Type II samples is lower than Type I samples, and a certain amount of fluid in the larger pore throat can be mobilized. However, the fluid in the smaller pore throat is still difficult to use.
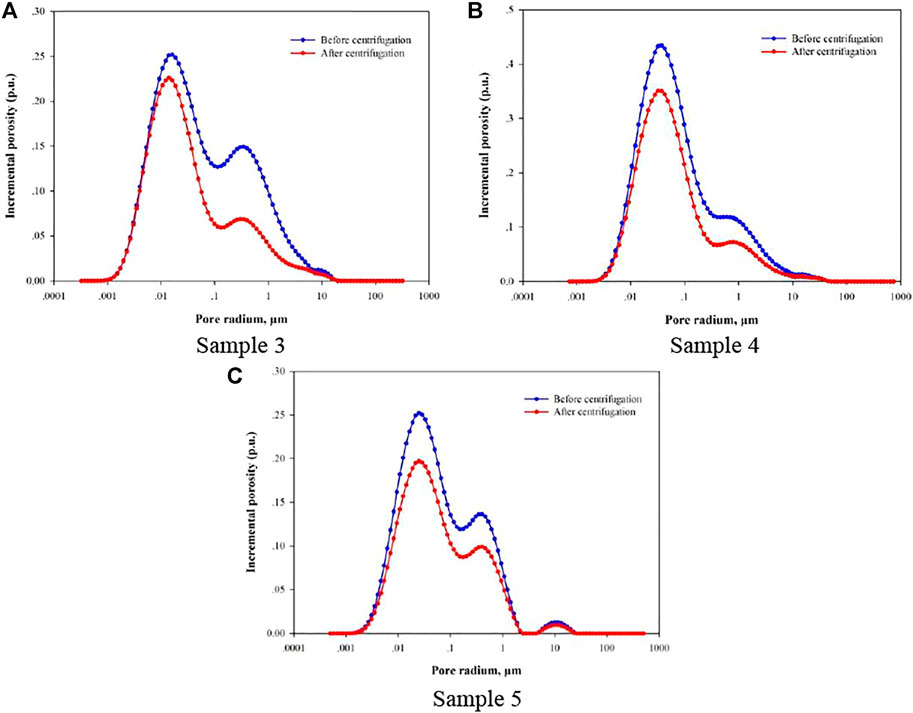
FIGURE 8. NMR T2 spectrum of Type II Samples [Panel (A–C) are the relationship between incremental porosity and pore radium of sample 3, sample 4 and sample 5].
In Type III samples (Figure 9), the NMR T2 spectrum curve of Sample 6 after centrifugation showed an approximately unimodal state, the right peak is not obvious, and a certain degree of decrease occurs in the range of the left peak corresponding to the smaller pore throat; in addition, the decrease is small. It indicates that Sample 6 has less movable fluid, mostly in the smaller pore throat and the movable fluid content in the larger pore throat is low and challenging to be passively used. The NMR T2 spectrum curve of Sample 7 after centrifugation showed a multimodal state. The peak value near 10 μm indicates that the sample contains microcracks. The overall decrease in the T2 spectrum is not obvious, and fluids in larger pore throats and microfractures are easier to use passively than fluids in smaller pore throats. The result shows that the movable fluid content in Type III samples is low and fluids in the overall pore throat is challenging to be used passively.
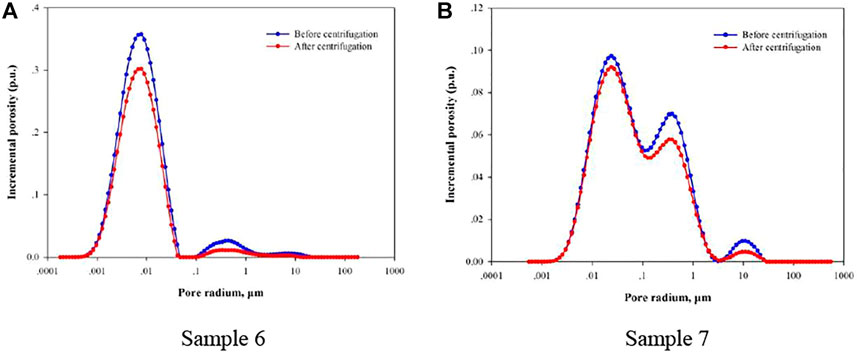
FIGURE 9. NMR T2 spectrum of Type III Samples [Panel (A,B) are the relationship between incremental porosity and pore radium of sample 6, sample 7].
Movable fluid saturation of tight sandstone reservoir core samples of the Chang 4+5 reservoirs ranged from 9.62% to 52.67%, with an average of 28.85%. Movable fluid porosity ranges from 2.78% to 12.59%, with an average of 8.03%. The T2 cutoff value is between 0.91 and 15.11 ms, with an average of 4.33 ms. The T2 cutoff value reflects the limit of the movable and bound fluids. Therefore, the T2 cutoff value can reflect the minimum pore throat radius of the movable fluid. According to the conversion factor C and the T2 cutoff value, the pore throat radius corresponding to the T2 cutoff value can be calculated, the movable fluid minimum pore throat radius. The movable fluid minimum pore throat radius in the tight sandstone core samples of the Chang 4+5 reservoirs is 0.016–0.831 μm, with an average value of 0.232 μm. The result shows that the movable fluid minimum pore throat radius of the Chang 4+5 tight sandstone reservoir is small; however, the distribution range is wide and the reservoir heterogeneity is serious.
The movable fluid saturation and porosity of the Type I samples are high. The average movable fluid saturation is 46.82%, the average movable fluid minimum pore throat radius is 0.056 μm. The movable fluid saturation of Type II samples is with an average of 26.51%. The movable fluid minimum pore throat radius is with an average of 0.222 μm. The movable fluid saturation and porosity of Type III samples are low. The average movable fluid saturation is 14.39%, and the pore throat radius is 0.424 μm (Table 5).

TABLE 5. NMR movable fluid parameters of tight sandstone samples in the Chang 4+5 reservoirs.
5 Analysis and Interpretation
5.1 Movable Fluid Occurrence Characteristics
The movable fluid saturation in the different range of pore throats can be calculated based on the NMR T2 spectrum. The movable fluid saturation of the overall pore throat is the ratio of the difference between the T2 spectrum curve and the X-axis enclosed area before and after centrifugation to the T2 spectrum curve before centrifugation and the X-axis enclosed area during the corresponding relaxation time of the overall pore throat. In the same way, the movable fluid saturation of the smaller and larger pore throat is the ratio of the difference between the T2 spectrum curve and the X-axis enclosed area before and after centrifugation to the T2 spectrum curve before centrifugation and the X-axis enclosed area during the corresponding relaxation time of the smaller and larger pore throat. The seven core samples have different distribution ranges of overall pore throats, smaller pore throats, and larger pore throats, the movable fluid saturation needs to be calculated separately.
NMR results showed that initial state T2 spectra of seven tight sandstone samples are bimodal or nearly bimodal. To compare and analyze tight sandstone sample characteristics, the position of the T2 spectrum trough in the initial state distinguishes larger and smaller pore throats. The movable fluid saturation of Type I samples is the highest, from 52.67% to 40.96%, with an average of 46.82% (Table 6). The movable fluid of Type I samples mostly comes from smaller pore throats. The movable fluid saturation of Type II samples is between 23.59% and 30.79%, with an average of 26.51%. The movable fluid of Type II samples mostly comes from the smaller pore throat, and a slight difference occurs in the saturation of the movable fluid between the smaller and larger pore throats. Type III samples have the lowest movable fluid saturation, from 9.62% to 19.16%, with an average of 14.39%. The movable fluid of Type III samples still mainly in the smaller pore throats.
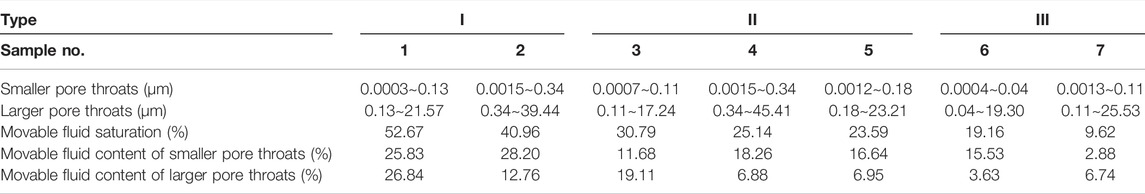
TABLE 6. Movable fluid saturation of tight sandstone samples of the Chang 4+ 5 reservoirs.
Previous studies have proposed that the movable fluid content in larger pore throats is higher than that in smaller pore throats, and the fluid in smaller pore throats is more difficult to use. NMR result statistics of seven tight sandstone samples in this study showed that the movable fluid saturation of the smaller pore throat of Samples 2, 4, 5, and 6 is higher than that of the larger pore throats and that of the larger pore throats of Samples 1, 3, and 7 is higher than that of the smaller pore throats. The core sample has a high degree of fluid utilization in the smaller pore throat (Figure 10).
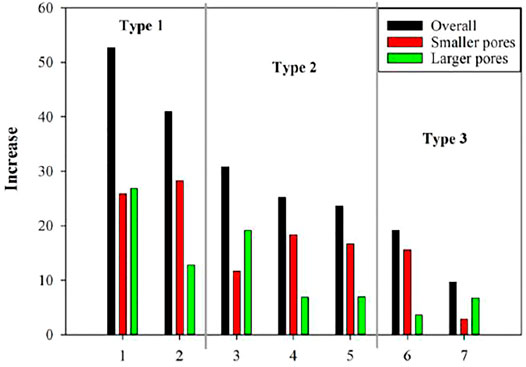
FIGURE 10. Movable fluid saturation with different pore throats in tight sandstone samples of the Chang 4+5 reservoirs.
Based on the NMR T2 spectra before and after centrifugation, the fluid content of different pore throats in different states was calculated (Table 7; Figures 11, 12). Smaller pore throat content is high in Type I samples. In the initial state, the main storage space of the fluid is also in smaller pore throats, but after NMR centrifugation, it can be used passively and to the highest degree. The smaller pore throat fluid of Type II samples can be used. However, except for Sample 3, the fluid content of the larger pore throats of other samples has minimum change. Among the Type III samples, Sample 6 has high contents of smaller pore throats and movable fluids with smaller pore throats and the fluids with larger pore throats are almost impassively used. The fluid in Sample 7 is present in the smaller and larger pore throats, is used passively after NMR centrifugation, and the movable fluid with the larger pore throat is used to a higher degree.
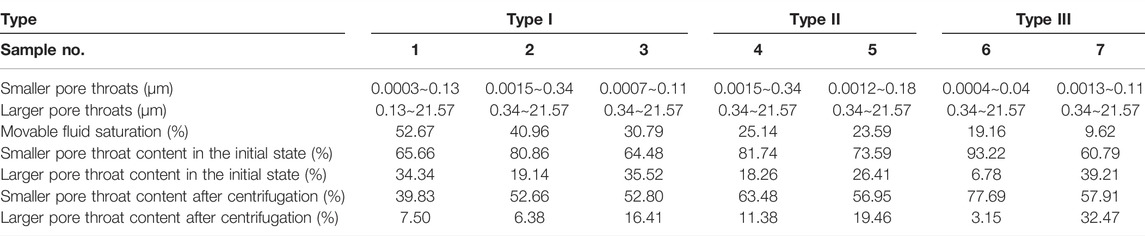
TABLE 7. Relative contents of movable fluids in different pore throats of tight sandstone samples of the Chang 4+5 reservoirs.
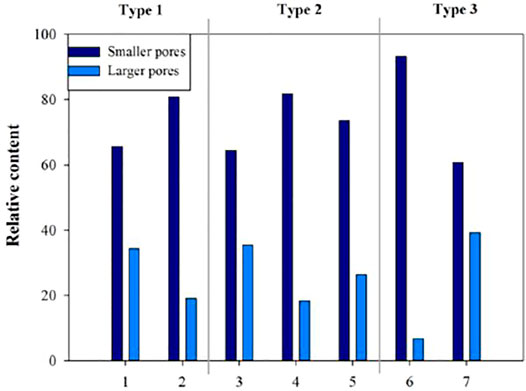
FIGURE 11. Relative contents of different pore throats in the initial state of tight sandstone samples of the Chang 4+5 reservoirs.
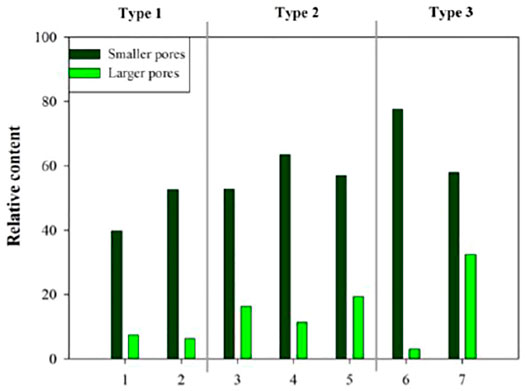
FIGURE 12. Relative contents of different pore throats in tight sandstone samples of the Chang 4+5 reservoirs after centrifugation.
The seven tight sandstone core samples are divided into Types I, II, and III according to the microscopic pore throat characteristics, and from Type I to III samples, the degree of pore throat development and connectivity deteriorated (Figure 13). Figure 13A shows the fluid content of smaller pore throats before and after centrifugation. Except for Sample 7, the fluid content of other samples before and after centrifugation shows a slight difference. Figure 13A shows that although the pore throat structure of the sample gets worse, the fluid in the smaller pore throats can still be used. Figure 13B shows the fluid content of larger pore throats before and after centrifugation. As the pore throat structure of the sample becomes worse, the movable fluid in the larger pore throats becomes significantly less. From Type I to III samples, the overall movable fluid saturation is reduced, and the movable fluid gaps are mostly reflected in the larger pore throats. Therefore, as the pore throat structure becomes worse, the fluid in the larger pore throats becomes increasingly challenging to use, decreasing the overall movable fluid saturation of sample.
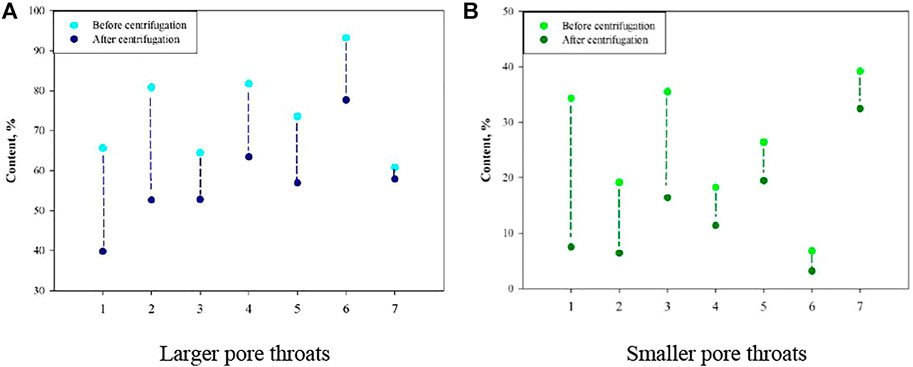
FIGURE 13. Relative content of different pore throats before and after centrifugation of tight sandstone samples of the Chang 4+5 reservoirs [Panel (A,B) are the correlation between content and sample of larger pore throats, smaller pore throats].
5.2 Influence of Petrophysical Characteristics
The movable fluid in the tight sandstone samples of the Chang 4+5 reservoirs has a large utilization range, and the movable fluid saturation is between 9.62% and 52.67%; moreover, the movable fluid parameters are different. This study takes reservoir physical properties, clay minerals, and pore throat characteristics as the main control factors to evaluate their control mechanisms on movable fluid parameters.
Movable fluid saturation has a certain positive correlation with reservoir physical properties; therefore, the better the physical properties are, the higher is the movable fluid content. The positive correlation (R2 = 0.5653) between the movable fluid and porosity is poor (Figure 14A) because high porosity cannot indicate good pore throat connectivity; therefore, it cannot indicate a high degree of fluid use. The porosity has the worse correlation with smaller and larger pore throats, with correlation coefficients of 0.3382 and 0.4369, respectively; therefore, porosity is not the main factor affecting the occurrence characteristics of different pore throat fluid types. The positive correlation (R2 = 0.8507) between the movable fluid and permeability is good (Figure 14B). The correlation coefficient between smaller pore throats and permeability is higher than that between larger pore throats and permeability. When the pore throat size increases, the movable fluid is less affected by the permeability; however, it will be affected by the combined effects of other factors.
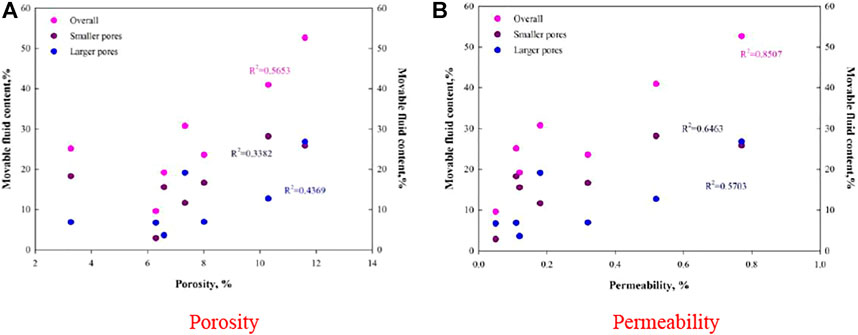
FIGURE 14. The relationship between movable fluid saturation and physical properties [(A,B) are the relationship between movable fluid saturation and porosity, permeability].
Movable fluid saturation has a negative correlation (R2 = 0.4294) with clay content (Figure 15A). The swelling and shedding of clay minerals in contact with water will block the pore throats, resulting in poor fluid utilization in the reservoir. However, the correlation coefficient between the movable fluid saturation of the smaller pore throat and clay mineral content is 0.0982, which indicates almost no correlation, whereas the movable fluid saturation of the larger pore throat has a good correlation (R2 = 0.6377) with the clay mineral content. The movable fluid saturation of the smaller pore throat has a good correlation (R2= 0.7002) with the smectite and the Illite/Smectite layer. Therefore, reducing movable fluid with smaller pore throats is related to reservoir water sensitivity (Figure 15B).
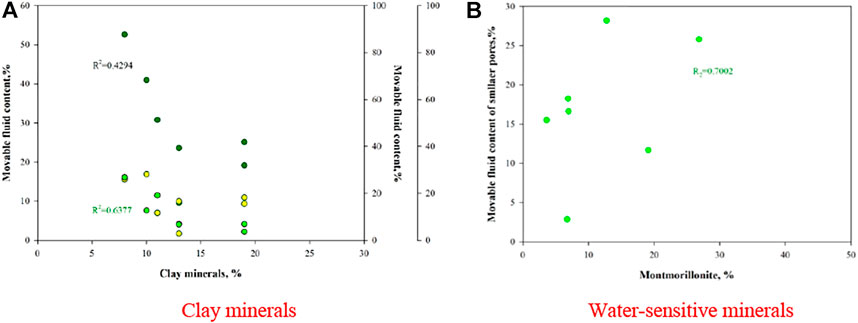
FIGURE 15. The correlation between the saturation of the movable fluid and clay minerals [(A,B) are the correlation between the movable fluid saturation and overall clay minerals, water-sensitive minerals].
Figure 16 shows the scanning electron microscopy results. The intergranular and intergranular dissolved pores of Type I samples are developed, and the chlorite film is distributed parallel to the edges of clastic particles, playing a constructive role in preserving the pore throats. Type II samples have developed intergranular, dissolved, and intercrystalline pores. Illite cuts the pore throats to reduce the seepage capacity. However, kaolinite replaces feldspar particles, turning the space originally belonging to clastic particles into tiny pore throats with intercrystalline micropores. Simultaneously, the associated dissolution increases the ratio of dissolved pores, increasing the porosity of reservoir to a certain extent. The intergranular dissolved pores of Type III samples are developed, and the cementation of carbonate minerals is obvious.
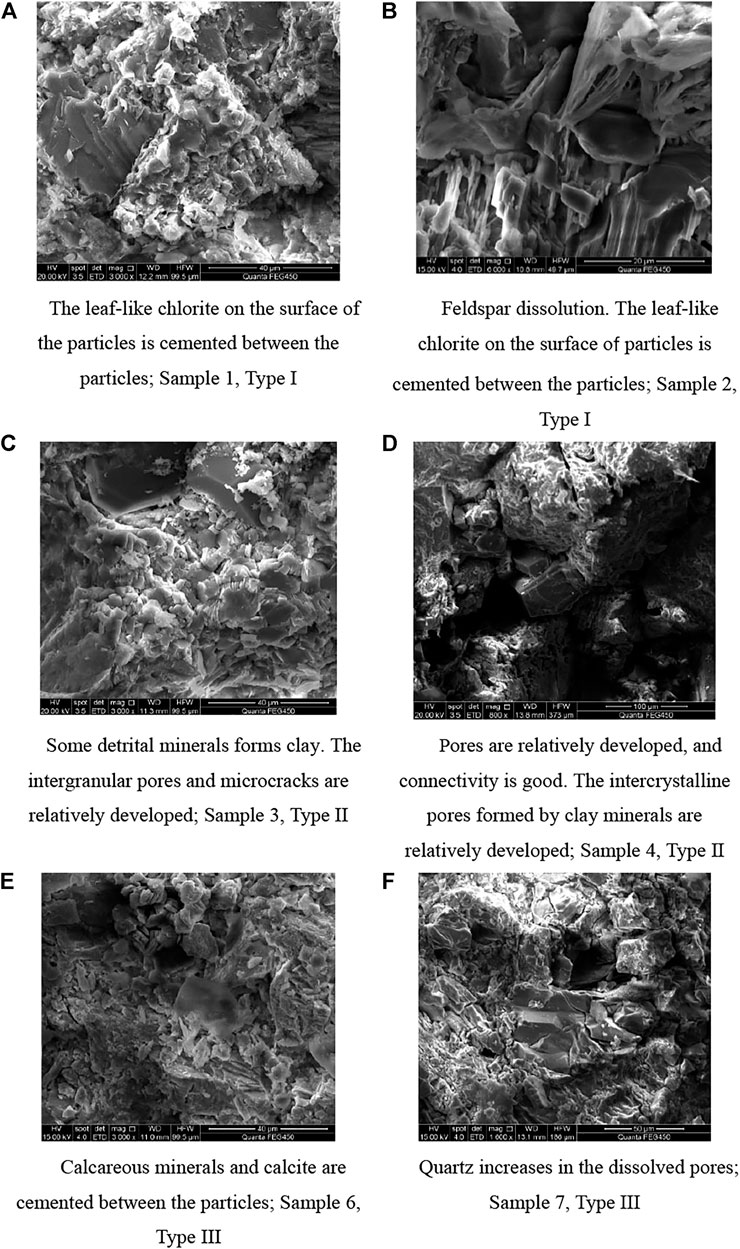
FIGURE 16. Scanning electron microscopy photo of tight sandstone in the Chang 4+5 reservoirs.
5.3 Influence of Pore Throat Structure
Based on the pore throat characteristic parameters of the Chang 4+5 reservoirs obtained from the mercury injection test, correlation analysis between the movable fluid saturation and pore throat characteristic parameters of the core samples is conducted. The overall pore throat movable fluid saturation has a certain correlation with the threshold pressure and the sorting, mean, and distortion coefficients (Figure 17A). With the lower threshold pressure, the smaller sorting coefficients and the larger mean coefficient. The higher saturation of the movable fluid, and the fluid is easier to be used passively. Among them, the overall movable fluid saturation of the pore throat correlates negatively with the sorting coefficient and the correlation is good (R2 = 0.8820). The correlations with the threshold pressure, the mean coefficient, and the skewness coefficient are equally good at 0.4922, 0.5866, and 0.5302, respectively.
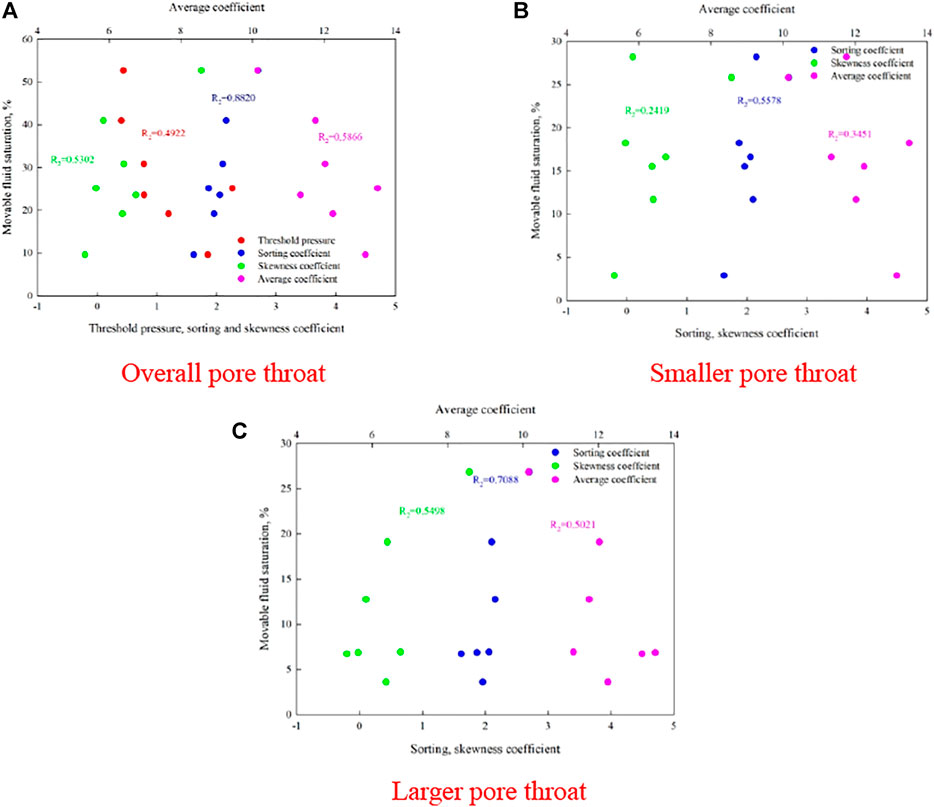
FIGURE 17. Correlation between movable fluid saturation and characteristic parameters of pore throats [(A,B,C) are the correlation between movable fluid saturation and characteristic parameters of overall pore throats, smaller pore throats, and larger pore throats].
The movable fluid saturation of the smaller pore throat correlates weakly with the characteristic parameters of the smaller pore throat (Figure 17B). The movable fluid saturation of the smaller pore throat has a better correlation with the sorting coefficient (R2 = 0.5578). When the pore throat sorting coefficient increases, the movable fluid with the smaller pore throat is used more. The change in the movable fluid with the smaller pore throat is because of multiple factors, and it is challenging to have a good correlation with a single factor; for example, the high content of water-sensitive minerals can clog pore throats.
The movable fluid saturation of the larger pore throat has a better correlation with the characteristic parameters of the pore throat (Figure 17C). The movable fluid saturation of the larger pore throat correlates well with the sorting coefficient (R2 = 0.7088), followed by the mean and distortion coefficients (R2 = 0.5021 and 0.5498, respectively). With the smaller sorting coefficient, the smaller distortion coefficient and the larger mean coefficient. The higher movable fluid saturation of the larger pore throat, and strongly controlled by the pore throat structure.
The pore types of the Type I samples are mainly intergranular pores, among which Sample 1 develops microfractures. The pore types of Type II samples are mainly intergranular and intergranular dissolved pores. The pore types of the Type III samples are mainly intergranular and intragranular dissolved pores (Figure 18).
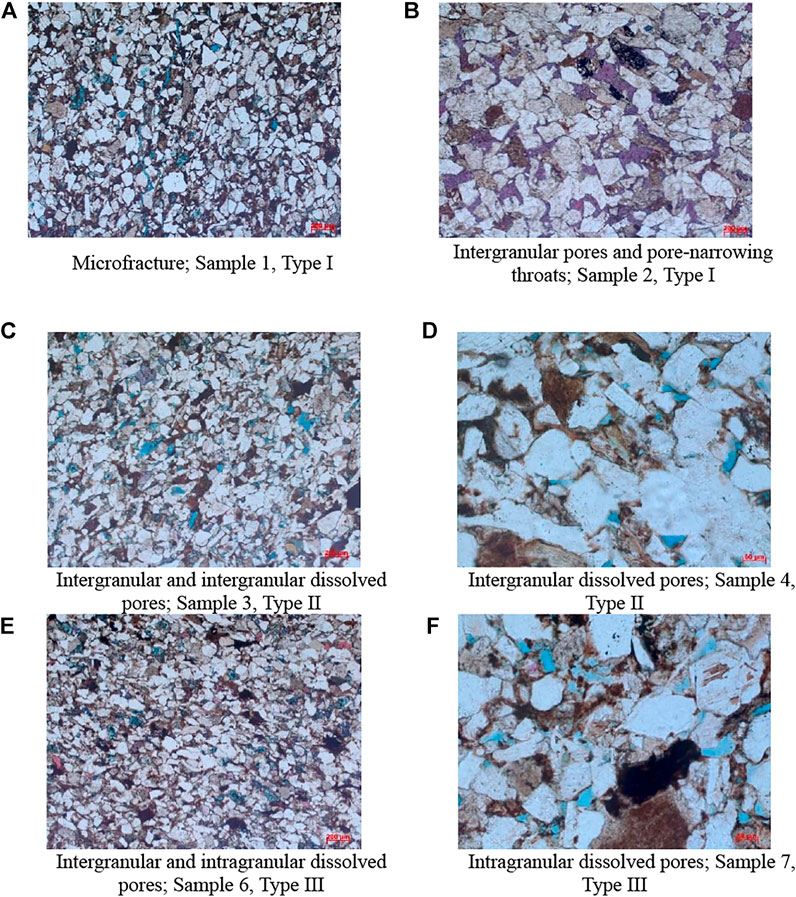
FIGURE 18. Photographs of casting thin sections of tight sandstone samples in the Chang 4+5 reservoirs.
A positive correlation (R2 = 0.3941) exists between the overall movable fluid saturation of the pore throat and the face rate (Figure 19A), indicating that a high face rate corresponds to a high fluid-utilization degree in the pore throat. The correlation analysis of the movable fluid saturation with smaller pore throats and the content of intergranular, intergranular dissolved, and intragranular dissolved pores shows that the movable fluid saturation with smaller pore throats correlates positively (R2 = 0.5242) with the intergranular dissolved pores, and the correlation is better (Figure 19B). The intragranular dissolved pores and smaller pore throats have a certain negative correlation (R2 = 0.4437). No correlation exists between the movable fluid saturation with smaller pore throats and the intergranular dissolved pores. Therefore, the Chang 4+5 core samples have a relatively high proportion of intergranular and intragranular dissolved pores in the smaller pore throats, and the intergranular pores are well developed. The fluidity in the pore throat is improved, and developing intragranular dissolved pores is not conducive to fluid utilization. The correlation analysis between the movable fluid saturation of the larger pore throat and the development degree of different pore-type contents is poor (Figure 19C). Movable fluid saturation correlates positively with intergranular dissolved and intergranular pores, and the correlation coefficients are 0.3305 and 0.2230, respectively, which have no correlation with intragranular dissolved pores. The Chang 4+5 core samples have complex pore types with larger pore throats, and the development degree of different pore throats affects the law of fluid utilization in the larger pore throats.
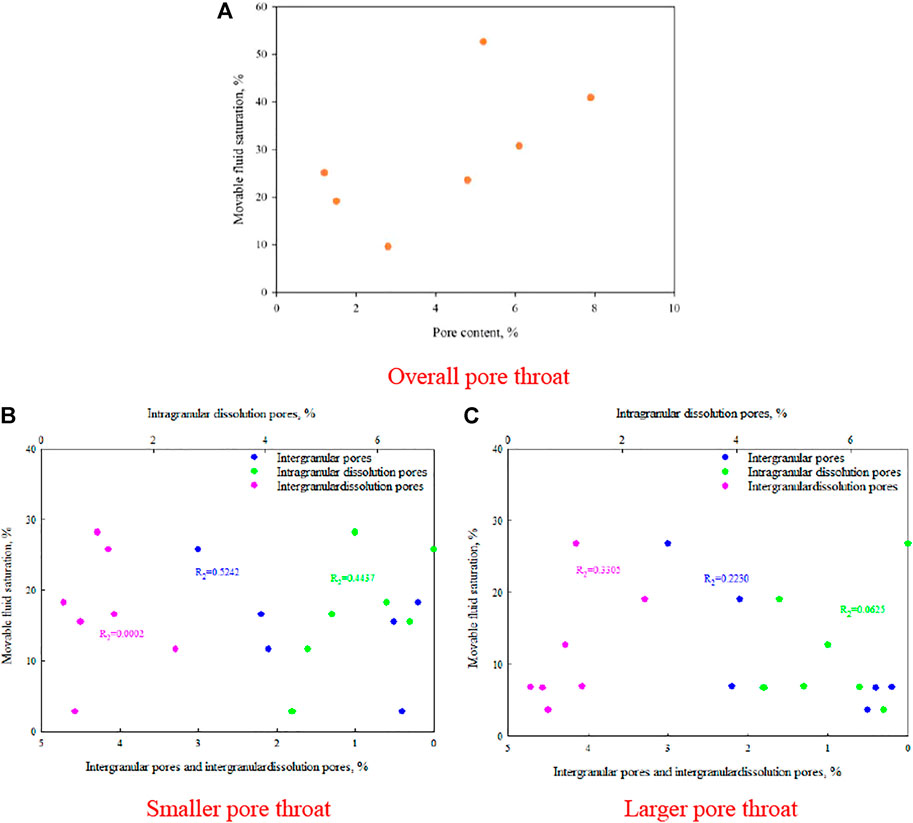
FIGURE 19. Correlation between movable fluid saturation and pore types [(A,B,C) are the correlation between movable fluid saturation and overall pore throats, smaller pore throats, and larger pore throats].
6 Conclusion
• Movable fluid saturation of tight sandstone reservoir core samples of the Chang 4+5 reservoirs ranges from 9.62% to 52.67%, with an average of 28.85%. The minimum pore throat radius of the movable fluid ranges from 0.016 to 0.831 μm, with an average value of 0.232 μm. However, the distribution range is wide, and the reservoir heterogeneity is serious.
• Type I reservoirs in the tight sandstone reservoirs of the Chang 4+5 reservoirs have a high degree of pore throat development and good connectivity. Type II reservoirs have the higher degree of pore throat development and general connectivity. Type III reservoirs have the worst degree of pore throat development, with more scattered and isolated pores.
• The smaller pore throats in the tight sandstone reservoir core samples of the Chang 4+5 reservoirs are distributed among 0.0003 and 0.34 μm. The larger pore throats are distributed among 0.04 and 45.41 μm. The pore throat of the Chang 4+5 tight sandstone reservoir is relatively small, but the movable fluid content in the smaller pore throats is high. With the deteriorating pore throat structure of different reservoir, the fluid-utilization degree in larger pore throats decreases, whereas it does not significantly change in smaller pore throats.
• The movable fluid parameters of the tight sandstone reservoirs of the Chang 4+5 reservoirs correlate positively with permeability and the sorting coefficient. The fluid occurrence characteristics of pore throats of different scales are because of a combination of multiple factors. The lower the clay mineral content is, the better is the pore throat sorting and the more developed are the intergranular and intergranular dissolved pores, which can increase the movable fluid content in the larger pore throats.”
Chang 4+5 reservoirs in Tiebiancheng area are the typical tight oil reservoirs. In this manuscript, the classification evaluation criteria of tight oil reservoirs from a microscopic perspective are established, the fluid occurrence characteristics and controlling factors of different types of tight oil reservoirs are clarified. Generally speaking, high-quality reservoirs in tight sandstone reservoirs have the high degree of pore-throat development and pore-throat connectivity. The pore-throat characteristic parameters reflect the characteristics of low pore-throat pressure, high maximum mercury injection saturation, and high sorting coefficient. This type of reservoirs has high movable fluid saturation, and the minimum pore throat radius of movable fluid is small. Previous studies believed that the movable fluid mainly came from the larger pore throats. However, the results show that reservoirs with small pore throats and high small pore throats content can still have high movable fluid saturation, the reservoirs with small pore throats but high movable fluid content have development value.
Data Availability Statement
The original contributions presented in the study are included in the article/Supplementary Material, further inquiries can be directed to the corresponding authors.
Author Contributions
KW: Conceptualization, Formal analysis, Writing-original draft. DC: Methodology. WZ: Validation. HY: Data curation. HW: Investigation. XC: Software. YQ: Formal analysis. MH: Supervision, Writing—review and editing. All authors contributed to the article and approved the submitted version.
Funding
This study was supported by the Open Fund (XSTS-202101) of Xi’an Key Laboratory of Tight oil (Shale oil) Development. Authors sincerely thank State Key Laboratory of Continental Dynamics of Department of Geology of Northwest University and the No. 8 Oil Production Plant of PetroChina Changqing Oilfield Company for providing the drill cores used in this study.
Conflict of Interest
Authors DC, WZ and HY are employed by PetroChina.
The remaining authors declare that the research was conducted in the absence of any commercial or financial relationships that could be construed as a potential conflict of interest.
Publisher’s Note
All claims expressed in this article are solely those of the authors and do not necessarily represent those of their affiliated organizations, or those of the publisher, the editors and the reviewers. Any product that may be evaluated in this article, or claim that may be made by its manufacturer, is not guaranteed or endorsed by the publisher.
References
Aliyev, E., Saidian, M., Prasad, M., and Russell, B. (2016). Rock Typing of Tight Gas Sands: a Case Study in Lance and Mesaverde Formations from Jonah Field. J. Nat. Gas Sci. Eng. 33, 1260–1270. doi:10.1016/j.jngse.2015.12.045
Brai, M., Casieri, C., De Luca, F., Fantazzini, P., Gombia, M., and Terenzi, C. (2007). Validity of NMR Pore-Size Analysis of Cultural Heritage Ancient Building Materials Containing Magnetic Impurities. Solid State. Nucl. Magn. Reson. 32 (4), 129–135. doi:10.1016/j.ssnmr.2007.10.005
Camp, W. K. (2011). Pore-throat Sizes in Sandstones, Tight Sandstones, and Shales: Discussion. Bulletin 95 (8), 1443–1447. doi:10.1306/12141010019
Chen, L., Liu, K., Jiang, S., Huang, H., Tan, J., and Zuo, L. (2021). Effect of Adsorbed Phase Density on the Correction of Methane Excess Adsorption to Absolute Adsorption in Shale. Chem. Eng. J. 420 (2), 127678. doi:10.1016/j.cej.2020.127678
Chen, L., Zuo, L., Jiang, Z., Jiang, S., Liu, K., Tan, J., et al. (2019). Mechanisms of Shale Gas Adsorption: Evidence from Thermodynamics and Kinetics Study of Methane Adsorption on Shale. Chem. Eng. J. 361, 559–570. doi:10.1016/j.cej.2018.11.185
Desbois, G., Urai, J. L., Kukla, P. A., Konstanty, J., and Baerle, C. (2011). High-resolution 3D Fabric and Porosity Model in a Tight Gas sandstone Reservoir:A New Approach to Investigate Microstructures from Mm- to Nm-Scale Combining Argon Beam Cross-Sectioning and SEM Imaging. J. Pet. Sci. Eng. 78 (2), 243–257. doi:10.1016/j.petrol.2011.06.004
Fang, T., Zhang, L. K., Liu, N. G., Zhang, L. Q., Wang, W. M., Yu, L., et al. (2017). Quantitative Characterization of Pore Structure of Tight Gas sandstone Reservoirs by NMR T2 Spectrum Technology:a Case Study of Carboniferous-Permian Tight sandstone Reservoir in Linqing Depression. Acta Petrolei Sinica 38 (8), 902–915. doi:10.1016/j.ptlrs.2018.06.00.3
Fu, J. H., Yu, J., Xu, L. M., Niu, X. B., Feng, S. B., and Wang, X. J. (2015). New Progress in Exploration and Development of Tight Oil in Ordos Basin and Main Controlling Factors of Large-Scale Enrichment and Exploitable Capacity. China Pet. Exploration 20 (5), 9–19. doi:10.3969/j.issn.1672-7703.2015.05.002
Fu, S. T., Yao, J. L., Li, S. X., Zhou, X. P., and Li, M. R. (2020). Enrichment Characteristics and Resource Potential of continental Shale Oil in Mesozoic Yanchang Formation, Ordos Basin. Pet. Geology. Exp. 42 (5), 698–710. doi:10.1016/S1876-3804(16)30066-0
Gao, H., Cao, J., Wang, C., He, M., Dou, L., Huang, X., et al. (2019a). Comprehensive Characterization of Pore and Throat System for Tight sandstone Reservoirs and Associated Permeability Determination Method Using SEM, Rate-Controlled Mercury and High Pressure Mercury. J. Pet. Sci. Eng. 174, 514–524. doi:10.1016/j.petrol.2018.11.043
Gao, H., He, M. Q., Zhao, P. Y., Dou, L. B., and Wang, C. (2018b). Comparison of Geological Characteristics of Chang 7 Shale Oil in Ordos Basin and Typical Shale Oil in North America. Pet. Geology. Exp. 40 (2), 133–140. doi:10.11781/sysydz201802133
Gao, H., Zhu, G. B. L., Wang, X., Wang, M., Mengging, H., Liangbin, D., et al. (2019). Differences and Origin of Micro-pore Throat Characteristics for Tight sandstone Reservoir of Yanchang Formation, Ordos Basin. Oil&gas Geology. 40 (2), 302–312. doi:10.11743/ogg20190209
He, M., Li, T., Huang, X., Dou, L., Zhou, Z., and Wu, K. (2021). Experimental Study on Changes in Pore Throat Systems Owing to Liquid CO2 Cooling in Shale Oil Reservoirs. Energy Fuels 35 (17), 13633–13643. doi:10.1021/acs.energyfuels.1c00896
Hu, S. Y., Zhu, R. K., Wu, S. T., Bai, B., Yang, Z., and Cui, J. W. (2018). Profitable Exploration and Development of continental Tight Oil in China. Pet. Exploration Dev. 45 (4), 737–748. doi:10.11698/PED.2018.04.2010.1016/s1876-3804(18)30082-x
Huang, H., Li, R., Chen, W., Chen, L., Jiang, Z., Xiong, F., et al. (2021). Revisiting Movable Fluid Space in Tight fine-grained Reservoirs: A Case Study from Shahejie Shale in the Bohai Bay Basin, NE China. J. Pet. Sci. Eng. 207, 109170. doi:10.1016/j.petrol.2021.109170
Huang, H., Li, R., Jiang, Z., Li, J., and Chen, L. (2020a). Investigation of Variation in Shale Gas Adsorption Capacity with Burial Depth: Insights from the Adsorption Potential Theory. J. Nat. Gas Sci. Eng. 73, 103043. doi:10.1016/j.jngse.2019.103043
Huang, H., Li, R., Xiong, F., Hu, H., Sun, W., Jiang, Z., et al. (2020b). A Method to Probe the Pore-Throat Structure of Tight Reservoirs Based on Low-Field NMR: Insights from a Cylindrical Pore Model. Mar. Pet. Geology. 117, 104344. doi:10.1016/j.marpetgeo.2020.104344
Huang, X., Li, T. T., Wang, X. Z., Gao, H., Ni, J., Zhao, J. S., et al. (2019). Distribution Characteristics and its Influence Factors of Movable Fluid in Tight sandstone Reservoir: a Case Study from Chang-8 Oil Layer of Yanchang Formation in Jiyuan Oilfield, Ordos Basin. Acta Petrolei Sinica 40 (5), 557–567. doi:10.7623/syxb201905005
Hübner, W. (2014). Studying the Pore Space of Cuttings by NMR and μCT. J. Appl. Geophys. 104, 97–105. doi:10.1016/j.jappgeo.2014.02.016
Ji, W., Hao, F., Schulz, H.-M., Song, Y., and Tian, J. (2019). The Architecture of Organic Matter and its Pores in Highly Mature Gas Shales of the Lower Silurian Longmaxi Formation in the Upper Yangtze Platform, south China. Bulletin 103 (12), 2909–2942. doi:10.1306/04101917386
Ji, W., Song, Y., Jiang, Z., Chen, L., Li, Z., Yang, X., et al. (2015). Estimation of marine Shale Methane Adsorption Capacity Based on Experimental Investigations of Lower Silurian Longmaxi Formation in the Upper Yangtze Platform, south China. Mar. Pet. Geology. 68, 94–106. doi:10.1016/j.marpetgeo.2015.08.012
Jia, C. Z., Zou, C. N., Li, J. Z., Li, D. H., and Zheng, M. (2012). Assessment Criteria, Main Types, Basic Features and Resource Prospects of the Tight Oil in China. Acta Petrolei Sinica 33 (3), 343–350. doi:10.1016/S2096-2495(17)30026-1
Lai, J., Wang, G., Cao, J., Xiao, C., Wang, S., Pang, X., et al. (2018). Investigation of Pore Structure and Petrophysical Property in Tight Sandstones. Mar. Pet. Geology. 91, 179–189. doi:10.1016/j.marpetgeo.2017.12.024
Li, C., Dan, W. D., Yuan, J. S., Xin, H. G., Zhang, S., and Ma, Y. L. (2016). Controlling Factors and Hydrocarbon Accumulation Pattern of Chang 4+5 Oil Reservoirs in Jiyuan Area, Ordos Basin. China Pet. Exploration 21 (2), 45–52. doi:10.3969/j.issn.1672-7703.2016.02.006
Li, Z., Wu, S., Xia, D., He, S., and Zhang, X. (2018). An Investigation into Pore Structure and Petrophysical Property in Tight Sandstones: A Case of the Yanchang Formation in the Southern Ordos Basin, China. Mar. Pet. Geology. 97, 390–406. doi:10.1016/j.marpetgeo.2018.07.014
Luo, P., Luo, W., and Li, S. (2017). Effectiveness of Miscible and Immiscible Gas Flooding in Recovering Tight Oil from Bakken Reservoirs in Saskatchewan, Canada. Fuel 208, 626–636. doi:10.1016/j.fuel.2017.07.044
Meng, M., Ge, H., Shen, Y., and Ji, W. (2021). Evaluation of the Pore Structure Variation during Hydraulic Fracturing in Marine Shale Reservoirs. J. Energ. Resour. Technology-Transactions Asme 143 (8), 083002. doi:10.1115/1.4048872
Meng, M., Ge, H., Shen, Y., and Wang, L. (2022). Influence of Rock Fabric on Salt Ion Diffusion Behavior in Upper Cretaceous Lacustrine Shale from Songliao Basin. J. Pet. Sci. Eng. 208, 109355. doi:10.1016/j.petrol.2021.109355
Nelson, P. H. (2009). Pore-throat Sizes in Sandstones, Tight Sandstones, and Shales. Bulletin 93 (3), 329–340. doi:10.1306/10240808059
Qu, Y., Sun, W., Guo, S., Shao, S., and Lv, X. (2019). A Gas-Content Calculation Model for Terrestrial Shales in the Kuqa Depression, the Tarim Basin, Western China. Interpretation 7 (2), T513–T524. doi:10.1190/INT-2018-0127.1
Qu, Y., Sun, W., Tao, R., Luo, B., Chen, L., and Ren, D. (2020). Pore-throat Structure and Fractal Characteristics of Tight Sandstones in Yanchang Formation, Ordos Basin. Mar. Pet. Geology. 120, 104573. doi:10.1016/j.marpetgeo.2020.104573
Ren, D., Zhou, D., Liu, D., Dong, F., Ma, S., and Huang, H. (2019). Formation Mechanism of the Upper Triassic Yanchang Formation Tight sandstone Reservoir in Ordos Basin-Take Chang 6 Reservoir in Jiyuan Oil Field as an Example. J. Pet. Sci. Eng. 178, 497–505. doi:10.1016/j.petrol.2019.03.021
Schmitt, M., Fernandes, C. P., da Cunha Neto, J. A. B., Wolf, F. G., and dos Santos, V. S. S. (2013). Characterization of Pore Systems in Seal Rocks Using Nitrogen Gas Adsorption Combined with Mercury Injection Capillary Pressure Techniques. Mar. Pet. Geology. 39 (1), 138–149. doi:10.1016/j.marpetgeo.2012.09.001
Schmitt, M., Fernandes, C. P., Wolf, F. G., Bellini da Cunha Neto, J. A., Rahner, C. P., and Santiago dos Santos, V. S. (2015). Characterization of Brazilian Tight Gas Sandstones Relating Permeability and Angstrom-To Micron-Scale Pore Structures. J. Nat. Gas Sci. Eng. 27, 785–807. doi:10.1016/j.jngse.2015.09.027
Shanley, K. W., and Cluff, R. M. (2015). The Evolution of Pore-Scale Fluid-Saturation in Low-Permeability sandstone Reservoirs. Bulletin 99 (10), 1957–1990. doi:10.1306/03041411168
Tiwari, P., Deo, M., Lin, C. L., and Miller, J. D. (2013). Characterization of Oil Shale Pore Structure before and after Pyrolysis by Using X-ray Micro CT. Fuel 107, 547–554. doi:10.1016/j.fuel.2013.01.006
Wang, C., Gao, H., Gao, Y., and Fan, H. (2020). Influence of Pressure on Spontaneous Imbibition in Tight sandstone Reservoirs. Energy Fuels 34 (8), 9275–9282. doi:10.1021/acs.energyfuels.0c00639
Wang, J., Tan, X., Wang, J., Zhang, H., Zhang, Y., Guo, D., et al. (2021a). Characteristics and Genetic Mechanisms of Normal-Pressure Fractured Shale Reservoirs: A Case Study from the Wufeng-Longmaxi Formation in Southeastern Chongqing, China. Front. Earth Sci. 9, 661706. doi:10.3389/feart.2021.661706
Wang, W., La, W., Fan, T., Xu, X., Liu, Y., and Lv, Q. (2021b). A Comparative Study on Microscopic Characteristics of Volcanic Reservoirs in the Carboniferous Kalagang and Haerjiawu Formations in the Santanghu Basin, China. Front. Earth Sci. 9, 728. doi:10.3389/feart.2021.735703
Wang, Y., Liu, L., Li, S., Ji, H., Xu, Z., Luo, Z., et al. (2017). The Forming Mechanism and Process of Tight Oil Sand Reservoirs: A Case Study of Chang 8 Oil Layers of the Upper Triassic Yanchang Formation in the Western Jiyuan Area of the Ordos Basin, China. J. Pet. Sci. Eng. 158, 29–46. doi:10.1016/j.petrol.2017.08.026
Wu, K., He, M. Q., Ren, Y. H., and Wu, G. Z. (2020). Sensitivity Evaluation of the Chang 4- Chang 7 Reservoirs of the WuQi Oilfield in Ordos Basin, China. Fresenius Environ. Bull. 29 (9A), 8666–8674.
Wu, S., Zhu, R., Yang, Z., Mao, Z., Cui, J., and Zhang, X. (2019). Distribution and Characteristics of Lacustrine Tight Oil Reservoirs in China. J. Asian Earth Sci. 178, 20–36. doi:10.1016/j.jseaes.2018.05.013
Xiao, D., Jiang, S., Thul, D., Huang, W., Lu, Z., and Lu, S. (2017). Combining Rate-Controlled Porosimetry and NMR to Probe Full-Range Pore Throat Structures and Their Evolution Features in Tight Sands: A Case Study in the Songliao Basin, China. Mar. Pet. Geology. 83, 111–123. doi:10.1016/j.marpetgeo.2017.03.003
Xiao, D. S., Lu, S. F., Lu, Z. Y., Huang, W. B., and Gu, M. W. (2016). Combining Nuclear Magnetic Resonance and Rate-Controlled Porosimetry to Probe the Pore-Throat Structure of Tight Sandstones. Pet. Exploration Dev. 43 (6), 961–970. doi:10.1016/S1876-3804(16)30122-7
Yang, H., Li, S. X., and Liu, X. Y. (2013). Characteristics and Resource Prospects of Tight Oil Land Shale Oil in Ordos Basin. Acta Petrolei Sinica 34 (1), 1–11. doi:10.7623/syxb201301001
Yao, J. L., Deng, X. Q., Zhao, Y. D., Han, T. Y., Chu, M. J., and Pang, J. L. (2013). Characteristics of Tight Oil in Triassic Yanchang Formation, Ordos Basin. Pet. Exploration Dev. 40 (2), 150–158. doi:10.1016/s1876-3804(13)60019-1
Zhang, K., Jia, C., Song, Y., Jiang, S., Jiang, Z., Wen, M., et al. (2020a). Analysis of Lower Cambrian Shale Gas Composition, Source and Accumulation Pattern in Different Tectonic Backgrounds: A Case Study of Weiyuan Block in the Upper Yangtze Region and Xiuwu Basin in the Lower Yangtze Region. Fuel 263, 115978. doi:10.1016/j.fuel.2019.115978
Zhang, K., Peng, J., Liu, W., Li, B., Xia, Q., Cheng, S., et al. (2020b). The Role of Deep Geofluids in the Enrichment of Sedimentary Organic Matter: a Case Study of the Late Ordovician-Early Silurian in the Upper Yangtze Region and Early Cambrian in the Lower Yangtze Region, south China. Geofluids 2020, 1–12. doi:10.1155/2020/8868638
Zhang, K., Peng, J., Wang, X., Jiang, Z., Song, Y., Jiang, L., et al. (2020c). Effect of Organic Maturity on Shale Gas Genesis and Pores Development: A Case Study on marine Shale in the Upper Yangtze Region, South China. Open Geosciences 12 (1), 1617–1629. doi:10.1515/geo-2020-0216
Zhong, X., Zhu, Y., Jiao, T., Qi, Z., Luo, J., Xie, Y., et al. (2021). Microscopic Pore Throat Structures and Water Flooding in Heterogeneous Low-Permeability sandstone Reservoirs: A Case Study of the Jurassic Yan'an Formation in the Huanjiang Area, Ordos Basin, Northern China. J. Asian Earth Sci. 219, 104903. doi:10.1016/j.jseaes.2021.104903
Zhu, H., Zhang, T., Zhong, D., Li, Y., Zhang, J., and Chen, X. (2019). Binary Pore Structure Characteristics of Tight sandstone Reservoirs. Pet. Exploration Dev. 46 (6), 1297–1306. doi:10.1016/S1876-3804(19)60283-1
Zou, C. N., Zhang, G. S., Yang, Z., Tao, S. Z., Hou, L. H., Zhu, R. K., et al. (2013). Geological Concepts, Characteristics, Resource Potential and Key Techniques of Unconventional Hydrocarbon: On Unconventional Petroleum Geology. Pet. Exploration Dev. 40 (4), 385–454. doi:10.11698/PED.2013.04.0110.1016/s1876-3804(13)60053-1
Keywords: tight sandstone, Chang 4+5 reservoirs, microscopic pore throat structure, movable fluid, nuclear magnetic resonance technology
Citation: Wu K, Chen D, Zhang W, Yang H, Wu H, Cheng X, Qu Y and He M (2022) Movable Fluid Distribution Characteristics and Microscopic Mechanism of Tight Reservoir in Yanchang Formation, Ordos Basin. Front. Earth Sci. 10:840875. doi: 10.3389/feart.2022.840875
Received: 21 December 2021; Accepted: 29 March 2022;
Published: 28 April 2022.
Edited by:
Feng Yang, China University of Geosciences Wuhan, ChinaReviewed by:
Houjian Gong, China University of Petroleum, ChinaLei Chen, China University of Petroleum, China
Copyright © 2022 Wu, Chen, Zhang, Yang, Wu, Cheng, Qu and He. This is an open-access article distributed under the terms of the Creative Commons Attribution License (CC BY). The use, distribution or reproduction in other forums is permitted, provided the original author(s) and the copyright owner(s) are credited and that the original publication in this journal is cited, in accordance with accepted academic practice. No use, distribution or reproduction is permitted which does not comply with these terms.
*Correspondence: Ke Wu, d3VrZV94YmR4QDE2My5jb20=; Mengqing He, bXFoZXhzeXVAMTYzLmNvbQ==