 Stephen Akinremi
 Islam Fadel
 Mark van der Meijde
- Faculty of Geo-Information Science and Earth Observation (ITC), University of Twente, Enschede, Netherlands
We used magnetotelluric data from 352 sites in Botswana to derive a country-wide electrical conductivity model of the crust and upper mantle structure. A robust methodological scheme and 3D inversion were used to derive a 3D electrical conductivity model with unprecedented spatial coverage. The model results show interesting features, including the major cratonic blocks and the mobile belts in Botswana. A distinctive resistive structure was imaged in southwest Botswana, which suggests the existence of the Maltahohe microcraton as a separate cratonic unit as proposed by other studies. Furthermore, the model gives new insight into the extension of the East African Rift System to Botswana and the incipient rifting in the Okavango Rift Zone. In northern Botswana, the electrical conductivity model shows a highly conductive structure beneath the Okavango Rift Zone, which connects with a deeper conductive structure that we attribute to the East African Rift System due to its vicinity to Lake Kariba, the last surface expression of the rift system. We suggest that ascending fluids or melt from the East African Rift System causes the weakening of the lithosphere and plays a significant role in the incipient continental rifting in the Okavango Rift Zone.
1 Introduction
Our understanding of the geology and tectonics of Botswana still carry a few disputed and debated hypotheses. Botswana has a diverse geology with large cratons, in between mobile belts, and two deep sedimentary basins (Begg et al., 2009). Next to that, it is geodynamically influenced by the African Superswell, which is a large topographic anomaly in eastern and southern Africa at an average of 500 m higher than the continental height (Brandt et al., 2011; Figure 1). Also, the East African Rift System (EARS), an intracontinental rift zone, which supposedly has its terminus in the Okavango Rift Zone (ORZ) in northern Botswana influences its geodynamics (e.g., Fadel et al., 2020; Leseane et al., 2015; Figure 1). Even though in recent years different geophysical data has been collected (seismic, gravity, magnetic, magnetotelluric (MT)), there are still areas and processes that are not well understood (e.g., Hutchins and Reeves, 1980; Jones et al., 2009b; Gao et al., 2013; Fadel, 2018). Two major debates are on the existence and boundaries of Maltahohe microcraton and the extension of EARS to Botswana. This study provides additional insight into the general tectonic architecture of Botswana and specifically these two debates from the first 3D inversion of country-wide MT data for Botswana.
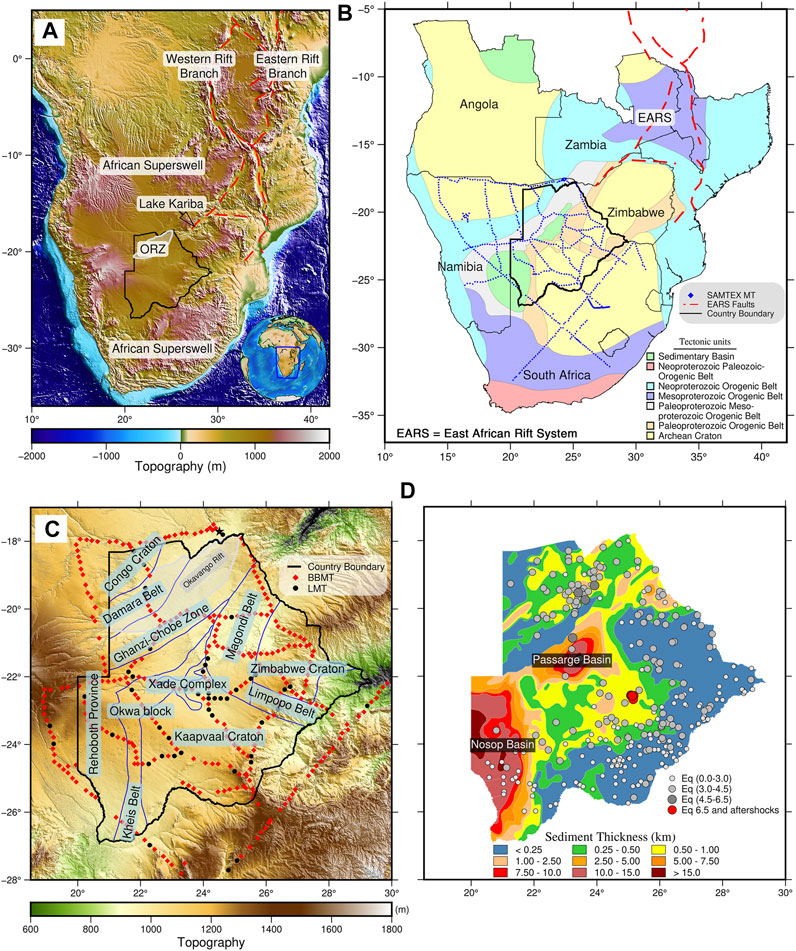
FIGURE 1. (A) Topographic map of southern Africa, showing the branches of the EARS, the last surface expression of the western branch of EARS at Lake Kariba, the African superswell, Botswana in black outline and the ORZ in white outline (Fadel 2018). (B) Tectonic map of southern Africa with the distribution of the Southern Africa Magnetotelluric Experiment (SAMTEX) sites (Jones et al., 2009a). (C) Tectonic map of Botswana (McCourt et al., 2013) with the distribution of the SAMTEX data used. Broadband MT data (BBMT) are shown in red diamonds and long-period MT (LMT) are shown in black circles. The MT station shown in black star represents the ELZ208_94A site and the data from the site are shown in Figure 2. (D) Sedimentary thickness map derived from aeromagnetic data (Pretorius 1984) and earthquake distributions in Botswana with the range of the magnitude represented by ‘Eq’.
The Maltahohe microcraton is an enigma in Botswana geology and geodynamics. There are debates on the actual existence, location, and boundaries of Maltahohe microcraton in southwest Botswana. According to Begg et al. (2009), there may exist an ancient Maltahohe microcraton beneath the Rehoboth Province in southwest Botswana (Figure 1). In an earlier active seismic study, Wright and Hall (1990) interpreted the cratonic structure beneath the Rehoboth Province as a western extension of the Kaapvaal Craton. However, more recent seismological studies in the area argue that the Maltahohe microcraton exist as a separate structure from the Kaapvaal Craton, which is evident from the observed different Vp/Vs ratios from receiver functions and 3D shear wave velocity model (Fadel et al., 2018; Fadel et al., 2020). Similarly, Chisenga et al. (2020b), in a study using gravity and aeromagnetic data supported the existence of the Maltahohe microcraton. However, the study argues that the location of the Maltahohe microcraton is likely south of the region suggested by Fadel et al. (2020), Fadel et al. (2018). Therefore, it is imperative to study this area further using other data, to confirm or reject the hypothesis on the existence of the Maltahohe microcraton, and if it does exist, understand its boundaries and relationship with the other cratonic blocks.
The extension of the EARS to Botswana is a debated phenomenon in the literature (e.g., Kinabo et al., 2007; Khoza et al., 2013b; Yu et al., 2015a; Leseane et al., 2015; Pastier et al., 2017; Fadel et al., 2020). There are still questions about the existence of rifting in ORZ, and if it exists, its connection with the mature EARS is still debated (Kinabo et al., 2007; Pastier et al., 2017; Fadel et al., 2020; Khoza et al., 2013b). Furthermore, there are varying opinions about the possible further extension of the EARS to central Botswana. The ORZ, which consists of several normal to dextral strike-slip faults is widely interpreted to be the terminus of the western branch of the EARS by several studies (Kinabo et al., 2008; Modisi, 2000; Modisi et al., 2000; Yu et al., 2015b; Yu et al., 2015c; Fadel et al., 2020). However, Pastier et al. (2017) argue that there is no rifting in the Okavango area and proposed a model of differential movement between the Congo and Kalahari Cratons from their geodetic study. Also, from various studies that support the existence of rifting in the ORZ, there are divergent opinions on the rift mechanism and its link to the mature EARS. Kinabo et al. (2007), in a gravity and magnetic investigation argue that there is a strong correlation between the orientation of the pre-existing basement fold axes and foliation and the rift induced faults. They inferred that the pre-existing basement structures have considerable influence on the development of the rift faults in ORZ. Similarly, Khoza et al. (2013b), in a MT study argue that evidence of continental rifting such as thinned lithosphere and highly conductive mantle anomaly are not present in the ORZ. They proposed a model in which the incipient rifting in ORZ is initiated from the surface and not linked to the EARS. However, Leseane et al. (2015) in a thermal and Moho depth study suggest that the earthquakes in the ORZ are triggered by the migration of fluids from the mantle to the crust. Their results show shallow Curie Point depths, thin-crust, and high crustal heat from upward movement of mantle fluid to the lithosphere through weak zones beneath the ORZ. Similarly, results from seismic studies, for example, Fadel et al. (2020) and Yu et al. (2015a) show low-velocity anomaly and mantle seismic anisotropy in the ORZ, which connects to the EARS. Their findings provide a piece of evidence for the role of ascending fluids from the EARS in the rifting in ORZ. From the various divergent views, rifting in ORZ, the mechanism of rifting, and its link with the EARS is yet to be fully understood.
On the further southward extension of the EARS, there was a 6.5 Mw intra-plate earthquake in central Botswana and its link to the EARS is still a subject to debate (Gardonio et al., 2018; Midzi et al., 2018; Figure 1D). The earthquake, which occurred at an approximate depth of 29 km on 03 April 2017 was the second strongest in magnitude in the country’s history and the second strongest intra-plate earthquake in the last 30 years (Gardonio et al., 2018; Midzi et al., 2018). Several studies, including the use of geophysical methods, have discussed the cause of the earthquake. Kolawole et al. (2017), in a combined magnetic, gravity, and differential interferometric synthetic aperture radar study, proposed that the 6.5 Mw earthquake in central Botswana is not linked to the EARS. From their results, the orientation of the tensional stress that caused the earthquake (northeast-southwest) is different from the northwest-southeast directed tensional stress acting on the southwestern end of the EARS. They suggest that the earthquake event was caused by extensional reactivation of a thrust play in the crust. On the contrary to Kolawole et al. (2017), some studies suggest the role of fluids or melt as the cause of the earthquake (Gardonio et al., 2018; Moorkamp et al., 2019; Fadel et al., 2020). Gardonio et al. (2018) in an interferometric synthetic aperture radar study suggest that the earthquake event was triggered by stress released from fluid migration from the mantle. Moorkamp et al. (2019) in a study using surface waves and MT data investigated the cause of the earthquake. Their results showed two displaced conductors in the crust, which they interpret to be related to graphite. Their study could neither confirm nor refute the possibility of mantle upwelling fluids as a trigger for the earthquake as suggested by Gardonio et al. (2018). Moorkamp et al. (2019) suggest that passive rifting explains the cause of the earthquake than thermal weakening from the mantle. Fadel et al. (2020) in a shear wave velocity study argue that the EAR does not only extend to northern Botswana in the ORZ, but that it does extend to central Botswana. From their model, the low-velocity anomaly of the EARS extends to the location of the 6.5 Mw earthquake in central Botswana. According to Fadel et al. (2020), the process that caused the earthquake suggests that it was associated with fluids or melt from the EARS. In a recent seismological study, Paulssen et al. (2022) also support that the EARS further continues to central Botswana based on the upward migration of the relocated aftershocks and their extensional mechanism, suggesting the earthquakes were produced by fluid intrusion from the mantle causing the eclogitization of dry metastable granulite facies rocks. These divergent views on the extension of the EARS to Botswana require further exploration and understanding from other geophysical data and models.
In the last 2 decades, different novel country-wide geophysical data have been compiled and processed in Botswana including gravity, magnetics, seismic, and MT data. Country-wide gravity and magnetic data provided some of the earliest understanding of the geological provinces and tectonics of Botswana due to the obscuring of the Precambrian geology by thick overburden formed from Kalahari group sediment (Hutchins and Reeves, 1980; Reeves and Hutchins, 1982; Chisenga et al., 2020b; Figure 1D). Also, several seismological studies have been done to understand the tectonics of Botswana. One of the earliest seismological studies was done by Reeves (1972), which focused on investigating seismicity in the ORZ. Wright and Hall (1990) investigated the Rehoboth Province and its relationship with the Kaapvaal Craton using active deep seismic profiling covering southwest Botswana. Many years later, several other seismological campaigns covering the eastern and southeast Botswana were done to image high resolution structure of the crust and upper mantle including the temporary network of the Southern Africa Seismic Experiment and the Africa Array Initiative (Carlson et al., 1996; Nyblade et al., 2008). Between 2013 and 2015, the Seismic Arrays for African Rift Initiation was deployed across the ORZ to further understand the incipient rifting and crustal and upper mantle structure of the region (Gao et al., 2013). More recently, a country-wide seismological project, Network of Autonomously Recording Seismographs was conducted between 2013 and 2018 to image the crustal and upper mantle structure beneath Botswana (Fadel, 2018).
Another geophysical data collection in Botswana was the MT data. In 2002, the Southern African Magnetotelluric Experiment (SAMTEX) was started with the aim to image the electrical structure of the crust and upper mantle beneath the southern African region covering Botswana, Namibia, and South Africa (Jones et al., 2009a). The MT method gives information about the distribution of electrical conductivity in the crust and upper mantle, which is independent geophysical information that is not accessible by other methods. Out of the different geophysical properties, electrical conductivity shows the most significant contrasts in the subsurface material with variance spanning up to 14 orders of magnitude, as dry crystalline rocks can have resistivity above 106
In the context of our study, the MT method is suitable for imaging different geological terranes and their boundaries using their electrical conductivity properties. Cratonic segments can be delineated from the mobile belts based on conductivity signatures (Muller et al., 2009). Older lithospheric units (Archean Cratons) are more resistive than the younger lithospheric units (Proterozoic mobile belts) (Muller et al., 2009). Cratonic boundaries and tectonic transition zones are made of suture zones which are characterized by weakened crustal materials due to deformation processes (Khoza et al., 2013a; Muller et al., 2009). Also, the electrical conductivity model derived from MT data could give a piece of evidence about the presence of aqueous fluids and partial melts, rifting, and rift extensions. While there have been a few studies in Botswana that used the SAMTEX data, the studies so far are either focused on regional interpretations or too fragmented and hardly overlap (Muller et al., 2009; Miensopust et al., 2011; Evans et al., 2019; Jones et al., 2009b; Khoza et al., 2013a; Khoza et al., 2013b; Moorkamp et al., 2019). These hinder complete imaging and understanding of the electrical structure of the crust and upper mantle beneath Botswana, and the relationships between the cratons and the mobile belts.
In this study, we used MT data to obtain a country-wide 3D electrical model of Botswana to image the crust and upper mantle structure besides investigating the Maltahohe microcraton and the extension of the EARS in Botswana. The result of this research provides straightforward, connected, and precise geologic interpretations about the crust and upper mantle beneath Botswana and arguments raised in the literature about the Maltahohe microcraton and the extension of EARS to Botswana. Our results overcome the fragmented nature of the previous MT studies in Botswana and the different methodologies and approaches that have led to some conflicting interpretations. The new electrical model of the crust and upper beneath Botswana gives more insight into the tectonic development, current tectonic settings, cratons deformation, and rift initiation processes in the region.
2 Geology of Botswana
Botswana is in southern Africa and covers parts of the two cratons in the region and the transitions between them. In Botswana, the Congo Craton covers the northwest region and the Kalahari Craton, which comprises the Zimbabwe and Kaapvaal blocks covers the east and south, respectively (Begg et al., 2009; Figure 1). One of the prominent features in the Kaapvaal Craton is the Bushveld Complex, which is the most extensive layered mafic intrusion into the crust in the world (Begg et al., 2009). The emplacement of the Bushveld Complex in the north-central part of the Kaapvaal Craton (in South-Africa and the far western limb extending to south-east Botswana) took place between 2.06 and 2.05 Ga (Haddon, 2005; Begg et al., 2009). In southwest Botswana is the Rehoboth Province, which extends to eastern Namibia (Figure 1C). The Rehoboth Province is composed of aggregated mobile belts of Paleoproterozoic age around an Archean nucleus (van Schijndel et al., 2011; van Schijndel et al., 2014). There may exist an ancient microcraton beneath the Rehoboth Province in Botswana (Begg et al., 2009; Fadel et al., 2020).
In between the cratonic blocks, the lithosphere of Botswana is composed of mobile belts, which were formed from various rifting and accretion processes: Limpopo, Kheis-Okwa-Magondi, Damara, and Ghanzi-Chobe Belts (Begg et al., 2009; Key and Ayres, 2000; Figure 1). The Limpopo Belt is an Archean mobile belt formed from the collision between the Zimbabwe and Kaapvaal Cratons (Begg et al., 2009). The Kheis-Okwa-Magondi Belt composite is a Paleoproterozoic belt covering the central part of Botswana along the western boundaries of Kaapvaal and Zimbabwe Craton. The Damara Belt is a Neoproterozoic Pan-African belt that bounds the southeastern part of the Congo Craton (Figure 1). To the southeast of the Damara Belt is the Ghanzi-Chobe Belt, which is composed of sequences of folded meta-sediments (Wright and Hall, 1990). Across the Damara-Ghanzi-Chobe Belt is the ORZ, which is considered as an incipient continental rift zone (Kinabo et al., 2008; Modisi et al., 2000; Figure 1).
In central and southwest Botswana, the upper crust includes two sedimentary basins; the Passarge Basin and the Nosop Basin (Figure 1D). The Passarge Basin is in central Botswana and is filled with weakly folded siliciclastic and carbonates from the Ghanzi Group sediments with thickness up to 15 km, and formed during Neoproterozoic and early Paleozoic times (Pretorius, 1984; Key and Ayres, 2000). In the southwest Botswana is the Nosop Basin, which is filled with siliciclastic and marine carbonates from of the Nama Group sediments from Neoproterozoic and early Paleozoic times with thickness up to 15 km (Pretorius, 1984; Wright and Hall, 1990; Begg et al., 2009).
3 Data and Methods
3.1 Data
We used data from 352 MT sites covering Botswana from the freely available Southern African Magnetotelluric Experiment (SAMTEX) data to obtain the electrical conductivity using 3D inverse modelling (Jones et al., 2009a; Figures 1B,C). The data used consists of broadband MT data (0.1–6,000 s) from 302 sites and long-period MT data (0.1–10,000 s) from 50 sites. The robust processing methods described in Jones et al. (1989) was used to process the electric and magnetic fields time series recordings to MT impedance (Z), apparent resistivities, tipper (T), and phase data by Jones et al. (2009). Preliminary regional electrical conductivity and electrical anisotropy maps from the SAMTEX data were presented by Jones et al. (2009). Moreover, a recent 3D electrical conductivity model of southern Africa using the whole SAMTEX data was developed by Özaydın et al. (2022) and compared with garnet xenocryst from kimberlites for more constrained interpretation of mantle structures. Aside from these regional interpretations of the SAMTEX data, a few other small-scale studies have used the SAMTEX data covering sections within Botswana or across its borders (Muller et al., 2009; Miensopust et al., 2011; Evans et al., 2019; Jones et al., 2009b; Khoza et al., 2013a; Khoza et al., 2013b; Moorkamp et al., 2019). For the country-wide 3D electrical modelling of Botswana, we focused on imaging the electrical structure of crustal and upper mantle in relation to the tectonic development, while providing more insights to some debated hypotheses about its tectonics. We used the full Z and T data for 31 periods from 0.1–10,000 s. Incorporating T into the inversion complements the model development by improving the resolution of the 3D electrical structures than inversion with Z only (Becken et al., 2008; Campanyà et al., 2016). Figure 2 shows an example of the MT data from site ELZ208-94A, which is highlighted in black star in Figure 1C. Other MT data samples are given in Supplementary Figures S1, S14, S15.
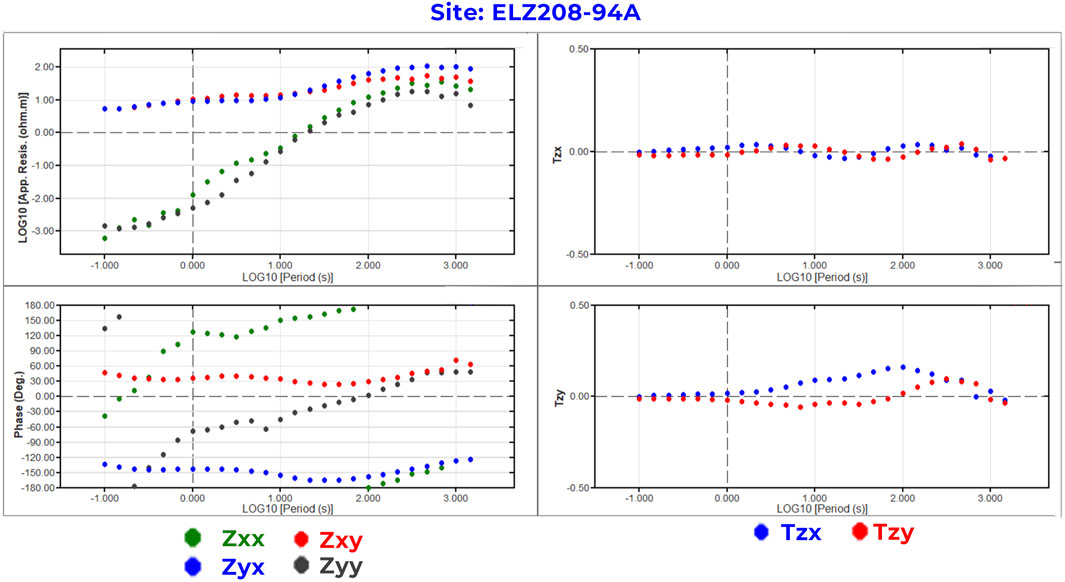
FIGURE 2. Example of MT data from site ELZ208-94A showing the apparent resistivity and impedance phases against period (in logarithmic scale) for Zxx, Zxy, Zyx, and Zyy components and the tipper components plot against period (in logarithm scale) for Tzx and Tzy.
3.2 Methodology
The methodology we used to derive the country-wide 3D electrical conductivity model of Botswana consists of three stages. In the first stage, we corrected the MT data for galvanic distortion and removed high error data to improve the data quality. In the second stage, we analyzed the properties and sensitivity of the MT data by performing depth resolution and dimensionality analysis. Finally, in the third stage, we inverted the MT data using 3D inversion technique. The details of the methodological steps are discussed further in the following subsections. We used the Python Toolbox for MT data processing, analysis, and visualization (MTpy; Kirkby et al., 2019; Krieger and Peacock, 2014). The 3D inversion of the MT data was done using the Modular System for Electromagnetic Inversion (ModEM) (Egbert and Kelbert, 2012; Kelbert et al., 2014).
3.2.1 MT Data Processing
We processed the MT data in two steps. First, we corrected the data for galvanic distortion and static shift error. Subsequently, the MT data that have been corrected for distortion were cleaned automatically and visually to remove data points with high errors.
The MT data is often affected by distortions (galvanic distortion) in the electromagnetic field, which are caused by the disturbance of the current that generates the electrical field. Galvanic distortions are non-inductive frequency-independent responses caused by the scattering of regional MT response by accumulated charge distribution on small-scale shallow bodies or inhomogeneity in local geologic structures (Jones, 2012). Galvanic distortion causes obscuring of the geoelectric strike, phase mixing, masking of properties of regional structures, and distortion of the magnitudes of Z. A subclass of the galvanic distortion of the MT data is the static shift, which is a frequency-independent shift in the apparent resistivity curve by a factor (Simpson and Bahr, 2005; Jones, 2012). In 1D modelling, static shift causes a shift in the depth to conductive structures and error in the modelled resistivity values. In 2D and 3D cases, static shift, if not corrected, may cause artefacts in the model (Simpson and Bahr, 2005). The inherent distortions in the MT data might require corrections to extract undistorted data from the measured data for the purpose of modelling the subsurface electrical structure. According to Jones (2012) and Meqbel et al. (2014), the scattering effects of small-scale local structures with dimensions or spatial scales larger than the MT site spacing can be modelled in 3D inversion, and galvanic distortion correction is not required. However, the SAMTEX MT data has high spatial aliasing, hence galvanic distortion removal is necessary (Figure 1D). The galvanic distortion removal was done following Bibby et al. (2005) approach, which makes use of phase tensor parameters and implements minimum explicit assumptions about the data parameters. The phase relationship between the magnetic field and electric field remains undistorted and can be used to retrieve the regional impedance (Caldwell et al., 2004). On this basis, Bibby et al. (2005) described an approach of galvanic distortion removal in MT response using the phase tensor, which provides maximum information about the dimensionality of the regional impedance with the minimum assumptions about the data. The phase tensor approach also overcomes the challenges of other distortion removal techniques, such as preconditioned interpretation of regional structures in 2D along average or dominant strike direction (e.g., Groom and Bailey, 1991; Smith, 1995).
Static shift correction factors are undeterminable from the MT data itself (Simpson and Bahr, 2005). In this study, we used statistical averaging method to estimate the relative static shift correction factor for each MT station from other stations in the radius of 30 km (Simpson and Bahr, 2005). The outputs of the process are static shift corrected MT responses.
The MT responses were further processed by removing data points with high errors and outliers to improve the convergence of the data in the inversion process. Poor-quality data points with error bars of the Z and T data above 5% were removed automatically from the data, which is also the percentage of error floor used in the 3D inversion step that will be described later. After that, the MT curve smoothness was examined visually on the criteria that the variation in MT apparent resistivity curve from period to period should not be more than 45⁰ on a logarithm versus logarithm scale plot. From the data visual check, outlying period data points from the MT curve were removed to improve the smoothness of the MT response curve. The MT data were subsequently used in the data analyses and inversion stages.
3.2.2 MT Data Analysis
We performed two analyses to determine the sensitivity of the MT data. Depth resolution test was done to evaluate the depth in the subsurface to which the data is sensitive and can be reliably interpreted. Also, we examined the dimensionality captured in the MT data to understand the most appropriate dimension for modelling the data. To test the depth resolution of the MT dataset, we calculated the depth of penetration of the MT data per station using the Niblett-Bostick transformation (Niblett and Sayn-Wittgenstein, 1960). The Niblett-Bostick transformation accounts for variation in depth of penetration for MT sites at similar periods by comparing the MT responses than analysis based only on the period (Adetunji et al., 2015).
The dimensionality of the MT data is an important property which is required to determine the dimension of the modelling approach. The subsurface structure captured in the MT data should have the same dimensionality as the modelling approach used. Modelling MT data in dimensions higher or lower than the dimensionality captured in the data causes the propagation of the dimensionality distortion in the model, which leads to erroneous interpretation (e.g., a 1D interpretation of a 2D or 3D structure; Ledo et al., 2002; Ledo, 2005). We used phase tensor analysis to examine the dimensionality of the MT data. The phase tensor is not affected by galvanic distortion, and it holds essential information about the dimensionality of the MT data (Caldwell et al., 2004; Booker, 2014). The dimensionality analysis results showed that the MT data should be modeled in 3D and the results are further explained in Section 4.1. Therefore, 3D inversion was implemented to invert the MT data.
3.2.3 Three-Dimensional MT Data Inversion
We used ModEM for the inversion of the MT data (Egbert and Kelbert, 2012; Kelbert et al., 2014). The ModEM utilizes the finite difference approach for forward calculations and the non-linear conjugate gradient (NLCG) technique for solving the inverse problem. The finite difference method is a robust technique for electromagnetic response computation (Egbert and Kelbert, 2012). The NLCG method is efficient in solving large inverse problems because it requires lesser processing units (CPU and memory) as inversion model grids and data increase.
The ModEM requires constructing starting 3D mesh of the study area with initial electrical conductivity values. Once MT data and starting 3D model are prepared, the inversion process can be executed. Two main parameters govern the inversion process; model covariance and initial damping (Kelbert et al., 2014). The model covariance (value between 0 and 1) controls how the norm of the model behaves. Large model covariance values result in smoother models with poor data fit, while small model covariance values result in rough models with higher data fit (Robertson et al., 2020). On the other hand, the initial damping parameter controls how the model fits the data progressively.
The MT data over Botswana was inverted using a 3D mesh with cell dimensions of 10 km × 10 km in the horizontal plane. The choice of the horizontal griding dimensions was based on the minimum data interstation spacing of 10 km and the grid resolution test, which is described in the next paragraph. A first layer thickness of 50 m was used, and the subsequent vertical layers’ thicknesses increased by a factor of 1.1 logarithmically. The mesh is composed of 137, 138, and 100 cells in the X, Y, and Z directions, and padding cells of 7, 7, and 6, respectively. A resistivity value of 100 Ωm was used for the starting model (Robertson et al., 2020). Also, an error floor of 5% of (
We carried out several inversions to investigate the sensitivity of the inverted electrical model to three main parameters; the initial damping parameter, the grid resolution, and the certainty of the retrieved low conductive anomalies with values between 1–10 Ωm in the model. A model covariance value of 0.4 was fixed for all the tests, like main inversion covering Botswana described earlier. For the sensitivity tests, smaller datasets were used to ensure that the computation times required are shorter. Details about the sensitivity tests are discussed in the Supplementary Material. In the following, we briefly describe three sensitivity tests on the initial damping parameter, model grid resolution, and highly conductive structures.
1) We investigated how the initial damping parameter affects the resultant electrical model with varying values of 1, 10, 100, and 1,000.
2) Model grid resolution determination is a crucial step in 3D MT inversion. The decision of the size of the model grid is usually balanced between the need to recover fine model details by using a higher-resolution grid and, on the other side, minimizing the computational time and resources required by using a coarser-resolution grid. We investigated how the horizontal grid resolution affects the resultant electrical model using a coarse grid of 30 km × 30 km, an intermediate grid of 15 km × 15 km and a fine 10 km × 10 km grid resolutions.
3) A major uncertainty in our electrical modelling result was the highly conductive structures (1–10 Ωm) in the lower crust and upper mantle. A sensitivity test was carried out to verify the certainty of these highly conductive structures if they are data related. The test involved inverting the MT data for 120 iterations with misfit of 3.55 and removing the conductive structures (<100 Ωm) in the model and replacing them with the resistivity of the starting model (100 Ωm). The inversion is then restarted with the modified model and continued for another 74 iterations with misfit of 3.42. The resultant model was examined to see whether the highly conductive structures are returned in the model or not.
4 Results and Discussion
4.1 Resolution Depth and Dimensionality
The results of the resolution depth and the dimensionality of the MT data are presented and discussed in detail in the Supplementary Figures S2–S6. Here, we discuss the main findings. The conclusion from the depth resolution test is that the MT data used in this study can image down to 200–250 km depth (Supplementary Figure S2). The electrical models are presented up to depth of 200 km and sensitivity depth per MT site are also indicated (Figures 4–6). The MT data is not only sensitive to depths but also to the volumetric electrical conductivity of the subsurface, because electromagnetic waves have diffusive nature. The lateral distance to which the MT data is sensitive at any depth is referred to as horizontal adjustment length. At the various depths of penetration of the MT data, the horizontal adjustment length is 2–3 times the value of the penetration depth (Simpson and Bahr, 2005). However, due to high spatial aliasing between the MT sites, at shallow depths, the horizontal adjustment lengths are small (Figure 1). Hence, the results of the electrical model are interpreted and discussed along cross sections on top or in the near proximity of the MT stations (Figures 3–5) to address the shortcoming of the small horizontal adjustment length.
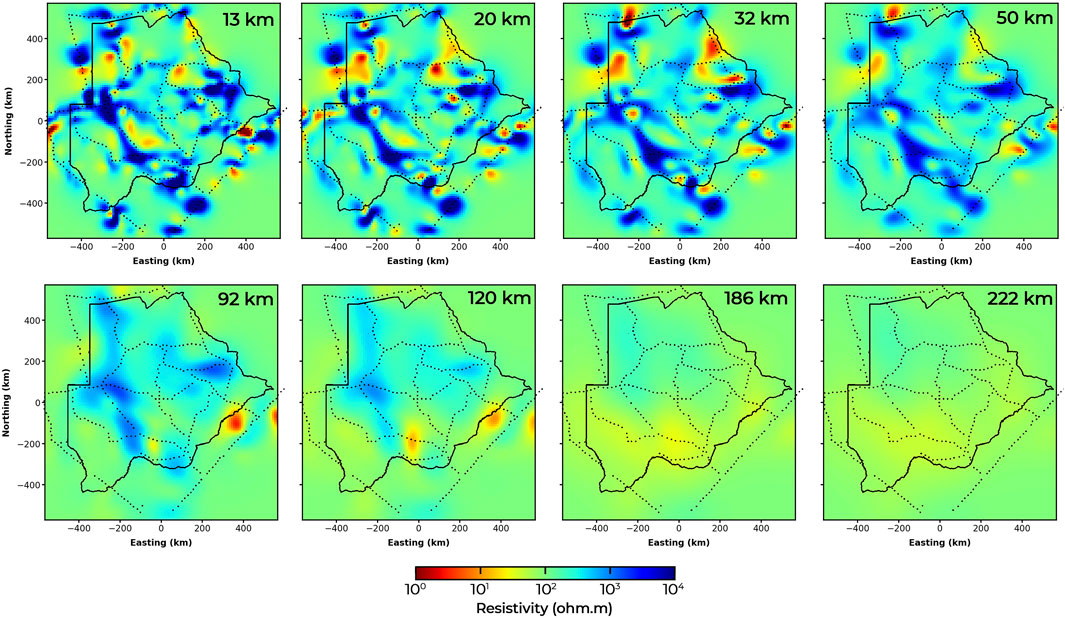
FIGURE 3. Plan view of electrical conductivity model depth slices at 13, 20, 32, 50, 92, 120, 186, and 222 km depths. MT sites are represented in black dots.
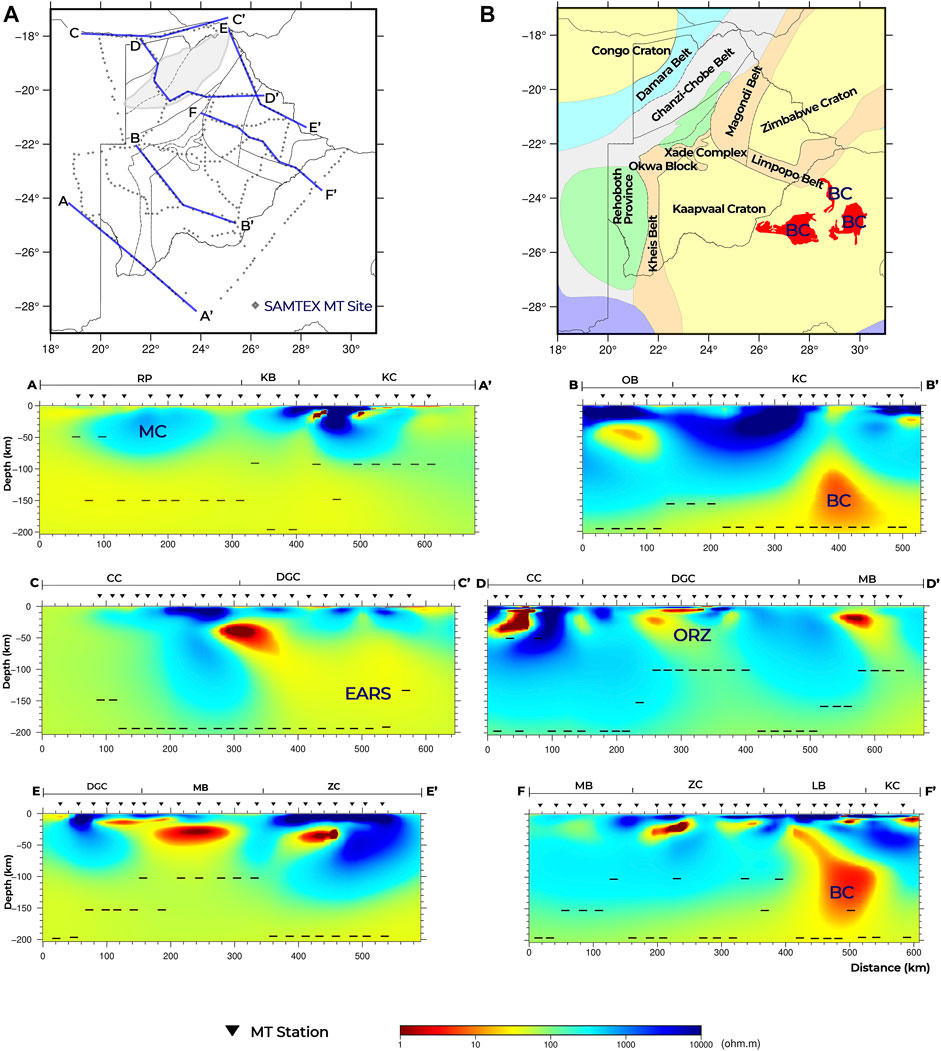
FIGURE 4. The 3-D electrical conductivity model of Botswana along five cross sections represented with blue lines in (A). (B) shows the tectonic map of Botswana. RP, Rehoboth Province; KB, Kheis Belt; KC, Kaapvaal Craton; OB, Okwa Block; CC, Congo Craton; DGC, Damara-Ghanzi-Chobe Belt; MB, Magondi Belt; ZC, Zimbabwe Craton; LB, Limpopo Belt; MC, Maltahohe microcraton; ORZ, Okavango Rift Zone; EARS, East African Rift System; BC, Bushveld Complex. Black dashes underneath each MT station in the electrical model = depth sensitivity per MT site.
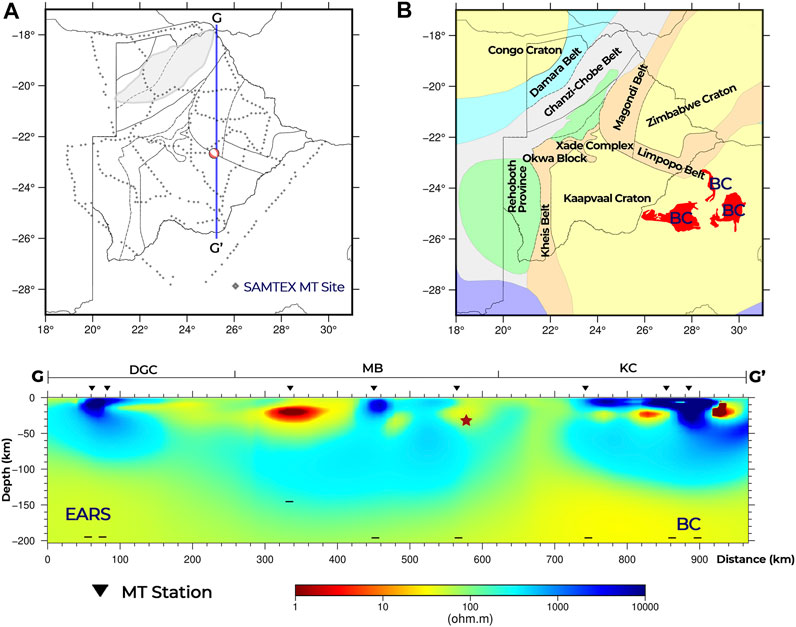
FIGURE 5. Electrical conductivity model north-south cross section (represented with blue line in (A)) across the epicenter of the 03 April 2017 earthquake in central Botswana. (B) shows the tectonic map of Botswana. DGC, Damara-Ghanzi-Chobe Belt; MB, Magondi Belt; KC, Kaapvaal Craton; EARS, East African Rift System; BC, Bushveld Complex. Black dashes underneath each MT station in the electrical model = depth sensitivity per MT site.
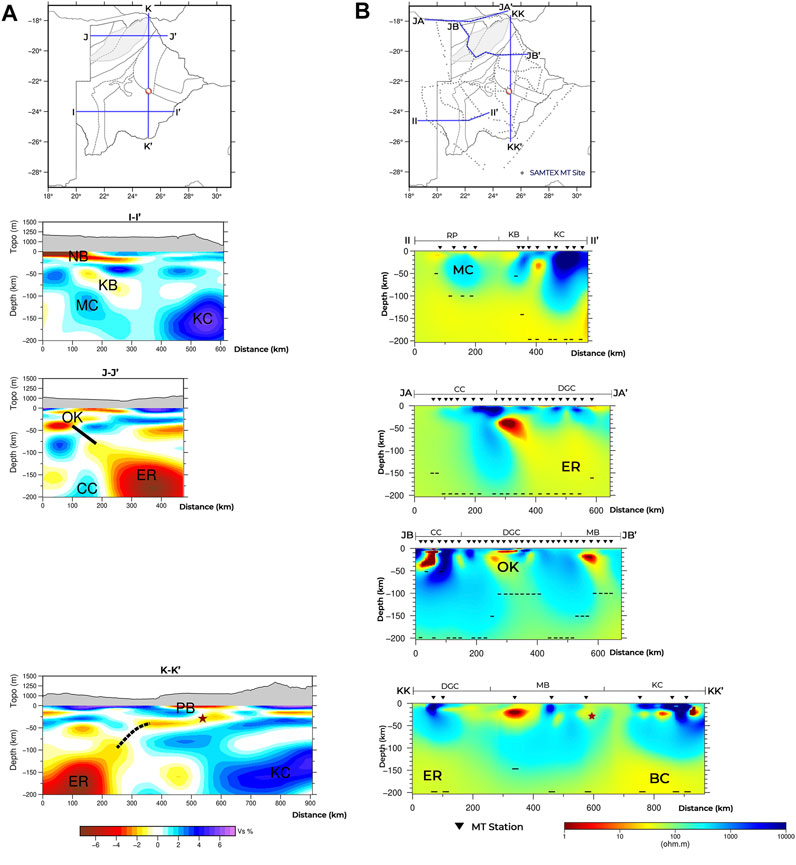
FIGURE 6. (A) The 3-D shear wave velocity model of Botswana after Fadel et al. (2020). (B) Electrical conductivity model derived from MT data. The red star = location of the 6.5 Mw earthquake in 2017. The highlighted features: CC, Congo Craton; DGC, Damara-Ghanzi-Chobe Belt; ER, East African Rift System; KC, Kaapvaal Craton; KB, Kheis Belt; MB, Magondi Belt; MC, Maltahohe microcraton; NB, Nosop Basin; OK, Okavango Rift Zone; PB, Passarge Basin, and RP, Rehoboth Province; BC, Bushveld Complex. Black dashes underneath each MT station in the electrical model = depth sensitivity per MT site.
The results of the dimensionality analysis (Supplementary Figures S3–S6) show high skew values (>6⁰) and high ellipticity of the phase tensor for majority of the MT sites. High skew values of the phase tensor greater than 6⁰ indicate 3D effects, skew values of 0⁰ indicate 2D data, and lower skew values indicate 1D subsurface structure (Cherevatova et al., 2015; Comeau et al., 2020). When the phase tensor is a circle, it indicates 1D subsurface, while the elliptical phase tensor represents 2D or 3D effects in the conductivity distribution (Becken and Burkhardt, 2004; Bibby et al., 2005). Hence, the results indicate the presence of 3D signature in the MT dataset.
The previous MT studies done in Botswana using the SAMTEX data showed the existence of multiple principal geoelectric strike directions in the data, which confirms the presence of 3D signature in the data (e.g., Miensopust et al. (2011), Muller et al. (2009), and Khoza et al. (2013a)). The result of the phase tensor analysis confirms the 3D nature of the structure beneath Botswana as reflected in the MT data. Therefore, the MT data for this study were modelled in 3D without need for assumption of geoelectric strike directions, which is required for 2D modelling approach.
4.2 Sensitivity Tests
The results of the sensitivity tests are presented and discussed in the Supplementary Material. Here we highlight the main findings on the inversion initial damping parameter, grid resolution, and conductive structures.
4.2.1 Initial Damping Parameter
The different initial damping parameters tested (1, 10, 100, and 1,000) did not influence the data fit nor the resolved structures in the resultant models (Supplementary Figure S7). However, higher initial damping parameters took more NLCG iterations and computation time to achieve convergence of the inversions. These observations are consistent with the results from model space exploration with the Australian Lithospheric Architecture Magnetotelluric Project data using ModEM done by Robertson et al. (2020). For the inversions in this study, we used an initial damping parameter of 10 to reduce the computing time.
4.2.2 Grid Resolution
We observed that increasing the grid resolution from 30 to 15 km and from 15 to 10 km led to an increase in the data fit of the resultant model (Supplementary Figure S8) and geologically plausible electrical structures (Supplementary Figures S8–S10). A choice of 10 km horizontal grid resolution, which is also the minimum interstation spacing in the data was made to recover a high-resolution model that can better fit the MT data.
4.2.3 Conductive Structures
We observed that the highly conductive structures with resistivity values between 1–10 Ωm in the crust and upper mantle in our electrical model are required and are data related. From the test, the highly conductive features return to the model after a continued inversion of the modified model as described in Section 3.2.3 in the Supplementary Figure S11.
4.3 The Electrical Conductivity Model
The final 3D electrical model of Botswana is presented as depth slices in Figure 3 and cross sections in Figure 4 to show the variation of the electrical conductivity of the different tectonic terranes in the study area. The cross sections were chosen along the data profiles to overcome the shortcoming of small horizontal adjustment length at shallow depth and make the results interpretable reliably.
From the results (Figures 3, 4), there are distinctive high conductive structures, both in the crust and upper mantle. Several factors can contribute to the high conductivity in the mid-lower crust and upper mantle. Anomalous conductive structures in the lower crust can be interpreted as the presence of graphite or aqueous fluids (Jones et al., 2005). In some areas, sulfides and other metalliferous ore deposits or partial melt contribute to high conductivity in the lower crust (Wannamaker et al., 2008). Regions that are spatially close to suture zones or fault zones also have highly conductive features due to the weakening of the crust (Jones et al., 2005). In the mantle, highly conductive anomalies can be due to high temperatures, partial melting, hydration, or mineralization of the mantle material (such as iron enrichment) from magmatic intrusion (Jones et al., 2005; Khoza et al., 2013a; Khoza et al., 2013b; Evans et al., 2019).
In southwest Botswana (Figure 4; A-A′), there are distinctive electrical structures across the Rehoboth Province, Kheis Belt, and the Kaapvaal Craton. The Kheis Belt has the lowest bulk electrical resistivity, while the Kaapvaal Craton has the highest bulk electrical resistivity. The Kaapvaal craton is imaged as a highly resistive structure (approximately 10,000 Ωm). The Kheis Belt is imaged next to the Kaapvaal Craton as a less resistive lithosphere (500–1,000 Ωm). Beneath the Rehoboth Province, the result shows a separate resistive structure (with average resistivity above 1,000 Ωm) between 10 and 100 km depth. This signature is indicative of a cratonic structure. However, there is broad conductive structure from the upper mantle (100 km) downward across the profile A-A′, which could be due to high temperatures regimes in the mantle (Sobh et al., 2021). The observed lateral variation across the Rehoboth Province-Kheis Belt-Kaapvaal Craton is confirmed by the shear wave velocity model by Fadel et al. (2020).
Figure 4; B-B′ shows distinctive electrical structures across the Okwa Block and the Kaapvaal Craton. The Okwa Block is imaged as a resistive structure (∼1,000–10,000 Ωm) with the presence of a conductor (∼10 Ωm) at a depth of ∼40 km. The Kaapvaal Craton is imaged as a resistive structure. However, from the depth of ∼100 km downward, there exists a broad highly conductive structure (∼5 Ωm), which may be due to iron enrichment of the mantle from the emplacement of the Bushveld Complex (Fouch et al., 2004). In the northwest margin of Botswana (Figure 4; C-C′), the Congo Craton is imaged as a resistive structure. In the Damara-Ghanzi Chobe Belt, there are distinctive highly conductive structures in the crust (∼30 km) and at a deeper depth (∼80 km downwards) around the east of profile C-C′ in Figure 4. The highly conductive structures may be due to fluids or melts from the EARS. Cross-section D-D′ shows the electrical conductivity model across Congo Craton, Damara-Ghanzi Chobe Belt, and the Magondi Belt. The Congo Craton is imaged in northwest Botswana as a highly resistive structure with the presence of a crustal conductor, which may be due to presence of ironstone in the metasedimentary rocks of Xaudum Group (Begg et al., 2009; Chisenga et al., 2020a). In the Damara-Ghanzi-Chobe Belt, the ORZ is imaged as a highly conductive crustal structure (∼5 Ωm) that connects with mantle structure of intermediate conductivity (Figure 4; D-D′). Similarly, in Magondi Belt, a highly conductive crustal structure (∼1 Ωm) is imaged, which seems to connect with a conductive mantle structure. These structures can be interpreted to be due to the upward movement of fluids or melt from the mantle to the crust beneath the ORZ and the Magondi Belt through zones of weakness as suggested by previous studies (e.g., Fadel et al., 2020).
Figure 4; F-F′ shows the electrical conductivity model across the Magondi Belt, Zimbabwe Craton, and the Limpopo Belt. The Zimbabwe Craton is imaged as a highly resistive structure with the presence of crustal conductive structures, which may be due to presence of graphite and/or sulfide (Khoza et al., 2013a). The observed high resistivity structure of the Zimbabwe Craton is consistent with results from velocity models, which show high-velocity anomalies beneath the Zimbabwe Craton (Ortiz et al., 2019; Fadel et al., 2020; White-Gaynor et al., 2021). Another feature of note along F-F′ is the highly conductive structure, which may be due to iron enrichment during the Bushveld Complex beneath the Kaapvaal Craton and the Limpopo Belt. This observation is consistent with a region of low velocity beneath the Limpopo belt from seismic study (Ortiz et al., 2019). The finding supports that this region of low velocity resulted from modification of the lithospheric and the mantle material by the Bushveld Complex magmatic event. Figure 4; E-E shows the lithosphere beneath the Magondi Belt is imaged as a conductive structure. Miensopust et al. (2011), in a previous MT study in northeast Botswana, observed crustal conductors beneath the Magondi Belt and suggest the structures to be due to the presence of graphite or sulphide. The Magondi belt was accreted to the Kheis-Okwa Belt (Thomas et al., 1993), and the Kheis-Okwa-Magondi Belt composite was modified during the Bushveld Complex emplacement (Begg et al., 2009).
4.4 Velocity-Conductivity Interpretation
Seismology and magnetotelluric methods are two primary geophysical methods for studying the structure of the crust and upper mantle because of their capacities to image deep Earth structures (Panza et al., 2007). These two methods look at different independent physical properties; velocity and conductivity, and they have different sensitivities to subsurface structures. Therefore, there is usually no complete match between the seismic velocity models and the electrical models. However, using both methods may support and complement some interpretations of subsurface structures. Here, we complement the interpretations from our new 3D electrical conductivity model with the country-wide 3D shear wave velocity model of Botswana by Fadel et al. (2020) to arrive at better interpretations (Figure 6). Their results included investigation of similar tectonic domains of this study; the Maltahohe microcraton and the extension of the EARS to Botswana, which are discussed in detail in coming sections.
4.5 The Maltahohe Microcraton
The resistive structure beneath the Rehoboth Province (Figure 4; A-A′) indicates the presence of a cratonic structure from depths of 10–100 km. This cratonic structure is clearly separated from the Kaapvaal Craton by the Kheis Belt. We interpret the cratonic structure beneath the Rehoboth Province as the Maltahohe microcraton, being distinct from the Kaapvaal Craton. This is contrary to the proposition of thinned western extension of the Kaapvaal Craton by Wright and Hall (1990). In an earlier MT study, Muller et al. (2009) carried out a 2D interpretation of the MT data across Kaapvaal Craton, Rehoboth Province and Damara-Ghanzi-Chobe Belt. According to the data decomposition study by Muller et al. (2009), multiple geoelectric strike directions are present in the data, which could be best solved using a 3D modelling approach. However, they inverted the MT data independently in two geoelectric strike directions of 25⁰ and 45⁰ due to computational limitations. Their electrical model showed conductive and resistive blobs beneath the Rehoboth Province, which could be due to dimensionality distortion in the 2D interpretations. 3DThe 3D modelling methodological approach we employed helped to improve the imaging of the cratonic structure beneath Rehoboth Province, which we interpret as the Maltahohe microcraton. The 3D MT modelling does not require assumption on geoelectric strike direction, which prevents dimensionality distortion in the interpretation of the electrical model compared to the previous 2D modelling.
The finding from our 3D electrical model on the existence of the Maltahohe microcraton is consistent with some previous studies (e.g., Begg et al., 2009; Chisenga et al., 2020a; Fadel et al., 2020). Our finding also confirms the location of the Maltahohe microcraton to be similar to Fadel et al. (2020) and that is it a separate cratonic structure from the Kaapvaal Craton (Figure 4, A-A′ and Figure 6; II-II′). Fadel et al. (2020), from their 3D shear wave velocity study, observed a high shear wave velocity beneath the Rehoboth Province interpreted as the Maltahohe microcraton. In the shear wave velocity model, the high velocity structure of the Maltahohe microcraton is imaged up to 200 km depth as compared to 100 km depth in the electrical model (Figure 6; I-I′ and II-II′). The disparity in the imaged depth may be due to low MT site coverage along the II-II’ profile. In the unresolved section along the II-II′ profile (low MT site coverage), the conductivity model could not image the possible deeper sections of the Maltahohe microcraton compared to the 3D shear wave velocity model.
4.6 The Bushveld Complex
Fouch et al. (2004), in a seismic study observed low seismic wave velocities in the Bushveld Complex around the southeastern border of Botswana. The location of the low seismic anomaly from the model of Fouch et al. (2004) coincides with the interpreted Bushveld Complex highly conductive anomaly along B-B′ and F-F′ in Figure 4. Their study suggests that the low seismic wave velocity anomaly is linked to compositional changes in the mantle due to iron enrichment from the formation of the Bushveld Complex. Similarly, other seismic investigations, including the P and S wave velocity study by Ortiz et al. (2019) and the shear-wave velocity study by White-Gaynor et al. (2021), show a region of low velocities beneath the Bushveld Complex in the Kaapvaal Craton. Ortiz et al. (2019), supporting Fouch et al. (2004), argue that the low velocities anomalies observed beneath the Okwa Block, Magondi Belt and Limpopo Belt, which are extensions of the Bushveld Complex, are results of the modification of the composition of the mantle material from the magmatic event. Ortiz et al. (2019) ruled out the possibilities of thermal anomalies as the cause of these low-velocity anomalies since no tectonic event affected these terranes in the Phanerozoic age.
In a previous MT study across the Kaapvaal Craton, Evans et al. (2011) found high electrical conductivity structure of ∼10 Ωm in the Bushveld Complex. The interpreted MT data profile by Evans et al. (2011) intersects with the interpreted Bushveld Complex highly conductive anomaly in cross-section F-F′ in Figure 4. They suggest that connected metallic sulphides, iron-rich garnets, and other economic minerals form the network of conductors within the Bushveld Complex. This is like the proposition of Jones and Garcia (2006) for the highly conductive anomalies beneath the Yellowknife River Fault zone in the Slave Craton in northern Canada. Jones (1988) reported that the geotherms in the Bushveld Complex are not significantly higher compared to other parts of the Kaapvaal Craton from heat flow data. Also, the last thermal event in the emplacement of the Bushveld Complex occurred in the Archean (Begg et al., 2009; Evans et al., 2011). With these pieces of evidence, this study, supporting the interpretation of Fouch et al. (2004), attributes the iron enrichment of the mantle material from the Bushveld Complex emplacement as the cause of highly conductive structures beneath the Kaapvaal Craton (Figure 4; B-B′ and F-F′).
4.7 The Extension of the East African Rift System to Botswana
The southwestern branch of the EARS is often interpreted to have its terminus in northern Botswana (e.g., Modisi, 2000; Yu et al., 2015a; Leseane et al., 2015; Ortiz et al., 2019; Fadel et al., 2020). The southernmost surface expression of the EARS occurs at Lake Kariba, near the northeastern tip of Botswana (Figure 1). Our study investigates the possible extension of the EARS in Botswana. The electrical conductivity model across the northern border of Botswana in Namibia along the MT sites shows a distinctive highly conductive anomaly in the lower crust (∼30 km), which connects with a conductive structure in the mantle (∼80 km downwards; Figure 4; C-C′). This highly conductive mantle structure may be due to the further subsurface extension of the EARS from lake Kariba. The high conductive anomaly in the lower crust could be due to the migration of fluids or melt from the EARS into the crust through zones of weakness (Figure 4; C-C′). In the ORZ, we found a highly conductive crustal structure (∼5 Ωm) that connects with a conductive upper mantle structure, which also supports the interpretation of ascending fluids or melt as the cause of the rifting in the ORZ (Figure 4; D-D′). This mechanism of ascending fluids or melt from the mantle to the crust is similar to the interpretation by Fadel et al. (2020) from shear wave velocity cross-section across the ORZ in northern Botswana. Their velocity model shows that the mantle low-velocity anomaly, which is linked to the EARS, seems to connect with the shallow low-velocity anomaly of the ORZ (Fadel et al., 2020; Figure 6; J-J′). Both cross-sections C-C′ and D-D′ from the electrical model are spatially displaced from the cross-section J-J′ from the shear wave velocity model. However, the mechanism of ascending fluids or melt from the mantle to the crust is similar to the proposition of Fadel et al. (2020) about the rifting in the ORZ. The interpretation of the conductive anomaly beneath the ORZ in our electrical model is supported by a high Vp/Vs ratio from the receiver function studies (Yu et al., 2015c; Fadel et al., 2018) and shallow Curie depth from aeromagnetic data (Leseane et al., 2015). According to Leseane et al. (2015) and references therein, it is suggested that the earthquakes in the ORZ are triggered by the migration of fluids from the mantle to the crust. Our interpretation also supports the proposition by Fadel et al. (2020) on the role of ascending fluids from the EARS in the weakening of the lithosphere and subsequent rifting in the ORZ. However, there exist contrary opinions on the extension of the EARS to northern Botswana and mechanism of the incipient rifting in the ORZ (e.g., Khoza et al., 2013b; Kinabo et al., 2007; and references therein). Khoza et al. (2013b), in a previous MT study covering some parts of northwest Botswana, argue that neither a thinned lithospheric structure nor highly conductive mantle anomalies are present beneath the ORZ from their electrical model. They go further to propose a model in which the incipient rifting in ORZ is initiated from the surface. The result from our 3D electrical conductivity model provides a piece of evidence for the ascending fluids from the EARS to the crust in the northern border of Botswana with Namibia in a similar mechanism as suggested for the ORZ by Fadel et al. (2020).
Furthermore, Fadel et al. (2020) suggest that the EARS does not only extend to the ORZ, but further extends to central Botswana from their velocity model. Cross-section K-K′ in Figure 6 shows a connection between a low-velocity anomaly beneath the epicentre of the 6.5 Mw earthquake and a deeper low-velocity anomaly, which may be due to the EARS. According to Fadel et al. (2020), the ascending fluids or melt from the EARS into the region below central Botswana may be the cause of the 6.5 Mw earthquake. Similarly, Chisenga et al. (2020b) modelled the crustal thickness of the crust beneath Botswana using gravity data. From their results, the crust beneath the epicentre of the 6.5 Mw earthquake in central Botswana is thinner with an approximate thickness of 40 km compared to 43 and 46 km thicknesses in the adjacent Kaapvaal Craton and central part of Limpopo Belt, respectively. Their result suggests that the thinning of the crust beneath the earthquake epicentre was caused by migrating thermal fluids from the EARS, eroding the lower crust structure. They propose that the combination of migrating thermal fluids from EARS, high heat flow, thin-crust and local stress in the crust contributed to the 6.5 Mw earthquake occurrence.
Our electrical conductivity model is not able to confirm or refute the proposition of EARS’ extension to central Botswana because of under sampling of the MT data along the transect to investigate the phenomenon (Figure 5; G-G′). Hence, the electrical conductivity model is not able to provide more insight into the extension of the EARS to central Botswana. At shallow depth of penetration of the MT data, the horizontal adjustment length to which the data is sensitive is small. Due to this, shallow structures that are laterally far away from the MT sites cannot be reliably interpreted along the G-G′ transect. At large depths (greater than 100 km), the horizontal adjustment length increases and the MT response at the MT site becomes more regional. Hence, the structures in the model that are laterally displaced from the MT sites can be interpreted reliably. At the epicenter of the 6.5 Mw earthquake, the model shows a highly conductive anomaly at a depth of 30 km, which is resolved by at least one MT site. Moorkamp et al. (2019) in a study in central Botswana using surface wave and MT data found two displaced conductive structures which were interpreted as likely related to graphite. From their electrical model and seismic velocity results suggest, they suggest reactivation of the old fault zone associated with a weak mantle because of amphibole enrichment and reduced grain size in central Botswana. While they did not confirm or refute the concept of mantle upwelling fluids as a trigger for the earthquake, they attributed the earthquake and the associated weak mantle to be more likely due to passive rifting related to the ambient stress field driven from top to bottom rather than thermal weakening from below. Also, Moorkamp et al. (2019) suggest that the 6.5 Mw earthquake reactivated existing fault from the deformation process of the collision between Kaapvaal and Zimbabwe cratonic blocks. However, other studies suggest that ascending fluids or melt from the EARS extends to central Botswana through the weak lithospheric zones and played a role in triggering the earthquake (Chisenga et al., 2020b; Fadel et al., 2020; Paulssen et al., 2022).
There is also a highly conductive anomaly in the northern part of this cross section from ∼100 km depth, which is resolved by at least two MT sites (Figure 5; G-G′). We interpreted this highly conductive structure as the possible extension of the EARS to northern Botswana. Another feature of note is the conductive structure beneath the Kaapvaal Craton from a depth of 120 km, which is resolved by at least three MT sites at that depth (Figure 5; G-G′). This highly conductive structure may be due high temperatures regimes in the upper mantle or from iron enrichment from the Bushveld magmatic emplacement in the Kaapvaal Craton. Additional MT measurements along this transect are required to resolve the electrical structure of the crust and upper mantle and further investigate the suggested extension of the EARS to central Botswana and its role in the 6.5 Mw earthquake in central Botswana.
5 Summary and Conclusion
We presented the 3D electrical conductivity model of Botswana derived from MT data. Our homogenous 3D modelling approach for interpreting the MT data covering Botswana overcame the preconditioned 2D interpretation of the electrical structure of the crust and upper mantle along geoelectric strike directions. Besides this, the country-wide electrical modelling provides a connected and precise interpretation of the electrical structure, overcoming the limitations of fragmented nature of the previous MT studies in Botswana. Our electrical model showed significant structures in the crust and upper mantle of Botswana. The model highlights the main geologic terranes in Botswana, including the very resistive structures of the cratonic terranes – Congo, Kaapvaal, Zimbabwe Cratons and Rehoboth Province; and the less resistive structures of the mobile belts – Damara-Ghanz-Chobe, Limpopo, and Kheis-Okwa-Magondi Belts. In southwest Botswana, we find a distinctive resistive structure beneath the Rehoboth Province, which suggests the existence of the Maltahohe microcraton as a separate cratonic unit as proposed by other studies. In addition to these, we imaged a highly conductive anomaly in the crust beneath the ORZ, which connects to a deeper highly conductive anomaly that may be related to the last surface expression of the EARS. We suggest that ascending fluids or melt from the EARS, which causes the weakening of the lithosphere, play a significant role in the incipient continental rifting in the ORZ. Lastly, our electrical model is not able to confirm or refute the suggested extension of the EARS to central Botswana. Additional MT data measurements along northeast to central Botswana would solve the challenge of under sampling and help resolve the electrical structure along this transect better.
Data Availability Statement
The data for the original contributions presented in the study are included in https://github.com/akinremisa/3D_Electrical_Model_MTBotswana, further inquiries can be directed to the corresponding author.
Author Contributions
SA: conceptualization, data curation, methodology, software, writing original draft, writing, review, and editing and visualization. IF: conceptualization, software, writing, review and editing, visualization, and supervision. MM: conceptualization, review and editing, validation, and supervision. All authors contributed to the article and approved it for publication.
Conflict of Interest
The authors declare that the research was conducted in the absence of any commercial or financial relationships that could be construed as a potential conflict of interest.
Publisher’s Note
All claims expressed in this article are solely those of the authors and do not necessarily represent those of their affiliated organizations, or those of the publisher, the editors and the reviewers. Any product that may be evaluated in this article, or claim that may be made by its manufacturer, is not guaranteed or endorsed by the publisher.
Acknowledgments
The freely available SAMTEX data was used in this study (https://www.mtnet.info/data/samtex/samtex.html). The SAMTEX was conducted to image the electrical structure of the crust and upper mantle beneath the southern African region, covering Botswana, Namibia, and South Africa (Jones et al., 2009a) (Figure 1). The authors wish to acknowledge the contributions of the SAMTEX consortium comprising: The Dublin Institute for Advanced Studies, Woods Hole Oceanographic Institution, the Council for Geoscience, De Beers Group Services, The University of the Witwatersrand, Geological Survey of Namibia, Geological Survey of Botswana, Rio Tinto Mining and Exploration, BHP Billiton, Council for Scientific and Industrial Research of South Africa, and ABB Sweden for the Namibian Power Corporation. Other contributors to the SAMTEX project in terms of instruments and instrumentations are Phoenix Geophysics, the Geological Survey of Canada, and the U.S. Electromagnetic Studies of Continents consortium (EMSOC). Special thanks to the SAMTEX funding sponsors: the Continental Dynamics programme of the U.S. National Science Foundation (grant number: EAR0455242 and EAR-0309584), the South African Department of Science and Technology, and Science Foundation Ireland (Ireland, grant 05/RFP/GEO001). Also, thanks to the farmers and landowners for allowing access to their properties for MT station deployment. Special acknowledgement to the providers of the various facilities and codes used for this study. For the visualization of the results, figures, and illustrations, we used the MTPy (Krieger and Peacock, 2014; Kirkby et al., 2019) and the Generic Mapping Tools (GMT) (Wessel et al., 2019). We used the ModEM (Egbert and Kelbert, 2012; Kelbert et al., 2014) for the 3D MT inversion process. Computational resources from the Faculty of Geoinformation and Earth Observation (ITC), University of Twente and the Dutch National Supercomputing Facilities (Grant Number: EINF-1468), were used for the 3D MT inversion computations. The authors would like to thank Dr. Naser Meqbel for the support on the use of ModEM software. Special thanks to Prof. Michael Becken for fruitful discussions and suggestions. Finally, the results presented in the article first appeared in the Master’s degree thesis of Akinremi S. (Akinremi, 2021) at the Department of Applied Earth Sciences, Faculty of Geo-Information Science and Earth Observation (ITC) of the University of Twente, The Netherlands. Special appreciation to the ITC Foundation Special Scholarship (ITCFSS), which funded the graduate study of Akinremi S.
Supplementary Material
The Supplementary Material for this article can be found online at: https://www.frontiersin.org/articles/10.3389/feart.2022.840703/full#supplementary-material
References
Adetunji, A. Q., Ferguson, I. J., and Jones, A. G. (2015). Reexamination of Magnetotelluric Responses and Electrical Anisotropy of the Lithospheric Mantle in the Grenville Province, Canada. J. Geophys. Res. Solid Earth 120 (3), 1890–1908. doi:10.1002/2014JB011713
Akinremi, S. (2021). Crustal And Upper Mantle Imaging of Botswana Using Magnetotelluric Method (Faculty of Geoinformation Science and Earth Observation (ITC) of the University of Twente). Retrieved from https://essay.utwente.nl/88633/.
Becken, M., and Burkhardt, H. (2004). An Ellipticity Criterion in Magnetotelluric Tensor Analysis. Geophys. J. Int. 159 (1), 69–82. doi:10.1111/j.1365-246X.2004.02376.x
Becken, M., Ritter, O., and Burkhardt, H. (2008). Mode Separation of Magnetotelluric Responses in Three-Dimensional Environments. Geophys. J. Int. 172 (1), 67–86. doi:10.1111/j.1365-246X.2007.03612.x
Begg, G. C., Griffin, W. L., Natapov, L. M., O'Reilly, S. Y., Grand, S. P., O'Neill, C. J., et al. (2009). The Lithospheric Architecture of Africa: Seismic Tomography, Mantle Petrology, and Tectonic Evolution. Geosphere 5 (1), 23–50. doi:10.1130/GES00179.1
Bibby, H. M., Caldwell, T. G., and Brown, C. (2005). Determinable and Non-determinable Parameters of Galvanic Distortion in Magnetotellurics. Geophys. J. Int. 163 (3), 915–930. doi:10.1111/j.1365-246X.2005.02779.x
Booker, J. R. (2014). The Magnetotelluric Phase Tensor: a Critical Review. Surv. Geophys 35 (1), 7–40. doi:10.1007/s10712-013-9234-2
Brandt, M. B. C., Grand, S. P., Nyblade, A. A., and Dirks, P. H. G. M. (2011). Upper Mantle Seismic Structure beneath Southern Africa: Constraints on the Buoyancy Supporting the African Superswell. Pure Appl. Geophys. 169 (4), 595–614. doi:10.1007/s00024-011-0361-8
Caldwell, T. G., Bibby, H. M., and Brown, C. (2004). The Magnetotelluric Phase Tensor. Geophys. J. Int. 158 (2), 457–469. doi:10.1111/j.1365-246X.2004.02281.x
Campanyà, J., Ogaya, X., Jones, A. G., Rath, V., Vozar, J., and Meqbel, N. (2016). The Advantages of Complementing MT Profiles in 3-D Environments with Geomagnetic Transfer Function and Interstation Horizontal Magnetic Transfer Function Data: Results from a Synthetic Case Study. Geophys. J. Int. 207 (3), 1818–1836. doi:10.1093/gji/ggw357
Carlson, R. W., Grove, T. L., De Wit, M. J., and Gurney, J. J. (1996). Program to Study Crust and Mantle of the Archean Craton in Southern Africa. Eos Trans. AGU 77 (29), 273. doi:10.1029/96EO00194
Cherevatova, M., Smirnov, M. Y., Jones, A. G., Pedersen, L. B., Becken, M., Biolik, M., et al. (2015). Magnetotelluric Array Data Analysis from North-West Fennoscandia. Tectonophysics 653, 1–19. doi:10.1016/j.tecto.2014.12.023
Chisenga, C., Jianguo, Y., Fadel, I., Meijde, M. v. d., and Atekwana, E. A. (2020a). Updated Tectonic Terrane Boundaries of Botswana Determined from Gravity and Aeromagnetic Data. Episodes 43 (4), 919–933. doi:10.18814/epiiugs/2020/020054
Chisenga, C., Van der Meijde, M., Yan, J., Fadel, I., Atekwana, E. A., Steffen, R., et al. (2020b). Gravity Derived Crustal Thickness Model of Botswana: its Implication for the Mw 6.5 April 3, 2017, Botswana Earthquake. Tectonophysics 787, 228479. doi:10.1016/j.tecto.2020.228479
Comeau, M. J., Becken, M., Käufl, J. S., Grayver, A. V., Kuvshinov, A. V., Tserendug, S., et al. (2020). Evidence for Terrane Boundaries and Suture Zones across Southern Mongolia Detected with a 2-dimensional Magnetotelluric Transect. Earth Planets Space 72 (1), 1–13. doi:10.1186/s40623-020-1131-6
Egbert, G. D., and Kelbert, A. (2012). Computational Recipes for Electromagnetic Inverse Problems. Geophys. J. Int. 189 (1), 251–267. doi:10.1111/j.1365-246X.2011.05347.x
Evans, R. L., Elsenbeck, J., Zhu, J., Abdelsalam, M. G., Sarafian, E., Mutamina, D., et al. (2019). Structure of the Lithosphere beneath the Barotse Basin, Western Zambia, from Magnetotelluric Data. Tectonics 38 (2), 666–686. doi:10.1029/2018TC005246
Evans, R. L., Jones, A. G., Garcia, X., Muller, M., Hamilton, M., Evans, S., et al. (2011). Electrical Lithosphere beneath the Kaapvaal Craton, Southern Africa. J. Geophys. Res. 116 (B4), 1–16. doi:10.1029/2010JB007883
Fadel, I. E. A. M. (2018). Crustal and Upper Mantle Structure of Botswana. Enschede: University of Twente. doi:10.3990/1.9789036544641
Fadel, I., Paulssen, H., van der Meijde, M., Kwadiba, M., Ntibinyane, O., Nyblade, A., et al. (2020). Crustal and Upper Mantle Shear Wave Velocity Structure of Botswana: the 3 April 2017 Central Botswana Earthquake Linked to the East African Rift System. Geophys. Res. Lett. 47 (4), 1–12. doi:10.1029/2019GL085598
Fadel, I., van der Meijde, M., and Paulssen, H. (2018). Crustal Structure and Dynamics of Botswana. J. Geophys. Res. Solid Earth 123 (12), 10,659–10,671. doi:10.1029/2018JB016190
Fouch, M. J., James, D. E., VanDecar, J. C., and van der Lee, S. (2004). Mantle Seismic Structure beneath the Kaapvaal and Zimbabwe Cratons. South Afr. J. Geol. 107 (1–2), 33–44. doi:10.2113/107.1-2.33
Gao, S. S., Liu, K. H., Reed, C. A., Yu, Y., Massinque, B., Mdala, H., et al. (2013). Seismic Arrays to Study African Rift Initiation. Eos Trans. AGU 94 (24), 213–214. doi:10.1002/2013EO240002
Gardonio, B., Jolivet, R., Calais, E., and Leclère, H. (2018). The April 2017 Mw 6.5 Botswana Earthquake: An Intraplate Event Triggered by Deep Fluids. Geophys. Res. Lett. 45 (17), 8886–8896. doi:10.1029/2018GL078297
Groom, R. W., and Bailey, R. C. (1991). Analytic Investigations of the Effects of Near‐surface Three‐dimensional Galvanic Scatterers on MT Tensor Decompositions. GEOPHYSICS 56 (4), 496–518. doi:10.1190/1.1443066
Haddon, I. G. (2005). The Sub-kalahari Geology and Tectonic Evolution of the Kalahari Basin, Southern Africa. Johannesburg: University of the Witwatersrand. Retrieved from https://wiredspace.wits.ac.za/bitstream/handle/10539/193/Haddonthesistext.pdf.
Hutchins, D. G., and Reeves, C. V. (1980). Regional Geophysical Exploration of the Kalahari in Botswana. Tectonophysics 69 (3–4), 201–220. doi:10.1016/0040-1951(80)90211-5
Jones, A. G., Chave, A. D., Egbert, G., Auld, D., and Bahr, K. (1989). A Comparison of Techniques for Magnetotelluric Response Function Estimation. J. Geophys. Res. 94 (B10), 14201–14213. doi:10.1029/JB094iB10p14201
Jones, A. G., Chave, A. D., Jones, A. G., Mackie, R., and Rodi, W. (2012). “Distortion of Magnetotelluric Data: its Identification and Removal,” in The Magnetotelluric Method. Editors A. D. Chave,, and A. G. Jones, 219–302. doi:10.1017/CBO9781139020138.008
Jones, A. G., Evans, R. L., Muller, M. R., Hamilton, M. P., Miensopust, M. P., Cole, P., et al. (2009a). “The SAMTEX Experiment: Overview and Preliminary Results,” in 11th SAGA Biennial Technical Meeting and Exhibition, Swaziland, South Africa, 16 Sep 2009 - 18 Sep 2009. doi:10.3997/2214-4609-pdb.241.jones_paper1
Jones, A. G., Evans, R. L., Muller, M. R., Hamilton, M. P., Miensopust, M. P., Garcia, X., et al. (2009b). Area Selection for Diamonds Using Magnetotellurics: Examples from Southern Africa. Lithos 112, 83–92. doi:10.1016/j.lithos.2009.06.011
Jones, A. G., and Garcia, X. (2006). “Electrical Resistivity Structure of the Yellowknife River Fault Zone and Surrounding Region,” in Gold in the Yellowknife Greenstone Belt, Northwest Territories: Results of the EXTECH III Multidisciplinary Research Project. Editors C. D. Anglin, H. Falck, D. F. Wright, and E. J. Ambrose (Toronto: Geological Association of Canada, Mineral Deposits Division), 3, 126–141.
Jones, A. G., Ledo, J., and Ferguson, I. J. (2005). Electromagnetic Images of the Trans-Hudson Orogen: the North American Central Plains Anomaly Revealed. Can. J. Earth Sci. 42 (4), 457–478. doi:10.1139/e05-018
Jones, M. Q. W. (1988). Heat Flow in the Witwatersrand Basin and Environs and its Significance for the South African Shield Geotherm and Lithosphere Thickness. J. Geophys. Res. 93 (B4), 3243–3260. doi:10.1029/JB093iB04p03243
Kelbert, A., Meqbel, N., Egbert, G. D., and Tandon, K. (2014). ModEM: A Modular System for Inversion of Electromagnetic Geophysical Data. Comput. Geosciences 66, 40–53. doi:10.1016/j.cageo.2014.01.010
Key, R. M., and Ayres, N. (2000). The 1998 Edition of the National Geological Map of Botswana. J. Afr. Earth Sci. 30 (3), 427–451. doi:10.1016/S0899-5362(00)00030-0
Khoza, D., Jones, A. G., Muller, M. R., Evans, R. L., Webb, S. J., and Miensopust, M. (2013a). Tectonic Model of the Limpopo Belt: Constraints from Magnetotelluric Data. Precambrian Res. 226, 143–156. doi:10.1016/j.precamres.2012.11.016
Khoza, T. D., Jones, A. G., Muller, M. R., Evans, R. L., Miensopust, M. P., and Webb, S. J. (2013b). Lithospheric Structure of an Archean Craton and Adjacent Mobile Belt Revealed from 2-D and 3-D Inversion of Magnetotelluric Data: Example from Southern Congo Craton in Northern Namibia. J. Geophys. Res. Solid Earth 118 (8), 4378–4397. doi:10.1002/jgrb.50258
Kinabo, B. D., Atekwana, E. A., Hogan, J. P., Modisi, M. P., Wheaton, D. D., and Kampunzu, A. B. (2007). Early Structural Development of the Okavango Rift Zone, NW Botswana. J. Afr. Earth Sci. 48 (2–3), 125–136. doi:10.1016/j.jafrearsci.2007.02.005
Kinabo, B. D., Hogan, J. P., Atekwana, E. A., Abdelsalam, M. G., and Modisi, M. P. (2008). Fault Growth and Propagation during Incipient Continental Rifting: Insights from a Combined Aeromagnetic and Shuttle Radar Topography Mission Digital Elevation Model Investigation of the Okavango Rift Zone, Northwest Botswana. Tectonics 27 (3), a–n. doi:10.1029/2007TC002154
Kirkby, A., Zhang, F., Peacock, J., Hassan, R., and Duan, J. (2019). The MTPy Software Package for Magnetotelluric Data Analysis and Visualisation. Joss 4 (37), 1358–1364. doi:10.21105/joss.01358
Kolawole, F., Atekwana, E. A., Malloy, S., Stamps, D. S., Grandin, R., Abdelsalam, M. G., et al. (2017). Aeromagnetic, Gravity, and Differential Interferometric Synthetic Aperture Radar Analyses Reveal the Causative Fault of the 3 April 2017Mw6.5 Moiyabana, Botswana, Earthquake. Geophys. Res. Lett. 44 (17), 8837–8846. doi:10.1002/2017GL074620
Krieger, L., and Peacock, J. R. (2014). MTpy: A Python Toolbox for Magnetotellurics. Comput. Geosciences 72, 167–175. doi:10.1016/j.cageo.2014.07.013
Ledo, J. (2005). 2-D versus 3-D Magnetotelluric Data Interpretation. Surv. Geophys 26 (5), 511–543. doi:10.1007/s10712-005-1757-8
Ledo, J., Queralt, P., Martí, A., and Jones, A. G. (2002). Two-dimensional Interpretation of Three-Dimensional Magnetotelluric Data: an Example of Limitations and Resolution. Geophys. J. Int. 150 (1), 127–139. doi:10.1046/j.1365-246X.2002.01705.x
Leseane, K., Atekwana, E. A., Mickus, K. L., Abdelsalam, M. G., Shemang, E. M., and Atekwana, E. A. (2015). Thermal Perturbations beneath the Incipient Okavango Rift Zone, Northwest Botswana. J. Geophys. Res. Solid Earth 120 (2), 1210–1228. doi:10.1002/2014JB011029
McCourt, S., Armstrong, R. A., Jelsma, H., and Mapeo, R. B. M. (2013). New U–Pb SHRIMP Ages From the Lubango Region, SW Angola: Insights Into the Palaeoproterozoic Evolution of the Angolan Shield, Southern Congo Craton, Africa. Journal of the Geological Society 170 (2), 353–363. doi:10.1144/jgs2012-059
Midzi, V., Saunders, I., Manzunzu, B., Kwadiba, M. T., Jele, V., Mantsha, R., et al. (2018). The 03 April 2017 Botswana M6.5 Earthquake: Preliminary Results. J. Afr. Earth Sci. 143, 187–194. doi:10.1016/j.jafrearsci.2018.03.027
Miensopust, M. P., Jones, A. G., Muller, M. R., Garcia, X., and Evans, R. L. (2011). Lithospheric Structures and Precambrian Terrane Boundaries in Northeastern Botswana Revealed through Magnetotelluric Profiling as Part of the Southern African Magnetotelluric Experiment. J. Geophys. Res. 116 (B2), 1–21. doi:10.1029/2010JB007740
M. Meqbel, N., Egbert, G. D., Wannamaker, P. E., Kelbert, A., and Schultz, A. (2014). Deep Electrical Resistivity Structure of the Northwestern U.S. Derived from 3-D Inversion of USArray Magnetotelluric Data. Earth Planet. Sci. Lett. 402 (C), 290–304. doi:10.1016/j.epsl.2013.12.026
Modisi, M. P., Atekwana, E. A., Kampunzu, A. B., and Ngwisanyi, T. H. (2000). Rift Kinematics during the Incipient Stages of Continental Extension: Evidence from the Nascent Okavango Rift Basin, Northwest Botswana. Geology 28 (10), 939. doi:10.1130/0091-7613(2000)028<0939:rkdtis>2.3.co;2
Modisi, M. P. (2000). Fault System at the Southeastern Boundary of the Okavango Rift, Botswana. J. Afr. Earth Sci. 30 (3), 569–578. doi:10.1016/S0899-5362(00)00039-7
Moorkamp, M., Fishwick, S., Walker, R. J., and Jones, A. G. (2019). Geophysical Evidence for Crustal and Mantle Weak Zones Controlling Intra-plate Seismicity - the 2017 Botswana Earthquake Sequence. Earth Planet. Sci. Lett. 506, 175–183. doi:10.1016/j.epsl.2018.10.048
Muller, M. R., Jones, A. G., Evans, R. L., Grütter, H. S., Hatton, C., Garcia, X., et al. (2009). Lithospheric Structure, Evolution and Diamond Prospectivity of the Rehoboth Terrane and Western Kaapvaal Craton, Southern Africa: Constraints from Broadband Magnetotellurics. Lithos 112, 93–105. doi:10.1016/j.lithos.2009.06.023
Niblett, E. R., and Sayn‐Wittgenstein, C. (1960). Variation of Electrical Conductivity with Depth by the Magneto‐telluric Method. GEOPHYSICS 25 (5), 998–1008. doi:10.1190/1.1438799
Nyblade, A., Dirks, P., Durrheim, R., Webb, S., Jones, M., Cooper, G., et al. (2008). AfricaArray: Developing a Geosciences Workforce for Africa's Natural Resource Sector. Lead. Edge 27 (10), 1358–1361. doi:10.1190/1.2996547
Ortiz, K., Nyblade, A., Meijde, M., Paulssen, H., Kwadiba, M., Ntibinyane, O., et al. (2019). Upper Mantle P and S Wave Velocity Structure of the Kalahari Craton and Surrounding Proterozoic Terranes, Southern Africa. Geophys. Res. Lett. 46 (16), 9509–9518. doi:10.1029/2019GL084053
Özaydın, S., Selway, K., Griffin, W. L., and Moorkamp, M. (2022). Probing the Southern African Lithosphere with Magnetotellurics: 2. Linking Electrical Conductivity, Composition, and Tectonomagmatic Evolution. JGR Solid Earth 127 (3), 1–28. doi:10.1029/2021JB023105
Panza, G., Peccerillo, A., Aoudia, A., and Farina, B. (2007). Geophysical and Petrological Modelling of the Structure and Composition of the Crust and Upper Mantle in Complex Geodynamic Settings: The Tyrrhenian Sea and Surroundings. Earth-Science Rev. 80 (1–2), 1–46. doi:10.1016/j.earscirev.2006.08.004
Pastier, A.-M., Dauteuil, O., Murray-Hudson, M., Moreau, F., Walpersdorf, A., and Makati, K. (2017). Is the Okavango Delta the Terminus of the East African Rift System? towards a New Geodynamic Model: Geodetic Study and Geophysical Review. Tectonophysics 712-713, 469–481. doi:10.1016/j.tecto.2017.05.035
Paulssen, H., Micallef, T., Bouwman, D. R., Ruigrok, E., Herman, M. W., Fadel, I., et al. (2022). Rifting of the Kalahari Craton through Botswana? New Seismic Evidence. JGR Solid Earth 127 (4), 1–17. doi:10.1029/2021JB023524
Pretorius, D. A. (1984). The Kalahari Foreland, its Marginal Troughs and Overthrust Belts, and the Regional Structure of Botswana. Johannesburg, South Africa: University of Witwatersrand.
Reeves, C. V., and Hutchins, D. G. (1982). A Progress Report on the Geophysical Exploration of the Kalahari in Botswana. Geoexploration 20 (3–4), 209–224. doi:10.1016/0016-7142(82)90022-9
Robertson, K., Thiel, S., and Meqbel, N. (2020). Quality over Quantity: on Workflow and Model Space Exploration of 3D Inversion of MT Data. Earth Planets Space 72 (1), 2. doi:10.1186/s40623-019-1125-4
Simpson, F., and Bahr, K. (2005). Practical Magnetotellurics. Cambridge, UK: Cambridge University Press.
Smith, J. T. (1995). Understanding Telluric Distortion Matrices. Geophys. J. Int. 122 (1), 219–226. doi:10.1111/j.1365-246X.1995.tb03549.x
Sobh, M., Gerhards, C., Fadel, I., and Götze, H. J. (2021). Mapping the Thermal Structure of Southern Africa from Curie Depth Estimates Based on Wavelet Analysis of Magnetic Data with Uncertainties. Geochem Geophys Geosyst 22 (11), 1–29. doi:10.1029/2021GC010041
Telford, W. M., Geldart, L. P., and Sheriff, R. E. (2004). Applied Geophysics. Cambridge, UK: Cambridge University Press. (Second).
Thomas, R. J., von Veh, M. W., and McCourt, S. (1993). The Tectonic Evolution of Southern Africa: an Overview. J. Afr. Earth Sci. 16 (1–2), 5–24. doi:10.1016/0899-5362(93)90159-N
van Schijndel, V., Cornell, D. H., Frei, D., Simonsen, S. L., and Whitehouse, M. J. (2014). Crustal Evolution of the Rehoboth Province from Archaean to Mesoproterozoic Times: Insights from the Rehoboth Basement Inlier. Precambrian Res. 240, 22–36. doi:10.1016/j.precamres.2013.10.014
van Schijndel, V., Cornell, D. H., Hoffmann, K.-H., and Frei, D. (2011). Three Episodes of Crustal Development in the Rehoboth Province, Namibia. Geol. Soc. Lond. Spec. Publ. 357 (1), 27–47. doi:10.1144/SP357.3
Wannamaker, P. E., Hasterok, D. P., Johnston, J. M., Stodt, J. A., Hall, D. B., Sodergren, T. L., et al. (2008). Lithospheric Dismemberment and Magmatic Processes of the Great Basin-Colorado Plateau Transition, Utah, Implied from Magnetotellurics. Geochem. Geophys. Geosyst. 9 (5), a–n. doi:10.1029/2007GC001886
Wessel, P., Luis, J. F., Uieda, L., Scharroo, R., Wobbe, F., Smith, W. H. F., et al. (2019). The Generic Mapping Tools Version 6. Geochem. Geophys. Geosyst. 20 (11), 5556–5564. doi:10.1029/2019GC008515
White‐Gaynor, A. L., Nyblade, A. A., Durrheim, R. J., Raveloson, R., van der Meijde, M., Fadel, I., et al. (2021). Shear‐Wave Velocity Structure of the Southern African Upper Mantle: Implications for Craton Structure and Plateau Uplift. Geophys Res. Lett. 48 (7), 1–10. doi:10.1029/2020GL091624
Wright, J. A., and Hall, J. (1990). Deep Seismic Profiling in the Nosop Basin, Botswana: Cratons, Mobile Belts and Sedimentary Basins. Tectonophysics 173 (1–4), 333–343. doi:10.1016/0040-1951(90)90228-Z
Yu, Y., Gao, S. S., Moidaki, M., Reed, C. A., and Liu, K. H. (2015a). Seismic Anisotropy beneath the Incipient Okavango Rift: Implications for Rifting Initiation. Earth Planet. Sci. Lett. 430, 1–8. doi:10.1016/j.epsl.2015.08.009
Yu, Y., Liu, K. H., Moidaki, M., Reed, C. A., and Gao, S. S. (2015b). No Thermal Anomalies in the Mantle Transition Zone beneath an Incipient Continental Rift: Evidence from the First Receiver Function Study across the Okavango Rift Zone, Botswana. Geophys. J. Int. 202 (2), 1407–1418. doi:10.1093/gji/ggv229
Keywords: electrical modelling, magnetotellurics, tectonics, continental rift, rift initiation, Africa
Citation: Akinremi S, Fadel I and van der Meijde M (2022) Crustal and Upper Mantle Imaging of Botswana Using Magnetotelluric Method. Front. Earth Sci. 10:840703. doi: 10.3389/feart.2022.840703
Received: 21 December 2021; Accepted: 31 May 2022;
Published: 24 June 2022.
Edited by:
Nibir Mandal, Jadavpur University, IndiaReviewed by:
Radhakrishna Munukutla, Indian Institute of Technology Bombay, IndiaArun Singh, Indian Institute of Technology Dhanbad, India
Copyright © 2022 Akinremi, Fadel and van der Meijde. This is an open-access article distributed under the terms of the Creative Commons Attribution License (CC BY). The use, distribution or reproduction in other forums is permitted, provided the original author(s) and the copyright owner(s) are credited and that the original publication in this journal is cited, in accordance with accepted academic practice. No use, distribution or reproduction is permitted which does not comply with these terms.
*Correspondence: Stephen Akinremi, cy5ha2lucmVtaUB1dHdlbnRlLm5s