 Yue Qiang*
 Changsi Xia
 Li Li
Li Li Dongsheng Zhao
- Dept. of Civil Engineering, School of Civil Engineering, Chongqing Three Gorges University, Chongqing, China
Determining the characteristic stress intensity according to the rock stress-strain curve is significant significance for rock engineering. Nowadays, there are relatively mature methods for determining peak stress and damage stress. However, the crack volume strain method, axial strain method, and strain response method are more subjective to determine rock’s closure stress and initiation stress. The closure rock stress and crack initiation stress refined value method are proposed based on these methods, which are based on the discreteness of the rock stress and strain point. Through optimizing the stress characteristics by an objective function (variance function), the subjectivity of artificial observation is avoided; Based on the trend of rock stress-strain curve, an empirical method for determining rock closure stress and crack initiation stress is proposed. The test results indicate that the two proposed methods that calculate closure rock stress and crack initiation stress can obtain reasonable results. These methods can be used as a supplement to the characteristics of the rock stress determination method and can be used in actual engineering.
Introduction
It is considered of great significance to study the deformation and strength characteristics of rock under compression for guiding practical rock engineering (Martin and Chandler, 1994; Eberhardt et al., 1998; Nicksiar and Martin, 2012) The stress-strain curve of rock is obtained by uniaxial or triaxial compression tests. By analyzing the deformation characteristics of the rock stress-strain curve, and the characteristic stress intensity is calculated to guide the field practice engineering. In the study of stress-strain curve characteristics, the determination of characteristic stress intensity has been considered a fundamental topic in rock mechanics (Everitt and Lajtai, 2004; Cieślik, 2014).
Generally, the pre-peak process of fractured rock is divided failure into four stages (i.e., crack closure stage, elastic stage, stable crack expansion stage and crack accelerated expansion stage) (Brace et al., 1966; Bieniaweski, 1967; Brown, 1981; Cai et al., 2004; Peng et al., 2015) The characteristic stress intensity corresponding to each stage is closure stress intensity, crack initiation stress intensity, damage stress intensity, and peak stress intensity, respectively. The division of the above deformation stages is an important basis for determining the evolution stage of rock mass or geological body and predicting the development trend. For the determination of characteristic stress intensity, it is usually considered that the determination of peak stress is the easiest, which can be directly calibrated by the peak point of the stress-strain curve. Moreover, the determination of damage stress can obtain by interpreting the inflection point of the volumetric strain curve (Yang, 2016). By contrast, it is much more difficult to determine the closure stress and crack initiation stress.
For determining the rock closure stress and crack initiation stress, domestic and foreign scholars have also put forward some methods from various angles. The crack volume strain-axial strain curve has a horizontal section where the crack volume strain is zero, which was found by Martin and Chandler, 1994. The crack volume strain method was proposed by them to determine the crack initiation stress and closure stress of fractured rock through its characteristic points. The stress-axial strain curve of rock crack in the closure process was nonlinearly found by Eberhardt et al. (1998), and its axial stiffness increased with the increase of stress. Therefore, the axial stiffness method was proposed to determine the closure stress of rock. Nicksiar and Martin, 2012 conducted a statistical analysis of the initiation stress in different rock failure processes, and proposed a method to identify the initiation stress through transverse strain parameters. Same as the transverse strain method Nicksiar and Martin, 2012, the method of determining the closure stress based on the axial strain response was proposed by Peng et al. (2015). However, the above methods are susceptible to subjective factors, resulting in large errors in the results. In addition, the acoustic emission method is also a common method to study the mechanical characteristics of rock. However, the acoustic emission method is susceptible to rock structure, composition, and external noise. In other words, the characteristic stress intensity of rock is brutal to determine because of the randomness of the acoustic emission method (Cieślik, 2014). Therefore, the commonly used determination method is still based on the strain method.
The stress-strain data obtained from uniaxial compression tests or triaxial compression tests are discrete and subject to various factors that may cause these data to deviate from the actual values. Therefore, how to deal with these discrete data is the key to determine the characteristic stress intensity of rock. In fact, including axial strain method, the axial stiffness method, and the crack volume strain method are all based on the existence of an approximate linear stage in the process of rock failure when determining the closure stress and initiation stress (Wen et al., 2018; Tang et al., 2021; Zhang et al., 2021). Therefore, the determination of closure stress and crack initiation stress can be attributed to determining the linear change stage in the rock stress-strain curve.
Given the subjectivity of the closure and initiation stress values in the appeal method, from the perspective of the discreteness of rock stress and strain points, the difference formula is used to process the original data, namely the variance function, to avoid the subjectivity of artificial observation. At the same time, to meet the actual needs of some projects, an empirical value method is proposed based on the rock stress-axial strain standard curve trend. Finally, the proposed methods are verified and discussed.
Pre-peak stage division of fractured rock
Some scholars have carried out extensive discussions on the stage division of the whole process stress-strain curve of fractured rock and divided the pre-peak period into four stages (Brace et al., 1966; Bieniaweski, 1967; Brown, 1981; Cai et al., 2004; Peng et al., 2015). The crack closure stage, the elastic deformation stage, the crack stable expansion stage, and the accelerated crack propagation stage (Figure 1). In the crack closure stage, the original internal pores of the rock are continuously compressed, and the axial stress-strain curve of the rock shows an upward concave shape from the trend (Muller, 1982; Xu and Yang, 2017). In the linear elastic stage, the microcracks inside the rock continue to be compressed. However, due to the low-stress level, it will not lead to new cracks or the expansion of the original crack. The stress-axial strain curve of rock shows an approximate linear growth in the trend. The trend characteristics of this stage are the basis for determining the strength of crack closure stress and crack initiation stress. In the stage of stable crack propagation, when the stress level of rock reaches the threshold required for crack propagation, the internal crack rock begins to propagate. However, the rock stress-axial strain curve began to deviate from the straight line due to the low expansion rate. During the accelerated crack propagation stage, the cracks accelerate to propagate, and the cracks are dense, overlapped, and connected inside the specimen to form macro cracks. These cracks further develop into crack zones with intense strain concentration and extend to the end of the specimen until the specimen is broken. Therefore, the rock stress-strain curve at this stage is geometrically concave.
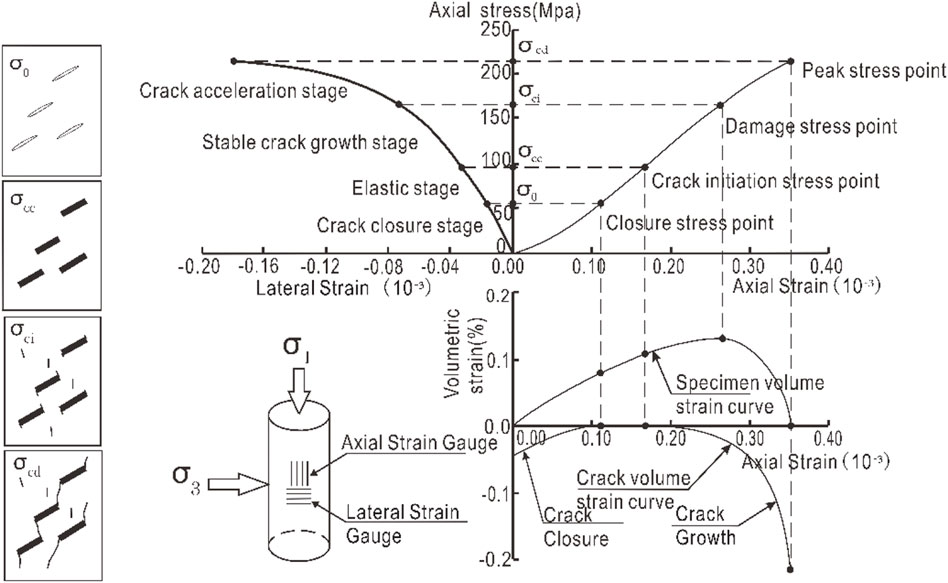
FIGURE 1. Schematic diagram of the division stage before rock peak damage (Brace et al., 1966; Cai et al., 2004).
Nowadays, the determination methods of rock peak stress intensity and damage stress intensity have been relatively mature, but there is no unified method closure stress and crack initiation stress. Therefore, the determination methods of rock closure stress and crack initiation stress intensity are discussed below.
Determination method of closure or initiation stress of fractured rock
Axial strain method
Many rock mechanics tests have shown that the stress-axial strain curve of rock has an approximately linear change stage. Therefore, the crack closure stress can be determined directly from the rock stress-axial strain curve. As shown in Figure 2, the crack closure stress intensity corresponds to the turning point of the stress-axial strain curve from nonlinearity to linearity; the crack initiation stress corresponds to the turning point of axial stress-axial strain curve from nonlinear to linear. The advantage of this method is that the idea is simple, and the physical meaning is clear, but the deficiency is that it is greatly affected by human factors. For example, the accurate determination of the turning point strongly depends on the subjective judgment of engineers.
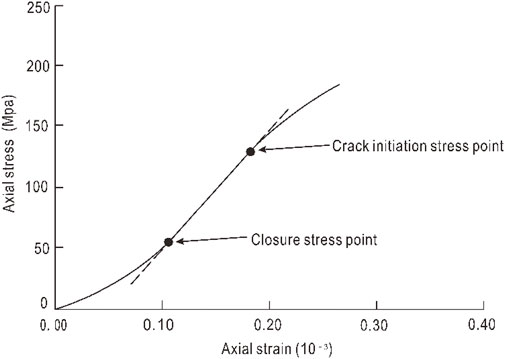
FIGURE 2. Schematic diagram of axial strain method.
Crack volume strain method
According to the stress-lateral strain and stress-axial strain test data obtained from the rock compression test, the volumetric strain under a certain level of stress can be calculated:
Where, the axial strain (
Rock volume strain (
Where, σ1, σ2, and σ3 are the axial stress and confining pressure; v and E are the Poisson’s ratio and elastic modulus of the rock. Then the crack volume strain can be calculated by the following equation:
Under uniaxial conditions, Eq. 3 can be simplified as:
The crack volume strain method is based on the relationship between the crack volume strain and the loading stress σ1, σ2 and σ3 established according to Eq. 3. The strain value that the crack volume strain first tends to zero as the closing stress intensity, and the axial strain value at the point where it deviates from zero again is taken as the crack initiation stress intensity. The solution diagram of this method is shown in Figure 3. Compared with the axial strain method, this method reduces the subjectivity of artificial estimation to a certain extent, and the solution results are relatively objective. However, the method has the disadvantage of over-reliance on the elastic parameters v and E, and the insufficient accuracy of the parameters may easily lead to errors in the solution results.
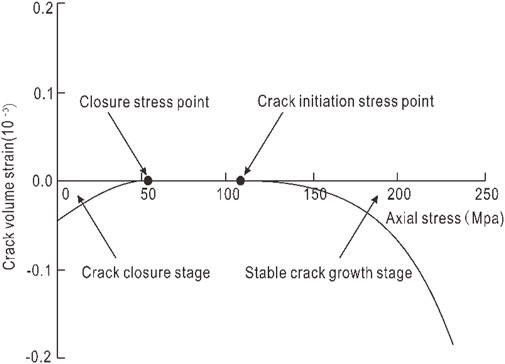
FIGURE 3. Schematic diagram of crack volume strain method (Cieślik, 2014)
Strain response method
The strain response method is a method proposed by Nicksiar and Martin, 2012 to identify crack initiation stress by transverse strain parameters. The idea of this method is as follows: First, determine the damage stress point A according to the stress-volume strain curve (Figure 4), the corresponding point B in the lateral strain curve is determined, and OB is connected as the reference line. Then, under the same axial stress, the strain value corresponding to the transverse strain curve and the reference line is taken, and the difference between the two is the transverse strain difference. Finally, polynomial fitting is performed on the data points, and the peak point C of the fitting curve is the crack initiation stress intensity. To further simplify the solution process, it is not necessary to fit the transverse strain difference curve, and the stress corresponding to the maximum value of the transverse strain difference is directly taken as the initiation stress intensity. The advantage of this method is that the value standard is objective and unique, which is convenient for programming. However, the deficiency is the lack of theoretical basis, so it can consider that the method is an empirical method, which is based on the trend of the stress-lateral strain curve trend.
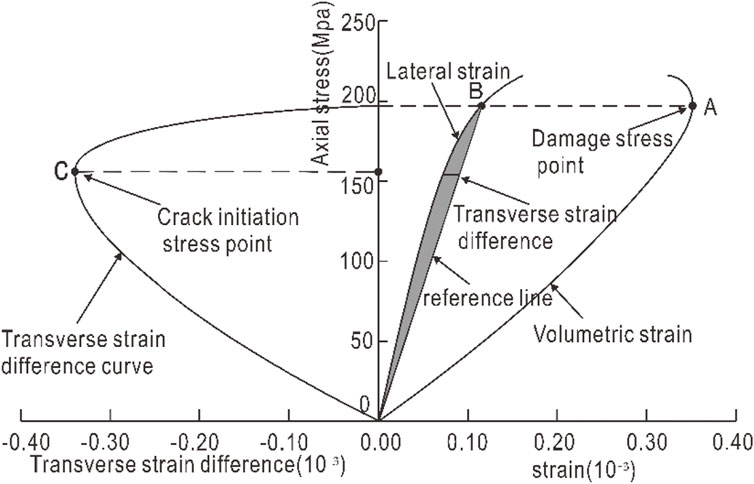
FIGURE 4. Schematic diagram of transverse strain response method (Nicksiar and Martin, 2012)
Similar to the transverse strain method proposed by Nicksiar and Martin, 2012, the method of determining the closure stress based on the axial strain response was proposed by Peng et al. (2015). The idea is as follows: Firstly, the damage stress point A is determined according to the stress-volume strain curve, and its projection point on the axial strain curve is determined as B, and OB is connected as the reference line. Then, under the same axial stress condition, the strain values corresponding to the axial strain curve and the reference curve are solved. The difference between the two is used as the axial strain difference. Finally, polynomial fitting is performed on the data points, and the peak point C of the fitted curve is the closure stress, or the maximum value of the axial strain difference is directly calculated. The solution principle is shown in Figure 5. The advantages and disadvantages of this method are the same as the transverse strain response method. Similarly, the method is an empirical method of taking based on of rock stress-axial strain curve trend.
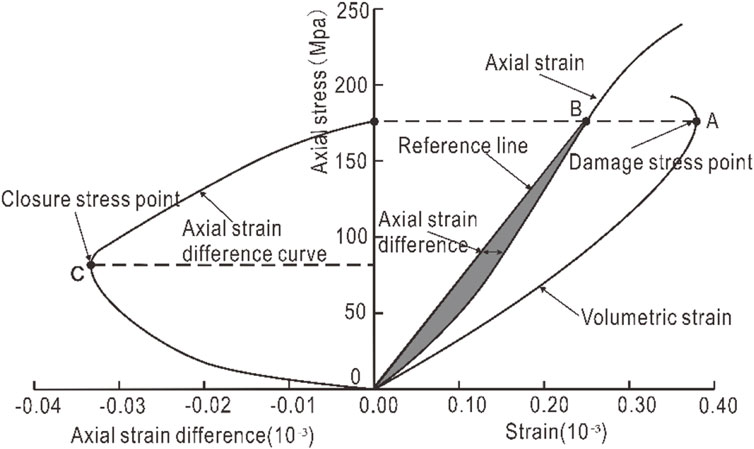
FIGURE 5. Schematic diagram of axial strain response method (Peng et al., 2015)
Refined value method
As mentioned above, the results of the axial stress-transverse strain and the axial stress-axial strain obtained from the rock compression test are all discrete point data. According to many rocks’ mechanical compression tests, the rock axial stress-strain curve presents an approximately linear characteristic in the elastic stage. The slope of the stress-strain curve is approximately unchanged at this stage. Based on this, the elastic stage can be determined by changing the first derivative of the stress-axial strain curve (i.e., the slope, which can be interpreted as stiffness in physical terms).
According to the knowledge of computational mathematics: The first-order derivative of the discrete points can be approximated by the difference method (Xue and Chen, 2004; Behforooz, 2006). The commonly used difference methods include forward difference equation, center difference equation, five-point difference equation, etc.
The forward difference equation (Xue and Chen, 2004) is defined as:
Where, σi and
The center difference equation (Xue and Chen, 2004) is defined as:
Where, σi-1 and
The five-point difference equation (Xue and Chen, 2004) is defined as:
Where, σi+2 and
Theoretically, the accuracy of the derivative calculated by Eq. 7 is relatively higher than that of Eq. 6–5. However, due to the higher degree of nonlinearity of the stress-strain curve, the derivative obtained by several methods may have a larger deviation. To intuitively show the response of several methods to the slope, take the same set of discrete curve data and calculate the slope characteristics determined by various methods, as shown in Figure 6. The coordinates of the x-axis and y-axis in Figure 6 are all dimensionless.
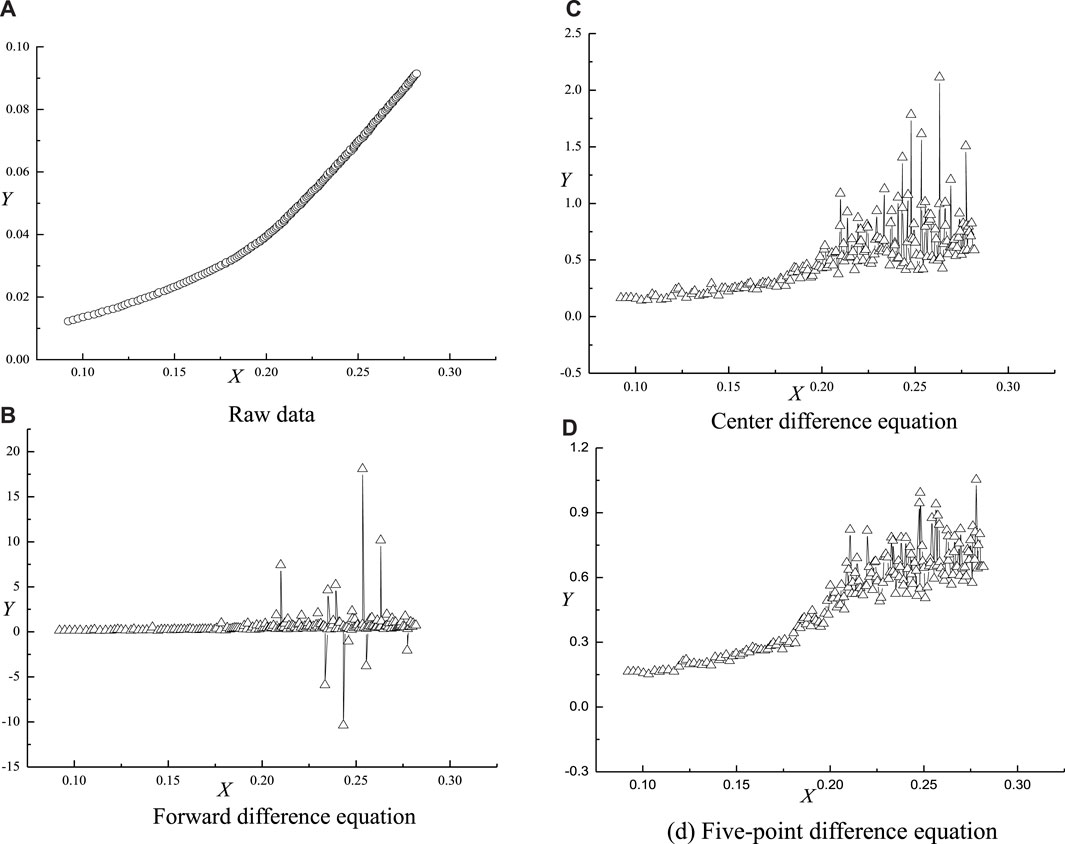
FIGURE 6. Different difference methods to calculate the derivative of the stress-strain curve.
It can be seen from Figure 6 that the slopes calculated by the three equations are quite different. Using volatility to measure the slope obtained by the appeal method, the volatility of Eq. 7 is smaller than that of Eq. 6–5. But the derivatives calculated by the three equations all reflect the characteristics of the true slope.
The determination of rock closure stress and crack initiation stress is based on the linear and nonlinear changes of rock stress–axial strain, but the stress–strain data obtained by uniaxial compression test or triaxial compression test are discrete. The over-subjective determination of closure stress and crack initiation stress obtained directly from rock stress–axial strain curve may lead to the deviation of these data from the actual value. Therefore, using the difference formula to process the original data and combining it with statistical knowledge (Aslam et al., 2021) to determine the rock closure stress and crack initiation stress can reduce the influence of human subjective factors so that the results are more realistic. The specific ideas are as follows:
1) The closure stress and crack initiation stress of rock determined by n (n > 2) existing methods (such as axial strain method, crack volume strain method, strain response method, etc.);
2) The closure stress and crack initiation stress are used as the upper and lower limits to determine the optimal closure and crack initiation stress, respectively and then the original data are processed by the difference formula.
3) Finally, statistical knowledge is used to optimize the value. In this paper, the variance function is used as the objective function. The point that minimizes the value of the objective function is searched in the search range to determine the closure stress and crack initiation stress.
The calculation of closure and initiation stress intensity of fractured rock is transformed into an optimization problem by the new method proposed in this paper. Determining the values of the two through the optimal idea is a fine value method (or called the optimal value method), which has good universality.
Empirical value method
Through the similar ideas of Nicksiar and Martin, 2012 and Peng et al. (2015), an empirical method to determine the closure stress and crack initiation stress through the volumetric strain curve and the stress-axial strain curve was proposed in this paper. The idea and principles of this method are as follows (Figures 7, 8):
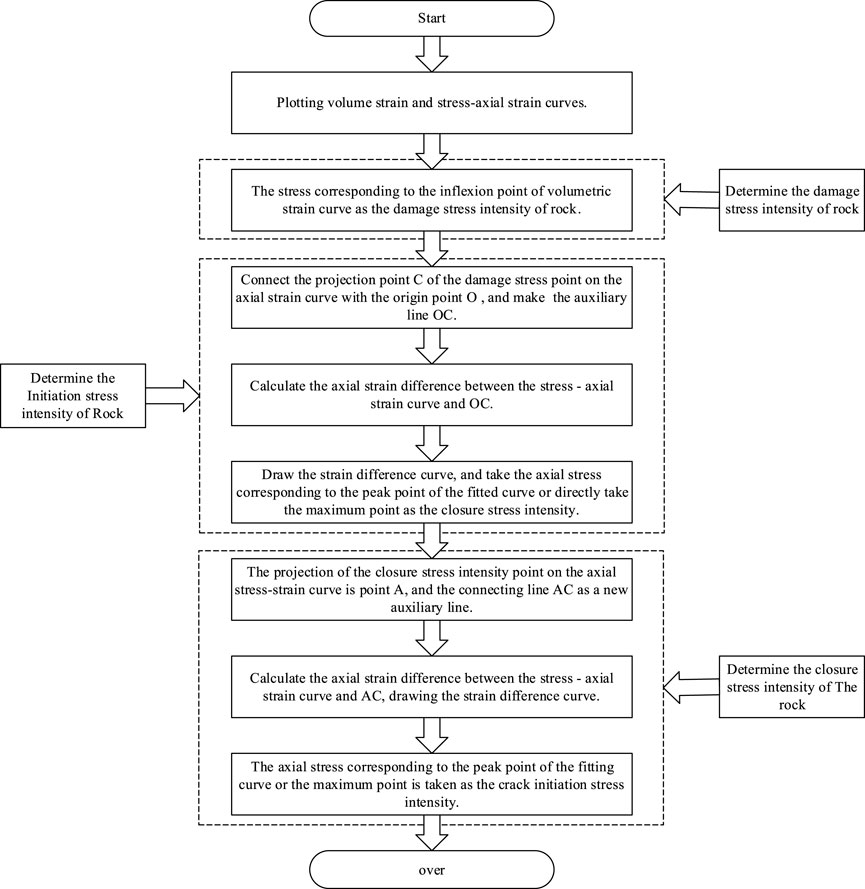
FIGURE 7. Flow chart of empirical value method.
It should be noted that the proposed empirical method is obtained from the intuitive observation of the trend of the rock stress-axial strain standard curve (Figure 1). Since it is an empirical value method, it may have a greater impact in some cases-error cases: such as rocks with insignificant deformation characteristics at various stages. Compared with the refine value method, the empirical value method has the advantage of being simple to implement. Compared with the axial strain method, the empirical value method has more objective results. However, due to the complex deformation laws of rock and many factors affecting its mechanical properties, the characteristics of its stress-strain curve are not as evident as the standard strain curve, which limits the application of this empirical value method.
Preliminary verification of the method
Calculation results
In this paper, the the uniaxial compressive stress-strain data of five rock samples are used as examples to verify the proposed methods (Eberhardt et al., 1998; Zhao et al., 2013; Zhao et al., 2015).
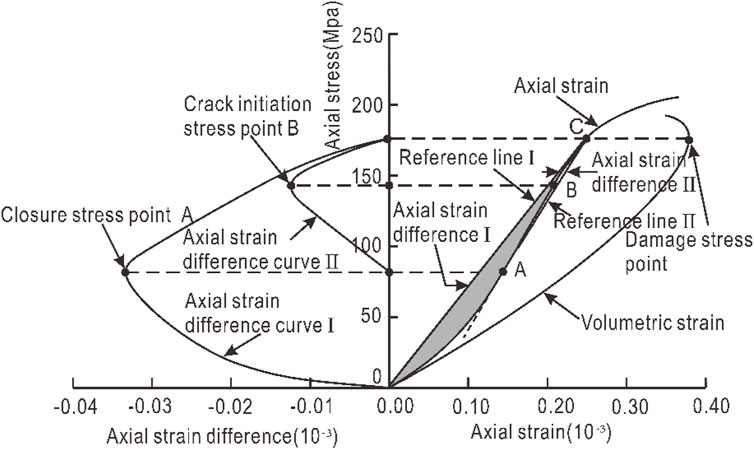
FIGURE 8. Schematic diagram of empirical value method.
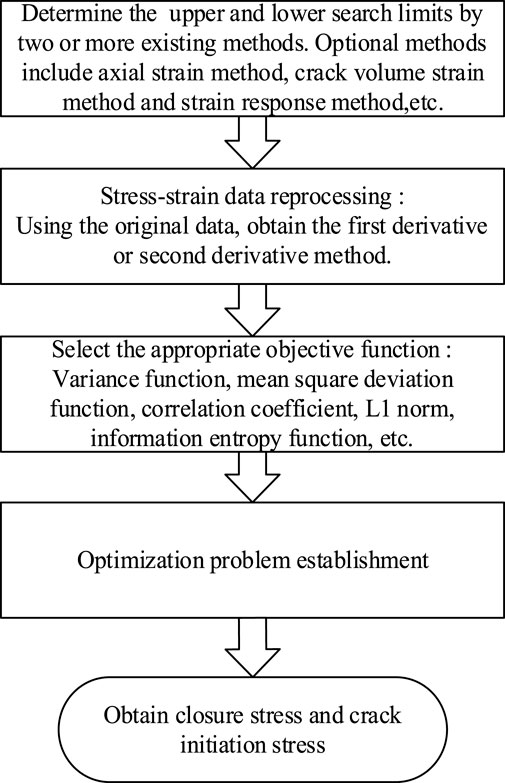
FIGURE 9. The frame diagram of the optimization method.
Taking sample BS06 as an example, the closing stress and crack initiation stress calculated by the crack volume strain method are 30 MPa and 70 MPa, respectively; the closing stress and crack initiation stress determined by the axial strain method are 40 MPa and 90 MPa, respectively. The search interval for closing stress is determined to be [30, 40] MPa, and the search interval for crack initiation stress is [70, 90] MPa. Through the fine value method, the optimization is carried out, and the final two characteristic stress values are 34.67 MPa and 86.07 MPa, respectively. Similarly, the closing stress and crack initiation stress via the empirical value method are about 35.90 MPa and 85.54 MPa. It can be seen that the empirical value method can also obtain relatively accurate value results, which can be used as a supplement to the refine value method.
The calculation results of all cases are summarized in Table 1, and the reliability of the method proposed in this paper is verified by the variance (<10 MPa) indicating the dispersion.
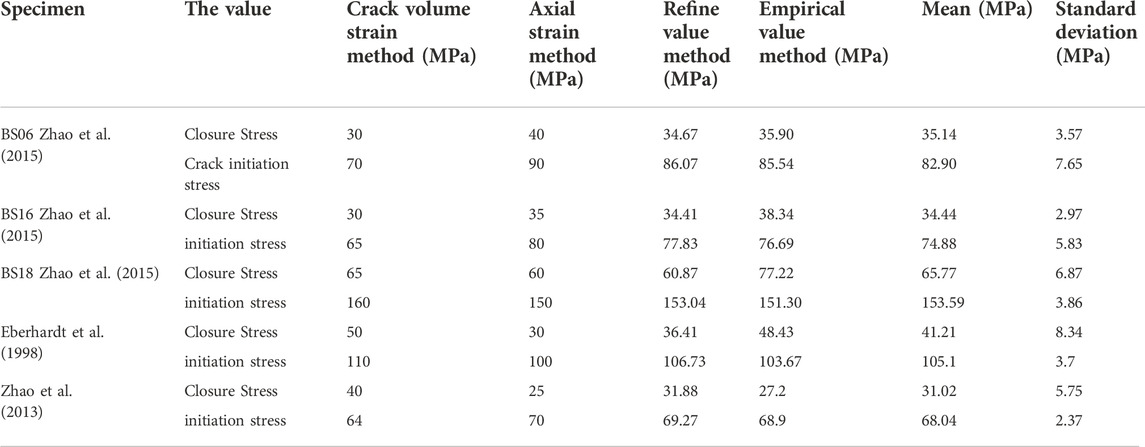
TABLE 1. The results.
Discussion
The determination of rock closure stress and initiation stress intensity is attributed to determining the linear change of rock stress-axial strain, which is based on many rock mechanical deformation tests. However, these data may deviate from the true value because it is too subjective to obtain the closure stress and crack initiation stress directly from the rock stress-axial strain curve. Therefore, how to deal with these discrete data is the key to determining the characteristic stress intensity of the rock. Nowadays, some scholars (Brace et al., 1966; Bieniawski, 1967; Brown, 1981; Eberhardt et al., 1998; Cai et al., 2004; Everitt and Lajtai, 2004; Cieślik, 2014; Peng et al., 2015; Yang, 2016) have determined the closure stress and crack initiation stress by the slope of the stress vs. strain curve (calculated by the forward difference equation). However, the existing methods still depends on subjective observation in determining the stable stage of the slope curve. The optimization value method proposed in this paper can avoid the subjectivity of artificially determining the stationary phase of the strain slope curve and can effectively improve the accuracy of the value. The following improvements can be made to the optimization method:
1) In addition to variance function, other functions such as information entropy can be tried to select objective function (Shi et al., 2012; Aslam et al., 2021).
2) When the original curve is used to optimize the value, the objective function can be optimized to improve the accuracy of the value. At this time, the objective function can be taken as the correlation coefficient and mean square error, etc. When the first derivative of the original curve is used optimization, the objective function can use variance; the second-order derivative of the original curve is used for optimization. The objective function can be the L1 norm when the stage of overall approximation is identified as zero.
In this paper, the first-order derivative of the original curve is selected for optimization. Compared with the original curve, this method refines the variation characteristics of the original curve and simplifies the calculation amount compared with the second-order derivative. According to the given optimization method framework (Figure 9), more methods for determining rock closure and crack initiation stress can be obtained, which will not be repeated here.
The empirical value method proposed in this paper is based on the law summarized by many rock compression deformation tests. However, due to the different compositions and structures of different rocks, not all rocks can be divided into four deformation stages before the peak. Therefore, the curve characteristics should be observed before determining the characteristic stress intensity of rock. For rocks with no obvious characteristics in the deformation stage, the fine value method is still applicable; For the rock with obvious deformation characteristics, the empirical value method and the fine value method have obtained reasonable results.
In this paper, the study on the determination methods of closure stress and crack initiation stress of fractured rock focuses on the mathematical value method or geometric meaning. However, the detailed physical meaning of the value method is not introduced in-depth, which is a deficiency of this paper. On the one hand, the author believes that rock mechanics have a great experience, and it is difficult to quickly obtain many physical rates in physical. However, most empirical rates are summarized, which can be widely accepted. The research method of this paper is to solve the closure stress and crack initiation stress problem of fractured rock employing a little mathematical value method based on empirical rate; On the other hand, not all rocks can be divided into four deformation stages before the peak. The author believes that all the deformation stages before the peak still need to be considered (Zhong et al., 2017). The initiation stress of fractured rock mass is closely related to the fracture toughness of rock considered by some scholars (Zhao et al., 2020a; Zhao et al., 2020b; Zhao et al., 2016; Lin et al., 2019). For example, Zhao et al. (2020a) found that rock fracture toughness is related to rock stress by rock crack rheology, fracture toughness, and subcritical crack propagation test. Hang Lin et al. (2019) studied the tip stress field and crack initiation angle of open defects under uniaxial compression. The above research shows that rock fracture mechanics can determine the crack initiation stress of fractured rock. Therefore, when the four deformation stages before the peak cannot be divided in the following study, the method of rock fracture mechanics is considered to determine the initiation stress.
Conclusion
Combined with practical engineering needs, the rock closure stress and crack initiation stress are studied from two aspects of fine value and fast value. The conclusions are as follows:
1) The variance function in the statistical index function is used as the objective function. The upper and lower limits of the optimized values are determined by the results obtained by the more accurate closure stress and crack initiation stress values method, and the closure stress and crack initiation stress are obtained by the optimization method. This method can avoid the subjectivity of human interpretation and can be used as a fine value for closure stress and crack initiation stress.
2) Combined with the characteristics of the stress-strain curve of standard rock, the empirical value method of rock closure stress and crack initiation stress is given. The results of this method are reasonable and can meet the engineering requirements.
3) Determination of rock closure and cracking stress values by citing (Eberhardt et al., 1998; Zhao et al., 2013; Zhao et al., 2015) the stress-strain data of fractured rocks in the paper preliminarily proves the effectiveness of the method proposed in this paper. The main work of this paper is to apply the optimization method to the determination of the stress eigenvalue and propose a framework for the optimization method, which may have some significance for improving and developing the related research on the stress eigenvalue problem of fractured rock.
Data availability statement
The original contributions presented in the study are included in the article/supplementary files, further inquiries can be directed to the corresponding author.
Author contributions
YQ, CX and SL contributed to conception and design of the study. LL organized the database. DZ performed the statistical analysis. GL and CX wrote the first draft of the manuscript. LZ, GL and LC wrote sections of the manuscript. All authors contributed to manuscript revision, read, and approved the submitted version.
Funding
This work was supported by the Scientific and Technological Research Program of Chongqing Municipal Education Commission (Grant No. KJQN202001218, KJQN202101206, KJQN202201238) the Open fund of Chongqing Three Gorges Reservoir Bank Slope and Engineering Structure Disaster Prevention and Control Engineering Technology Research Center (SXAPGC21ZD01), the Science and technology innovation project of Chongqing Wanzhou District Bureau of science and technology (wzstc20210305), Research development and application of “big data intelligent prediction and early warning cloud service platform for geological disasters in the Three Gorges Reservoir Area” of Chongqing Municipal Education Commission (HZ2021012), General program of Chongqing Natural Science Foundation (Grant No.cstc2019jcyj-mscm1865), Special key program of Chongqing Technology Innovation and Application Development (Grant No. cstc2019jscx-tjsbX0015), and “Chongqing Huanjiang structure disaster prevention and reduction theory and key technology” of Chongqing University Innovation Research Group (201928).
Conflict of interest
The authors declare that the research was conducted in the absence of any commercial or financial relationships that could be construed as a potential conflict of interest.
Publisher’s note
All claims expressed in this article are solely those of the authors and do not necessarily represent those of their affiliated organizations, or those of the publisher, the editors and the reviewers. Any product that may be evaluated in this article, or claim that may be made by its manufacturer, is not guaranteed or endorsed by the publisher.
References
Aslam, M., Bantan, R. A., and Khan, N. (2021). Design of tests for mean and variance under complexity-an application to rock measurement data. Measurement 177, 109312. doi:10.1016/j.measurement.2021.109312
Behforooz, H. (2006). Approximation by integro cubic splines. Appl. Math. Comput. 175 (1), 8–15. doi:10.1016/j.amc.2005.07.066
Bieniawski, Z. T. (1967). Mechanism of brittle fracture of rock: Part I—theory of the fracture process. Int. J. Rock Mech. Min. Sci. Geomechanics Abstr. 4 (4), 395–406.
Brace, W. F., Paulding, B. W., and Scholz, C. H. (1966). Dilatancy in the fracture of crystalline rocks. J. Geophys. Res. 71 (16), 3939–3953. doi:10.1029/jz071i016p03939
Cai, M. K. P. K., Kaiser, P. K., Tasaka, Y., Maejima, T., Morioka, H., and Minami, M. (2004). Generalized crack initiation and crack damage stress thresholds of brittle rock masses near underground excavations. Int. J. rock Mech. Min. Sci. 41 (5), 833–847. doi:10.1016/j.ijrmms.2004.02.001
Cieślik, J. (2014). Onset of crack initiation in uniaxial and triaxial compression tests of dolomite samples. Studia Geotechnica Mech. 36 (1), 23–27. doi:10.2478/sgem-2014-0003
Eberhardt, E., Stead, D., Stimpson, B., and Read, R. S. (1998). Identifying crack initiation and propagation thresholds in brittle rock. Can. Geotech. J. 35 (2), 222–233. doi:10.1139/t97-091
Everitt, R. A., and Lajtai, E. Z. (2004). The influence of rock fabric on excavation damage in the Lac du Bonnett granite. Int. J. Rock Mech. Min. Sci. 41 (8), 1277–1303. doi:10.1016/j.ijrmms.2004.09.013
Lin, H., Yang, H., Wang, Y., Zhao, Y., and Cao, R. (2019). Determination of the stress field and crack initiation angle of an open flaw tip under uniaxial compression. Theor. Appl. Fract. Mech. 104, 102358. doi:10.1016/j.tafmec.2019.102358
Martin, C. D., and Chandler, N. A. (1994). The progressive fracture of Lac du Bonnet granite. Int. J. rock Mech. Min. Sci. geomechanics Abstr. 31 (6), 643–659.
Nicksiar, M., and Martin, C. D. (2012). Evaluation of methods for determining crack initiation in compression tests on low-porosity rocks. Rock Mech. Rock Eng. 45 (4), 607–617. doi:10.1007/s00603-012-0221-6
Peng, J., Cai, M., Rong, G., Zhou, C. B., and Zhao, X. G. (2015). Stresses for crack closure and its application to assessing stress-induced microcrack damage. Chin. J. Rock Mech. Eng. 34 (06), 1091–1100. (in Chinese)
Shi, C., Xu, W. Y., Liu, L., and Xu, A. Q. (2012). Microscopic modeling and mechanical properties of outwash deposits based on Otsu statistic of image gray [J]. Chin. J. Rock Mech. Eng. 31 (1), 2997–3005. (in Chinese)
Tang, M., Wang, G., Chen, S., and Yang, C. (2021). An objective crack initiation stress identification method for brittle rock under compression using a reference line. Rock Mech. Rock Eng. 54 (8), 4283–4298.
Wen, T., Tang, H., Ma, J., and Wang, Y. (2018). Evaluation of methods for determining crack initiation stress under compression. Eng. Geol. 235, 81–97. doi:10.1016/j.enggeo.2018.01.018
Xu, P., and Yang, S. Q. (2017). A fracture damage constitutive model for fissured rock mass and its experimental verification. Arab. J. Geosci. 10 (7), 164. doi:10.1007/s12517-017-2947-7
Xue, D. Y., and Chen, Y. Q. (2004). MATLAB with higher applied mathematics problem solving [M]. Beijing: Tsinghua University Press, 162–164. (in Chinese)
Yang, S. Q. (2016). Experimental study on deformation, peak strength and crack damage behavior of hollow sandstone under conventional triaxial compression. Eng. Geol. 213, 11–24. doi:10.1016/j.enggeo.2016.08.012
Zhang, X. P., Lv, G. G., Liu, Q. S., Wu, S. C., Zhang, Q., Ji, P. Q., et al. (2021). Identifying accurate crack initiation and propagation thresholds in siliceous siltstone and limestone. Rock Mech. Rock Eng. 54 (2), 973–980. doi:10.1007/s00603-020-02277-y
Zhao, X. G., Cai, M., Wang, J., and Ma, L. K. (2013). Damage stress and acoustic emission characteristics of the Beishan granite. Int. J. Rock Mech. Min. Sci. (64), 258–269. doi:10.1016/j.ijrmms.2013.09.003
Zhao, X. G., Cai, M., Li, P. F., and Ma, L. K. (2015). Objective determination of crack initiation stress of brittle rocks under compression using AE measurement. Rock Mechanics and Rock Engineering 48 (6), 2473–2484.
Zhao, Y., Liu, Q., Liao, J., Wang, Y., and Tang, L. (2020a). Theoretical and numerical models of rock wing crack subjected to hydraulic pressure and far-field stresses. Arab. J. Geosci. 13 (18), 926–1014. doi:10.1007/s12517-020-05957-9
Zhao, Y., Zhang, L., Liao, J., Wang, W., Liu, Q., and Tang, L. (2020b). Experimental study of fracture toughness and subcritical crack growth of three rocks under different environments. Int. J. Geomech. 20 (8), 04020128. doi:10.1061/(asce)gm.1943-5622.0001779
Zhao, Y., Zhang, L., Wang, W., Pu, C., Wan, W., and Tang, J. (2016). Cracking and stress–strain behavior of rock-like material containing two flaws under uniaxial compression. Rock Mech. Rock Eng. 49 (7), 2665–2687. doi:10.1007/s00603-016-0932-1
Keywords: stress characteristic value, crack closing stress, crack initiation stress, optimization, empirical value
Citation: Qiang Y, Liu G, Xia C, Li S, Li L, Zhao D, Zhou L and Cheng L (2023) Study on closing and cracking stress calculation method of fractured rock. Front. Earth Sci. 10:839304. doi: 10.3389/feart.2022.839304
Received: 20 December 2021; Accepted: 29 August 2022;
Published: 06 January 2023.
Edited by:
Yanlin Zhao, Hunan University of Science and Technology, ChinaReviewed by:
Fei Gong, China University of Petroleum, Beijing, ChinaDa Shuai, China University of Petroleum, Beijing, China
Copyright © 2023 Qiang, Liu, Xia, Li, Li, Zhao, Zhou and Cheng. This is an open-access article distributed under the terms of the Creative Commons Attribution License (CC BY). The use, distribution or reproduction in other forums is permitted, provided the original author(s) and the copyright owner(s) are credited and that the original publication in this journal is cited, in accordance with accepted academic practice. No use, distribution or reproduction is permitted which does not comply with these terms.
*Correspondence: Yue Qiang, cWlhbmd5dWUtMzIwQDE2My5jb20=