
94% of researchers rate our articles as excellent or good
Learn more about the work of our research integrity team to safeguard the quality of each article we publish.
Find out more
ORIGINAL RESEARCH article
Front. Earth Sci., 04 April 2022
Sec. Geohazards and Georisks
Volume 10 - 2022 | https://doi.org/10.3389/feart.2022.835851
This article is part of the Research TopicMultidisciplinary Loess Geohazard InvestigationsView all 23 articles
 Rong Wang1
 Yanrong Li1*
 Dongdong Lv1Weichao Zhao1Chaobo Zhang2Hauke Zachert3Gerald Eichhoff3
 Mary Antonette Beroya-Eitner3
Tensile strength is a key parameter governing tensile cracking and subsequent failure of soil or rock mass. Existing methods for measuring tensile strength are mainly designed for hard materials and come with inherent problems. As such, they are continuously being adapted and improved by the scientific community. In line with this effort, we recently developed two new tensile test methods for application to soil and weak rocks, namely, the inner hole fracturing test (IHFT) and horizontal compression test (HCT). In this study, we compared the performance of these newly developed methods and the three most commonly used approaches for tensile strength determination, namely, the uniaxial direct tensile test (UDTT), Brazilian test (BT) and three-point bending test (TPBT). Results show that IHFT and HCT exhibit distinct advantages over the three conventional methods when testing soil and weak rocks: first, IHFT and HCT can overcome the eccentric force problem that is a main challenge in UDTT and BT, and second, results obtained from these tests are highly reproducible and stable. Between IHFT and HCT, the latter is found more suitable for routine laboratory testing because of simpler and easier procedure, more stable and reliable results and uniform stress distribution within specimens.
Tensile strength refers to the capacity of a material to withstand forces applied in tension. It is therefore a key property influencing tensile cracking, which is known to remarkably change both the mechanical and hydraulic properties of geomaterials. The overall strength and bearing capacity of soil containing tension cracks have been found considerably less than those of intact soil (e.g., Morris et al., 1992; Lozada et al., 2015). Moreover, tension cracks can serve as preferred flow paths that can increase the hydraulic conductivity of soil and rocks, as well as increase weathering and erosion rates (Albrecht and Benson 2001). In slopes, failure is usually initiated by the development of cracks at crest area. In rocks and stiff soil like loess, these cracks may propagate vertically downwards up to several meters deep, leading to toppling and cracking–sliding failures (Li 2018). The latter causes an average of 100 deaths per year and considerable economic loss in the Loess Plateau of China (Li et al., 2018).
Compared to their compressive or shear strength, the tensile strength of soil and rocks is generally low. Because of this and the fact that there is no unity in the scientific community as to which testing method is most suitable or satisfactory (Coviello et al., 2005; Li et al., 2018), the tensile strength of these materials is usually assumed in conventional engineering practice to be equal to zero or insignificant (Kim et al., 2012; Li et al., 2014; Yin and Vanapilli 2018). However, such an assumption may lead to conservative and cost-ineffective design. In line with the global effort towards sustainability, therefore, there is a need to give more attention to understanding the tensile characteristics of soil and rocks and the development of methods for their reliable measurement.
Methods for measuring tensile strength are generally categorised as either direct or indirect. Direct test (e.g., uniaxial direct tensile test, UDTT), where the specimen is loaded to failure in tension, is straightforward and therefore the ideal and theoretically more meaningful method. Results obtained from direct tension test is fundamentally sound because the stress field developed within the specimen depends only on the applied load and boundary conditions, and not on specimen properties (Luong 1990). However, because of the high cost and difficulties in sample preparation and test operation, direct tension method is less used in laboratories (Li et al., 2020). By contrast, specimen preparation, experimental setup and data reduction are much simpler in indirect tensile tests. The majority of indirect tests aim to induce tensile failure by subjecting the specimen to compressive loading. However, stress–strain relationship and equal moduli in tension and compression must be assumed for usability of obtained values (Luong 1990). The complexity of integral stress distributions within the sample is also increased in these tests. Moreover, like direct tests, indirect tests may also be beset with operational problems. For instance, maintaining the applied force along the vertical diametrical plane of the specimen is an outstanding challenge in the Brazilian (BT) test. Problems in both tensile test methods become more serious when dealing with soil and weak rocks (Li et al., 2020).
As emerges clearly from the foregoing, both classes of tensile tests have important advantages and disadvantages, and in recent years, there have been efforts among the scientific community to improve them and address their limitations. As such, new methods have been developed not only for testing soil and rocks (e.g., Tamrakar et al., 2007; Li et al., 2020) but also other geomaterials like concrete (e.g., Sarfarazi et al., 2015; Haeri et al., 2016; Sarfarazi et al., 2018; Liao et al., 2020; Resan et al., 2020), the validity of which was investigated both experimental and numerically (e.g., Blümel 2000; Haeri and Sarfarazi 2016). However, most of these methods, in particular those developed for concrete, require complicated specimen shapes and therefore inapplicable to soil and weak rocks. In light of this, we recently developed new direct and indirect techniques for tensile strength determination of these materials, namely, the Inner Hole Fracturing Test (IHFT) and Horizontal Compression Test (HCT), respectively (Li et al., 2020; Guan et al., 2022). In this study, a detailed comparison of these new methods and the three most commonly used tensile tests, the UDTT, BT, and TPBT (Three Point Bending Test), was conducted. The performance of each method in terms of ease of sample preparation, complexity of test operation, and stability of test results was discussed. We deem that this study can provide engineering practice with valuable insights and guidance where tensile strength determination of soil and weak rocks is a need.
The soil used in the testing programme was a greyish yellow silt that belongs to Malan loess and obtained from Jinzhong, Shanxi Province, China. Block samples were collected from trial pits at a depth of 6 m. To minimize the effect of sample heterogeneity and therefore make the comparison among test methods more meaningful, remoulded soil specimens were used in this study. Specimens were prepared as follows. First, the soil was crushed, passed through a No. 10 sieve (2 mm) and dried at 105 C. Then, water was added to obtain an initial moisture content of 7.5%. Thereafter, the soil was statically compacted using a steel pressure cylinder and a universal testing machine. Compaction was done by one-time pressing because weak layered interfaces can easily form with the traditional layered compaction method and may affect the testing result (Hu et al., 2009). Lastly, the compacted sample was dried to constant mass at 60 C. Each tensile test method was carried out on seven soil specimens, each with the same basic physical properties (Table 1).

TABLE 1. Basic physical parameters of the tested samples.
Artificial gypsum–sand mixtures were additionally tested for performance comparison among IHFT, HCT and UDTT. Specimens were prepared at four different densities (1.57, 1.73, 1.77 and 1.82 g/cm3) by mixing predetermined proportions of gypsum, sand and water. Five specimens were constituted for each density. Like the remoulded soil samples, gypsum–sand specimens were statically compacted using one-time pressing method and then dried to constant mass.
Special devices and techniques were used to comply with specific specimen size and shape requirements of each test method (Figure 1). A rotation grooving device (Figure 2A) was used to create a 15 mm-wide section with reduced diameter (40 mm) in the middle portion of the specimen to prepare a dumbbell-shaped sample for UDTT. Cylindrical moulds of appropriate sizes were used to prepare specimens for BT and HCT. A cylindrical mould with a central rounded column fixed at the base was used for the annular specimen for IHFT (Figure 2B). Lastly, the rectangular specimen for TPBT was prepared using a soil beam mould (Figure 2C).
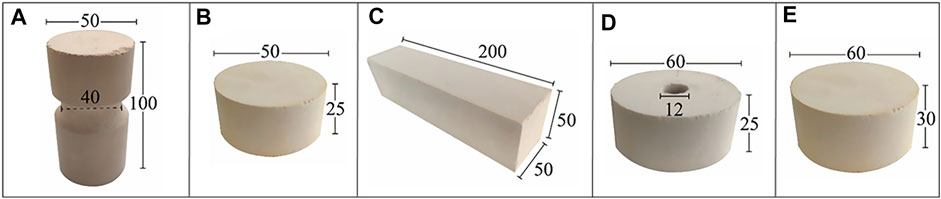
FIGURE 1. Shapes and size requirements of specimens used in each test method (A) dumbbell, (B) solid disk, (C) cuboid, (D) hollow disk, and (E) solid disk, for UDTT, BT, TPBT, IHFT, and HCT, respectively. All dimensions are in mm.
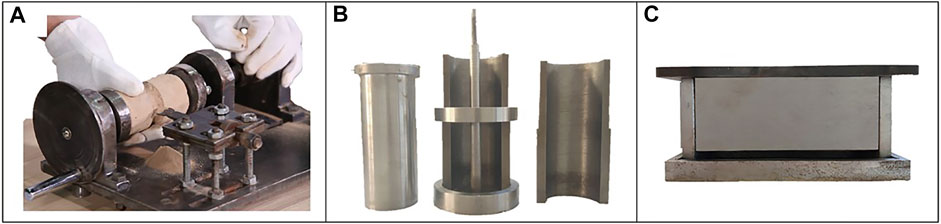
FIGURE 2. Devices for specimen preparation (A) rotation grooving device (Li et al., 2020) (B) annular specimen mold (Li et al., 2020), and (C) soil beam mold.
As mentioned earlier, the UDTT, where the specimen is uniaxially loaded to failure in tension, is theoretically the ideal method for tensile strength determination. The test in this study was carried out according to the procedure suggested by the International Society for Rock Mechanics (ISRM 1978). Specimen ends were gripped using a metal holder (Figure 3A), leaving a free length of 33 mm in the middle section of the specimen. The holder was tightened with screws, the entire setup was attached to the universal testing machine (Figure 3B) and the tension load was applied at a constant displacement rate. This configuration ensured that the fracture occurred in the cross section through the middle of the grooved region. The stress state on the central cross-sectional plane of the specimen is assumed truly uniaxial and uniform (Figure 4A). Hence, tensile strength (σt in kPa) is the ratio between the rupture force and the central cross-sectional area of the specimen; σt and average strain (εt) can be expressed as follows:
where P is the maximum applied load in N, A is the original cross-sectional area of the crack plane in mm2, δ is the measured displacement in mm and Hf is the free length of the specimen in mm.
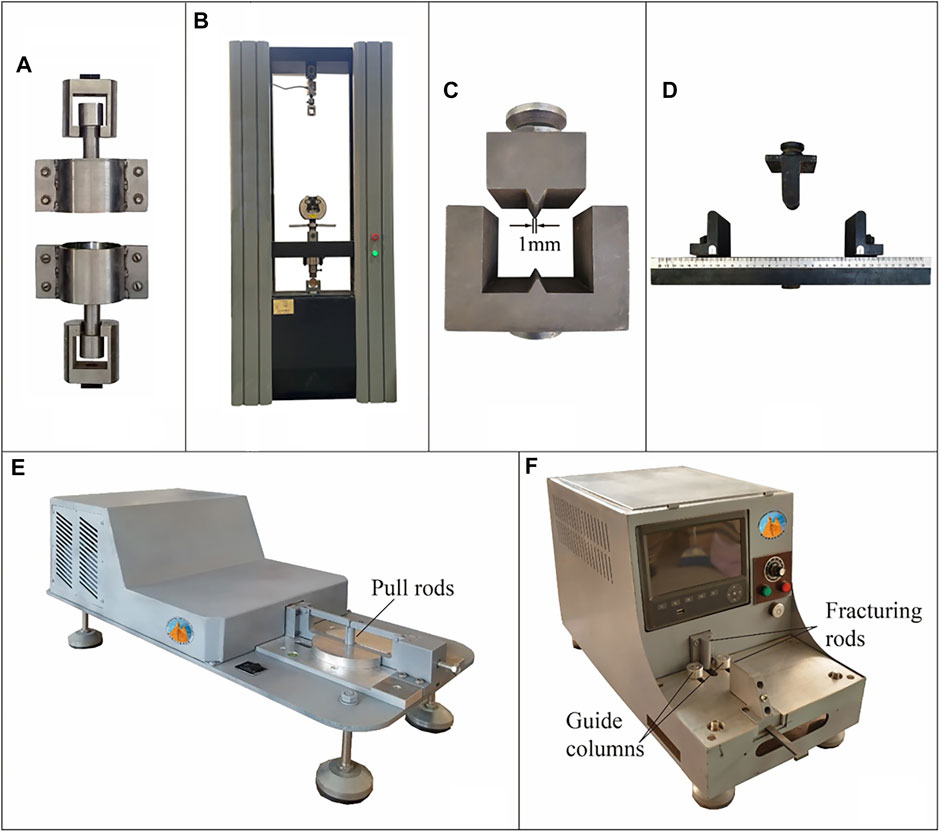
FIGURE 3. Testing apparatuses and auxiliaries (A) metal holder (rigid sleeves) for UDTT, (B) universal testing machine, (C) narrow linear jaws for BT, (D) supporting and loading anvils for TPBT, (E) IHFT apparatus (Li et al., 2020), and (F) HCT apparatus (Guan et al., 2022).
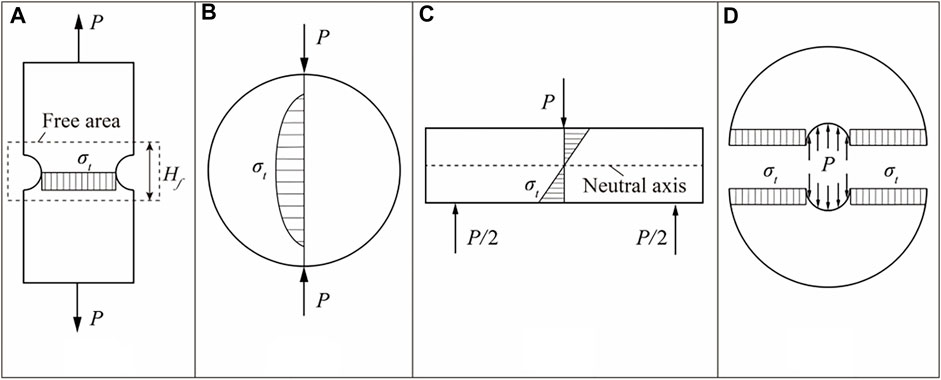
FIGURE 4. Mechanical and kinematics models for (A) UDTT, (B) BT and HCT, (C) TPBT, and (D) IHFT.
Although the validity of BT has been controversial for decades, it remains the most widely used among the indirect tensile tests. BT was conducted in this study using a Chinese standard V-shaped loading strip (GB 2010) attached to the universal testing machine. The disk-shaped specimen was mounted between the upper and lower jaws (Figure 3C), ensuring that it does not touch the side walls of the lower jaw, and then subjected to diametrical compression. The compression induces tensile stresses normal to the vertical diameter and these stresses are assumed constant over a region around the centre (Figure 4B). The following are further assumed: the material is homogeneous, isotropic and linearly elastic before brittle failure (Mellor and Hawkes 1971) and failure occurs at the centre of the disk where the tensile stress is maximum (Li and Wong 2013). The maximum tensile strain of the specimen can be obtained from the measured compressive deformation and Poisson’s ratio. The tensile strength (σt in kPa) and corresponding critical tensile strain (εt) are expressed as follows (ISRM 1978):
where P is the force at failure in N, d and t are the diameter and the thickness of the specimen in mm, respectively, δ is the compressive strain (equal to
Flexure or bending tests are commonly used in many branches of civil engineering. In materials engineering, they are used for concrete and hard rock testing (Murray et al., 2019). The two most common flexure tests are the three-point and four-point bending tests. We used the former in this study. TPBT was performed on the universal testing machine using the fixture shown in Figure 3D. A rectangular soil beam was placed on two support anvils and a concentrated downward force was applied to failure at midspan through the loading anvil. As the beam is bent, tensile and compressive stresses are respectively produced in the convex (outer) and concave (inner) sides of the specimen (Murray et al., 2019). Figure 4C shows the expected stress distribution over the cross section of a beam, where compressive stresses act above the neutral axis whilst tensile stresses act below it. The tensile strength (σt in kPa) and the corresponding critical tensile strain (εt) at the point of maximum tensile stress (i.e., at the bottom and outermost fibre of the specimen) can be expressed as follows (ASTM 2010):
where P is the force at failure in N, l is the span length or the distance between the two lower supports in mm, b and t are the width and thickness of the specimen in mm, respectively, and δ is the maximum deflection of the center of the beam in mm.
IHFT is the direct tensile test we developed as an alternative to UDTT (Li et al., 2020). Figure 3E shows the IHFT apparatus, of which the most important feature is the drawbar device consisting of movable and fixed pull seats. Pull seats with a half pull rod are joined to form a full cylindrical rod whose diameter is equal to the inner hole diameter of the annular specimen. The specimen was mounted on the base by letting the full cylindrical rod slip through the specimen inner hole. The left moveable pull seat was driven by a motor during loading to pull the specimen laterally apart through the half pull rod until the specimen fails. Assuming that the central diametrical plane perpendicular to the loading direction is the plane of maximum tension and the state of stress on that plane is purely tensional and generally uniaxial in the loading direction (Figure 4D), the tensile strength can be equated to the average tensile stress at failure on the said plane and calculated using the following equation:
where σt is the tensile strength in kPa, P is the measured peak tension force in N, Do and Di are outer and inner diameters of the specimen in mm, respectively, and T is the specimen thickness in mm.
The validity of the above assumptions and equation was confirmed through computational stress analysis (Li et al., 2020). The average tensile strain is simply obtained using the displacement of the active pull seat divided by the diameter of the specimen’s inner hole.
HCT, the indirect tensile test we developed is basically a modification of BT that operates in the same principle as BT (Guan et al., 2022). Unlike BT, where the specimen is mounted vertically between loading jaws, the HCT specimen is mounted horizontally. Compression is carried out via the active and stationary fracturing rods in the HCT apparatus (Figure 3F). The specimen was seated between these rods, then the active fracturing rod moved towards the stationary fracturing rod upon loading until the specimen failed. The compression test apparatus is equipped with a specimen positioning frame fitted with an operating arm and two guide columns to ensure that the active fracturing rod, stationary fracturing rod and centre axis of the specimen are aligned in the same vertical plane. Hence, the main advantage of HCT is that the direction of the force strictly passes through the centre of the specimen. By comparison, ensuring that the vertical load passes through the centre plane of a vertically placed circular disk specimen in BT is difficult. Both HCT and BT use Eqs 3, 4 to calculate the tensile strength and strain, respectively, although the compressive strain in the HCT is derived from the measured horizontal displacement instead of the vertical displacement.
A constant displacement rate of 0.1 mm/min was applied for all the above five types of tests. A high-speed camera (1280 × 1024 pixels) with a filming rate of 1000 frames per second was used to record the entire loading process.
Finite element analyses were conducted using ABAQUS/Standard 2019 to obtain new insights into the stress distribution of the specimen for each test method and setup. A 2D planar model was utilised with plane stress elements for BT, TPBT, HCT and IHFT. A 2D axisymmetric model was used with axisymmetric stress elements for UDTT. The soil was modelled as a linearly elastic material with the following elastic constants: Young’s modulus = 15,000 kPa and Poisson’s ratio = 0.23. Loading jaws and supports were modelled as rigid bodies. A friction coefficient of 0.1 was applied between the soil and these jaws and supports. Model data are presented in Table 2. For comparability, all simulations were performed in such a way that the maximum amount of tensile stress is approximately 0.025 N/mm2.

TABLE 2. Model data for the numerical stress analysis.
The typical failure mode for each test is shown in Figure 5. Cracking was initiated at peak stress, and failure usually occurred within 0.01 s for UDTT and IHFT. On the other hand, cracking began before the peak stress was reached for the three other tests. Cracks developed in the middle part of the grooved section in UDTT (Figure 5A). Cracks in BT initiated in the middle and upper parts of the specimens, then gradually extended to the entire central diameter (Figure 5B). Cracking in TPBT began in the middle-bottom part of the soil beam and extended upward with increased loading force but failed to penetrate the entire thickness of the specimen even after reaching the peak stress (Figure 5C). In IHFT, cracks closer to the inner hole are clearer and wider, indicating that cracking began in this inner region and then propagated outward (Figure 5D). Cracks in HCT developed instantaneously along the diameter of the specimen (Figure 5E).
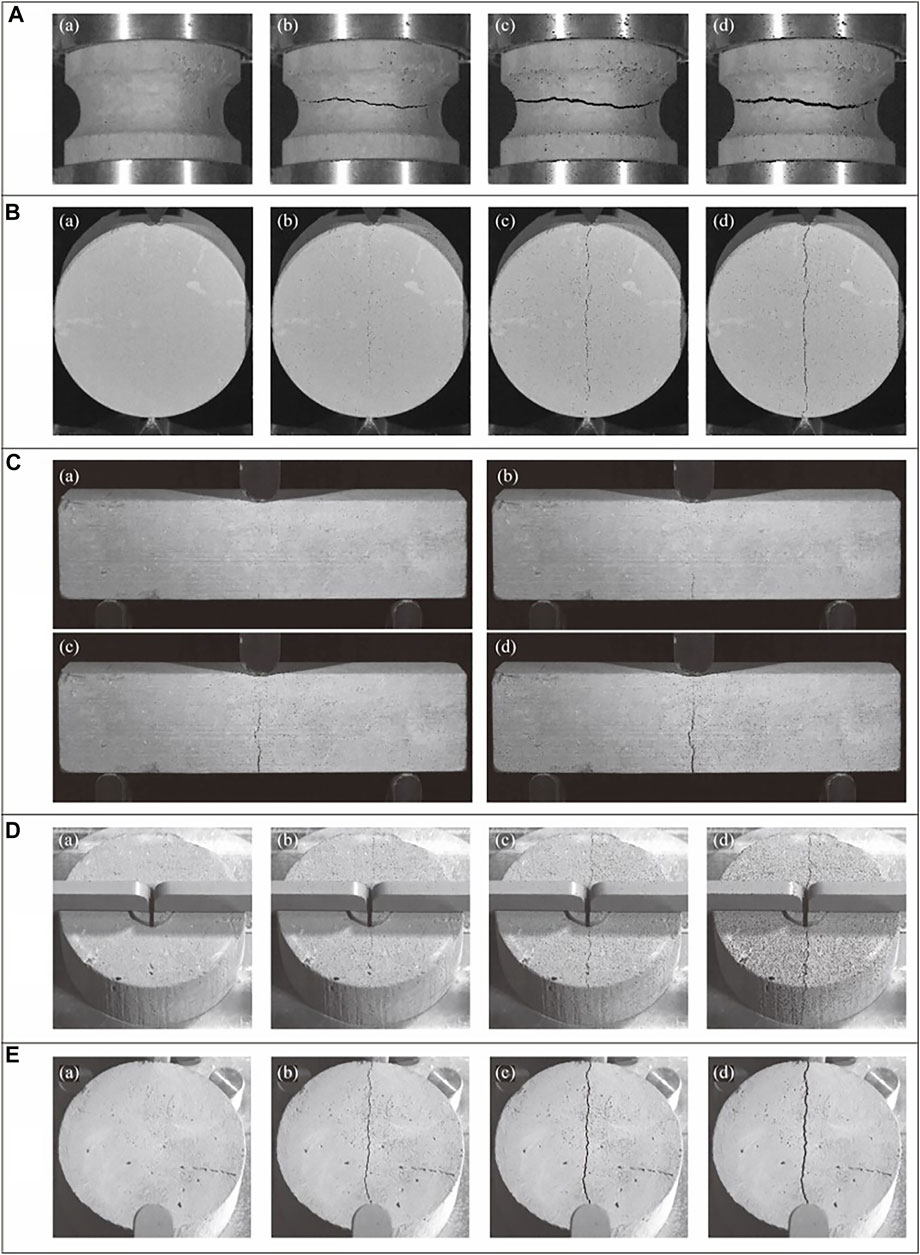
FIGURE 5. Typical failure modes in different test methods (A) UDTT, (B) BT, (C) TPBT, (D) IHFT, and (E) HCT.
Figure 6 presents the typical stress–strain curve for each test method. All curves displayed a similar trend of increased tensile stress with increased strain until the peak stress is reached, after which stress rapidly dropped to zero. The stress–strain relationship is nearly linear in UDTT, BT and HCT. A large strain developed before the occurrence of failure in UDTT, but all curves clearly indicate the brittle nature of the tensile failure. Figure 7 shows comparison of tensile strengths obtained from each test. TPBT obtained the highest value, followed by UDTT, BT, HCT and IHFT.
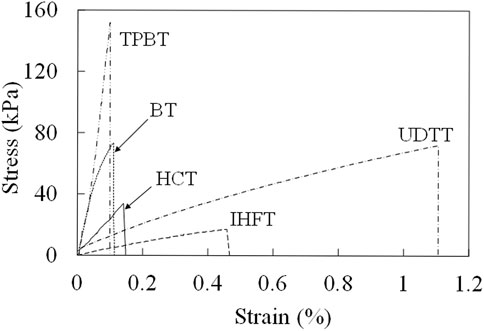
FIGURE 6. Typical stress–strain curves from different test methods. Data sources for BT, HCT and UDTT are from Guan et al. (2022).
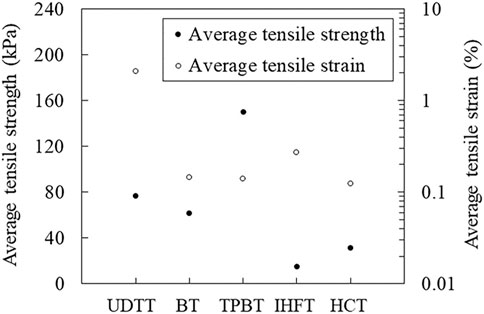
FIGURE 7. Average tensile strengths and stains obtained from different test methods.
The difference in the stress–strain relationship and strength values obtained was a result of the interplay of a number of factors. Basic among these factors is the difference through which tensile failure is achieved (i.e., direct tension, compression and bending moment) and in assumptions each test takes. For instance, although strain is calculated directly in UDTT and IHFT, it has to be estimated from the displacement along the loading direction perpendicular to the tensile direction in the other tests. Hence, some test method particularities may considerably affect the obtained values. For example, the tensile fracture may be shorter than the specimen diameter d in BT due to loading jaw penetration into the specimen, leading to underestimation of tensile stress and critical strain by Eqs 3, 4.
Although the UDTT and IHFT curves generally have the same shape, the peak stress and corresponding strain are greater in the former. A reason for this could be the specimen–fixture connection problem that is commonly encountered in UDTT. Relative vertical slippage between the fixture and the specimen can be observed from comparison of UDTT specimen images at pre-loading and pre-failure. The frictional force generated during the slip may be responsible for the large strength and deformation obtained from the test relative to those from IHFT and other tests (except the significantly larger tensile strength obtained from TPBT). Meanwhile, the stress concentration that evidently developed along both sides of the inner ring where the cylindrical loading rod separated likely caused premature cracking in these areas and led to a small tensile strength value in IHFT.
BT and HCT curves generally demonstrate the same shape (Figure 6), although the latter curve indicates lower stiffness, which may be due to the compressive deformation in the contact region between the fracturing rods and the specimen. The area under the HCT curve is smaller, indicating that the HCT specimen behaves in a more ductile manner compared with the BT specimen. Enhanced distributed loading caused by the circular jaws in HCT and the frictional force that may have actually developed at the bottom of the HCT specimen despite the smooth design of the base of the apparatus are possible reasons for this ductile behaviour. Friction has been shown to induce ductile behaviour in composite materials (Bacarreza et al., 2017).
TPBT gave remarkably larger tensile strength values (on average greater than 100%) than the other tests. This is consistent with the findings of other workers that point bending tests (i.e. both four-point and three-point bending tests) can overestimate the tensile strength of geomaterials by as much as 100% (Biolzi et al., 2001; Coviello et al., 2005; Mardalizad et al., 2017). Various explanations have been proposed for this overestimation. For instance, Jaeger et al. (2009) attributed it to the tests’ assumption of a linear stress–strain relationship throughout the critical cross section of the specimen. This may not be the main reason, however, because the other tests have the same assumption. On the basis of numerical simulation results, Namikawa and Koseki (2007) indicated that overestimation is caused by the redistribution of stresses induced by the strain-softening behaviour on the tensile side. The friction at the loading and support contacts may have also contributed to the large strength values obtained in TPBT. Fricker (1989) considered only the friction on the two fixed supports and showed that this friction can lead to a strength overestimation of approximately 5% for a prismatic square bar alumina specimen subjected to TPBT.
Tensile strength and critical tensile strain values obtained from each test and corresponding coefficient of variation (CV) are plotted in Figures 8, 9, respectively. Tests are ordered in terms of increasing CV of strength as follows: HCT, IHFT, BT, TPBT and UDTT. The same order is observed in terms of increasing CV of strain. Therefore, the two newly developed tensile test methods obtained the most stable results, with HCT clearly showing superiority over the other investigated methods. The low dispersion of results in HCT and IHFT may be ascribed to the simplicity and high reproducibility of sample preparation and test operation. The UDTT results show the most instability and least reproducibility, which is expected given the complicated test setup, the perturbation in the uniaxial stress field introduced by even slight imperfections in specimen grips and the test’s low tolerance to sample imperfections/inhomogeneity.
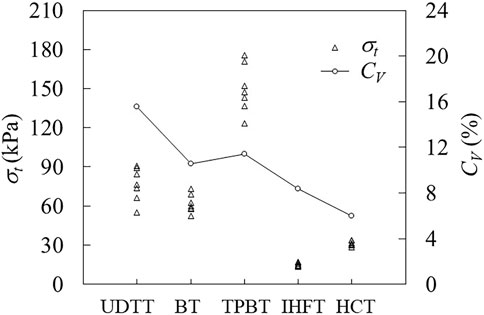
FIGURE 8. Measured tensile strengths (σt) and coefficients of variation (CV) in different test methods. CV presents ratio of standard deviation to mean. Data sources for BT, HCT and UDTT are from Guan et al. (2022).
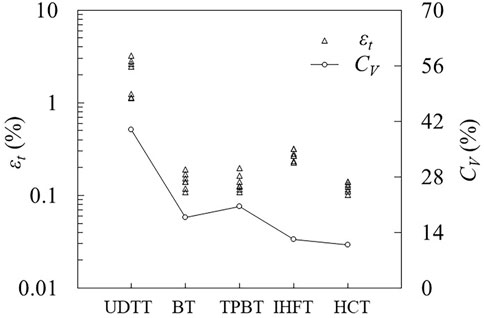
FIGURE 9. Tensile strains (εt) at failure and coefficients of variation (CV) in different test methods.
Despite the many limitations of the direct tensile test, it remains the basic test against which other methods are compared due to its theoretical robustness. Thus, we additionally compared the performance of the two newly developed tests against UDTT under a more controlled experiment. We used artificial gypsum–sand specimens to further minimise sample inhomogeneity. Figure 10 shows the plot of average tensile strength values obtained with IHFT and HCT against those obtained with UDTT for the four dry densities considered, as well as the corresponding fitted lines. Fitted lines for both tests are nearly parallel to the identity line (1:1 line), with that for HCT closer to the said line. Both IHFT and HCT produce relatively lower strength values than UDTT although HCT values are closer to UDTT values. Correlation coefficients are very high for IHFT and HCT at 0.97 and 0.99, respectively.
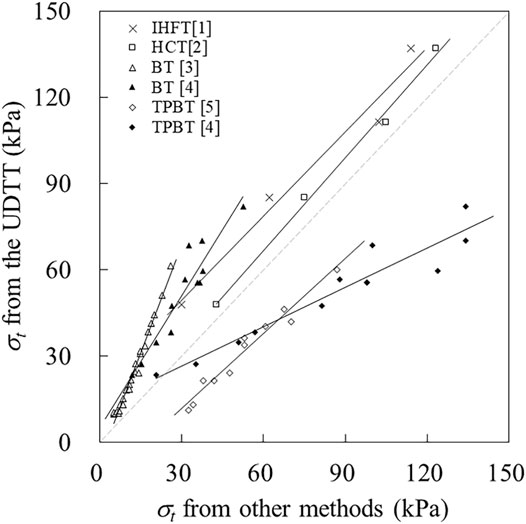
FIGURE 10. Tensile strengths (σt) obtained from the UDTT vs. those obtained from other test methods. Data sources: [1] Li et al., 2020, [2] Guan et al., 2022, [3] Wang 2011, [4] Li et al., 2007, and [5] Zhu 2005.
Data from other workers were included in Figure 10 to further compare the strength values from the direct tensile test with those obtained from other indirect test methods (Zhu 2005; Li et al., 2007; Wang 2011). All corresponding fitted lines deviate from the identity line to a larger degree than those of the IHFT and HCT, thereby indicating better performance of the proposed methods.
Figure 11 presents the numerical simulation results. Although the tensile stress is maximum in the central grooved section of the specimen in UDTT as expected, the assumption of uniformity (Figure 4A) does not hold since stress concentration is observed along the middle margin of the groove. Nonuniformity in the distribution of stresses is also observed along the central diametrical part perpendicular to the loading direction in IHFT. Stress concentration at the periphery of the inner hole is confirmed, explaining the initiation of failure in this area. However, Li et al. (2020) demonstrated that this phenomenon occurs only at the beginning of loading. Stresses become evenly distributed at the failure point (corresponding to the peak load). The average stress at this point can be approximated using Eq. 7.
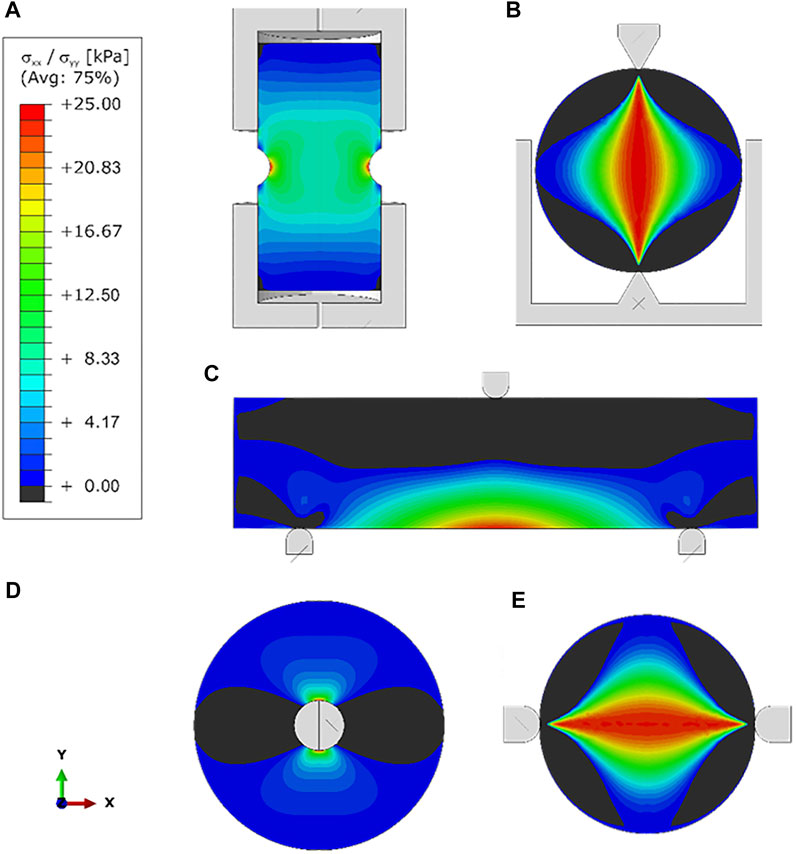
FIGURE 11. Stress distribution of samples in different test methods (A) UDTT, (B) BT, (C) TPBT, (D) IHFT, and (E) HCT.
Stress distribution in BT and HCT is generally the same and consistent with assumptions (Figure 4B) despite the difference in loading jaw shapes. However, the compressive stress that developed in areas adjacent to jaws is higher in BT than that in HCT. This is likely due to the more concentrated loading in BT, which may explain the observed penetration into the soil of jaws in this method. Stress distribution in TPBT is consistent with expectations (Figure 4C).
Although the test procedure in UDTT is intuitive and the interpretation of results is straightforward, sample preparation and actual test operation are complicated. Thus, the test results demonstrate poor repeatability. A main challenge in UDTT is the gripping of specimen ends for uniform transfer of tension load. Commonly used load transfer methods include adhesive bonding, anchoring/clamping and friction grip, each of which presents particular challenges. Zhang and Lu (2018) noted that stress concentration on specimen interfaces is unavoidable with clamping connection or adhesive bonding. Al-Hussaini and Townsend (1974) indicated that the difference in the physical properties of the adhesive and the specimen causes uneven deformation and eventual failure at the interface of these materials. Friction grip, which utilises the friction between the grip fixture and the specimen to transfer load, was used in this study. In addition, specimens were shaped into a dumbbell to reduce stress concentration on specimen interfaces. However, the simultaneous occurrence of grip slippage and breakage in the theoretical failure surface must have generated eccentric force and affected the results.
Among the indirect tests that have been developed as an alternative to UDTT, BT is the most commonly used due to the simplicity of sample preparation and testing procedure. This is reflected in the Cv of BT-obtained tensile strength values, which is the lowest among the Cv of the three conventional methods. However, cracking may occur away from the theoretical location (i.e. at the centre of the specimen where the maximum tensile stress is supposedly located). For instance, cracking occurred in the upper part of the specimen near the loading jaw in this study. The load at the lower contact point is also high due to the self-weight of the specimen. Lastly, another main challenge in BT is the difficulty in maintaining the applied force along the vertical diametrical plane of the specimen throughout the test and minimising the appearance of eccentric force.
The TPBT device and test procedure are likewise simple and easy to operate. However, this study confirmed the observations of many workers that the test yields unusually high values, and therefore not a recommended method for tensile strength determination.
The two newly developed methods IHFT and HCT present advantages over the three conventional methods in that sample preparation, operation procedure and test setup are even simpler. Hence, the obtained tensile strength and strain values are very stable. The strength values are consistent in trend and strongly correlated with those obtained with UDTT, implying their validity. Moreover, these tensile strength values are lower than those from UDTT, and therefore are on the safer side. The equipment for both IHFT and HCT are designed such that the force is strictly applied through the central diametrical plane to minimise the appearance of eccentric force, which is a main problem in both the UDTT and BT.
However, HCT shows a clear edge over IHFT not only in terms of simplicity of test operation but also stability and reliability of test results. At least for stiff material like the ones tested in this study, crack initiation and propagation occurred instantaneously in HCT. In contrast, tensile stress is greatest near the inner hole in IHFT; as such, cracking starts in this inner region and then propagates outward. Stress distribution in the specimen is more uniform in HCT than that in IHFT. Furthermore, where intact specimen needs to be tested, preparation of the annular specimen for IHFT presents some challenges because a hole must be drilled exactly at the centre of the specimen disk.
Tensile strength is a key parameter determining the stability of geomaterials and the structures. A reliable measurement of tensile strength is of fundamental importance in geo-engineering. Existing tensile test methods come with inherent problems, which become even more serious when testing soil and weak rocks particularly since most of these methods were designed for hard material (e.g., concrete and steel). A main challenge for instance arises in specimen preparation due to the soft and brittle nature of soil and weak rocks. In light of this, we recently developed two new tensile test methods for use with the said materials. In this study, the performance of these new methods and three of the most commonly used tensile test methods was examined and compared. The results highlighted the distinct advantages of IHFT and HCT over conventional methods (UDTT, BT and TPBT): 1) sample preparation, test setup and operation procedures are easier, more convenient and flexible in IHFT and HCT; 2) IHFT and HCT minimize test errors as they can avoid the eccentric force problem, which is a main challenge in UDTT and BT; and 3) IHFT and HCT can give highly reproducible and stable tensile strength and strain values. Meanwhile, between IHFT and HCT, the latter is found more suitable for routine testing of soil and weak rocks because of the less disturbance it induces in the specimen during preparation, more uniform stress distribution in specimen, and more stable and repeatable results.
The original contributions presented in the study are included in the article/Supplementary Material, further inquiries can be directed to the corresponding author.
YL conceived and designed the project. YL, RW, DL and WZ carried out the laboratory tests. RW, YL, CZ and MB-E jointly interpreted the data. HZ, GE and MB-E. conduced the numerical simulation. RW, YL and MB-E wrote the paper.
This study was supported by the National Natural Science Foundation of China (No. 41877276), Key Program of National Natural Science Foundation of China (No. 41630640), and Major Program of the National Natural Science Foundation of China (No. 41790445).
The authors declare that the research was conducted in the absence of any commercial or financial relationships that could be construed as a potential conflict of interest.
All claims expressed in this article are solely those of the authors and do not necessarily represent those of their affiliated organizations, or those of the publisher, the editors and the reviewers. Any product that may be evaluated in this article, or claim that may be made by its manufacturer, is not guaranteed or endorsed by the publisher.
Al-Hussaini, M. M., and Townsend, F. C. (1974). Tensile Testing of Soils. International Journal of Rock Mechanics and Mining Sciences & Geomechanics Abstracts. Int. J. Rock Mech. Min. Sci. Geomech. Abstr. 11, 199. doi:10.1016/0148-9062(74)91141-3
Albrecht, B. A., and Benson, C. H. (2001). Effect of Desiccation on Compacted Natural Clays. J. Geotech. Geoenviron. Eng. 127, 67–75. doi:10.1061/(ASCE)1090-0241
ASTM D790-10 (2010). Standard Test Methods for Flexural Properties of Unreinforced and Reinforced Plastics and Electrical Insulating Materials. West Conshohocken, PA: United States. 19428-2959. doi:10.1520/D0790-10
Bacarreza, O., Maidl, S., Robinson, P., and Shaffer, M. S. P. (2017). “Exploring the Use of Friction to Introduce Ductility in Composites,” in Proceedings of the 21st International Conference on Composite Materials (Xi’an), 20–25.
Biolzi, L., Cattaneo, S., and Rosati, G. (2001). Flexural/Tensile Strength Ratio in Rock-like Materials. Rock Mech. Rock Eng. 34, 217–233. doi:10.1007/s006030170010
Blümel, M. (2000). “Improved Procedures for Laboratory Testing,” in Proceedings Of the EUROCK 2000 Symposium (Essen, Germany: Verlag Glückauf Press), 573–578.
Coviello, A., Lagioia, R., and Nova, R. (2005). On the Measurement of the Tensile Strength of Soft Rocks. Rock Mech. Rock Engng. 38, 251–273. doi:10.1007/s00603-005-0054-7
Fricker, D. C. (1989). Contact Friction Effects in Flexural Strength Tests of Alumina for Orthopaedic Implants. Manchester: Manchester University Press.
GB, T. (2010). Methods for Determining the Physical and Mechanical Properties of Coal and Rock-Part 10: Methods for Determining Tensile Strength of Coal and Rock. Beijing: Standards Press of China, 2356110.
Guan, F. F., Li, Y. R., Gao, G. H., Beroya-Eitner, M. A., and Zachert, H. (2022). Horizontal Compression Test: a Proposed New Method for Indirect Determination of Tensile Strength of Stiff Soils and Soft Rocks. Front. Earth Sci. doi:10.3389/feart.2022.839073
Haeri, H., Sarfarazi, V., and Hedayat, A. (2016). Suggesting a New Testing Device for Determination of Tensile Strength of concrete. Struct. Eng. Mech. 60, 939–952. doi:10.12989/SEM.2016.60.6.939
Haeri, H., and Sarfarazi, V. (2016). Numerical Simulation of Tensile Failure of concrete Using Particle Flow Code (PFC). Comput. Concrete 18, 39–51. doi:10.12989/CAC.2016.18.1.039
Hsieh, P. A., Cook, N. G. W., and Zimmerman, R. W. (2009). Fundamentals of Rock Mechanics. Geofluids 9, 251–252. doi:10.1111/j.1468-8123.2009.00251.x
Hu, H. J., Jiang, M. J., Zhao, T., Peng, J. B., and Li, H. (2009). Effects of Specimen-Preparing Methods on Tensile Strength of Remolded loess. Rock Soil Mech. 30 (Suppl. 2), 196–199.
ISRM (1978). Suggested Methods for Determining Tensile Strength of Rock Materials. Int. J. Rock Mech. Min. Sci. Geomech. Abstr. 15, 99–103. doi:10.1016/0148-9062(78)90003-7
Kim, T.-H., Kim, T.-H., Kang, G.-C., and Ge, L. (2012). Factors Influencing Crack-Induced Tensile Strength of Compacted Soil. J. Mater. Civ. Eng. 24, 315–320. doi:10.1061/%28ASCE%29MT.1943-5533.0000380
Li, D., and Wong, L. N. Y. (2013). The Brazilian Disc Test for Rock Mechanics Applications: Review and New Insights. Rock Mech. Rock Eng. 46, 269–287. doi:10.1007/s00603-012-0257-7
Li, J., Tang, C., WangPei, D. X., Pei, X., and Shi, B. (2014). Effect of Discrete Fibre Reinforcement on Soil Tensile Strength. J. Rock Mech. Geotechnical Eng. 6, 133–137. doi:10.1016/j.jrmge.2014.01.003
Li, J. Y., He, C. R., and Tang, H. (2007). The Comparative Study on the Tensile Strength Test of Soft clay. Subgrade Eng. 2, 104–105. doi:10.3969/j.issn.1003-8825.2007.02.045
Li, Y. (2018). A Review of Shear and Tensile Strengths of the Malan Loess in China. Eng. Geology. 236, 4–10. doi:10.1016/j.enggeo.2017.02.023
Li, Y., Guan, F., Su, H., Aydin, A., Beroya-Eitner, M. A., and Zachert, H. (2020). A New Direct Tension Test Method for Soils and Soft Rocks. Geotech. Test. J. 43, 20190308. doi:10.1520/GTJ20190308
Li, Y., Mao, J., Xiang, X., and Mo, P. (2018). Factors Influencing Development of Cracking-Sliding Failures of Loess across the Eastern Huangtu Plateau of China. Nat. Hazards Earth Syst. Sci. 18, 1223–1231. doi:10.5194/nhess-18-1223-2018
Liao, W.-C., Chen, P.-S., Hung, C.-W., and Wagh, S. K. (2020). An Innovative Test Method for Tensile Strength of Concrete by Applying the Strut-And-Tie Methodology. Materials 13, 2776. doi:10.3390/ma13122776
Lozada, C., Caicedo, B., and Thorel, L. (2015). Effects of Cracks and Desiccation on the Bearing Capacity of Soil Deposits. Géotechnique Lett. 5, 112–117. doi:10.1680/jgele.15.00021
Mardalizad, A., Manes, A., and Giglio, M. (2017). The Numerical Modelling of a Middle Strength Rock Material under Flexural Test by Finite Element Method-Coupled To-SPH. Proced. Struct. Integrity 3, 395–401. doi:10.1016/j.prostr.2017.04.050
Mellor, M., and Hawkes, I. (1971). Measurement of Tensile Strength by Diametral Compression of Discs and Annuli. Eng. Geology. 5, 173–225. doi:10.1016/0013-7952(71)90001-9
Minh Phong Luong, M. P. (1990). Tensile and Shear Strengths of concrete and Rock. Eng. Fracture Mech. 35, 127–135. doi:10.1016/0013-7944(90)90190-R
Morris, P. H., Graham, J., and Williams, D. J. (1992). Cracking in Drying Soils. Can. Geotech. J. 29, 263–277. doi:10.1139/t92-030
Murray, I., Tarantino, A., and Francescon, F. (2019). A Tensile Strength Apparatus with the Facility to Monitor Negative Pore-Water Pressure. Geotech. Test. J. 42, 20170354. doi:10.1520/GTJ20170354
Namikawa, T., and Koseki, J. (2007). Evaluation of Tensile Strength of Cement-Treated Sand Based on Several Types of Laboratory Tests. Soils and Foundations 47, 657–674. doi:10.3208/sandf.47.657
Resan, S. a. F., Chassib, S. M., Zemam, S. K., and Madhi, M. J. (2020). New Approach of concrete Tensile Strength Test. Case Stud. Construction Mater. 12, e00347. doi:10.1016/j.cscm.2020.e00347
Sarfarazi, V., Faridi, H. R., Haeri, H., and Schubert, W. (2015). A New Approach for Measurement of Anisotropic Tensile Strength of concrete. Adv. concrete construction 3, 269–282. doi:10.12989/acc.2015.3.4.269
Sarfarazi, V., Haeri, H., Ebneabbasi, P., Bagher Shemirani, A., and Hedayat, A. (2018). Determination of Tensile Strength of concrete Using a Novel Apparatus. Construction Building Mater. 166, 817–832. doi:10.1016/j.conbuildmat.2018.01.157
Tamrakar, S. b., Mitachi, T., and Toyosawa, Y. (2007). Measurement of Soil Tensile Strength and Factors Affecting its Measurements. Soils and Foundations 47 (5), 911–918. doi:10.3208/sandf.47.911
Wang, H. M. (2011). Experimental Research on Tensile Behaviors of Cohesive Soil. Nanjing, China: Nanjing University. [master’s thesis].
Yin, P., and Vanapalli, S. K. (2018). Model for Predicting Tensile Strength of Unsaturated Cohesionless Soils. Can. Geotech. J. 55, 1313–1333. doi:10.1139/cgj-2017-0376
Zhang, S., and Lu, Y. (2018). Experimental and Numerical Investigation on the Dumbbell-Shaped Specimen of concrete-like Materials under Tension. Lat. Am. J. Solids Struct. 15, e93. doi:10.1590/1679-78254632
Keywords: tensile strength, test methods, test apparatus, soil and weak rock, comparison
Citation: Wang R, Li Y, Lv D, Zhao W, Zhang C, Zachert H, Eichhoff G and Beroya-Eitner MA (2022) Comparison of Test Methods for Determining the Tensile Strength of Soil and Weak Rocks. Front. Earth Sci. 10:835851. doi: 10.3389/feart.2022.835851
Received: 15 December 2021; Accepted: 21 February 2022;
Published: 04 April 2022.
Edited by:
Fanyu Zhang, Lanzhou University, ChinaReviewed by:
Hadi Haeri, Islamic Azad University System, IranCopyright © 2022 Wang, Li, Lv, Zhao, Zhang, Zachert, Eichhoff and Beroya-Eitner. This is an open-access article distributed under the terms of the Creative Commons Attribution License (CC BY). The use, distribution or reproduction in other forums is permitted, provided the original author(s) and the copyright owner(s) are credited and that the original publication in this journal is cited, in accordance with accepted academic practice. No use, distribution or reproduction is permitted which does not comply with these terms.
*Correspondence: Yanrong Li, bGkuZGVubmlzQGhvdG1haWwuY29t
Disclaimer: All claims expressed in this article are solely those of the authors and do not necessarily represent those of their affiliated organizations, or those of the publisher, the editors and the reviewers. Any product that may be evaluated in this article or claim that may be made by its manufacturer is not guaranteed or endorsed by the publisher.
Research integrity at Frontiers
Learn more about the work of our research integrity team to safeguard the quality of each article we publish.