 Yuexin Zheng
 Jingshan Yu
 Yang Xu
95% of researchers rate our articles as excellent or good
Learn more about the work of our research integrity team to safeguard the quality of each article we publish.
Find out more
ORIGINAL RESEARCH article
Front. Earth Sci. , 09 March 2022
Sec. Atmospheric Science
Volume 10 - 2022 | https://doi.org/10.3389/feart.2022.835142
This article is part of the Research Topic Advances in Drought Analytical Tools for Better Understanding of Current and Future Climate Change View all 11 articles
With the intensification of climate change, the coupling effect between climate variables plays an important role in meteorological drought identification. However, little is known about the contribution of climate variables to drought development. This study constructed four scenarios using the random forest model during 1981–2016 in the Luanhe River Basin (LRB) and quantitatively revealed the contribution of climate variables (precipitation; temperature; wind speed; solar radiation; relative humidity; and evaporative demand) to drought indices and drought characteristics, that is, the Standard Precipitation Evapotranspiration Index (SPEI), Standard Precipitation Index (SPI), and Evaporative Demand Drought Index (EDDI). The result showed that the R2 of the model is above 0.88, and the performance of the model is good. The coupling between climate variables can not only amplify drought characteristics but also lead to the SPEI, SPI, and EDDI showing different drought states when identifying drought. With the decrease in timescale, the drought intensity of the three drought indices became stronger and the drought duration shortened, but the drought frequency increased. For short-term drought (1 mon), four scenarios displayed that the SPEI and SPI can identify more drought events. On the contrary, compared with the SPEI and SPI, the EDDI can identify long and serious drought events. This is mainly due to the coupling of evaporative demand, solar radiation, and wind speed. Evaporation demand also contributed to the SPEI, but the contribution (6–13%) was much less than the EDDI (45–85%). For SPEI-1, SPEI-3, and SPEI-6, the effect of temperature cannot be ignored. These results are helpful to understand and describe drought events for drought risk management under the condition of global warming.
Drought is one of the most serious natural disasters affecting the development of human society (Deb et al., 2019). Droughts are generally classified into meteorological droughts, agricultural droughts, hydrological droughts, and socioeconomic droughts (Wilhite and Glantz, 1985; Esfahanian et al., 2017). Meteorological drought, in general, precedes other droughts and is defined according to the degree of the lack of precipitation in an area over some time. One of the most prominent and widespread concerns is regional drought caused by climate warming and precipitation change, which has caused serious disasters worldwide (Zhai et al., 2010). For example, in 2014, California experienced a serious drought event that was mainly caused by an extreme lack of precipitation and high temperature and was a record-breaking event in the last century (Griffin and Anchukaitis, 2014). In 2011, high temperatures and low soil moisture in Texas aggravated drought events, and rainfall was extremely scarce (Karl et al., 2012). It is estimated that drought in California and Texas caused economic losses of $2.7 billion and $7.7 billion, respectively (Shukla et al., 2015). Therefore, a better understanding of drought characteristics and their physical variable is significant for monitoring and forecasting drought.
The drought indices are the basis of the quantitative analysis of drought (Richard and Heim, 2002). In different regions, the different meteorological, hydrological, and underlying surface conditions lead to the complexity of drought formation (Ojha et al., 2013; Wang et al., 2013; Kousari et al., 2014). This is due to different drought indices having different physical meanings. For example, the Standard Precipitation Index (SPI) is characterized by multiple timescales, but it only considers the impact of precipitation deficit on drought (Yerdelen et al., 2021). The Palmer drought severity index (PDSI) is a representative drought index based on the principle of water balance (Zhang et al., 2019). However, the indices mainly reflect the comprehensive changes in precipitation and temperature and do not fully reflect the evaporation response under the background of climate change, which may lead to deviation of drought assessment results. Vicente-Serrano et al. (2010) further proposed the Standard Precipitation Evapotranspiration Index (SPEI) and introduced the potential evapotranspiration term, based on the advantages and disadvantages of the PDSI and SPI (Yang et al., 2020). This index not only has the characteristics of the SPI index with multiple timescales but also considers the effect of temperature change on drought. In recent decades, it has been a widespread tradition to monitor and understand drought using factors driven by precipitation and temperature only (Gocic and Trajkovic, 2013; Li et al., 2019). Among the available indices, the SPEI and SPI are two of the most widely used ones (He et al., 2011).
Many studies have found that most drought indices are driven by precipitation alone or affected by both precipitation and evaporation (Farahmand and AghaKouchak, 2015; Wen et al., 2020). Additionally, many researchers considered that the alterability of precipitation was even more obvious than that of other variables (McEvoy et al., 2012; Vicente–Serrano et al., 2014; Wang et al., 2015). However, under climate variation, this supposition is challenged because of the increasing demand for temperature and evaporation (Sheffield and Wood, 2008; Milly and Dunne, 2016). Meanwhile, the research focus in the field of drought monitoring is turning to the demand of water imbalance. The most typical work is the evaporative demand drought index (EDDI) proposed by Hobbins et al. (2012), which considers the radiative forcing term and the advection forcing term in the evaporation process (Blonquist et al., 2010). This index can provide near real-time information about the occurrence or persistence of abnormal evaporative demand in an area and can ignore the influence of underlying surface types in drought monitoring and assessment (Mo and Lettenmaier, 2015). Therefore, many people are committed to assessing the occurrence of drought from the perspective of insufficient precipitation and increased evaporation (Liu et al., 2017; Rehana and Monish, 2021).
On the whole, most studies only emphasize the impact of precipitation on drought change or consider the flash drought caused by evaporation anomalies affected by temperature, wind speed, and radiation (Wang et al., 2016; Chen et al., 2019; Wang et al., 2020). The reduction of sunshine hours and wind speed is the main reason for the evaporation reduction; especially, evaporation plays an important role in soil water balance (Abramopoulos et al., 1988). The increase in temperature and the limited decrease in precipitation may aggravate the drought occurrence (Sheffield et al., 2012; Sun and Ma, 2015; Song et al., 2019). It is necessary to consider the coupling effect of multiple climate variables on drought, such as precipitation; evaporative demand; wind speed; temperature; solar radiation; and relative humidity, which may reduce uncertainty to the process of drought analysis and accurate prediction (Sun et al., 2017). Nevertheless, so far, due to the different responses of different drought indices to climate variables, there are still challenges in quantifying the impact of climate variables on drought. Most studies used multiple regression, canonical correlation, and principal component analysis to analyze the driving factors of climate change (Luedeling et al., 2013; Kaiwei Li et al., 2020). These methods are mainly analyzed from a qualitative point of view, but cannot quantitatively evaluate the importance of each factor. In recent years, with the progress of artificial intelligence, machine learning technology has been widely used in the assessment of climate change (Leroux et al., 2017; Masroor et al., 2021). Random forest (RF) algorithm is an integrated learning algorithm based on the decision tree proposed. The learning effect of this integration method is often greater than the sum of its parts (Jiangyu Wang et al., 2019). The RF does not need to consider the multicollinearity problem faced by general regression analysis (Wang et al., 2018). At the same time, it can calculate the nonlinear interaction between variables and reflect the interaction between variables and is not sensitive to outliers. In the existing algorithms, the RF can evaluate the importance of each feature in classification.
With these considerations, this study focuses on quantifying the response of drought change to climate variables. Specifically, the study aims to 1) analyze the temporal distinctions of the SPI, SPEI, and EDDI with 1-, 3-, 6-, and 12-month timescales of the Luanhe River Basin (LRB); 2) reveal the characteristics of the drought intensity, drought duration, and drought frequency of the SPI, SPEI, and EDDI at different timescales; and 3) quantify the contribution of climate variables to drought indices and drought characteristics at different timescales by setting different scenarios based on the RF model. The findings from this study can provide a reference for the development of drought early warning systems in arid and semiarid areas.
This study assessed changes in drought indices in the LRB, northern part of the North China Plain (Figure 1). The LRB comprises a large portion of the Haihe River Basin. The latitude ranges from 39.04°N to 42.73°N, and the longitude ranges from 115.56°E to 119.84°E. The Luanhe River, with a length of 888 km and a drainage area of 44,750 km2, derives from Bayanguertu Mountain and flows into the Bohai Bay (Yang et al., 2019; Wu et al., 2020). The basin topography rises obviously from southeast to northwest. The LRB is in a semiarid area with a temperate continental monsoon climate. The annual temperature decreases from 11 to 1°C from southeast to northwest (Xu et al., 2019). The region has an average annual precipitation of 560 mm, approximately 80% of which occurs from July to August. The uneven spatial and temporal distribution leads to the occurrence of drought. The elevation of the basin reaches 2,159 m, with the terrain decreasing from northwest to southeast.
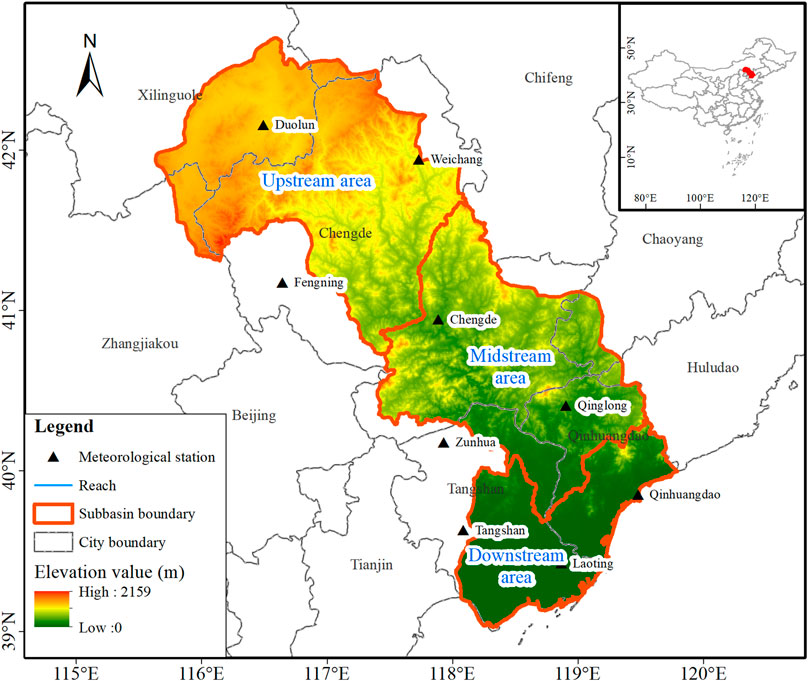
FIGURE 1. Topography of the study domain and spatial distribution of meteorological stations.
The LRB is one of the most important ecological barriers of Beijing, Tianjin, and Hebei and is also a water source and water retention area in Tianjin and Tangshan. Saihanba Forest Plain, a famous afforestation project worldwide, is located in this region (Wu et al., 2020). In recent decades, runoff and meteorological conditions have been altered, resulting in water resource shortages and severe drought events. Due to the increasing impact of global climate change, drought in the LRB occurs frequently, especially after 2000. It not only caused large-scale disasters in the basin but also caused serious losses. Furthermore, from 1981 to 2016, there was no significant change in precipitation, while evaporative demand showed a significant decreasing trend (p < 0.01) and the temperature increased significantly (p < 0.01). The effect of climate change caused by evaporative demand and temperature on drought should not be ignored.
This study focuses on a comparative analysis of drought indices in the LRB. The daily observation meteorological records of nine stations for 1981–2016 were collected from the National Meteorological Information Center (http://data.cma.cn/) with strict quality control, including precipitation; maximum, average, and minimum temperatures; wind speed; solar radiation; relative humidity; and pan evaporation. The time coverage of weather data can be as high as 99.6%. The missing data were interpolated using the arithmetic mean of adjacent days. The data quality and credibility were cross validated using nonparametric tests, involving the Mann–Whitney homogeneity tests and Kendall autocorrelation test (Heim, 2002; Yao et al., 2018). The results showed that the stability and randomness of weather data are fixed in the critical range of the data, and the statistical significance level was 5%.
This study considered three drought indices including the SPI, SPEI, and EDDI. The SPI utilized the Gamma distribution to fit the cumulative monthly precipitation time series to quantify the meteorological drought (Vicente–Serrano et al., 2010). For the SPI value, when the timescale is k months, the water surplus/deficit accumulation of a month is the sum of the water surplus/deficit of the previous k−1 month and the current month. Compared with the SPI, the SPEI, the calculation of which was similar to that of the SPI, considered the influence of evaporative demand. Among them, evaporative demand is the ability to control the evaporation process of various surfaces underlying the atmosphere. This study used the Penman–Monteith formula to approximately estimate evaporative demand, which was provided by the Food and Agricultural Organization (FAO) in 1965 (Frank et al., 2017). The calculation formula is as follows:
where E0 is the evaporative demand in mm day−1;
The relationship between evaporative demand and pan evaporation in the LRB from 1981 to 2016 was analyzed by using the existing meteorological data, and the correlation coefficient was 0.906 (see Supplementary Materials; Supplementary Figure. S1), which illustrated that the calculation results of evaporative demand can represent the average E0 of the study area. The SPEI used the cumulative change between the monthly precipitation and evaporative demand to replace the variation in precipitation. The cumulative change meant the surplus and deficit of climatic water. The inverse standard normal distribution is used to convert the cumulative probability density functions to the value of the SPEI and SPI.
The EDDI uses a nonparametric method that is different from the SPEI and SPI (Hobbins et al., 2016). The EDDI is obtained by sorting the accumulated value of evaporative demand every day within a set timescale to construct the distribution probability of E0 and normalize it. This probability-based method permits more comparisons of consistency between the EDDI and the SPEI, SPI, and other standard indices (Farahmand and AghaKouchak, 2015; Hobbins et al., 2016).
The EDDI is multi-scale in space and time. This index can be estimated at a point (or pixel) by applying the spatial average evaporative demand of a region. The aggregation periods might differ from 1 day to 1 month or more. The cumulative distribution probability of evaporative demand on a research timescale is calculated as follows:
where P (E0i) is the empirical probability of E0i; i is 1 for maximum E0, which represents the rank of accumulated E0 in the study period; and n is the number of observations in the series being ranked. Based on the reverse normal distribution described by Vicente–Serrano et al. (2010), the EDDI is calculated as follows:
The constants in the formula are defined as follows: C0 = 2.515517, C1 = 0.802853, C2 = 0.010328, d1 = 1.432788, d2 = 0.189269, and d3 = 0.001308. When P (E0i) ≤ 0.5,
We divided the drought indices into five grades, which were based on the classification system to define drought or wet intensities (McEvoy et al., 2016; Yao et al., 2018) (Table 1). The positive or negative SPI and SPEI values represented wet or dry conditions, respectively. The value of −0.5 was used as the division standard, while for the EDDI, it was reversed. The negative EDDI value (less than 0.5) indicated that it was wetter than normal, and a positive value (more than 0.5) indicated that it was more arid than normal. Drought intensity increased with increasing EDDI value.
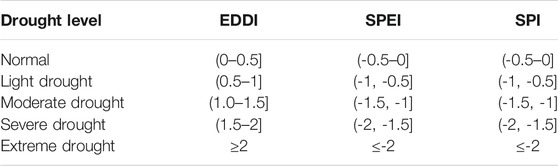
TABLE 1. Drought level based on the EDDI, SPEI, and SPI.
We first compared the variation characteristics of the SPI, SPEI, and EDDI on 1-, 3-, 6-, 12-month scales from 1981 to 2016. Second, this study used drought duration, drought intensity, and drought frequency to identify and assess the underlying drought characteristics of the SPEI, SPI, and EDDI at 1-, 3-, 6-, and 12-month scales. Generally, the run theory is used to identify and describe drought events (Yevjevich, 1967). The run is defined as a part of the time series Xt, in which all values are lower or higher than the selected threshold X0 (Supplementary Figure S2). The run theory is used to express the drought duration and drought intensity (Montaseri and Amirataee, 2017). When the drought index value is less than −0.5, it is considered that the month is the beginning of the drought event. However, the drought event is considered over until the value of the drought index is greater than −0.5. Drought duration is defined as the sum of consecutive months of all drought events. Drought intensity refers to the average of the indices’ values from the beginning to the end of the drought. The drought intensity is used to assess the severity of the drought. The drought frequency is the mean number of drought events per year.
To reveal the response of drought change to climate variables, the RF model is applied to quantify the contribution of each climate variable (precipitation; evaporative demand; wind speed; temperature; solar radiation; and relative humidity) to the SPEI, SPI, and EDDI. The RF is an integrated model which can achieve classification or regression goals. On the whole, in the training set, the RF is not responsive to the noise, which makes it more beneficial to obtaining a robust model and avoiding overfitting conditions (Prasad et al., 2019). The RF is widely used in hydrometeorology to extract relative features (Amiri et al., 2019). For more information about the RF, see the work of Chen et al. (2020) and Kursa and Rudnicki (2010).
In this study, we set up 4 scenarios and 12 schemes to quantitatively evaluate the influence degree between drought change and climate variables based on the RF model from 1981 to 2016. Considering that the SPI is not affected by evaporative demand, only the contribution of precipitation; wind speed; temperature; solar radiation; and relative humidity to the SPI is explored. The SPEI considered these six variables. At the same time, the EDDI ignored the impact of precipitation. The number of samples obtained was randomly assigned according to the ratio of 7:3 into the training set and the testing set. The maximum depth of decision trees is 10, and the number of decision trees is 2000. The specific scenario information is shown in Table 2.
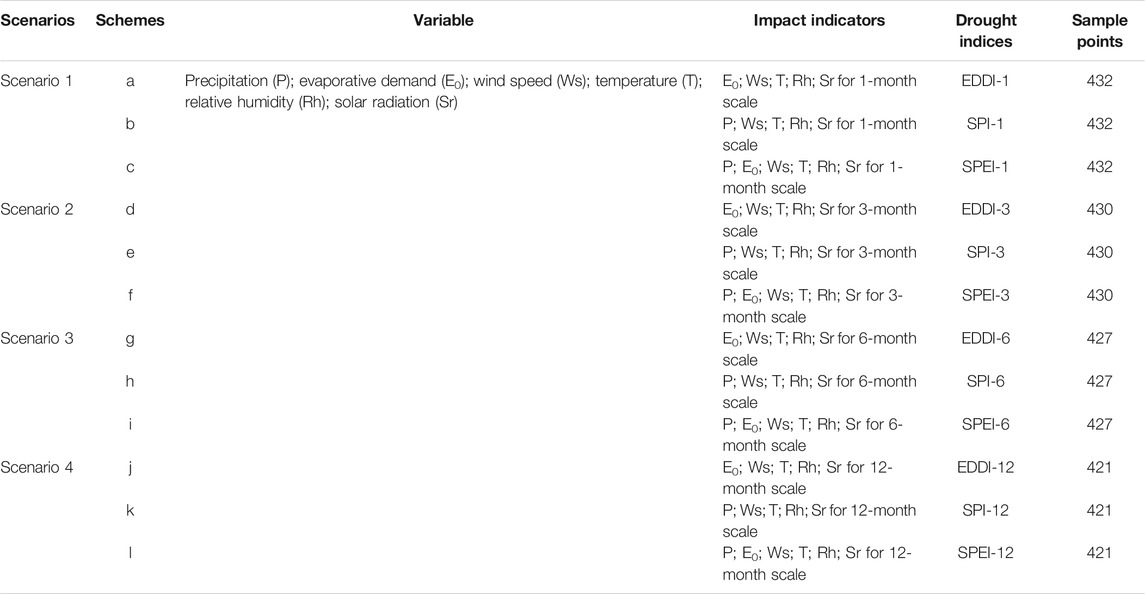
TABLE 2. Information of the four scenarios for the contribution of drought change.
The R2 and mean absolute error (MSE) coefficients were used to evaluate the results of the model (Guo et al., 2021). Among them, MAE evaluated the deviation between the real value and the predicted value, that is, the actual size of the prediction error. The smaller the MAE value, the better the model quality and the more accurate the prediction. Table 3 shows the performances of the RF model. The results showed that the R2 of the training set is between 0.91–0.98. In addition, the validation set is above 0.88. The value of the MAE is below 0.1, indicating that the model can calculate the contribution of climate variables better.
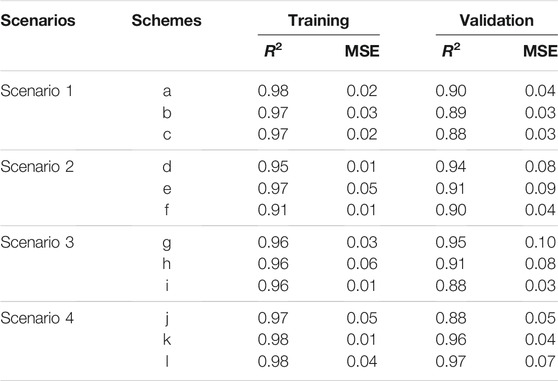
TABLE 3. The performance evaluation of the RF model.
Figure 2 presents the evolution characteristics of the SPI, SPEI, and EDDI at the 1-, 3-, 6-, and 12-month timescales over the LRB from 1981–2016. The three drought indices showed similarities and differences with the different timescales. For the convenience of comparison, we took the value of the EDDI as the opposite number, and less than −0.5 in the figure represented drought. The shaded area identified extreme drought states of the SPEI, SPI, and EDDI (Figure 2A). We found that extreme drought events occurred in 1981, 1983, 1989, 1991, 1994, 1997, 2001, and 2016, as in Figure 2A, which was similar to the historical drought years in the LRB (Yixuan Wang et al., 2019). Compared with the 3-, 6-, and 12-month timescales (Figures 2B–D), the EDDI, SPEI, and SPI curves fluctuated more abruptly at the 1-month timescale. Moreover, the SPI curve was similar with the SPEI (Figures 2B,C). However, the EDDI was different from the SPEI and SPI.
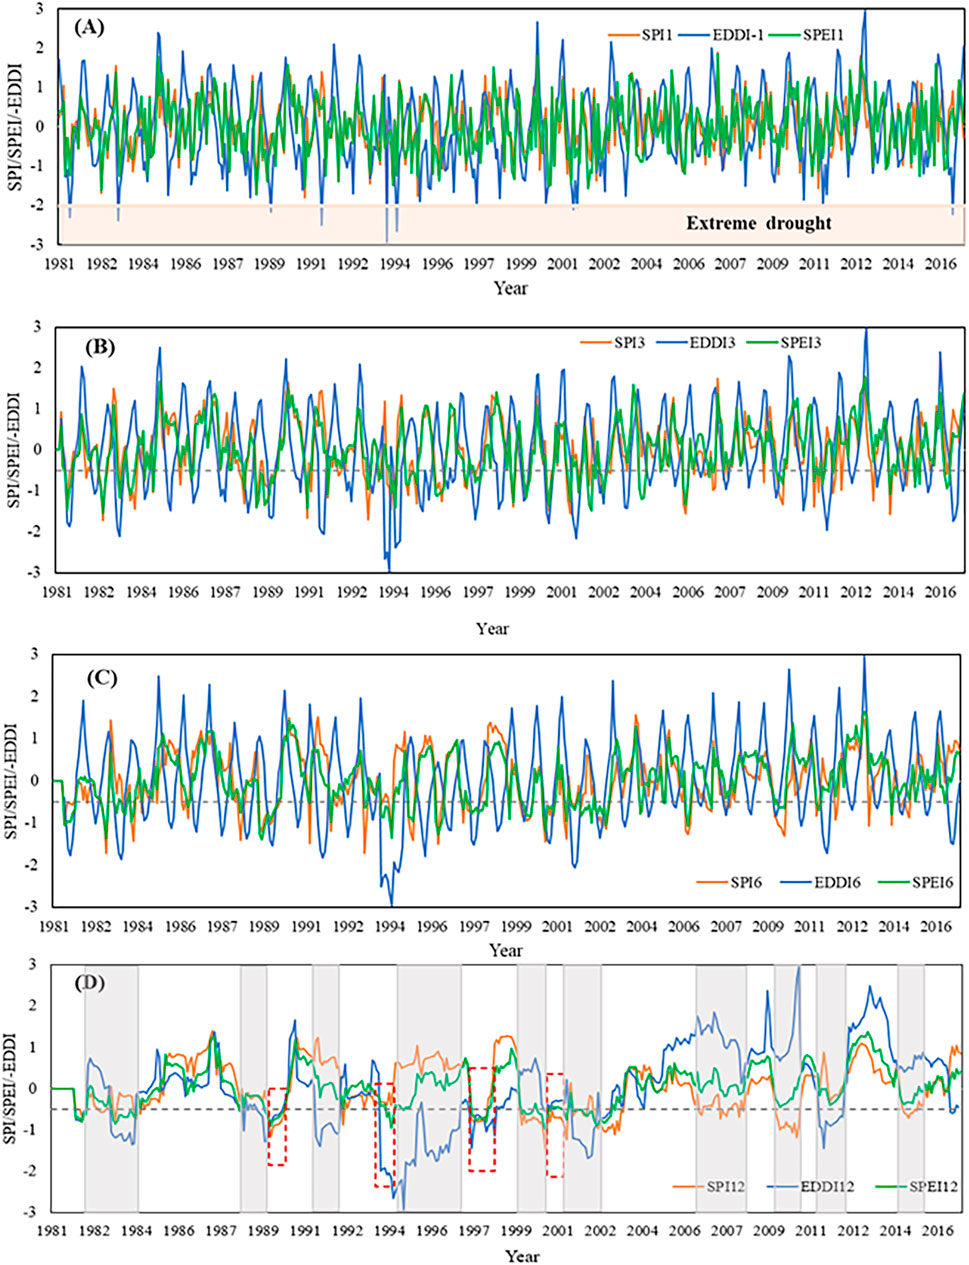
FIGURE 2. Temporal evolution of the SPI, SPEI, and EDDI for 1-month (A), 3-month (B), 6-month (C), and 12-month (D) timescales. It is noted that the shaded area represents the range of the extreme drought conditions (SPEI, SPI, and EDDI ≤ -2); the black dotted lines represent the dividing line between wet and drought states (the value is −0.5); the grey shaded areas highlight when the three indices have opposite states; and the red wireframe indicates when the three indices identify different drought levels.
At the 12-month timescale, the grey shaded areas indicate when the SPEI, SPI, and EDDI have opposite states (Figure 2D). In 1983, 1988, 1990–1991, 1994–1996, 2002, and 2011, the EDDI showed drought states (values less than −0.5), while the SPEI and SPI displayed wet states (values more than −0.5). However, the SPEI and SPI showed drought states, while the EDDI showed wet states in 1982, 1992, 1999–2000 and 2002, 2006–2007, 2008–2009, and 2014. Under drought conditions, the red wireframe highlights when the three indices had different abilities to identify drought. In 1989 and 1997, the SPI and SPEI performed better than the EDDI. Especially in 1989, the SPI and SPEI showed moderate drought states, while the EDDI showed a light drought state. In 1993 and 2001, the EDDI performed better than the SPEI and SPI. Especially in 1993, the EDDI showed extreme drought states, while the SPI and SPEI showed light drought and moderate drought states, respectively. This meant that the three drought indices were different in identifying drought severity. However, the SPI, SPEI, and EDDI showed the same wet/drought states for the other years, which indicated that the SPI, SPEI, and EDDI were consistent.
Due to the complexity of drought, the drought intensity, frequency, and duration under different timescales were studied to have a comprehensive understanding of drought. Figures 3A–C displayed that the shorter the timescale, the greater the drought intensity. In particular, the average drought intensity of the EDDI was greater than that of the SPEI and SPI at 1-, 3-, 6-, and 12-month scales. This illustrated that the EDDI can identify more severe drought than the SPEI and SPI, especially in short-term drought. The drought intensity of the SPI did not change significantly in 1-, 3-, 6-mon scales. From SPEI-3 to SPEI-12, the average drought intensity decreased from −0.81 to −0.64.
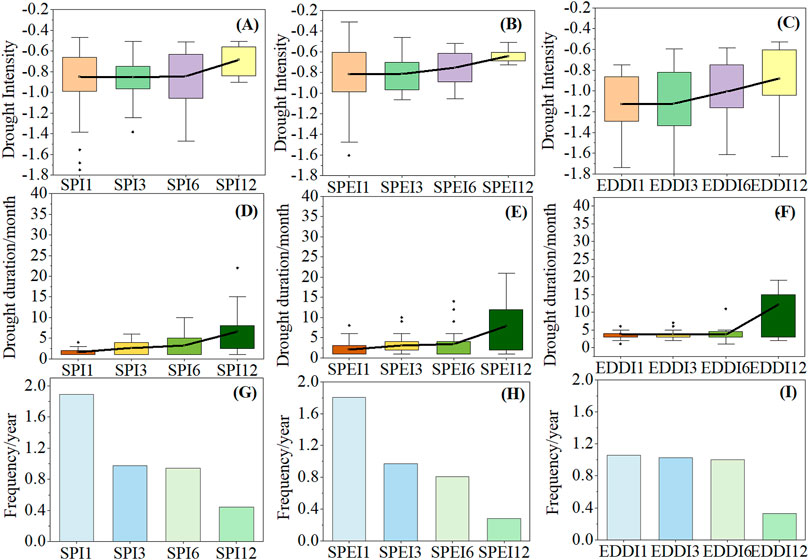
FIGURE 3. Drought intensity (A–C), duration (D–F), and frequency (G–I) of the SPEI, EDDI, and SPI at 1-, 3-, 6-, and 12-month timescales in the LRB between 1981 and 2016 (it is noted that the black horizontal line represents the average value of drought characteristics at different scales; black dots mean outliers; the range of boxes represents the 75% quantile and the 25% quantile; and the whiskers mean the 75% quantile and 25% quantile of 1.5 times, respectively.)
Figure 3D–F showed that, with the increase in timescale, the drought duration became longer. Especially for EDDI-12, the average duration of drought (more than 12 months) was higher than that for SPEI-12 (7.9 months) and SPI-12 (6.5 months). Furthermore, the drought duration for EDDI-1 (3.7 months) was longer than that for SPEI-1 (2.1 months) and SPI-1 (1.7 months). This indicated that the EDDI was better than the SPEI and SPI in identifying short-term drought (1 mon) and long-term drought (12 mon). For seasonal drought (3 mon) and semiannual drought (6 mon), the SPEI was better than the SPI.
The drought frequency decreased with the increase in timescale (Figures 3G–I), especially SPEI-3 and SPI-3. The drought frequency of SPI-1 (1.8 times/year) and SPEI-1 (1.8 times/year) was higher than that of EDDI-1 (1.0 times/year). For 3 months, there was no significant difference among the three drought indices. For 6 months, the drought frequency of SPI-6 was less than that of SPEI-6 and EDDI-6. On the contrary, for long-term drought, SPI-12 can identify more drought events than SPEI-12 and EDDI-12.
Although drought variations of the EDDI, SPEI, and SPI were mainly influenced by precipitation and evaporative demand, other climate variables cannot be ignored. Figure 4 showed the Spearman correlation among the three drought indices and climate variables at 1-, 3-, 6-, 12- month scales. We found that the SPEI and SPI were positively correlated not only with precipitation (p < 0.01) but also the relative humidity (p < 0.01), although the correlation coefficient was low. Surprisingly, the correlation of SPI-12 and SPEI-12 with precipitation reached 0.98 (p < 0.01) and 0.77 (p < 0.01), respectively. In the meantime, the SPEI also displayed a significant positive correlation with evaporative demand (Spearman correlation coefficient is −0.47, p < 0.01) and a negative correlation with temperature and solar radiation (Spearman correlation coefficient is −0.23 and 0.29, p < 0.01).
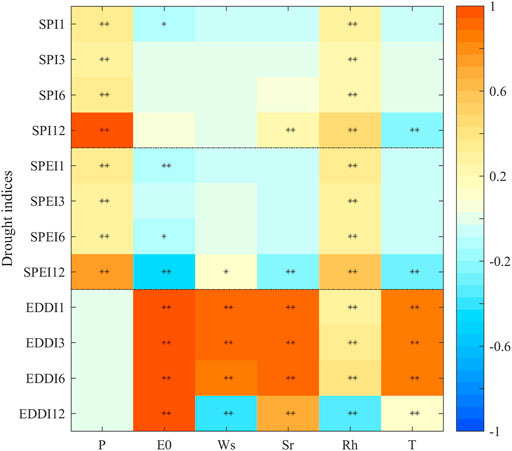
FIGURE 4. Correlation between the 1, 3, 6, and 12 months of the SPI, SPEI, EDDI, and climate variables such as precipitation (P); temperature (T); wind speed (Ws); solar radiation (Sr); relative humidity (Rh); and evaporative demand (E0) (a single asterisk represents the significance level less than 0.05 (p < 0.05); double asterisks mean p < 0.01, respectively).
Generally, under the different timescales, the correlation between the EDDI and evaporative demand is the highest, fluctuating from 0.92 to 0.98 (p < 0.01). Moreover, wind speed, solar radiation, and temperature were also highly related to EDDI at 1-, 3-, 6-month scales, indicating that these variables were also main factors affecting the change of the EDDI. Yet, at the 12-month scale, the correlation between solar radiation and temperature with drought indices was weakened. The correlation between wind speed and relative humidity with the EDDI changed from positive correlation to negative correlation, and the value of the correlation coefficient also decreased. Compared with other variables, relative humidity has little effect on the EDDI under the different timescales.
This study set up four scenarios and twelve schemes under the different timescales, to quantitatively characterize the impact of climate variables on drought index changes based on the RF model. Figure 5 shows that the contribution of evaporative demand, wind speed, and solar radiation to the EDDI reaches more than 87%. It was obvious that evaporative demand contributed the most to the EDDI, up to 45–85%, and the contribution was higher than that of wind speed and solar radiation. Nevertheless, it is not worth mentioning the contribution of relative humidity and temperature to the EDDI. For EDDI-3 and EDDI-6 in scenarios 3 and 4, the coupling contribution of wind speed and solar radiation was close to that of evaporative demand, and the solar radiation was greater than wind speed.
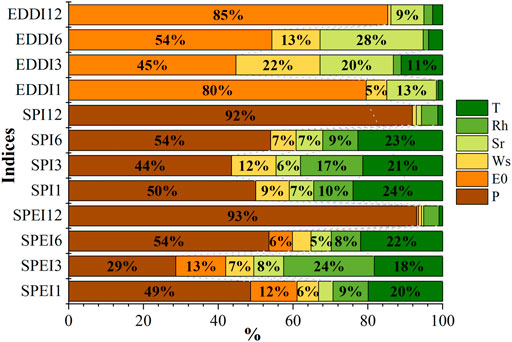
FIGURE 5. Contribution of climate variables to drought indices are based on the RF model at 1-, 3-, 6-, 12-month timescales.
For SPI-12 in scenario 4, the precipitation was the dominant factor, contributing 92%. However, for short-term drought (SPI-1) in scenario 1, the contribution of precipitation decreased significantly. By contrast, the wind speed, solar radiation, temperature, and relative humidity increased in varying degrees at a 1-mon scale. The temperature contribution to the SPI increased from 1% (SPI-12) to 24% (SPI-1), which indicated that the shorter the timescale, the more intense the impact of climate variables other than precipitation on the SPI.
For the SPEI, the contribution of precipitation is much higher than that of evaporative demand. Besides, the contribution of temperature to the SPEI should not be neglected, especially for SPEI-1, SPEI-3, and SPEI-6, with a contribution of 20, 18, and 22%. So far , the wind speed and solar radiation contribution to the SPEI has been weak, which indicated to a certain extent that the precipitation and temperature have a great impact on the SPEI.
We found that the EDDI, SPEI, and SPI showed the opposite states when it came to drought recognition (Figure 2D). Especially in 2002, a severe drought year, the drought indices showed two opposite states. The occurrence of this phenomenon can be explicated by the fact that climate variables cause the differences among the EDDI, SPEI, and SPI. Most of the results were consistent with ours (Nam et al., 2015; Noguera et al., 2021). Tirivarombo et al. (2018) believed that the difference between the SPEI and SPI was mainly due to the temperature which increased the evapotranspiration rate, which in turn increased the evaporative demand, while the SPI only considered the single input variable of precipitation. In addition, their study differed from ours in that it only thought about the effects of precipitation, temperature, and evaporative demand, while not introducing variables such as wind speed, solar radiation, and relative humidity. In 2002, situation 1 (S1) of Figure 2D showed that the EDDI identified the dry state, while the SPEI and SPI identified the wet state in April (Figure 6A). This result is mainly because precipitation and temperature have a large upward trend starting in March (Figures 6A,C), with an increase of 73.6 and 48.4%, respectively. However, relative humidity and wind speed also have different degrees of increase. Although relative humidity is positive, the sensitivity of the EDDI to the relative humidity in this region is small, which leads to little contribution to the EDDI in S1. Therefore, the SPEI and SPI identify the wet state in April. In addition, when evaporative demand (69.6%), solar radiation (70.5%), and wind speed (53.2%) began to increase in February, the drought identified by the EDDI increased from moderate drought to severe drought (Figure 6A).
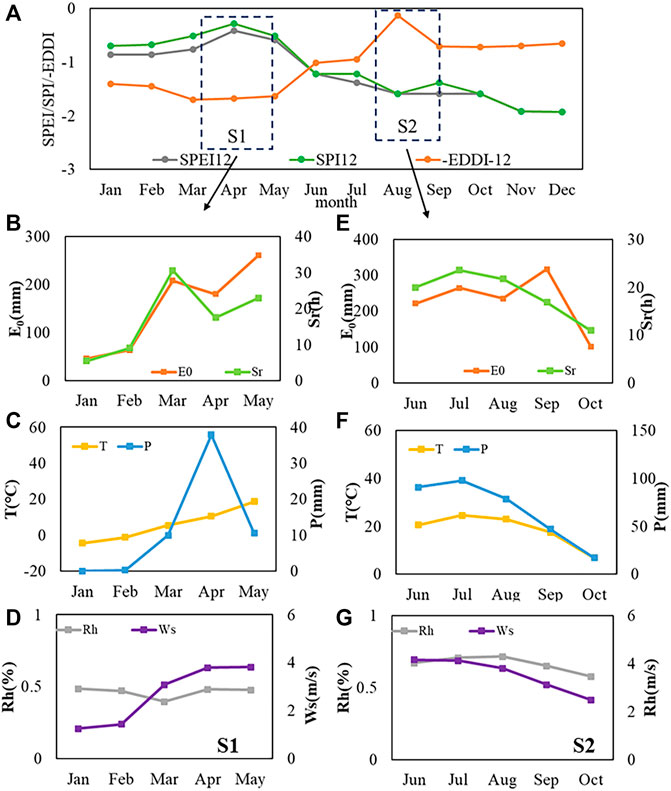
FIGURE 6. Temporal variations in the SPEI, SPI, EDDI (A), and driving factors in different situations (situation 1 (S1) and situation 2 (S2)) in 2002. Among them, (B–D) and (E–G) represent Evaporation demand(E0) and Solar radiation (Sr); Temperature (T) and Precipitation (P); Relative humidity (Rh) and Wind speed (Ws) in S1 and S2 respectively.
In contrast, situation 2 (S2) showed that the SPEI and SPI identified the dry state, while the EDDI identified the wet state in August (Figure 6A). The driving factors evaporative demand (12.5%), solar radiation (8.3%), and wind speed (8.3%) provided negative contributions to the EDDI (Figures 6E,G). However, from June to August, compared with evaporative demand and solar radiation, the contribution of relative humidity and temperature to the EDDI was small despite fluctuations (Figures 6F,G). This led the EDDI to identify the wet state in August. The decrease in precipitation (24.3%) led to the aggravation of drought identified by the SPEI and SPI in July. After August, the rapid increase in evaporative demand (34.9%) led to a decrease in the EDDI, which resulted in the EDDI showing a drought state. Consequently, the influence of these variables on the drought index should not be ignored.
Drought intensity, drought duration, and drought frequency are affected by different timescales (Satish Kumar et al., 2021). We found that compared with the SPEI and SPI, the EDDI can identify drought events with higher drought intensity and longer duration (Figure 2). However, the SPEI and SPI can identify drought events more frequently than the EDDI, especially short-term drought (1 mon). From 1981 to 2016, the alteration of precipitation was not obvious at any scale, while evaporative demand did not. Generally, when the change of evaporative demand is greater than that of precipitation, drought is more sensitive to evaporative demand than precipitation (Qin et al., 2015), which indicates that evaporative demand plays a relativity important role in the drought of the LRB. This further proved that the drought intensity and drought duration of the EDDI were higher than those of the SPEI and SPI, which was mainly due to the joint effect of evaporation, wind speed, and solar radiation. Compared with EDDI-12, the drought intensity of EDDI-1 increased by 28%, the average drought duration increased by 8 months, and the evaporation, wind speed, and radiation increased by 40, 33, and 27%, respectively (Figure 7). Evaporation demand also contributed to the SPEI, but the contribution (6–13%) was much less than the EDDI (45–85%) (Figure 5). In addition, we found that there was no significant difference in drought intensity between SPEI-1 and SPEI-3. However, for SPEI-6, the drought intensity began to weaken (Figure 3), which was caused by the 18.3% increase in precipitation, 15.6% increase in evaporation, 2.5% increase in temperature, and 3.6% increase in humidity from SPEI-3 to SPEI-6 (Figure 8). This also confirmed that, in addition to precipitation and evaporation demand, temperature and relative humidity have a certain impact on the SPEI in identifying drought.
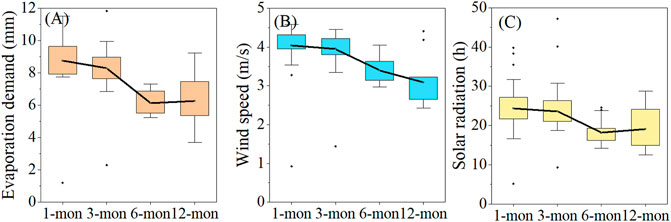
FIGURE 7. Differences in the values of different contributing variables ((A) Evaporation demand(E0); (B) Wind speed (Ws); (C) Solar radiation (Sr)) to the EDDI at different timescales.
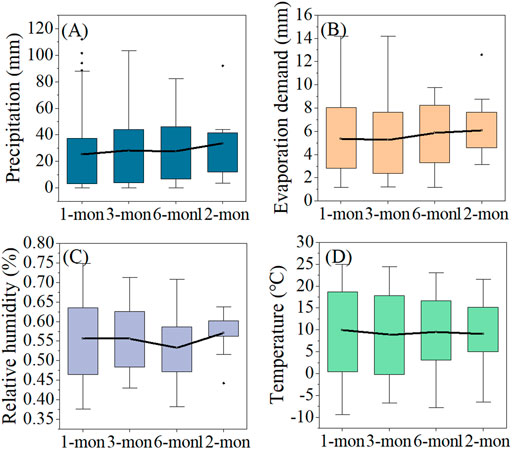
FIGURE 8. Differences in the values of different contributing variables ((A) Precipitation (P); (B) Evaporation demand (E0); (C) Relative humidity (Rh); (D) Temperature (T)) to the SPEI at different timescales.
Although the temperature increase can promote the generation of wind speed and increase the evaporative demand, thus aggravating the occurrence of drought (Zhao et al., 2019), the temperature contribution is far less than that of evaporative demand (80%), which further explains the phenomenon that the drought intensity of the EDDI is stronger than that of the SPEI and SPI. This finding is related to seasonality (Van Loon and Van Lanen, 2013; Bisht et al., 2018). Especially in winter, the precipitation was low, and the change was not obvious. Other studies also explained roughly similar results; that is, snow melting in winter increased soil moisture, and evaporation increased gradually under the condition of lack of rainfall, which led to the continuous increase in the EDDI (Narasimhan and Srinivasan, 2005; Sheffield et al., 2012). Although evaporation demand has a certain contribution to the EDDI and SPEI, it showed a significant decreasing trend in the study area, which was the main reason for the alleviation of drought. Other studies also illustrated roughly similar results (Yao et al., 2018; Lingcheng Li et al., 2020). In this period, not only did evaporative demand decrease significantly but also the solar radiation had a similar trend, and the temperature increased significantly (p < 0.01). The significant reduction of solar radiation is the main reason for the reduction of evaporative demand, which is further proved by the research results of Roderick and Farquhar (2002). It is mainly caused by the wide-range reduction of solar radiation caused by the increase in cloud cover and aerosol concentration, which also reduces evaporative demand to varying degrees.
Moreover, the smallest timescale for both the SPI and SPEI was 1 month, while for the EDDI, it was 1 week (McEvoy et al., 2012; Yao et al., 2018). For example, Figure 9 illustrates the variation characteristics of the EDDI with 1- to 8-week timescales. We found that the shorter the timescale was, the more the peaks and valleys the curve had. In particular, the 1-week EDDI curve was steeper than the longer timescales. Therefore, the EDDI can identify more serious drought events and is especially suitable for early warning and rapid drought detection.
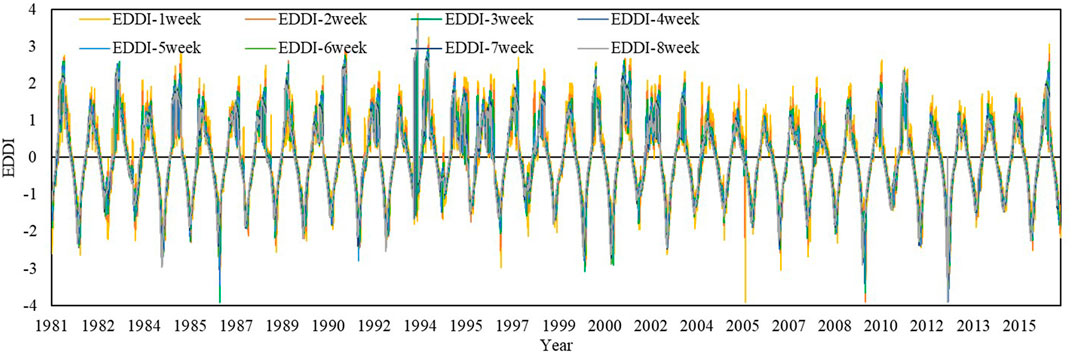
FIGURE. 9. Temporal variations in the EDDI with 1–8-week timescales during 1981–2016.
Although this study quantifies the impact of climate variables on drought, it still ignores some factors, such as human activities and soil properties. Solar radiation is related to air pollution caused by rapid urbanization (Qian et al., 2007; Zongxing et al., 2012). Therefore, land use and cover change will have a certain impact on drought. The same is true of deforestation, which will cause soil erosion and reduce soil water content, further increase evaporation, and lead to more droughts (Sun et al., 2017). Generally, soil properties are closely related to soil moisture. Different soil properties directly affect the water holding capacity of the soil (Park et al., 2004). It is necessary to explore the impact of soil properties on drought, which plays an important role in monitoring drought.
In this study, we compared the differences of meteorological drought indices (SPI, SPEI, and EDDI) at different timescales in the LRB, northern China, and further carried out quantifying the contribution of climate variables to drought change. To sum up, this study emphasized the necessity for adequate attention to the coupling effect between climate variables in drought studies. The conclusions are as follows.
The temporal fluctuations of the EDDI, SPEI, and SPI were increasingly acute when the timescale decreased. Besides, the drought indices showed opposite states in 2002. This is mainly because of the positive contribution of evaporative demand and solar radiation to the EDDI, which made it show severe drought in April. In the meantime, the SPEI and SPI identified the wet state under the coupling effect of precipitation and temperature, respectively. The smallest timescale for both the SPI and SPEI was 1 month, while for the EDDI, it was 1 week. The weekly EDDI illustrated the potential to bring to light early warnings of the drought that occurred, which was not accomplished by the SPEI and SPI.
The results of four scenarios and twelve schemes based on the RF model showed that the R2 of the model was greater than 0.88 and the MSE was small, indicating that the performance of the model was good. For the EDDI, the contributions are evaporative demand > Rn > U, respectively. Precipitation and evaporative demand are not the only variables affecting the SPEI, and the temperature (22%) contribution to the SPEI is greater than that of evaporative demand (6%), especially in SPEI-6.
With the decrease in timescale, the drought intensity of the three drought indices became stronger, the drought duration shortened, but the drought frequency increased. Especially, the drought intensity and duration of the EDDI were significantly higher than those of the SPEI and SPI. This is mainly due to the coupling effect of evaporative demand, wind speed, and solar radiation on the EDDI. The contribution of evaporative demand to the SPEI was less than that of precipitation, but the contribution of temperature cannot be ignored. This is also the main reason that the SPEI and SPI can identify more short-term drought events.
The information gained from this study may have useful implications not only for the LRB but also for other areas with strong evaporation change in the world. We cannot ignore the joint response of climate variables other than precipitation and evaporative demand in drought disasters. The spatial differences of climate variables may have a certain impact on the evolution of drought. Therefore, a quantitative model selected through the comparative optimization of multiple machine learning models can be established to explore the effects of climate variables on drought at a spatial scale, which will be conducted in our further studies.
The original contributions presented in the study are included in the article/Supplementary Material; further inquiries can be directed to the corresponding author.
All authors contributed to the study conception and design. Material preparation, data collection, and analysis were performed by YZ, XZ,JY, and YX. The first draft of the manuscript was written by YZ, and all authors commented on the previous versions of the manuscript. All authors read and approved the final manuscript.
This work was supported by the “National Natural Science Foundation of China” (grant number 41907157) and “National Key Research and Development Program of China” (grant numbers 2016YFC0401308 and 2018YFC1508901).
The authors declare that the research was conducted in the absence of any commercial or financial relationships that could be construed as a potential conflict of interest.
All claims expressed in this article are solely those of the authors and do not necessarily represent those of their affiliated organizations, or those of the publisher, the editors, and the reviewers. Any product that may be evaluated in this article, or claim that may be made by its manufacturer, is not guaranteed or endorsed by the publisher.
The authors thank the editor and reviewers for their valuable comments leading to improvements of this manuscript. They also thank American Journal Experts for polishing the text of the article.
The Supplementary Material for this article can be found online at: https://www.frontiersin.org/articles/10.3389/feart.2022.835142/full#supplementary-material
Abramopoulos, F., Rosenzweig, C., and Choudhury, B. (1988). Improved Ground Hydrology Calculations for Global Climate Models (GCMs): Soil Water Movement and Evapotranspiration. J. Clim. 1, 921–941. doi:10.1175/1520-0442(1988)001<0921:ighcfg>2.0.co;2
Amiri, M., Pourghasemi, H. R., Ghanbarian, G. A., and Afzali, S. F. (2019). Assessment of the Importance of Gully Erosion Effective Factors Using Boruta Algorithm and its Spatial Modeling and Mapping Using Three Machine Learning Algorithms. Geoderma 340, 55–69. doi:10.1016/j.geoderma.2018.12.042
Bisht, D. S., Chatterjee, C., Raghuwanshi, N. S., and Sridhar, V. (2018). An Analysis of Precipitation Climatology over Indian Urban Agglomeration. Theor. Appl. Climatol. 133, 421–436. doi:10.1007/s00704-017-2200-z
Blonquist, J. M., Allen, R. G., and Bugbee, B. (2010). An Evaluation of the Net Radiation Sub-model in the ASCE Standardized Reference Evapotranspiration Equation: Implications for Evapotranspiration Prediction. Agric. Water Manage. 97, 1026–1038. doi:10.1016/j.agwat.2010.02.008
Chen, L. G., Gottschalck, J., Hartman, A., Miskus, D., Tinker, R., and Artusa, A. (2019). Flash Drought Characteristics Based on U.S. Drought Monitor. Atmosphere 10, 498. doi:10.3390/atmos10090498
Chen, H., Liu, H., Chen, X., and Qiao, Y. (2020). Analysis on Impacts of Hydro-Climatic Changes and Human Activities on Available Water Changes in Central Asia. Sci. Total Environ. 737, 139779. doi:10.1016/j.scitotenv.2020.139779
Deb, P., Kiem, A. S., and Willgoose, G. (2019). A Linked Surface Water-Groundwater Modelling Approach to More Realistically Simulate Rainfall-Runoff Non-stationarity in Semi-arid Regions. J. Hydrol. 575, 273–291. doi:10.1016/j.jhydrol.2019.05.039
Esfahanian, E., Nejadhashemi, A. P., Abouali, M., Adhikari, U., Zhang, Z., Daneshvar, F., et al. (2017). Development and Evaluation of a Comprehensive Drought index. J. Environ. Manage. 185, 31–43. doi:10.1016/j.jenvman.2016.10.050
Farahmand, A., and AghaKouchak, A. (2015). A Generalized Framework for Deriving Nonparametric Standardized Drought Indicators. Adv. Water Resour. 76, 140–145. doi:10.1016/j.advwatres.2014.11.012
Frank, A., Armenski, T., Gocic, M., Popov, S., Popovic, L., and Trajkovic, S. (2017). Influence of Mathematical and Physical Background of Drought Indices on Their Complementarity and Drought Recognition Ability. Atmos. Res. 194, 268–280. doi:10.1016/j.atmosres.2017.05.006
Gocic, M., and Trajkovic, S. (2013). Analysis of Changes in Meteorological Variables Using Mann-Kendall and Sen's Slope Estimator Statistical Tests in Serbia. Glob. Planet. Change 100, 172–182. doi:10.1016/j.gloplacha.2012.10.014
Griffin, D., and Anchukaitis, K. J. (2014). How Unusual Is the 2012-2014 California Drought? Geophys. Res. Lett. 41, 9017–9023. doi:10.1002/2014GL062433
Guo, Y., Fu, Y., Hao, F., Zhang, X., Wu, W., Jin, X., et al. (2021). Integrated Phenology and Climate in rice Yields Prediction Using Machine Learning Methods. Ecol. Indicators 120, 106935. doi:10.1016/j.ecolind.2020.106935
He, B., Lü, A., Wu, J., Zhao, L., and Liu, M. (2011). Drought hazard Assessment and Spatial Characteristics Analysis in China. J. Geogr. Sci. 21, 235–249. doi:10.1007/s11442-011-0841-x
Heim, R. R. (2002). A Review of Twentieth-Century Drought Indices Used in the United States. Bull. Amer. Meteorol. Soc. 83, 1149–1166. doi:10.1175/1520-0477-83.8.1149
Hobbins, M., Wood, A., Streubel, D., and Werner, K. (2012). What Drives the Variability of Evaporative Demand across the Conterminous United States? J. Hydrometeorol. 13, 1195–1214. doi:10.1175/JHM-D-11-0101.1
Hobbins, M. T., Wood, A., McEvoy, D. J., Huntington, J. L., Morton, C., Anderson, M., et al. (2016). The Evaporative Demand Drought Index. Part I: Linking Drought Evolution to Variations in Evaporative Demand. J. Hydrometeorol. 17, 1745–1761. doi:10.1175/JHM-D-15-0121.1
Wang, J., Li, S., Chen, H., Yuan, Y., and Huang, Y. (2019). Data-driven Model Predictive Control for Building Climate Control: Three Case Studies on Different Buildings. Build. Environ. 160, 106204. doi:10.1016/j.buildenv.2019.106204
Li, K., Tong, Z., Liu, X., Zhang, J., and Tong, S. (2020). Quantitative Assessment and Driving Force Analysis of Vegetation Drought Risk to Climate change:Methodology and Application in Northeast China. Agric. For. Meteorol. 282-283, 107865. doi:10.1016/j.agrformet.2019.107865
Karl, T. R., Gleason, B. E., Menne, M. J., McMahon, J. R., Heim, R. R., Brewer, M. J., et al. (2012). U.S. Temperature and Drought: Recent Anomalies and Trends. Eos Trans. AGU 93, 473–474. doi:10.1029/2012EO470001
Kousari, M. R., Dastorani, M. T., Niazi, Y., Soheili, E., Hayatzadeh, M., and Chezgi, J. (2014). Trend Detection of Drought in Arid and Semi-arid Regions of Iran Based on Implementation of Reconnaissance Drought Index (RDI) and Application of Non-parametrical Statistical Method. Water Resour. Manage. 28, 1857–1872. doi:10.1007/s11269-014-0558-6
Kursa, M. B., and Rudnicki, W. R. (2010). Feature Selection with the Boruta Package. J. Stat. Soft. 36, 1–13. doi:10.18637/jss.v036.i11
Leroux, L., Bégué, A., Lo Seen, D., Jolivot, A., and Kayitakire, F. (2017). Driving Forces of Recent Vegetation Changes in the Sahel: Lessons Learned from Regional and Local Level Analyses. Remote Sens. Environ. 191, 38–54. doi:10.1016/j.rse.2017.01.014
Li, X., Li, Y., Chen, A., Gao, M., Slette, I. J., and Piao, S. (2019). The Impact of the 2009/2010 Drought on Vegetation Growth and Terrestrial Carbon Balance in Southwest China. Agric. For. Meteorol. 269-270, 239–248. doi:10.1016/j.agrformet.2019.01.036
Li, L., She, D., Zheng, H., Lin, P., and Yang, Z.-L. (2020). Elucidating Diverse Drought Characteristics from Two Meteorological Drought Indices (SPI and SPEI) in China. J. Hydrometeorol. 21, 1513–1530. doi:10.1175/JHM-D-19-0290.1
Liu, M., Xu, X., Xu, C., Sun, A. Y., Wang, K., Scanlon, B. R., et al. (2017). A New Drought index that Considers the Joint Effects of Climate and Land Surface Change. Water Resour. Res. 53, 3262–3278. doi:10.1002/2016WR020178
Luedeling, E., Guo, L., Dai, J., Leslie, C., and Blanke, M. M. (2013). Differential Responses of Trees to Temperature Variation during the Chilling and Forcing Phases. Agric. For. Meteorol. 181, 33–42. doi:10.1016/j.agrformet.2013.06.018
Masroor, M., Rehman, S., Sajjad, H., Rahaman, M. H., Sahana, M., Ahmed, R., et al. (2021). Assessing the Impact of Drought Conditions on Groundwater Potential in Godavari Middle Sub-Basin, India Using Analytical Hierarchy Process and Random forest Machine Learning Algorithm. Groundwater Sustain. Dev. 13, 100554. doi:10.1016/j.gsd.2021.100554
McEvoy, D. J., Huntington, J. L., Abatzoglou, J. T., and Edwards, L. M. (2012). An Evaluation of Multiscalar Drought Indices in Nevada and Eastern California. Earth Interact. 16, 1–18. doi:10.1175/2012EI000447.1
McEvoy, D. J., Huntington, J. L., Hobbins, M. T., Wood, A., Morton, C., Anderson, M., et al. (2016). The Evaporative Demand Drought Index. Part II: CONUS-wide Assessment against Common Drought Indicators. J. Hydrometeorol. 17, 1763–1779. doi:10.1175/JHM-D-15-0122.1
Milly, P. C. D., and Dunne, K. A. (2016). Potential Evapotranspiration and continental Drying. Nat. Clim Change 6, 946–949. doi:10.1038/nclimate3046
Mo, K. C., and Lettenmaier, D. P. (2015). Heat Wave Flash Droughts in Decline. Geophys. Res. Lett. 42, 2823–2829. doi:10.1002/2015GL064018
Montaseri, M., and Amirataee, B. (2017). Comprehensive Stochastic Assessment of Meteorological Drought Indices. Int. J. Climatol. 37, 998–1013. doi:10.1002/joc.4755
Nam, W.-H., Hayes, M. J., Svoboda, M. D., Tadesse, T., and Wilhite, D. A. (2015). Drought hazard Assessment in the Context of Climate Change for South Korea. Agric. Water Manage. 160, 106–117. doi:10.1016/j.agwat.2015.06.029
Narasimhan, B., and Srinivasan, R. (2005). Development and Evaluation of Soil Moisture Deficit Index (SMDI) and Evapotranspiration Deficit Index (ETDI) for Agricultural Drought Monitoring. Agric. For. Meteorol. 133, 69–88. doi:10.1016/j.agrformet.2005.07.012
Noguera, I., Domínguez-Castro, F., and Vicente-Serrano, S. M. (2021). Flash Drought Response to Precipitation and Atmospheric Evaporative Demand in Spain. Atmosphere 12, 165. doi:10.3390/atmos12020165
Ojha, R., Nagesh Kumar, D., Sharma, A., and Mehrotra, R. (2013). Assessing Severe Drought and Wet Events over India in a Future Climate Using a Nested Bias-Correction Approach. J. Hydrol. Eng. 18, 760–772. doi:10.1061/(asce)he.1943-5584.0000585
Park, S., Feddema, J. J., and Egbert, S. L. (2004). Impacts of Hydrologic Soil Properties on Drought Detection with MODIS thermal Data. Remote Sens. Environ. 89, 53–62. doi:10.1016/j.rse.2003.10.003
Prasad, R., Deo, R. C., Li, Y., and Maraseni, T. (2019). Weekly Soil Moisture Forecasting with Multivariate Sequential, Ensemble Empirical Mode Decomposition and Boruta-Random forest Hybridizer Algorithm Approach. CATENA 177, 149–166. doi:10.1016/j.catena.2019.02.012
Qian, Y., Wang, W., Leung, L. R., and Kaiser, D. P. (2007). Variability of Solar Radiation under Cloud-free Skies in China: The Role of Aerosols. Geophys. Res. Lett. 34, 1–5. doi:10.1029/2006GL028800
Qin, N., Wang, J., Yang, G., Chen, X., Liang, H., and Zhang, J. (2015). Spatial And Temporal Variations Of Extreme Precipitation And Temperature Events For The Southwest China In 1960-2009. Geoenviron. Disasters 2, 1–14. doi:10.1186/s40677-015-0014-9
Rehana, S., and Monish, N. T. (2021). Impact of Potential and Actual Evapotranspiration on Drought Phenomena over Water and Energy-Limited Regions. Theor. Appl. Climatol. 144, 215–238. doi:10.1007/s00704-021-03521-3
Richard, R., and Heim, (2002). A Review of Twentieth-Century Drought Indices Used in the United States. Bull. Am. Meteorol. Soc. 83, 1149–1165. doi:10.1175/1520-0477-83.8.1149
Roderick, M. L., and Farquhar, G. D. (2002). The Cause of Decreased pan Evaporation over the Past 50 Years. Science (New York, N.Y.) 298, 1410–1411. doi:10.1126/science.1075390-a
Satish Kumar, K., Venkata Rathnam, E., and Sridhar, V. (2021). Tracking Seasonal and Monthly Drought with GRACE-based Terrestrial Water Storage Assessments over Major River Basins in South India. Sci. Total Environ. 763, 142994. doi:10.1016/j.scitotenv.2020.142994
Sheffield, J., and Wood, E. F. (2008). Global Trends and Variability in Soil Moisture and Drought Characteristics, 1950-2000, from Observation-Driven Simulations of the Terrestrial Hydrologic Cycle. J. Clim. 21, 432–458. doi:10.1175/2007JCLI1822.1
Sheffield, J., Wood, E. F., and Roderick, M. L. (2012). Little Change in Global Drought over the Past 60 Years. 027Z. Available at: https://www.nature.com/articles/nature11575 (Accessed October 26, 2020).
Shukla, S., Safeeq, M., AghaKouchak, A., Guan, K., and Funk, C. (2015). Temperature Impacts on the Water Year 2014 Drought in California. Geophys. Res. Lett. 42, 4384–4393. doi:10.1002/2015GL063666
Song, H., Tian, J., Huang, J., Guo, P., Zhang, Z., and Wang, J. (2019). Hybrid Causality Analysis of ENSO’s Global Impacts on Climate Variables Based on Data-Driven Analytics and Climate Model Simulation. Front. Earth Sci. 7, 1–15. doi:10.3389/feart.2019.00233
Sun, C., and Ma, Y. (2015). Effects of Non-linear Temperature and Precipitation Trends on Loess Plateau Droughts. Quat. Int. 372, 175–179. doi:10.1016/j.quaint.2015.01.051
Sun, S., Chen, H., Ju, W., Wang, G., Sun, G., Huang, J., et al. (2017). On the Coupling between Precipitation and Potential Evapotranspiration: Contributions to Decadal Drought Anomalies in the Southwest China. Clim. Dyn. 48, 3779–3797. doi:10.1007/s00382-016-3302-5
Tirivarombo, S., Osupile, D., and Eliasson, P. (2018). Drought Monitoring and Analysis: Standardised Precipitation Evapotranspiration Index (SPEI) and Standardised Precipitation Index (SPI). Phys. Chem. Earth, Parts A/B/C 106, 1–10. doi:10.1016/j.pce.2018.07.001
Van Loon, A. F., and Van Lanen, H. A. J. (2013). Making the Distinction between Water Scarcity and Drought Using an Observation-Modeling Framework. Water Resour. Res. 49, 1483–1502. doi:10.1002/wrcr.20147
Vicente-Serrano, S. M., Beguería, S., and López-Moreno, J. I. (2010). A Multiscalar Drought Index Sensitive to Global Warming: The Standardized Precipitation Evapotranspiration Index. J. Clim. 23, 1696–1718. doi:10.1175/2009JCLI2909.1
Vicente-Serrano, S. M., Lopez-Moreno, J.-I., Beguería, S., Lorenzo-Lacruz, J., Sanchez-Lorenzo, A., García-Ruiz, J. M., et al. (2014). Evidence of Increasing Drought Severity Caused by Temperature Rise in Southern Europe. Environ. Res. Lett. 9, 44001. doi:10.1088/1748-9326/9/4/044001
Wang, B., Zhang, M., Wei, J., Wang, S., Li, S., Ma, Q., et al. (2013). Changes in Extreme Events of Temperature and Precipitation over Xinjiang, Northwest China, during 1960-2009. Quat. Int. 298, 141–151. doi:10.1016/j.quaint.2012.09.010
Wang, H., Rogers, J. C., and Munroe, D. K. (2015). Commonly Used Drought Indices as Indicators of Soil Moisture in China. J. Hydrometeorol. 16, 1397–1408. doi:10.1175/JHM-D-14-0076.1
Wang, S.-p., Wang, J.-s., Zhang, Q., Li, Y.-p., Wang, Z.-l., and Wang, J. (2016). Cumulative Effect of Precipitation Deficit Preceding Severe Droughts in Southwestern and Southern China. Discrete Dyn. Nat. Soc. 2016, 1–10. doi:10.1155/2016/2890852
Wang, W., Ma, X., Moazzam Nizami, S., Tian, C., and Guo, F. (2018). Anthropogenic and Biophysical Factors Associated with Vegetation Restoration in Changting, China. Forests 9, 306. doi:10.3390/f9060306
Wang, K., Niu, J., Li, T., and Zhou, Y. (2020). Facing Water Stress in a Changing Climate: A Case Study of Drought Risk Analysis under Future Climate Projections in the Xi River Basin, China. Front. Earth Sci. 8, 1–12. doi:10.3389/feart.2020.00086
Wen, X., Pan, W., Sun, X., Li, M., Luo, S., Cao, B., et al. (2020). Study on the Variation Trend of Potential Evapotranspiration in the Three-River Headwaters Region in China over the Past 20 Years. Front. Earth Sci. 8, 1–12. doi:10.3389/feart.2020.582742
Wilhite, D. A., and Glantz, M. H. (1985). Understanding: the Drought Phenomenon: The Role of Definitions. Water Int. 10, 111–120. doi:10.1080/02508068508686328
Wu, L., Zhang, X., Hao, F., Wu, Y., Li, C., and Xu, Y. (2020). Evaluating the Contributions of Climate Change and Human Activities to Runoff in Typical Semi-arid Area, China. J. Hydrol. 590, 125555. doi:10.1016/j.jhydrol.2020.125555
Xu, Y., Zhang, X., Wang, X., Hao, Z., Singh, V. P., and Hao, F. (2019). Propagation from Meteorological Drought to Hydrological Drought under the Impact of Human Activities: A Case Study in Northern China. J. Hydrol. 579, 124147. doi:10.1016/j.jhydrol.2019.124147
Yang, W., Long, D., and Bai, P. (2019). Impacts of Future Land Cover and Climate Changes on Runoff in the Mostly Afforested River basin in North China. J. Hydrol. 570, 201–219. doi:10.1016/j.jhydrol.2018.12.055
Yang, P., Zhang, Y., Xia, J., and Sun, S. (2020). Identification of Drought Events in the Major Basins of Central Asia Based on a Combined Climatological Deviation index from GRACE Measurements. Atmos. Res. 244, 105105. doi:10.1016/j.atmosres.2020.105105
Yao, N., Li, Y., Lei, T., and Peng, L. (2018). Drought Evolution, Severity and Trends in mainland China over 1961-2013. Sci. Total Environ. 616-617, 73–89. doi:10.1016/j.scitotenv.2017.10.327
Yerdelen, C., Abdelkader, M., and Eris, E. (2021). Assessment of Drought in SPI Series Using Continuous Wavelet Analysis for Gediz Basin, Turkey. Atmos. Res. 260, 105687. doi:10.1016/j.atmosres.2021.105687
Yevjevich, V. M. (1967). An Objective Approach to Definitions and Investigations of continental Hydrologic Droughts. J. Hydrol. 7, 353. doi:10.1016/0022-1694(69)90110-3
Wang, Y., Li, J., Zhang, T., and Wang, B. (2019). Changes in Drought Propagation under the Regulation of Reservoirs and Water Diversion. Theor. Appl. Climatol, 138, 701–711. doi:10.1007/s00704-019-02839-3
Zhai, J., Su, B., Krysanova, V., Vetter, T., Gao, C., and Jiang, T. (2010). Spatial Variation and Trends in PDSI and SPI Indices and Their Relation to Streamflow in 10 Large Regions of China. J. Clim. 23, 649–663. doi:10.1175/2009JCLI2968.1
Zhang, X., Xu, Y., Hao, F., Li, C., and Wang, X. (2019). Hydrological Components Variability under the Impact of Climate Change in a Semi-arid River Basin. Water 11, 1122. doi:10.3390/w11061122
Zhao, H., Zhou, Y., Li, X., Liu, C., and Chen, X. (2019). The Influence of Wind Speed on Infrared Temperature in Impervious Surface Areas Based on In Situ Measurement Data. GISci. Remote Sens. 56, 843–863. doi:10.1080/15481603.2019.1572322
Keywords: meteorological drought, quantification, climate variables, coupling effect, random forest
Citation: Zheng Y, Zhang X, Yu J, Xu Y, Wang Q, Li C and Yao X (2022) Assessing the Joint Impact of Climatic Variables on Meteorological Drought Using Machine Learning. Front. Earth Sci. 10:835142. doi: 10.3389/feart.2022.835142
Received: 14 December 2021; Accepted: 15 February 2022;
Published: 09 March 2022.
Edited by:
Luis Gimeno, University of Vigo, SpainCopyright © 2022 Zheng, Zhang, Yu, Xu, Wang, Li and Yao. This is an open-access article distributed under the terms of the Creative Commons Attribution License (CC BY). The use, distribution or reproduction in other forums is permitted, provided the original author(s) and the copyright owner(s) are credited and that the original publication in this journal is cited, in accordance with accepted academic practice. No use, distribution or reproduction is permitted which does not comply with these terms.
*Correspondence: Jingshan Yu, amluZ3NoYW5AYm51LmVkdS5jbg==
Disclaimer: All claims expressed in this article are solely those of the authors and do not necessarily represent those of their affiliated organizations, or those of the publisher, the editors and the reviewers. Any product that may be evaluated in this article or claim that may be made by its manufacturer is not guaranteed or endorsed by the publisher.
Research integrity at Frontiers
Learn more about the work of our research integrity team to safeguard the quality of each article we publish.