 Li Li
Li Li Shixin Zhang1
- 1School of Civil Engineering, Chongqing Three Gorges University, Chongqing, China
- 2College of Mechanics and Materials, Hohai University, Nanjing, China
- 3Department of Geological Engineering, Southwest Jiaotong University, Chengdu, China
Soil-rock mixtures (S-RMs) composed of rock slope colluvium and landslide deposits are common in superficial hazards of bank slopes. The physical and mechanical properties of S-RMs are closely related to environmental conditions, especially reservoir water level fluctuation. Therefore, immersion-air dry (I-AD) circulations tests were carried out to simulate the phenomenon in this study. The macroscopic, mesoscopic, and microcosmic studies of S-RMs are carried out after experiencing cycles (N) of 0, 1, 5, and 10, respectively. Conventional triaxial tests, particle analysis tests, and scanning electron microscopy were performed to study the physical and mechanical properties of S-RMs. According to test results, the maximum deviator stress of S-RMs samples with confining pressures of 100, 200, 300, and 400 kPa after ten cycles is reduced by 41.13, 37.11, 32.17, and 30.20%. With the increase in N there is a significant trend towards reducing the strength of S-RMs, and the strength deterioration after the first I-AD circulation reached 15.73%. After I-AD circulations, the content of fine particles in S-RMs decreases, the grain-size characteristic and non-uniformity coefficient increase significantly, and the gradation of S-RMs shows discontinuity. Moreover, the repeated changes of water pressure have an irreversible impact on the microstructure of S-RMs, which will cause an increase in pore size and a higher pore disorder. In addition, it is found from the established strength parameter evolution equation that when N approaches infinity, S-RMs decomposes the weathering into cohesionless silt with an angle of repose of 0.90322φ0. The study results in this paper clarify the deterioration characteristics of wading S-RMs, and might be used in the bank slopes stability analysis.
Introduction
Soil-rock mixtures (S-RMs) are widely distributed in the mountainous areas of southwestern China, which formed in Quaternary are a type of uneven, loose accumulation geotechnical medium (Xu et al., 2008; Xu et al., 2011). S-RMs are common natural geological materials, and often present in the high fill of airports, filling roadbed, river regulation, bank slopes, and other projects (Yongbo et al., 2015; Gao et al., 2018; Li et al., 2020). Especially in the Three Gorges Reservoir area of China, slopes composed of S-RMs have been affected by the reservoir water level fluctuation for a long time, and S-RMs’ physical and mechanical properties have undergone irreversible deterioration (Jiang et al., 2015). As shown in Figure 1, the S-RMs landslide located in the upper reaches of the Yangtze River suffered instability failure and caused deterioration to the road.
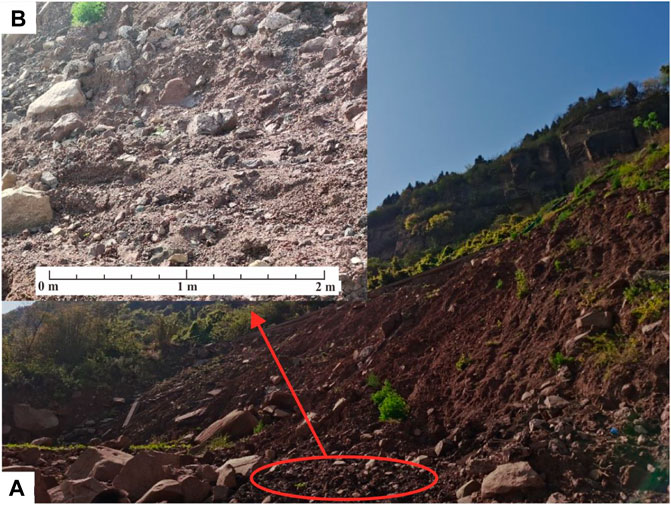
FIGURE 1. Tuanshiban S-RMs landslide in the upstream of the Yangtze River: (A) S-RMs slope after instability failure; (B) main material of Tuanshiban S-RMs landslide.
The environment of the reservoir and the special conditions of seasonal changes make geomaterials on the bank experience wetting and drying cycles (Miao et al., 2020; Nsabimana et al., 2020; Wang et al., 2020). Therefore, the shear strength (Goh et al., 2014; Wang Jun-Jie et al., 2019), permeability (Ng and Leung 2012; Gallage and Uchimura 2016), deformation characteristics (Wang et al., 2018; Al-Dakheeli and Bulut 2019), and physical properties (Yang et al., 2018; Yang et al., 2019) of geomaterials will be affected by immersion-air dry (I-AD) circulations. Focusing on the characteristics of the reservoir slope being subjected to I-ADs, many tests were carried out to simulate the reservoir water level fluctuation. A water-rock interaction test with the layered sandstone as the study object was carried out, and the deformation and strength characteristics of the layered sandstone showed a significant deterioration trend (Jiang et al., 2019). In addition, the damping coefficient and dynamic elastic modulus of sandstone have a logarithmic change in the first six cycles (Deng et al., 2019). However, the tensile strength of sandstone is not necessarily permanently reduced by I-AD circulations, and any weakening caused by saturation after drying will obviously disappear (Zhao et al., 2017). To gain further insight into the shear strength characteristics of unsaturated soils after many I-AD circulations, the drying and wetting shear strength of sand-kaolin mixtures were studied through unsaturated consolidated drained (CD) triaxial tests (Goh et al., 2014). The shear strength of coal-bearing soil after I-AD circulations is measured by the shear strength test, and it is pointed out that the total cohesion and the total internal friction angle are greatly affected by the moisture content (Fan et al., 2021). To sum up, I-AD test is often carried out together with triaxial tests to study the strength and deformation characteristics of geomaterials. Moreover, S-RMs are often assumed to be homogeneous or piecewise homogeneous and their structural behavior is commonly ignored. However, the deterioration process of geomaterials caused by I-AD circulations is inseparable from the microstructure change.
The mechanical properties of S-RMs (such as stress transfer, failure mode, crack propagation, and bearing capacity, etc.) can be distinguished from homogeneous geomaterials, mainly depending on the internal structural characteristics (such as particle size composition, particle shape, particle distribution and arrangement) (Shan and Lai 2019). Therefore, the combination of digital image processing and discrete element method is usually used to analyze heterogeneous geomaterials (Meng et al., 2018). A mesoscale study of soil-rock mixture based on computer tomography was carried out by Li et al. (2016), and digital image processing was used to establish wire-frame models indicating the interface between soils and gravels. Also, based on the microstructure of the S-RMs obtained by computer tomography, the numerical simulation method of S-RMs vibration compaction method was developed through the discrete element method (Ji et al., 2020). In consideration of the mesoscopic structure of S-RMs, a three-layer embedded model and a multistep-multiphase micromechanical model were proposed by Zhou et al. (2018) to calculate the shear modulus of frozen S-RMs. For the purpose of this overview, the meso-scale study includes rock morphology, rock spatial distribution, rock content, grain composition, and other factors that control the mechanical properties of S-RMs (Zhang et al., 2016). Micro-scale studies involving the skeleton structure and particle contact of S-RMs need to be carried out by scanning electron microscopy (SEM). The mineral composition and content of S-RMs can be revealed by SEM and X-ray diffraction (XRD) methods (Zhang et al., 2016). When studying the effect of material structure on the streaming potential of S-RMs, SEM is used to observe the geometric properties of particles and pores (Wang Y et al., 2019). Many SEM tests revealed that quartz particles are surrounded by many clay minerals, which is the primary microstructure of S-RMs (Zhang et al., 2016; Wang and Hu 2021). Thus, the microstructure of S-RMs is prone to change after I-AD circulations, which leads to the deterioration of the macro-mechanical properties.
To summarize, the objective of this paper is to carry out a multiscale study on the deterioration characteristics and laws of S-RMs under the action of immersion-air drying circulations. In this paper, a self-designed saturated test device is used to complete the immersion process, and triaxial tests and SEM tests are performed on the S-RMs samples after I-AD circulations. The organization of this paper is as follows:
In Section Materials and Methods the test procedure of this paper is introduced; in Section Results, the law of the deterioration of the mechanical properties and the micro-deterioration characteristics of S-RMs after circulations is described; the strength parameter evolution equations of S-RMs are proposed in Section Discussions; the conclusions are drawn in the end.
Materials and Methods
Materials
The S-RMs used in tests came from the Tuanshiban landslide in Wanzhou, Chongqing, a reservoir landslide in the Three Gorges Reservoir area in China (Figure 1). Furthermore, the landslide material of the Tuanshiban landslide is mainly composed of pebbly silty clay and gravelly soil. The pebbly silty clay is mainly distributed in the middle and upper part of the soil layer in the landslide area and is generally ochre and beige (Figure 2A). S-RMs are mainly composed of mudstone gravel with a small number of cohesive soils and distributed in the middle and lower parts of the soil layer, which are puce and maroon (Figure 2B). Drilling results show that the composition of the gravelly soil in S-RMs is mainly mudstone, with less sandstone. Generally, the particle size is 5–40 cm, and some are 40–90 cm or even greater than 90 cm. In terms of geometric characteristics, the gravelly soil is angular and subangular, the mudstone is soft, and some sandstones are hard. The content of cohesive soil is about 10–30%, formed by weathering of mudstone blocks, and the content of cohesive soil is less sandy and breccia. The thickness can be up to 50 m, and the average thickness in the distribution area is about 20 m.
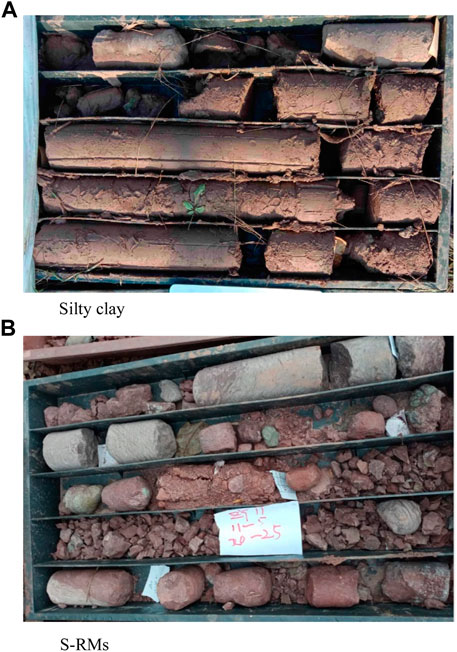
FIGURE 2. Geomaterials of Tuanshiban landslide obtained by drilling. (A) Silty clay, (B) S-RMs.
As an important physical property index of S-RMs, the soil-rock threshold is used to quantitatively distinguish the particle size limits of soils and rocks in the S-RMs. The most widely used soil-rock threshold is currently defined by Lindquist (1994) and Medley (1994) when studying S-RMs of Franciscan in the United States. The soil-rock threshold is determined according to the scale-independence defined by the statistical results of the size of the rocks in S-RMs. Lindquist (1994) and Medley (1994) made statistics on the size of many S-RMs. No matter the area of S-RMs studied, the particle size fractal dimension curve has an obvious turning point at 0.05
where, dS/RT is the soil-rock threshold; A is the study area of S-RMs, usually let
Therefore, the classification of soils and rocks in S-RMs is defined according to the particle size in this paper:
where, d is the actual measured rock size.
According to Eqs 1, 2, the soil-rock threshold in this paper is set to 5 mm (P5 represents the rock content). The rock content of the samples for I-AD circulations tests and triaxial tests is prepared according to the rock content of natural state of the Tuanshiban landslide. Moreover, the grain grading curve is shown in Figure 3, and the particle sieving results are shown in Figure 4. The size of the rock in the test is given in Figure 5.
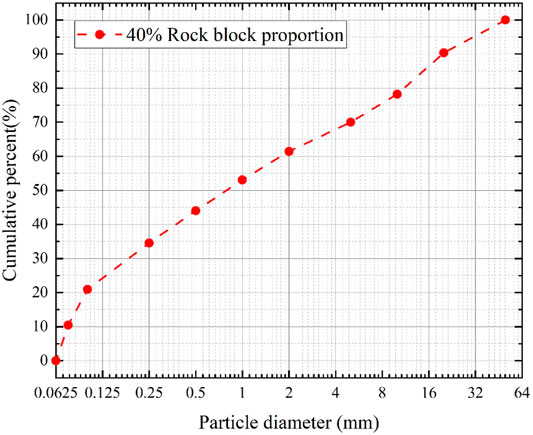
FIGURE 3. Grains composition of prepared S-RMs.

FIGURE 4. Sieving results of S-RMs.
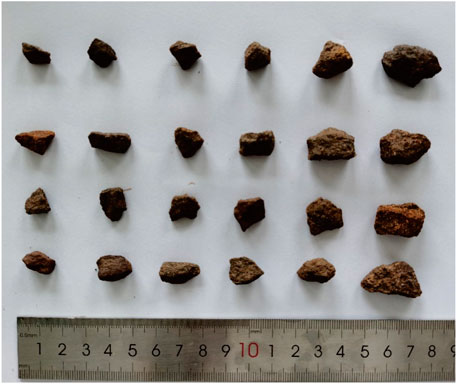
FIGURE 5. Different sizes of rocks in S-RMs.
Testing Scheme
In the multiscale study of S-RMs under I-AD circulations, the self-designed saturated tests, particle analysis experiments, triaxial tests, and SEM are set up to carry out macroscopic, meso, and microcosmic-scale studies. I-AD circulations include saturated tests (immersion process) and dry tests (air-dry process). In this paper, immersion saturation and drying oven are used to simulate the reservoir water level fluctuation. The schematic diagram of the test device is shown in Figure 6. It can be seen from Figure 6 that the immersion saturated device is composed of the inlet valve, outlet valve, water storage chamber, triaxial samples, and sieve. The water level is controlled by the inlet valve and outlet valve, and the flow rate is controlled by the tightness of the valve. Soils lost by seepage erosion after each cycle are stored in an internal test sieve. In addition, the air-dry test is completed by a conventional blast constant temperature drying oven, which will not be described in detail here. The main steps are described below:
1) The preparation of triaxial samples. To begin with, configure the sample with the sieved soil and rock blocks according to the designed gradation. Then mixed the prepared soils and rock blocks. Moreover, in the mixing process, watering cans were used to control the moisture content of the natural moisture content of Tuanshiban landslide (w = 8%). The mixture was compacted in five layers into a cylindrical triaxial specimen with a height of 125 mm and a diameter of 61.8 mm.
2) I-AD circulations test. The S-RMs samples were placed on the three-layer sieve in the water storage chamber. The water was injected into the water storage chamber from the inlet valve. After the water was filled, the outlet valve was opened, and the flow rate was controlled to maintain the water level in the water storage chamber to submerge the triaxial sample. After a 12-h saturation process, the triaxial S-RMs sample was placed in a drying oven box for 8 h drying (The immersion test determined the saturation duration and the drying and the drying test, respectively).
3) Triaxial test and SEM. After completing specific I-AD circulations (N = 0, 1, 5, and 10), the samples were subjected to conventional triaxial tests and SEM, respectively. Subsequently, the triaxial tests were carried out at four confining pressures (100, 200, 300, and 400 kPa). In addition, the gold dust was necessary to spray on SEM samples after dehydration to achieve surface conductivity.
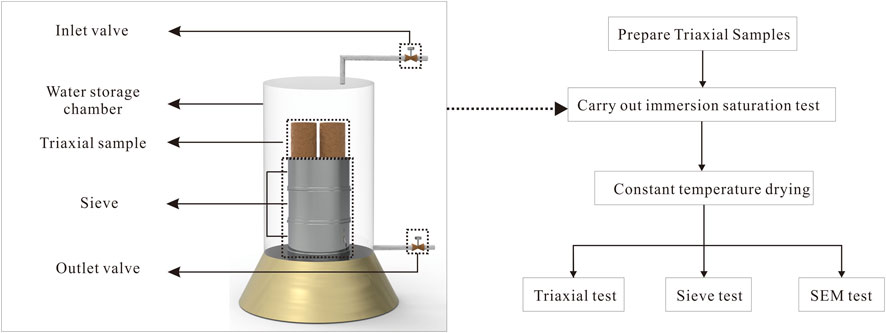
FIGURE 6. Schematic diagram of the test process.
The macroscopic, mesoscopic, and microscopic studies of S-RMs after I-AD circulations have been mainly completed through the above steps.
Results
Macroscopic Mechanical Characteristics
The deformation trend of S-RMs under external load shows nonlinear and elastoplastic characteristics, and rocks of S-RMs are damaged in the process of deformation and failure. I-AD circulations of S-RMs will cause changes in the mechanical characteristics of rocks, and the actual internal situation of S-RMs slope is complicated. Meanwhile, the macroscopic test is one of the important ways to obtain the strength parameters of the S-RMs. In this section, the macro-mechanical characteristics of S-RMs after saturated circulations for 0, 1, 5, and 10 times are studied. The stress-strain curve of S-RMs under four confining pressures obtained by the conventional triaxial test is shown in Figure 7. It can be seen from Figure 7 that after experiencing I-AD circulations, the maximum deviation stress is significantly reduced. Overall, the growth trend of the stress-strain curve of S-RMs still conforms to the three-stage stress-strain curve. The first stage is characterized by rapid stress growth in the initial period, showing roughly linear changes. The first stage is mainly the compaction process of S-RMs. In the second stage of the stress-strain curve, as the axial stress continues to increase, the slope of the stress-strain curve gradually decreases until the maximum deviator appears. The rocks in the S-RMs were observed to roll and rearrange prior to reaching the maximum deviation stress, and finally the rocks occlude each other. The axial pressure is further increased in the last stage, and the S-RMs sample shows strain hardening.
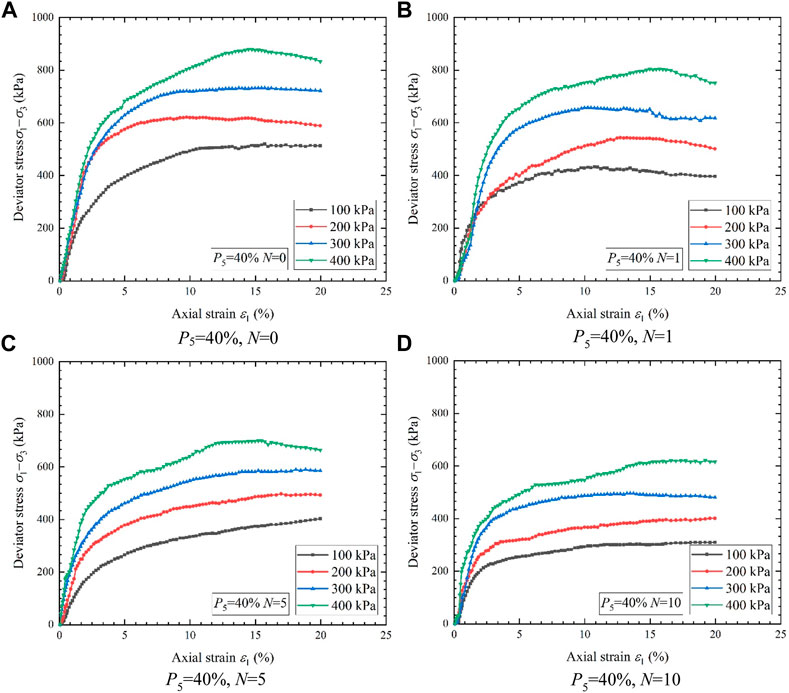
FIGURE 7. Stress-strain curve of S-RMs after I-AD circulations: (A) P5 = 40%, N = 0; (B) P5 = 40%, N = 1; (C) P5 = 40%, N = 5; (D) P5 = 40%, N = 10.
The relationship between the maximum deviator stress and I-AD circulations is shown in Figure 8, which shows significant strength attenuation. The detailed test results are given in Table 1. When the confining pressure is 100 kPa, the maximum deviator stress is reduced by 41.13%, from 513.13 to 302.08 kPa. When the confining pressure is 400 kPa, the maximum deviator stress is reduced by 30.20%, from 878.38 to 613.07 kPa. It follows that the strength attenuation of S-RMs in the early stage of I-AD circulations is obvious.
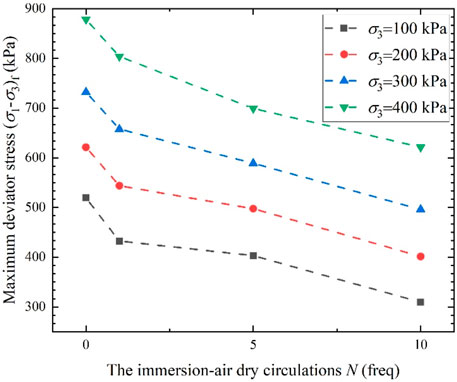
FIGURE 8. Deterioration trend of S-RMs.
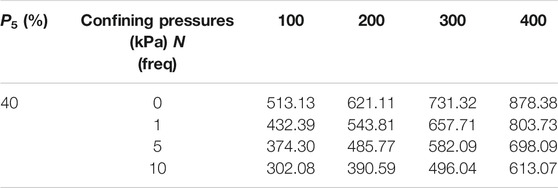
TABLE 1. Maximum deviator stress obtained by conventional triaxial test.
Changes in Meso-features
Grain composition is one of the important physical properties that directly affect the mechanical characteristics of S-RMs (Liu et al., 2020). The meso-scale study of S-RMs is reflected by grain composition, which will change with the number of I-AD circulations in this paper. During the I-AD circulations, the fine particles of S-RMs are lost in the pores between the coarse-grained skeletons with the seepage water. This phenomenon in which the fine particles are lost in enormous quantities while the coarse particles remain unchanged is called seepage erosion (Andrianatrehina et al., 2016). The characteristic indexes of S-RMs are presented in Table 2. The impact of I-AD circulations on the grain composition of S-RMs is shown in Figure 9. It is worth noting that the change in grain composition with N = 1 is not obvious, so it is not considered in this section. The non-uniformity coefficient Cu and the curvature coefficient Cc are calculated as follows:
where, d10, d30, d60 represents the particle size whose cumulative mass accounts for 10, 30, and 60% of the total mass on the particle size distribution curve.
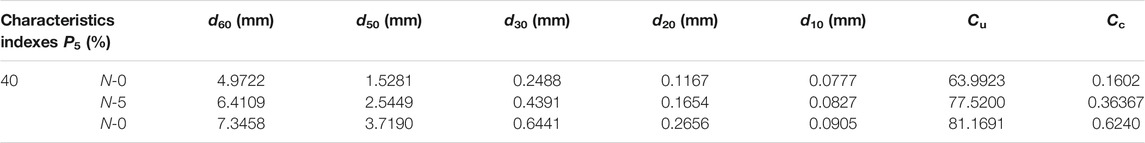
TABLE 2. Statistical results of S-RMs characteristic indexes.
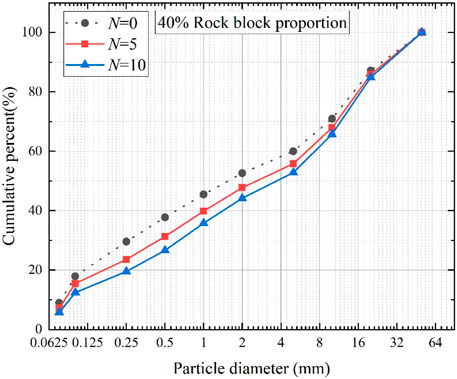
FIGURE 9. Impact of I-AD circulations on grains composition.
It can be seen from Figure 9 that as the number of I-AD circulations increases, obvious permeation erosion occurs, which is reflected in the deviation of the grain composition curve. It can be seen from Table 3 that due to the loss of fine particles, the limit size d60, average size d50, median size d30, equivalent size d20, effective size d10, non-uniformity coefficient Cu, curvature coefficient Cc increase with the increase of I-AD circulations. Thus, the changing trend shows that the poor continuity of S-RMs is caused by I-AD circulations.
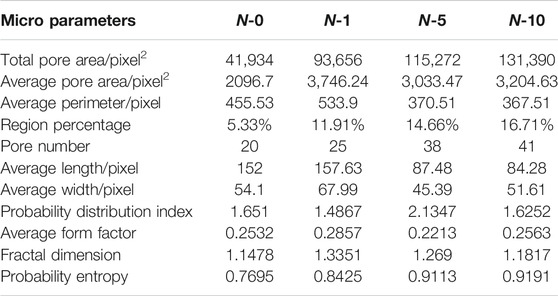
TABLE 3. Statistical results of pore characteristics.
Microstructure Analysis
The changes in the internal particle structure and composition of geomaterials are caused by I-AD circulations (Xu et al., 2020). It can be seen from SEM picture in Figure 10 that it is observed that the microstructure of S-RMs is rich in diversity. There are mainly three structures between the internal clay particles, namely the flocculent structure (Figure 10A), honeycomb structure (Figure 10B), and flake structure (Figure 10C). Coarse grains play the skeleton role, mainly showing tight, loosing, hollowed-out pore structure. In areas with more flocculated structures, the loose arrangement of internal fine grains leads to many pores between the framework structures. However, the area with more honeycomb structure has a larger pore size, which is different from the flocculated structure. The microstructure of S-RMs with the flake structure has relatively few pores between the grains in the normal direction, and occasionally there are pores of larger size. Overall, the fine grains are densely connected and geometrically stratified. On the one hand, the pores can be divided into macropore (d ≥ 75 μm), mesopore (30 ≤ d < 75 μm), micropore (5 ≤ d < 30 μm), and ultramicropore (d < 5 μm) according to the pore size (Guo and Cui 2020). On the other hand, the intergranular pores can be divided into intragranular pores, pocket pores, connected pores, and through pores (Figure 11).
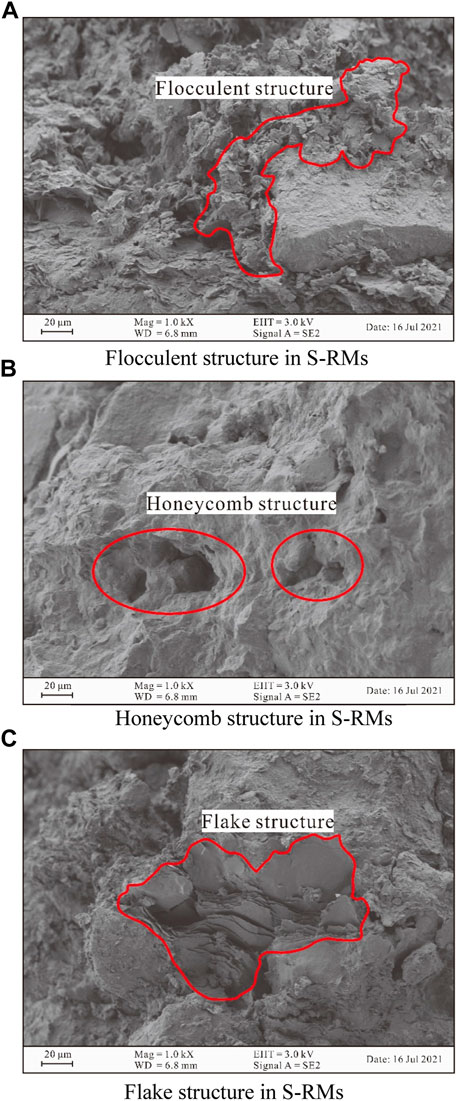
FIGURE 10. Microstructure of soil-rock mixture: (A) flocculent structure in S-RMs; (B) honeycomb structure in S-RMs; (C) flake structure in S-RMs.
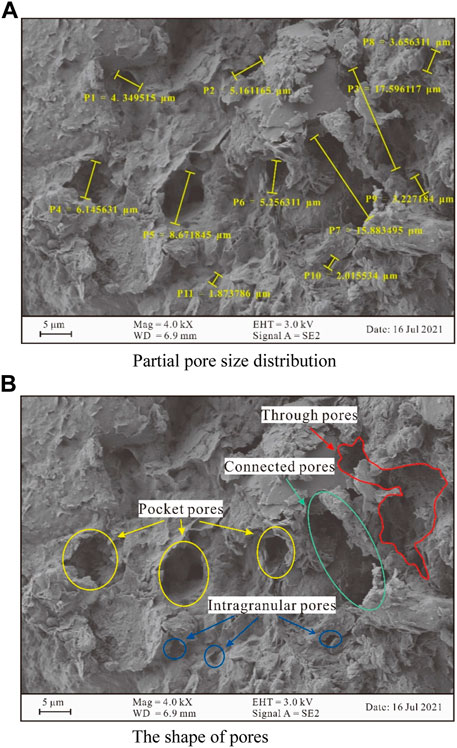
FIGURE 11. Pore size and shape characteristics: (A) partial pore size distribution; (B) the shape of pores.
The Pores (Particles) and Cracks Analysis System (PCAS) is used to identify and quantitatively analyze the characteristics of pores in the SEM image, and the principle of pore identification and statistical analysis of the PCAS has been given in detail (Liu et al., 2011). In addition, the software can be obtained at http://matdem.com/content/?603.html. Since the image resolution obtained by the SEM used in this paper is 14.4 pixels/μm, it is necessary to convert the data obtained by the PCAS software. Moreover, the conversion equations of area (S) and perimeter (C) to the actual area (St) and actual perimeter (Ct) are:
where, R is the resolution of SEM images.
The process of SEM image processing is shown in Figure 12. In the PCAS software, first adjust the threshold to obtain an acceptable binary image with plenty of dots. In binary images, white and black represent pores and soils, respectively. The results of pore identification are shown in Figures 12I–L, and different colors represent the different pores of various sizes. In this case, the pore size in S-RMs does not have a uniform shape, and the unevenness of the pore size increases after different I-AD circulations.
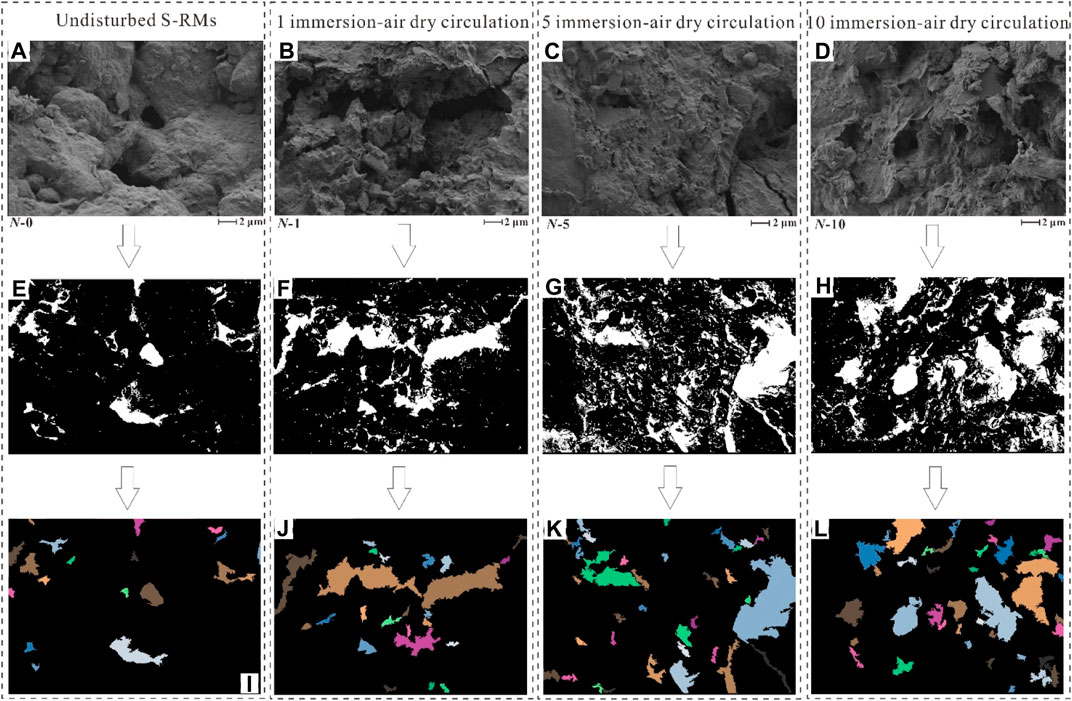
FIGURE 12. Pore recognition process: (A–D) are SEM original pictures; (E–H) are the results of binarization; (I–L) are the results of pore identification.
The statistical results of pore characteristics are given in Table 3. The actual size after conversion according to Eqs 3, 4 are shown in Table 4. In Table 4, the probability entropy was used to describe the pores’ directionality, and the probability distribution index reflects the pore area distribution. Amongst, the fractal dimension concept is developed to describe a shape, a profile, or a form in nature regardless of the complexity, and the average shape factor is used to describe the smooth degree of pores. Moreover, the statistical results of pore characteristics indicate that the total pore area has increased from 202.23 μm2 of N-0–633.63 μm2 of N-10, while the number of pores has only increased by 21. Therefore, with the increase of I-AD circulations, the pore size increases. In the process of I-AD circulations, the probability entropy also showed an increasing trend, with a change range of 14.96%. What stands out in Table 4 is that the arrangement of pores is disorderly, and the orderliness is low. It can be seen from Table 4 that after the I-AD circulations, the microstructure of S-RMs changed under the effect of water infiltration, and the total pore area increased. For a single cycle, the average pore size (including average pore area, average perimeter, average pore length, and average pore width) increases after the first cycle, while the average pore size decreases significantly after N = 5. This is due to the increase of pores from primary pores to secondary pores with increasing I-AD circulations. Therefore, in the S-RMs slope experiencing water level fluctuation, many small-sized nascent pores may be generated in S-RMs.
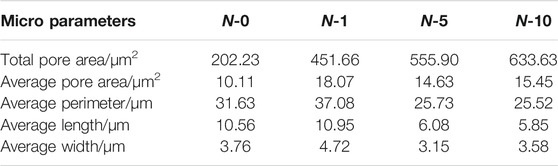
TABLE 4. Actual pore size after conversion.
Discussions
In Section Macroscopic Mechanical Characteristics, the shear strength characteristics of S-RMs after I-AD circulations are discussed, and the strength deterioration law of S-RMs is obtained. The degradation of the strength parameter by I-AD circulations will be discussed in this section.
An exponentially functional empirical formula is proposed to predict damage features of altered rock subjected to drying-wetting cycles, and obtained more accurate fitting results in the prediction of peak strength and elastic modulus (Qin et al., 2018). A more detailed strength parameter discussion of S-RMs after I-AD circulations is given in this section. Whereby, the strength parameter deterioration evolution equation is established according to the characteristics of data distribution. For strength parameters calculation, the Mohr circle under four confining pressures was obtained by Mohr-Coulomb theory (Consoli et al., 2013). The cohesion c, internal friction angle φ are taken as the x-axis, and N is the y-axis to show the deterioration law in Figures 13, 14. The strength parameter deterioration equation can be written as:
where, c0 and φ0 represent the initial cohesion and initial internal friction angle when N = 0; N is the number of I-AD circulations.
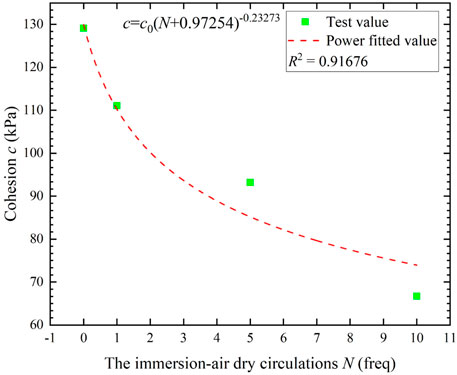
FIGURE 13. Cohesive deterioration evolution curve of S-RMs.

FIGURE 14. Internal friction angle deterioration evolution curve of S-RMs.
The Eqs 5, 6 reveals that the cohesion c of S-RMs subjected to I-AD circulations is related to c0, which can be written as c = f (c0, N); φ is a function related to φ0 and N, which can be written as φ = f (φ0, N). It can be seen from Figures 13, 14 that the shear strength is affected by I-AD circulations. Whereby, c and φ decrease with the increase of I-AD circulations, and the initial decrease is larger.
The deterioration law shown in each stage is different, so Di is defined as the total deterioration degree. Di is expressed as:
where, c0 and φ0 are the initial cohesion and the initial internal friction angle of S-RMs; ci and φi are the cohesion and the internal friction angle of S-RMs in the ith test stage.
The deterioration degree in a specific stage in the test designed is expressed as ΔDi. ΔDi can be written as:
where, Di-1 is the test deterioration degree of the previous stage of the ith stage.
In the ith stage, the single-cycle deterioration degree DNi can be expressed as:
where, Ni is the test deterioration degree of the ith stage; Ni-1 is the deterioration degree of the previous stage of the ith stage.
The deterioration analysis of the cohesion and internal friction angle of S-RMs after I-AD circulations is given in Table 5 and Table 6. After the first test, S-RMs samples have undergone severe deterioration. Moreover, the deterioration of cohesion c and internal friction angle φ gradually deepened with more I-AD circulations. After ten I-AD circulations, the deterioration of c and φ reached 48.35 and 9.61%, respectively. It is worth noting that as the cycle increase, the deterioration caused by a single cycle gradually becomes weaker. The DNi of c decreases from 21.72 to 4.104%, and the DNi of φ decreases from 3.36 to 0.336%. It could be argued that the significant physical and chemical deterioration effects of S-RMs were due to I-AD circulations. Of these, c and φ are significantly affected, and the changes show a rapid and substantial reduction trend. With the increase of the number of actions and the extension of the test time, the physical and chemical damage effects of the water-rock interaction to the rock decrease (Yan et al., 2020). Therefore, the cohesion is less affected and the change tends to be flat.
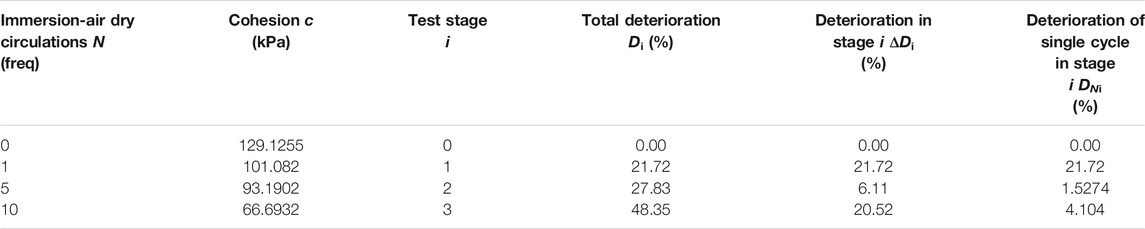
TABLE 5. Cohesive deterioration analysis by I-AD circulations.
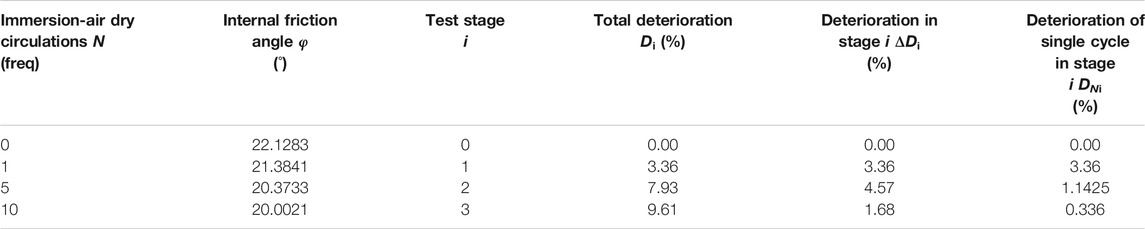
TABLE 6. Internal friction angle deterioration analysis by immersion-air dry circulations.
After repeated immersion and air drying in nature, the rocks or soils will eventually be weathered and decomposed into mud or silt without cohesion (Price 1995; Marques et al., 2017; Okewale and Coop 2017). It can be seen from Eq. 5 that as the cycles increases, c eventually decreases to 0 kPa. Similarly, it can be seen from Eq. 6 as the cycles approach infinity, φ will approach 0.9032φ0. The strength parameter deterioration evolution equation revealed that S-RMs would decompose weathering into silt with an angle of repose of 0.9032φ0 after a certain number of I-AD circulations (Nuca et al., 2021).
Conclusion
A multiscale study was carried out on S-RMs after immersion-air dry circulations. Conventional triaxial test, immersion-air dry test, and SEM were used to analyze the physical characteristics, mechanical characteristics, meso-particle composition, and micro-pore structure of S-RMs. Moreover, the strength parameter deterioration evolution equation is established to facilitate practical engineering applications. The conclusions obtained are as follows:
(1) The strength of soil-rock mixtures is strongly associated with I-AD circulations, which caused the significant deterioration in the shear strength of S-RMs. Moreover, the maximum deviator stress decreased as the number of cycles increased.
(2) Due to the repeated immersion of S-RMs, water infiltration causes a significant amount of loss of fine grains in S-RMs. Therefore, I-AD circulations lead to changes in the grain composition of S-RMs, and with the increase of cycles, the characteristics grain size and the non-uniformity coefficient increase significantly. In addition, S-RMs shows significant discontinuity.
(3) Through the processing of SEM images, the micro-evolution law and pore characteristics of S-RMs after I-AD circulations are analyzed. As cycles increases, the number of microscopic pores and probability entropy increase. These findings suggest that the arrangement of the pores becomes more and more disorderly, and the orderliness is reduced.
(4) The evolution equation describing the strength parameters deterioration of S-RMs is established. Whereas, the principal theoretical implication of the evolution equation is that when the number of cycles approaches infinity, S-RMs will decompose weathering into silt with cohesion c = 0 kPa and angle of repose φ = 0.9032φ0.
Data Availability Statement
The raw data supporting the conclusion of this article will be made available by the authors, without undue reservation.
Author Contributions
SZ: Conceptualization, Methodology, and Writing—original draft. LL: Methodology discussions and Funding acquisition. YQ: Conceptualization and Funding acquisition. XX: Writing- revising draft. SL: Writing- revising draft and Project administration. LC: Writing- revising draft.
Funding
This work was supported by the Scientific and Technological Research Program of Chongqing Municipal Education Commission (Grant Nos. KJQN202001218 and KJQN202101206), the Open fund of Chongqing Three Gorges Reservoir Bank Slope and Engineering Structure Disaster Prevention and Control Engineering Technology Research Center (No. SXAPGC21ZD01), the Science and technology innovation project of Chongqing Wanzhou District Bureau of science and technology (No. wzstc20210305), Research-development and application of “big data intelligent prediction and early warning cloud service platform for geological disasters in the Three Gorges Reservoir Area” of Chongqing Municipal Education Commission (No. HZ2021012), Special key program of Chongqing Technology Innovation and Application Development (Grant No. cstc2019jscx-tjsbX0015), Chongqing Huanjiang structure disaster prevention and reduction theory and key technology” of Chongqing University Innovation Research Group (No. 201928).
Conflict of Interest
The authors declare that the research was conducted in the absence of any commercial or financial relationships that could be construed as a potential conflict of interest.
Publisher’s Note
All claims expressed in this article are solely those of the authors and do not necessarily represent those of their affiliated organizations, or those of the publisher, the editors and the reviewers. Any product that may be evaluated in this article, or claim that may be made by its manufacturer, is not guaranteed or endorsed by the publisher.
References
Al-Dakheeli, H., and Bulut, R. (2019). Interrelationship between Elastic Deformation and Soil-Water Characteristic Curve of Expansive Soils. J. Geotech. Geoenviron. Eng. 145 (4), 04019005. doi:10.1061/(asce)gt.1943-5606.0002020
Andrianatrehina, L., Souli, H., Rech, J., Taibi, S., Fry, J.-J., Ding, L., et al. (2016). Analysis of the Internal Stability of Coarse Granular Materials According to Various Criteria. Eur. J. Environ. Civil Eng. 20 (8), 936–953. doi:10.1080/19648189.2015.1084385
Consoli, N. C., Consoli, B. S., and Festugato, L. (2013). A Practical Methodology for the Determination of Failure Envelopes of Fiber-Reinforced Cemented Sands. Geotextiles and Geomembranes 41, 50–54. doi:10.1016/j.geotexmem.2013.07.010
Deng, H., Zhang, Y., Zhi, Y., Duan, L., Li, J., Sun, X., et al. (2019). Sandstone Dynamical Characteristics Influenced by Water-Rock Interaction of Bank Slope. Adv. Civil Eng. 2019, 1–11. doi:10.1155/2019/3279586
Fan, Y., Zheng, M., and Wu, J. (2021). April)Experimental Research on Shear Strength Characteristics of Unsaturated Coal-Bearing Soils under Dry-Wet CirculationIOP Conference Series: Earth and Environmental Science. IOP Publishing 719 (No. 4), 042068. doi:10.1088/1755-1315/719/4/042068
Gallage, C., and Uchimura, T. (2016). Direct Shear Testing on Unsaturated Silty Soils to Investigate the Effects of Drying and Wetting on Shear Strength Parameters at Low Suction. J. Geotech. Geoenviron. Eng. 142 (3), 04015081. doi:10.1061/(asce)gt.1943-5606.0001416
Gao, W.-w., Gao, W., Hu, R.-l., Xu, P.-f., and Xia, J.-g. (2018). Microtremor Survey and Stability Analysis of a Soil-Rock Mixture Landslide: a Case Study in Baidian Town, China. Landslides 15 (10), 1951–1961. doi:10.1007/s10346-018-1009-x
Goh, S. G., Rahardjo, H., and Leong, E. C. (2014). Shear Strength of Unsaturated Soils under Multiple Drying-Wetting Cycles. J. Geotech. Geoenviron. Eng. 140 (2), 06013001. doi:10.1061/(asce)gt.1943-5606.0001032
Guo, C., and Cui, Y. (2020). Pore Structure Characteristics of Debris Flow Source Material in the Wenchuan Earthquake Area. Eng. Geology. 267, 105499. doi:10.1016/j.enggeo.2020.105499
Ji, X., Li, J., Cui, Z., Li, S., Xiong, Y., Hu, J., et al. (2020). A Prediction Method for the California Bearing Ratio of Soil-Rock Mixture Based on the Discrete Element Method and CT Scanning. Adv. Civil Eng. 2020, 1–12. doi:10.1155/2020/9794756
Jiang, J.-w., Xiang, W., Rohn, J., Zeng, W., and Schleier, M. (2015). Research on Water-Rock (Soil) Interaction by Dynamic Tracing Method for Huangtupo Landslide, Three Gorges Reservoir, PR China. Environ. Earth Sci. 74 (1), 557–571. doi:10.1007/s12665-015-4068-5
Jiang, Q., Deng, H., Li, J., Luo, Z., Assefa, E., Fang, J., et al. (2019). The Degradation Effect and Mechanism by Water-Rock Interaction in the Layered sandstone in the Three Gorges Reservoir Area. Arabian J. Geosciences 12 (23), 1–11. doi:10.1007/s12517-019-4943-6
Li, C.-S., Zhang, D., Du, S.-S., and Shi, B. (2016). Computed Tomography Based Numerical Simulation for Triaxial Test of Soil-Rock Mixture. Comput. Geotechnics 73, 179–188. doi:10.1016/j.compgeo.2015.12.005
Li, Z., Hu, F., Qi, S., and Hu, R. (2020). Strain-softening Failure Mode after the post-peak as a Unique Mechanism of Ruptures in a Frozen Soil-Rock Mixture. Eng. Geology. 274, 105725. doi:10.1016/j.enggeo.2020.105725
Lindquist, E. S. (1994). The Strength and Deformation Properties of Melange. Berkeley: Doctoral dissertation, University of California.
Liu, C., Shi, B., Zhou, J., and Tang, C. (2011). Quantification and Characterization of Microporosity by Image Processing, Geometric Measurement and Statistical Methods: Application on SEM Images of clay Materials. Appl. Clay Sci. 54 (1), 97–106. doi:10.1016/j.clay.2011.07.022
Liu, X., Qin, H., and Lan, H. (2020). On the Relationship between Soil Strength and Wave Velocities of sandy Loess Subjected to Freeze-Thaw Cycling. Soil Dyn. Earthquake Eng. 136, 106216. doi:10.1016/j.soildyn.2020.106216
Marques, E. A. G., Williams, D. J., Assis, I. R., and Leão, M. F. (2017). Effects of Weathering on Characteristics of Rocks in a Subtropical Climate: Weathering Morphology, In Situ, Laboratory and Mineralogical Characterization. Environ. Earth Sci. 76 (17), 1–17. doi:10.1007/s12665-017-6936-7
Medley, E. W. (1994). The Engineering Characterization of Melanges and Similar Block-In-Matrix Rocks (Bimrocks). Berkeley): Doctoral dissertation, University of California.
Meng, Q., Wang, H., Xu, W., and Zhang, Q. (2018). A Coupling Method Incorporating Digital Image Processing and Discrete Element Method for Modeling of Geomaterials. Engineering Computations.
Miao, F., Wu, Y., Li, L., Tang, H., and Xiong, F. (2020). Weakening Laws of Slip Zone Soils during Wetting-Drying Cycles Based on Fractal Theory: a Case Study in the Three Gorges Reservoir (China). Acta Geotech. 15 (7), 1909–1923. doi:10.1007/s11440-019-00894-8
Ng, C. W. W., and Leung, A. K. (2012). Measurements of Drying and Wetting Permeability Functions Using a New Stress-Controllable Soil Column. J. Geotech. Geoenviron. Eng. 138 (1), 58–68. doi:10.1061/(asce)gt.1943-5606.0000560
Nsabimana, G., Bao, Y., He, X., Nambajimana, J. D. D., Wang, M., Yang, L., et al. (2020). Impacts of Water Level Fluctuations on Soil Aggregate Stability in the Three Gorges Reservoir, China. Sustainability 12 (21), 9107. doi:10.3390/su12219107
Nuca, R., Giudice, A. L., and Preziosi, L. (2021). Degenerate Parabolic Models for Sand Slides. Appl. Math. Model. 89, 1627–1639. doi:10.1016/j.apm.2020.08.018
Okewale, I. A., and Coop, M. R. (2017). A Study of the Effects of Weathering on Soils Derived from Decomposed Volcanic Rocks. Eng. Geology. 222, 53–71. doi:10.1016/j.enggeo.2017.03.014
Price, D. G. (1995). Weathering and Weathering Processes. Q. J. Eng. Geology. Hydrogeology 28 (3), 243–252. doi:10.1144/gsl.qjegh.1995.028.p3.03
Qin, Z., Chen, X., and Fu, H. (2018). Damage Features of Altered Rock Subjected to Drying-Wetting Cycles. Adv. Civil Eng. 2018, 1–10. doi:10.1155/2018/5170832
Shan, P., and Lai, X. (2019). Mesoscopic Structure PFC∼2D Model of Soil Rock Mixture Based on Digital Image. J. Vis. Commun. Image Representation 58, 407–415. doi:10.1016/j.jvcir.2018.12.015
Wang, J. J., Zhang, J., Qiu, Z.-F., and Zhang, H.-P. (2019). Effects of Periodic Saturation on Stress-Strain Relationship of a sandstone Mixture. Mar. Georesources Geotechnology 37 (1), 109–115. doi:10.1080/1064119x.2018.1512177
Wang, J.-J., Qiu, Z.-F., Bai, J., Yu, C., and Liu, M.-W. (2018). Deformation of a sandstone-mudstone Particle Mixture Induced by Periodic Saturation. Mar. Georesources Geotechnology 36 (4), 494–503. doi:10.1080/1064119x.2017.1340375
Wang, L., Yin, Y., Huang, B., Zhang, Z., Zhao, P., and Wei, Y. (2020). A Study of the Treatment of a Dangerous Thick Submerged Rock Mass in the Three Gorges Reservoir Area. Bull. Eng. Geology. Environ. 79, 1–12. doi:10.1007/s10064-020-01724-y
Wang, Y., Wei, X. M., and Li, C. H. (2019). Dynamic Behavior of Soil and Rock Mixture Using Cyclic Triaxial Tests and X-ray Computed Tomography. Arabian J. Geosciences 12 (7), 1–16. doi:10.1007/s12517-019-4399-8
Wang, Y., and Hu, Y. Z. (2021). Using X-ray Computed Tomography to Investigate the Effect of Confining Pressure on Meso-Structural Changes and Crack Damage Evolution in Soil and Rock Mixture during Triaxial Deformation. Eur. J. Environ. Civil Eng. 25 (4), 757–772. doi:10.1080/19648189.2018.1550684
Xu, J., Li, Y., Ren, C., and Lan, W. (2020). Damage of saline Intact Loess after Dry-Wet and its Interpretation Based on SEM and NMR. Soils and Foundations 60 (4), 911–928. doi:10.1016/j.sandf.2020.06.006
Xu, W.-j., Yue, Z.-q., and Hu, R.-l. (2008). Study on the Mesostructure and Mesomechanical Characteristics of the Soil-Rock Mixture Using Digital Image Processing Based Finite Element Method. Int. J. Rock Mech. Mining Sci. 45 (5), 749–762. doi:10.1016/j.ijrmms.2007.09.003
Xu, W. J., Xu, Q., and Hu, R. L. (2011). Study on the Shear Strength of Soil–Rock Mixture by Large Scale Direct Shear Test. Int. J. Rock Mech. Mining Sci. 48 (8), 1235–1247.
Yan, B., Guo, Q., Ren, F., and Cai, M. (2020). Modified Nishihara Model and Experimental Verification of Deep Rock Mass under the Water-Rock Interaction. Int. J. Rock Mech. Mining Sci. 128, 104250. doi:10.1016/j.ijrmms.2020.104250
Yang, X., Wang, J., Hou, D., Zhu, C., and He, M. (2018). Effect of Dry-Wet Cycling on the Mechanical Properties of Rocks: a Laboratory-Scale Experimental Study. Processes 6 (10), 199. doi:10.3390/pr6100199
Yang, X., Wang, J., Zhu, C., He, M., and Gao, Y. (2019). Effect of Wetting and Drying Cycles on Microstructure of Rock Based on SEM. Environ. Earth Sci. 78 (6), 1–10. doi:10.1007/s12665-019-8191-6
Yongbo, F., Adewuyi, O. I., and Chun, F. (2015). Strength Characteristics of Soil Rock Mixture under Equal Stress and Cyclic Loading Conditions. Geosystem Eng. 18 (1), 73–77. doi:10.1080/12269328.2014.1002633
Zhang, H.-y., Xu, W.-j., and Yu, Y.-z. (2016). Numerical Analysis of Soil-Rock Mixture's Meso-Mechanics Based on Biaxial Test. J. Cent. South. Univ. 23 (3), 685–700. doi:10.1007/s11771-016-3114-0
Zhao, Z., Yang, J., Zhang, D., and Peng, H. (2017). Effects of Wetting and Cyclic Wetting-Drying on Tensile Strength of Sandstone with a Low Clay Mineral Content. Rock Mech. Rock Eng. 50 (2), 485–491. doi:10.1007/s00603-016-1087-9
Keywords: immersion-air dry circulation, multi-scale study, soil-rock mixtures (S-RM), scanning electron microscope (SEM), conventional triaxial compression (CTC)
Citation: Li L, Zhang S, Qiang Y, Xia X, Li S and Chen L (2022) Multiscale Study on Deterioration Characteristics of Soil-Rock Mixtures Under the Immersion-Air dry Circulation. Front. Earth Sci. 10:834979. doi: 10.3389/feart.2022.834979
Received: 14 December 2021; Accepted: 26 January 2022;
Published: 22 February 2022.
Edited by:
Shimin Liu, The Pennsylvania State University (PSU) University Park, United StatesReviewed by:
Hemin Yuan, China University of Geosciences, ChinaShengnian Wang, Nanjing Tech University, China
Copyright © 2022 Li, Zhang, Qiang, Xia, Li and Chen. This is an open-access article distributed under the terms of the Creative Commons Attribution License (CC BY). The use, distribution or reproduction in other forums is permitted, provided the original author(s) and the copyright owner(s) are credited and that the original publication in this journal is cited, in accordance with accepted academic practice. No use, distribution or reproduction is permitted which does not comply with these terms.
*Correspondence: Li Li, bGlseTY2MzY2OTRAMTYzLmNvbQ==