- 1School of Architecture and Urban Planning, Nanjing University, Nanjing, China
- 2Faculty of Architecture and Urban Planning, Chongqing University, Chongqing, China
- 3Beijing Tsinghua Tongheng Urban Planning and Design Institute, Beijing, China
- 4Key Laboratory of New Technology for Construction of Cities in Mountain Area, Chongqing University, Chongqing, China
On 12 May, 2008, a magnitude 7.9 earthquake struck Wenchuan County, Aba Tibetan and Qiang Autonomous Prefecture, Sichuan Province, causing substantial losses of human life and property. This paper takes ten counties and cities along the road network in the extremely severe disaster areas of the Wenchuan earthquake as research objects and extracts typical road network characteristics for 10 time points during the pre-earthquake, damage and repair processes. Then, it builds three resilience assessment indices, namely, the overall integrity, overall connectivity and effective connectivity with the complex network and resilience framework, to investigate the road network resilience. A resilience curve of the road system based on real data from the extremely severe disaster areas of the Wenchuan earthquake is obtained here for the first time, revealing the total variation characteristics and key sections of the road system in terms of resilience and proposing strategies for resilience optimization.
1 Introduction
The 2008 Wenchuan MS7.9 earthquake was one of the most devastating events in China since 1949. This earthquake affected approximately 50 km2 in Sichuan, Gansu, Shaanxi and other provinces, causing 69227 deaths and 374643 injuries as of September 181. Lifeline systems composed of roads, municipalities, communication and other key infrastructure were seriously damaged, accounting for 21.9% of the total earthquake losses (Ministry of housing and urban rural development of the people’s Republic of China, 2013). The inherent interconnected and interdependent properties of lifeline systems (Pescaroli and Alexander, 2016; Argyroudis et al., 2020) resulted in the loss of most life support functions (Aghababaei et al., 2020), which amplified the disaster and caused immense difficulties during the post-disaster rescue process. Some damaged areas had been isolated from disaster relief efforts for a long time, causing a sharp increase in casualties; such isolated areas are denoted “islands” hereinafter (Selçuk and Yücemen, 1999; Kepaptsoglou et al., 2014).
Several researchers have investigated the Wenchuan earthquake and related scientific issues, providing powerful scientific and technological security for the gradual restoration of the economic and social development in the disaster area. For example, seismologists pay close attention to the causes of earthquakes and secondary disasters such as post-earthquake landslides and barrier lakes (Parker et al., 2011; Xu et al., 2014; Xuanmei Fan, 2018). Engineering focuses on damage degree assessment and the repair of engineering systems in disaster areas (Zhang et al., 2012). Architecture and urban-rural planning focus on the post-disaster planning system (Jian, 2009; Jian and Fan, 2015; Wei and Wen, 2015), reconstruction planning assessment (Ming et al., 2011; Qiang et al., 2012), disaster prevention and reduction (Jian et al., 2008; Shifu, 2013), ecological assessment (Liu Y. J. et al., 2010), etc. Sociology and psychology follow social impact assessments of post-disaster recovery and reconstruction (Yan-Bi and Yan-Dong, 2019). However, for road systems, the relevant literature is concentrated on single roads (Li and He, 2009), the network damage distribution (Huang et al., 2009) and the road engineering structure (Zhang et al., 2012). In contrast, research on disaster prevention and the reduction of road systems from the macro-perspective, such as regional development, is insufficient.
Resilience analysis is a key research framework for disaster prevention and the reduction of regional road networks (Aydin et al., 2018; Liu et al., 2019; Aghababaei et al., 2020; Boakye et al., 2022; Lacinák, 2021; Twumasi-Boakye and Sobanjo, 2021). Resilience was originally applied in ecology (Holling, 1973), With the deepening of the research on the relevant theories of resilience, the commonly used research methods of resilience analysis include comprehensive framework quantitative evaluation and analysis method, mathematical model analysis method, computer simulation analysis method, etc. The quantitative evaluation and analysis method of comprehensive framework refers to the establishment of an analysis framework to integrate multiple analysis indicators and evaluate the research results. At present, it is mostly used in the decision-making process of engineering construction (Cimellaro et al., 2010; Aydin et al., 2018; Qiang and Xu, 2019). The mathematical model analysis method generally uses various mathematical models to describe the toughness or reliability of roads (Calvert and Snelder, 2018; Ilbeigi, 2019), which is suitable for some simple road systems. The computer simulation method mainly studies large-scale road systems with the help of computer simulation software (Okraszewska et al., 2018; Yang et al., 2018; Bellini et al., 2021), which is mostly used for regional and large-scale research. The regional road network, which is characterized by multiple nodes, complex disaster types, large quantities of data, and coupling with the artificial strategic impact (Aghababaei et al., 2020), makes the road network difficult to measure in practice. Therefore, computer simulation has been shown to be an important method of resilience analysis for large-scale networks. However, a review of resilience research on road networks suggests that the theoretical evaluation and prediction of pre-disaster times are more focused, but research on actual measurements and post-disaster restoration of road system resilience has not been conducted.
China is a mountainous country and is prone to various natural disasters. Therefore, research on the resilience evolution characteristics of mountain road networks in disaster scenarios and the promotion of innovation related to urban and rural disaster prevention and mitigation planning theory and technical methods are of great importance.
In conclusion, this research, which is based on the intersection of urban and rural planning and complex systems, builds a technical approach for “reviewing damage and repair scenes→constructing a complex network model→analysing the overall resilience curve” by taking the road network in the extremely severe disaster areas of the Wenchuan earthquake as the research object and utilizing the resilience research framework and complex network model analysis. Then, a complex network model of the road system is obtained by reconstructing the damage and repair process of the road system with different kinds of real data and extracting 10 typical time nodes. Finally, an assessment index system is developed on the basis of a theoretical framework to find a resilience evolution curve. In this manner, this study reveals the overall change characteristics of road system resilience in the Wenchuan earthquake-stricken areas under the realistic situation of extreme disasters, which can provide a scientific basis for the disaster prevention and reduction capacity of the road system in Wenchuan and other earthquake-prone areas.
2 Methods
2.1 Study Area and Object
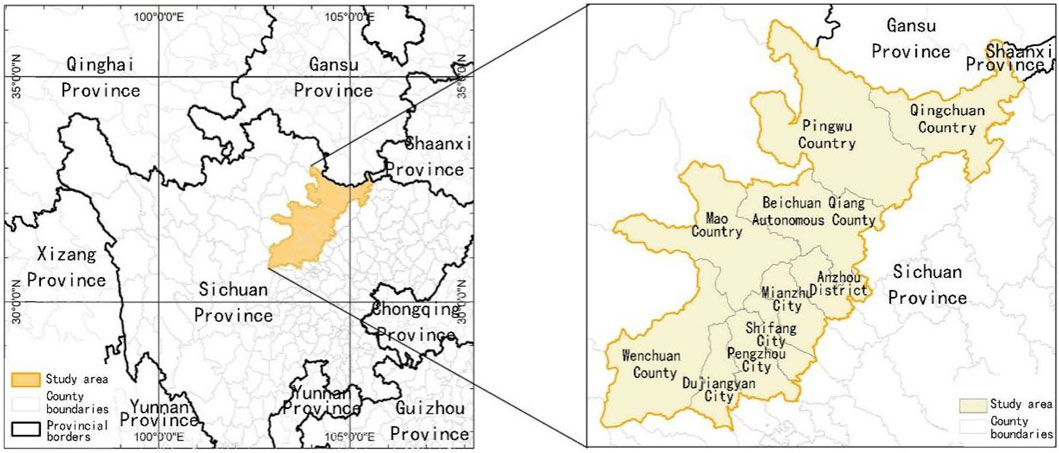
The epicentre of the Wenchuan earthquake was located in Wenchuan County, Sichuan Province, China. The earthquake affected more than half of China, in addition to many other countries and regions in Asia. Based on the comprehensive analysis of the impact on the ecological environment and the economic losses in the disaster areas, the disaster areas can be divided into extremely severe disaster areas, relatively severe disaster areas and general disaster areas2. The extremely serious disaster areas included 10 counties where the earthquake was destructive and the losses were extreme. In this paper, 10 county-level regions, including Wenchuan County, Beichuan County and Mianzhu city, were selected as study areas, as shown in Figure 1.
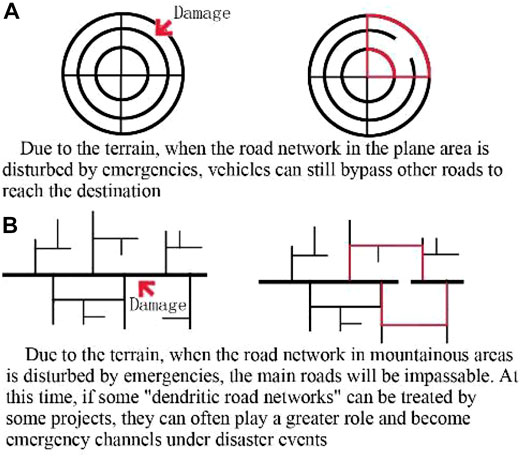
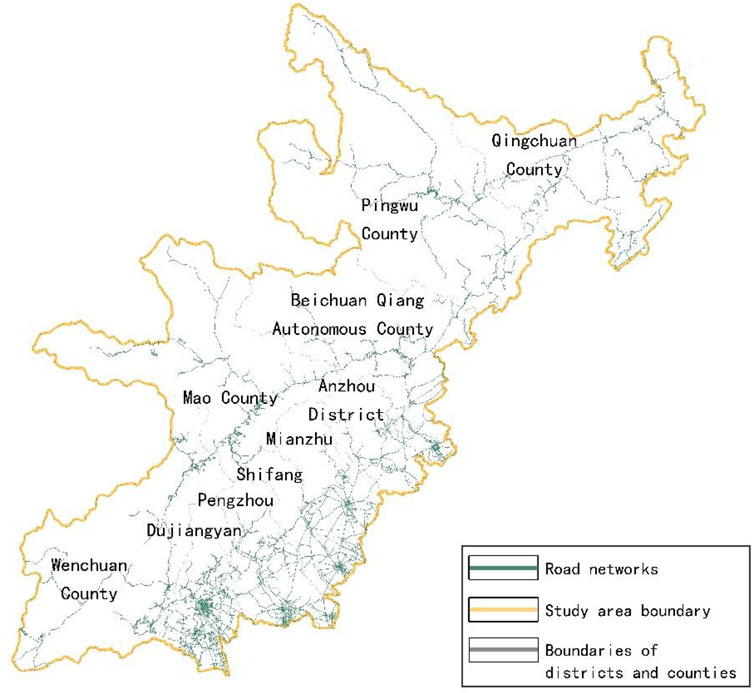
The study areas are located in the western marginal mountainous area of the Sichuan Basin. Compared with the road network in the plains area, the high-grade road network in the mountains is branched, with low density, weak connectivity and low coverage. Once damaged, the connectivity of low-grade roads becomes extremely critical. Therefore, the research object is all graded roads from national highways to rural roads in the target area as well as expressways, main roads and secondary trunk roads in urban areas, as shown in Figure 2.
2.2 Technical Route
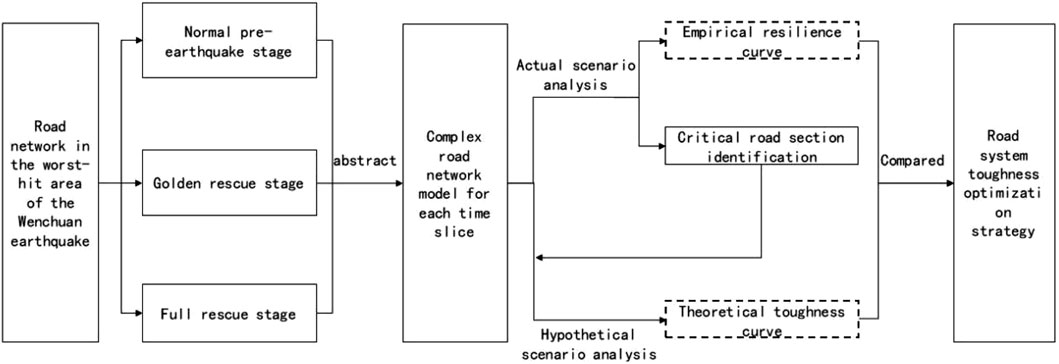
As shown in Figure 3, the technical route of the research is divided into four steps:
First, the whole process of road system damage and repair is reconstructed based on real data, and typical time nodes are extracted. Complex network analysis is used to abstract the road network system at different typical time nodes after the earthquake into a complex network model.
Second, three index systems are constructed on the basis of the theory of resilience. Resilience analysis is conducted to obtain the resilience change curve of the road network system after the actual Wenchuan earthquake, and key road sections are identified.
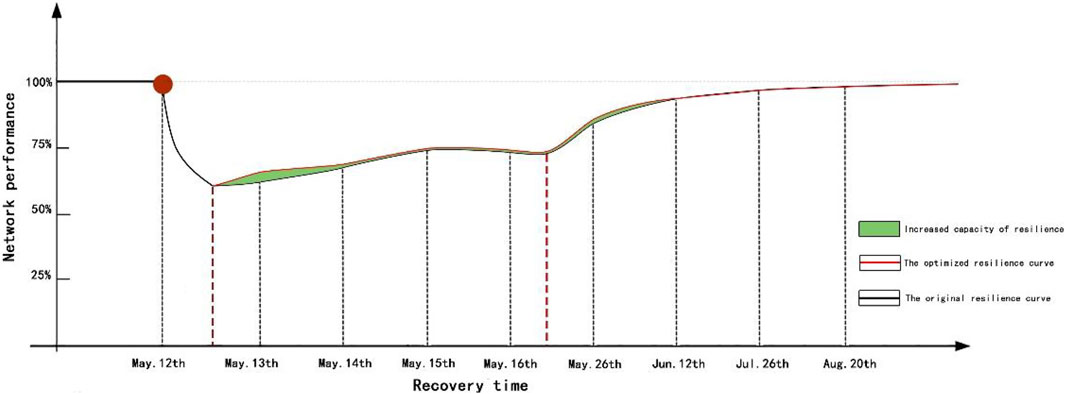
Third, inferential hypothetical calculation analysis is conducted according to the identified key sections to obtain the new resilience change curve if key sections of the road network system are recovered first.
In the third and fourth steps, empirical curves supported by real data are compared with theoretical curves obtained via hypothetical inferential calculations to obtain strategies and suggestions for road system resilience optimization (Figure 3).
2.3 Simulation of Damaged Road Repair
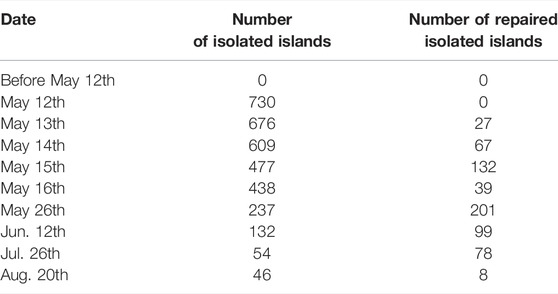
Generally, post-earthquake relief can be divided into four stages: an emergency rescue stage lasting 7 days, an emergency rescue stage lasting 30 days, a recovery stage lasting 6 months and a reconstruction stage lasting several years. According to the specific situation of the Wenchuan earthquake, the process can be divided into two stages: the golden window and full-scale rescue. To illustrate the evolution of road network resilience, the road network during the normal period before the earthquake is taken as a reference. Therefore, including the initial road network (the road network without earthquakes), a total of 10 time points, as shown in Table 1, from both before and after the earthquake are selected to simulate the disaster damage and repair process.
The pre-earthquake road network data are obtained from local disaster prevention records, public government data, high-precision remote sensing images and other sources. The road damage and repair data at different time points are extracted from government work reports, reconstruction planning after the Wenchuan earthquake, and high-precision remote sensing imaging data. In particular, we can obtain very detailed relevant data from the book “Earthquake relief records of Wenchuan earthquake” that was organized and prepared by the Chinese government, for details of this set of books, please refer to the website: https://www.sc.gov.cn/10462/10464/10797/2018/5/7/10450303.shtml. To ensure accuracy, the data are compared with years of news reports and field research in Figures 4–6.
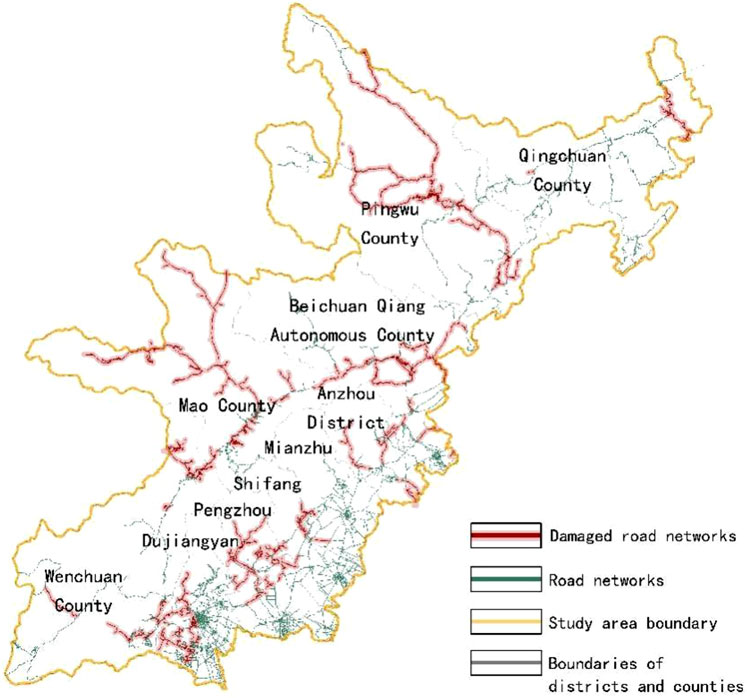
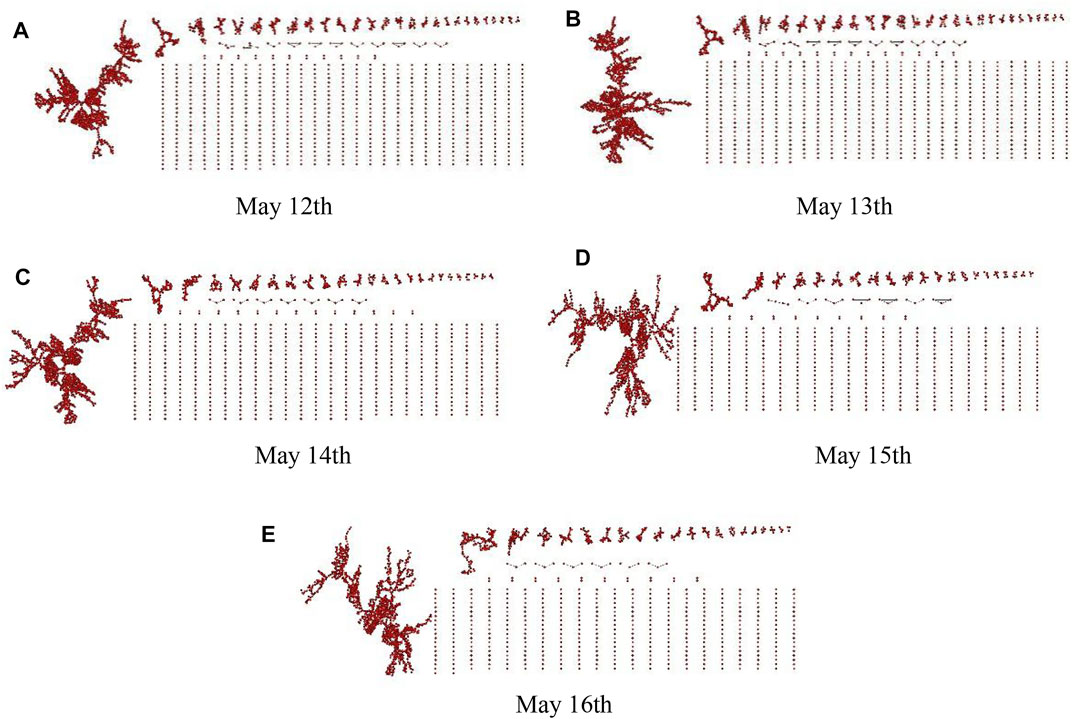
FIGURE 5. Schematic representation of the damaged road network when repaired during the golden window.
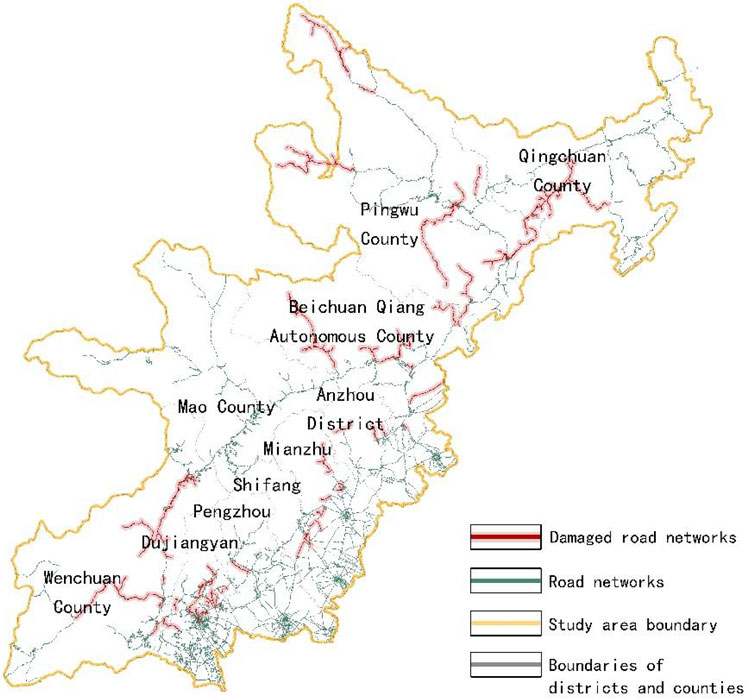
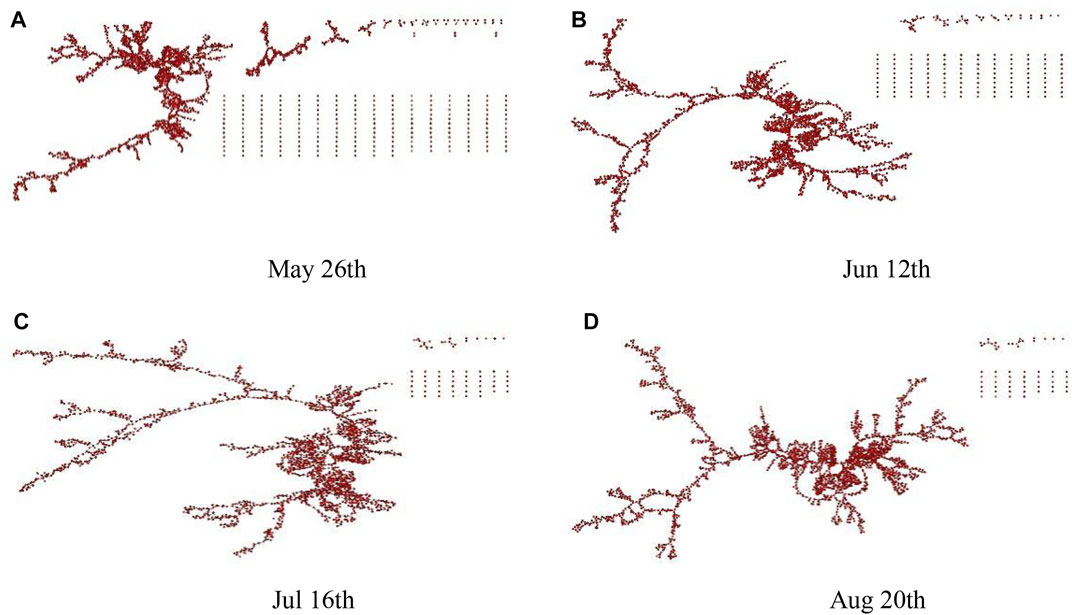
FIGURE 6. Schematic representation of the damaged road network when repaired during full-scale rescue.
2.4 Constructing a Complex Network Model of the Road System
Using the complex network theory to analyze the characteristics of the regional highway system, firstly, the highway system needs to be abstracted as a topological network diagram composed of points and connections between points, that is, the complex network analysis method is used to build the road network model of the study area. At present, the construction methods of road traffic complex network model mainly include original mapping method (Porta et al., 2006) and the dual mapping method (Porse, 2016). The original mapping method refers to modeling according to the actual situation. The intersection is the point in the network, and the road section is the edge of the network. This method is suitable for small networks. When the network is large, it is unable to make a corresponding analysis. The dual mapping method regards the road section as a point and the intersection as the edge of the network. This method is suitable for analyzing complex networks, and its actual length can be ignored, which can reflect the topology characteristics of the network. Compared with the original mapping method, the dual mapping method can better reveal the complex topology characteristics of the road system. At the same time, due to the complexity of the traffic network in the study area, the dual mapping method is adopted for modeling.
Therefore, the construction idea of the complex network model of the road system is: according to the rules of the complex network model constructed by the dual mapping method, the road section is regarded as the “node” in the network, and the intersection of each section is regarded as the “edge” in the network, so as to abstract an undirected network. The complex network model of the road system in the research target area at different stages of disaster is constructed on the pajek software platform (Figures 7–9).
2.5 Constructing a System Resilience Measurement Index
According to the resilience analysis framework by Michel Bruneau (2012), system resilience includes four factors: robustness, rapidity, redundancy, and diversity. In a disaster scenario, resilience also includes the ability of the system to coordinate different components to restore actions and the system’s ability to perceive threats and make rapid changes and flexible adaptations to maintain overall performance (Davoudi, 2008; Allan and Bryant, 2011; Sharifi and Yamagata, 2014). Redundancy and diversity are generally used to express the system’s ability to handle disasters, which is the inherent resilience of the system, while robustness and rapidity refer to the system’s ability to resist, absorb and adapt to disasters and restore the basic structure and functions, which is the system’s adaptive resilience.
In complex network analysis, the network density indicator measures the relationships among nodes and edges in a complex network model as well as the redundancy and diversity of network connectivity, which can be used to characterize the inherent resilience of a system. Moreover, the maximum connectivity subgraph indicator represents the ability of the network to maintain overall connectivity after being disturbed, which is represented by the robustness of the network. Additionally, the network efficiency indicator represents the efficiency of information transmission within the network, which is represented by the rapidity of the network. These indicators can be used to express the adaptive resilience of a system (Wang et al., 2011; Ducruet and Zaidi, 2012; Cats et al., 2017; Saberi et al., 2017).
2.5.1 Inherent Resilience
A higher degree of road system integrity indicates more “choices” from one road section to another. This integrity is one of the most important measures of the diversity of road system connectivity, which can be measured by network density indicators.
The formula is as follows:
In formula (1), p is the density of the network, L is the number of connections that actually exist within the network, and N is the number of nodes that actually exist within the network. The greater the network density is, the more complete the connections between nodes in the network.
2.5.2 Adaptive Resilience
Under disaster scenarios, specific road sections are damaged and fractured, which weakens the connectivity of the entire system. In extreme cases, the system can be split into multiple disconnected road network subsystems to form disaster relief islands. The maximum connectivity subgraph index can be used to measure the overall connectivity of the road system.
The formula is as follows:
In formula (2), N′ represents the number of nodes in the largest connected subgraph of the network, and N represents the total number of nodes in the network. In a complex network analysis, “overall network connectivity” means that when the network is in a state of interference damage, the remaining structure is maintained. In terms of maintaining a connected network, the larger the maximum connected subgraph size is, the better the overall connectivity of the network.
Damage to specific road sections can cause the connecting path between two points to become longer, increasing the average path between the two points and reducing the overall connection efficiency of the road system. The network efficiency E is used to measure the ability of the network to efficiently connect nodes under interference conditions.
The formula is as follows:
In formulas (3) and (4), εij represents the efficiency between any two nodes vi and vj in the network, and dij represents the distance between these nodes. The higher the network efficiency is, the stronger the connectivity.
3 Results
3.1 Inherent Resilience
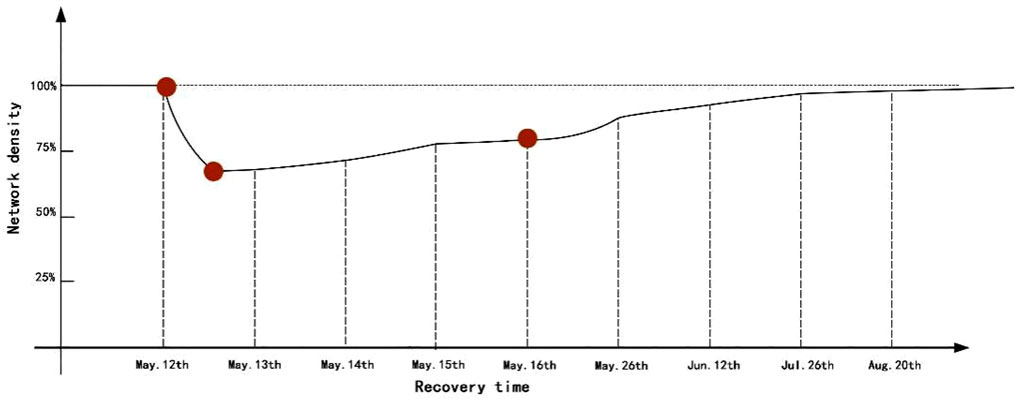
Figure 10 shows that the network density of the road system decreased by 32.94% on May 13th, recovered by 3.13% on May 14th, recovered by 6.67% on May 15th, and decreased by 1.44% on May 16th. Network density represents the closeness of network connections; that is, the more connections there are before each point in the network, the greater the network density. Therefore, this finding shows that during May 16, there are many sections without branches for emergency repair; that is, the rush time continues on to repair along with the main roads and there are relatively few branches on both sides of the road, resulting in a decrease in the overall network density. This volatility indicates that there are few redundant sections in the road system, and some sections play a greater role in the connectivity of the road network. After these sections were repaired, the system performance recovered faster.
3.2 Adaptive Resilience
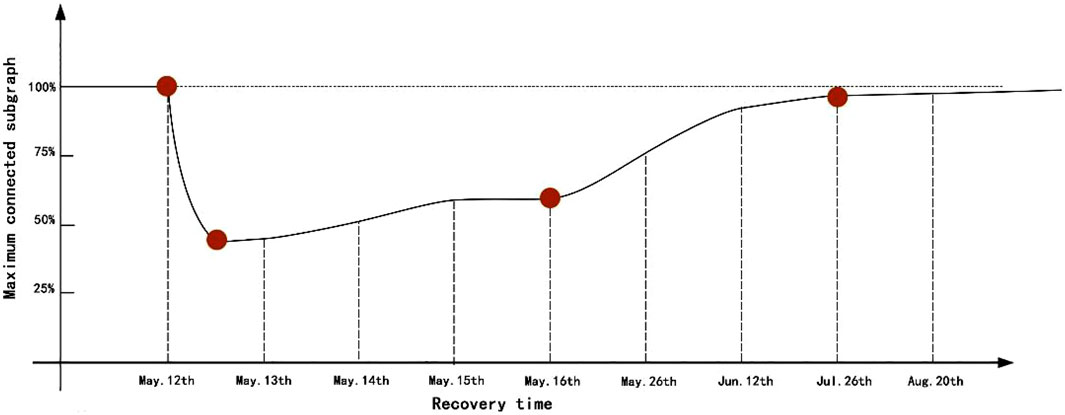
Figure 11 shows that the maximum connected subgraph index dropped by 56.38% after the earthquake and changed dramatically. However, it recovered by 14.8% from May 12th to May 15th, an average of 4.93% per day. The performance of the system recovered only 0.47% from May 15th to May 16th. The sections repaired from May 12th to May 15th are connected to isolated disaster relief islands (Table 2) and other sections (Figure 11).
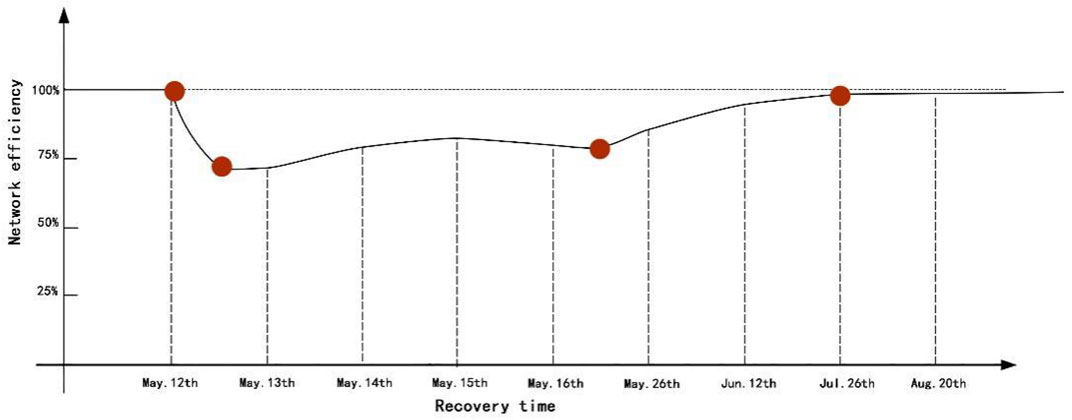
The network efficiency index decreased by 27.99% after the earthquake and shows little change compared with the index for the maximum connected subgraph. Before May 16th, Figure 12 shows an upwards trend, which then decreased and later increased slowly.
3.3 Overall Resilience
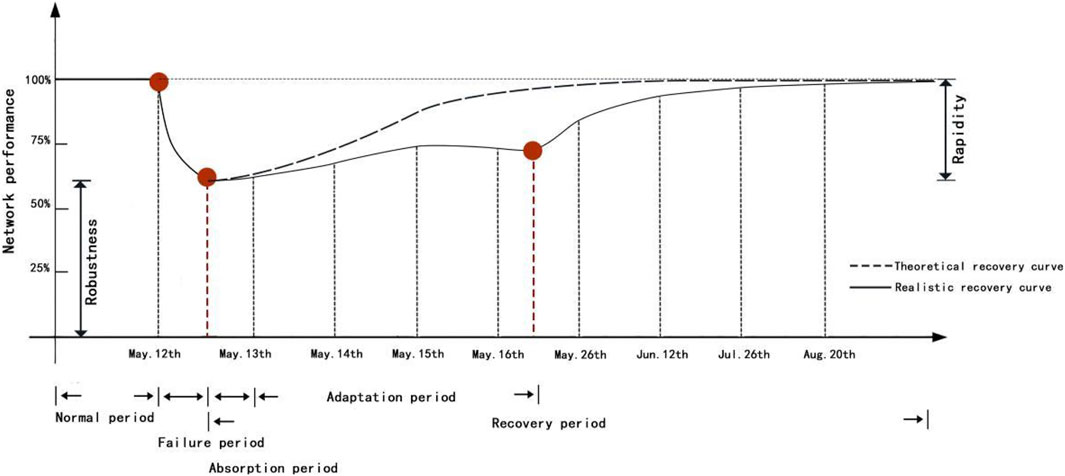
According to the results in Figure 13, the resilience curve for the road system in the extremely severe disaster areas of the Wenchuan earthquake is obtained by combining the three indices with equal weights to reflect the inherent and adaptive resilience of the road system. The data show that the connectivity of the road network declined sharply to 39.1% after the May 12th earthquake. From May 13th to 15th, the connectivity increased rapidly, increasing by 18% in total and 5.8–6% per day. After May 16th, the connectivity continued to increase slowly.
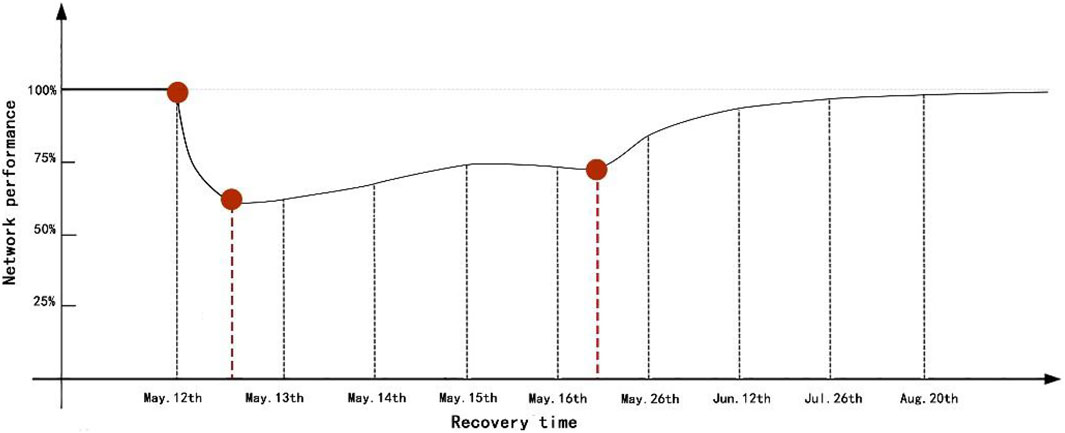
FIGURE 13. Road network resilience curve in the extremely severe disaster areas of the Wenchuan earthquake.
4 Discussion
4.1 Proposal for the Resilience Curve of Transportation System in Mountainous Disaster Area
Using scenario reconstruction and a retrospective study of the Wenchuan earthquake research target area, this paper shows the post-disaster road toughness capacity curve for the first time (as shown in Figure 14). At a time after the earthquake on May 12, due to the instantaneous damage of the earthquake, the systematic performance of the road network changed dramatically, decreasing by 39.1%, This is the failure period. But after a short time, the system produced a small amount of self-rescue behavior (i.e., internal personnel began to organize a rescue), and the road network performance began to rise slowly, up by approximately 0.87%, This is the absorption period, that is, the system is undergoing unorganized self-recovery. On May 13, due to the recovery measures taken outside the system, the system performance recovered rapidly, and the system performance recovered by an average of 6% every day. It is worth noting that from May 14 to May 15, the road network performance increased by 5.8%, but from May 15 to May 16, the road network performance decreased by approximately 0.2%. The road network performance fluctuated from May 14 to May 26, and the lowest point of continuous decline in performance occurred from May 16 to May 26, this is the adaptation period. At this time, the system already knows how to restore performance. This pattern is different from that of other natural systems (without artificial participation), and it is a rescue curve with post-disaster rescue and recovery as the main body. Based on this, the resilience curve of the road network in the research target area is drawn, which supplements the infrastructure resilience curve in the existing literature. The resilience curve obtained through the above analysis can provide an objective quantitative standard for the evaluation of the toughness capacity and the disaster resistance of the road system in a disaster-prone area.
4.2 Optimization of the Resilience Curve
4.2.1 Identification of Key Sections
The factors affecting the overall resilience of the road system are very complex, and the connectivity of some sections is a key factor. Previous studies have shown that in a complete road system when some sections are damaged, the connectivity of the whole system will be reduced rapidly, and the road system will be divided into traffic islands of different sizes, which will seriously affect the post-disaster rescue. Therefore, identifying these key sections will be of great significance to the safety of the whole road system.
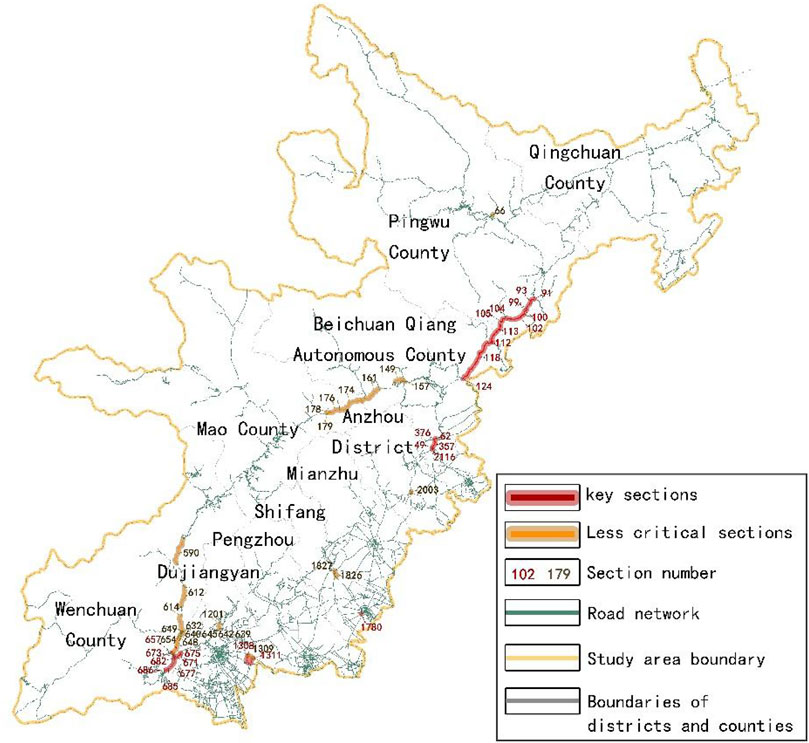
The natural break point method is used to divide the changes in value of the three indicators into three groups, including declines of more than 3.2%, 3.2%–2% and less than 2%. That is, in Figures 12, 13, the whole network’s overall connectivity and high-efficiency connectivity decline rate of more than 3.2% after damage are classified as key sections, and the whole network’s overall connectivity and high-efficiency connectivity decline rate of 2–3.2% after damage are classified as relatively critical sections. Sections with decreases of more than 3.2% and decreases of 3.2–2% are key sections and relatively critical sections, respectively, corresponding to the visualization at the real scene (Figure 15).
4.2.2 Inferential Hypothetical Calculation Analysis
In contrast, if the connectivity of these sections can be protected to the maximum extent or repaired as soon as possible after damage, the resilience of the whole road system can be enhanced. As mentioned above, the research team obtained some key sections through analysis, and then the research team tried to use these key sections for some hypothetical calculations.
The calculations in Figure 16 show that if the key sections numbered 1322, 1569, and 1570 in Pengzhou and 1914 in Mianzhu were repaired immediately after the earthquake (May 12th-13th), the overall resilience of the road system would be improved by 2.47% (May 13th), 1.11% (May 14th-15th) and 1.04% (May 16th-26th), respectively. Perhaps we just restored a little bit of the function of the road network in the chart, but the value behind this restoration is very high. It directly reduced the loss of life and property of the people in the disaster area, and it only repaired a few road sections.
4.2.3 Summary of the Concept of Resilience in Mountainous Disaster Areas
With the change in the natural environment, the frequency of natural disasters is increasing day by day, which has a great impact on the transportation system, thus affecting the economic and social development and the safety of people’s lives and property. Therefore, this paper summarizes the connotation of the mountain transportation system, to improve the operability of the above concept. The concept is summarized as follows: the first is robustness, which indicates the degree of system function maintained, that is, the ability of the system itself to resist the impact of disasters, such as planning a variety of traffic facilities with similar functions, to achieve the purpose of failure in one place and timely supplement in the other. The second is rapidity, that is, the time required to restore the complete system operation and productivity, such as identifying key sections, focusing on protection at ordinary times, organizing rescue forces to repair key sections first after disasters, etc.
4.2.4 Strategies for Improving the Resilience of Transportation System in Mountainous Disaster Areas
Therefore, the difference in the risk level of different sections in mountain disaster areas means that the priorities for adaptation and resilience will vary within and between regions, and national standards and local policies need to take this difference into account:
First, the road system in mountainous disaster areas has less recovery capacity than that in plains areas and cannot recover to 100% quickly, but there is a large growth space; that is, the repair of some key sections can greatly improve the functional service capacity of the road network. Therefore, the “regional priority emergency management mode” can be established for the road system in mountainous disaster areas, giving priority to repairing some key sections after the disaster to quickly restore the function of the road network in a short time.
Second, local governments need to establish adaptation and recovery strategies based on “worst-case” scenarios. At present, due to the uncertainty of the location and the frequency of natural disasters, some emergency measures may not be useful even if they involve considerable time and money. Finding how to adapt to this uncertainty and what adaptive measures can be used to address the uncertainty of disasters requires urban planning and policymakers to make a clear judgement on the possibility of these (or other) “worst cases”.
5 Conclusion
In this paper, a retrospective study is conducted by taking the road network in the extremely severe disaster area of the Wenchuan earthquake as the research object and reconstructing the damage and repair process of the road network with real data. The main conclusions are as follows: 1) the overall change characteristics of road system toughness under the realistic scenario of extreme disasters are obtained, and the resilience curve of traffic system in the mountainous disaster areas is put forward; 2) a strategy to improve the overall system resilience by repairing the connectivity of key sections is proposed.
This paper studies the improvement in the overall disaster prevention and reduction capacity of the road system from the regional scale and establishes the corresponding index system and analysis method for the toughness evolution of the repair process for a mountain road system under a realistic disaster scenario, which has a degree of universal significance and can provide a case reference for some other disaster-prone areas. It also has certain exploration value for the planning and construction of disaster prevention and reduction in the extremely severe disaster area of the Wenchuan earthquake. In addition, it can also be used as a reference to compensate for the lack of actual measurements in the current research on road toughness, which is mainly based on theoretical evaluation and pre-disaster risk prediction. The research deficiency of this paper is that it does not include the whole Wenchuan earthquake-stricken area in the study, and due to the limitation of the length of the paper, it does not include a more in-depth excavation of the research results, such as the impact of traffic network resilience on the community. More in-depth research is expected to be performed in the future.
Data Availability Statement
The original contributions presented in the study are included in the article/Supplementary Material, further inquiries can be directed to the corresponding author.
Author Contributions
MW and YH drew up the research framework and technical route, MW wrote the paper, and others participated in the data collection and processing work.
Funding
This paper is supported by the national key R & D program of China (2018yfd1100804).
Conflict of Interest
The authors declare that the research was conducted in the absence of any commercial or financial relationships that could be construed as a potential conflict of interest.
Publisher’s Note
All claims expressed in this article are solely those of the authors and do not necessarily represent those of their affiliated organizations, or those of the publisher, the editors and the reviewers. Any product that may be evaluated in this article, or claim that may be made by its manufacturer, is not guaranteed or endorsed by the publisher.
Footnotes
1State council information office of the PRC “The second year of Wenchuan earthquake”.
2Ministry of civil affairs, national development and reform commission, etc.
References
Aghababaei, M. T., Costello, S. B., and Ranjitkar, P. (2020). Assessing Operational Performance of New Zealand's South Island Road Network after the 2016 Kaikoura Earthquake. Int. J. Disaster Risk Reduct. 47. doi:10.1016/j.ijdrr.2020.101553doi:101553
Allan, P., and Bryant, M. (2011). Resilience as a Framework for Urbanism and Recovery. J. Landsc. Archit. 6 (2), 34–45. doi:10.1080/18626033.2011.9723453
Argyroudis, S. A., Mitoulis, S. A., Hofer, L., Zanini, M. A., Tubaldi, E., and Frangopol, D. M. (2020). Resilience Assessment Framework for Critical Infrastructure in a Multi-Hazard Environment: Case Study on Transport Assets. Sci. Total Environ. 714. doi:10.1016/j.scitotenv.2020.136854doi:136854
Aydin, N. Y., Duzgun, H. S., Heinimann, H. R., Wenzel, F., and Gnyawali, K. R. (2018). Framework for Improving the Resilience and Recovery of Transportation Networks under Geohazard Risks. Int. J. Disaster Risk Reduct. 31, 832–843. doi:10.1016/j.ijdrr.2018.07.022
Bellini, E., Bellini, P., Cenni, D., Nesi, P., Pantaleo, G., Paoli, I., et al. (2021). An IoE and Big Multimedia Data Approach for Urban Transport System Resilience Management in Smart Cities. Sensors 21 (2), 435. doi:10.3390/s21020435
Boakye, J., Guidotti, R., Gardoni, P., and Murphy, C. (2022). The Role of Transportation Infrastructure on the Impact of Natural Hazards on Communities. Reliab. Eng. Syst. Saf. 219.doi:108184
Calvert, S. C., and Snelder, M. (2018). A Methodology for Road Traffic Resilience Analysis and Review of Related Concepts. Transp. A Transp. Sci. 14 (1-2), 130–154. doi:10.1080/23249935.2017.1363315
Cats, O., Koppenol, G.-J., and Warnier, M. (2017). Robustness Assessment of Link Capacity Reduction for Complex Networks: Application for Public Transport Systems. Reliab. Eng. Syst. Saf. 167, 544–553. doi:10.1016/j.ress.2017.07.009
Cimellaro, G. P., Reinhorn, A. M., and Bruneau, M. (2010). Framework for Analytical Quantification of Disaster Resilience. Eng. Struct. 32 (11), 3639–3649. doi:10.1016/j.engstruct.2010.08.008
Davoudi, S. S. I. (2008). Conceptions of Space and Place in Strategic Spatial Planning. Int. Rev. red cross 172, 343–346.
Ducruet, C., and Zaidi, F. (2012). Maritime Constellations: a Complex Network Approach to Shipping and Ports. Marit. Policy & Manag. 39 (2), 151–168. doi:10.1080/03088839.2011.650718
Holling, C. S. (1973). Resilience and Stability of Ecological Systems. Annu. Rev. Ecol. Syst. 4 (1), 1–23. doi:10.1146/annurev.es.04.110173.000245
Huang, X., Wei, C., and Li, H. (2009). Remote Sensing Analysis of the Distribution and Genetic Mechanisms of Transportation Network Damage Caused by the Wenchuan Earthquake. J. Appl. Remote Sens. 3 (1), 31650–316512. doi:10.1117/1.3154387
Ilbeigi, M. (2019). Statistical Process Control for Analyzing Resilience of Transportation Networks. Int. J. disaster risk Reduct. 33, 155–161. doi:10.1016/j.ijdrr.2018.10.002
Jian, Q., and Fan, Z. (2015). The Theory and Practice of Urban Rural Planning Management at Emergency: Reconstruction Planning after Wenchuan Earthquake. Planners 31 (09), 26–32.
Jian, Q., Junhao, J., and Liuqiang, J. (2008). Enlightenment of Disaster Prevention and Reduction of the Park System Construction with Regard to Wenchuan Earthquake. City Plan. Rev. (11), 72–77.
Jian, Q. R. J. (2009). Exploration of Building a Planning System of Post-earthquake Reconstruction: a Case Study of Wenchuan Earthquake. City Plan. Rev. 33 (07), 11–15.
Kepaptsoglou, K. L., Konstantinidou, M. A., Karlaftis, M. G., and Stathopoulos, A. (2014). Planning Postdisaster Operations in a Highway Network. Transp. Res. Rec. 2459 (1), 1–10. doi:10.3141/2459-01
Lacinák, M. (2021). Resilience of the Smart Transport System–Risks and Aims. Transp. Res. Procedia 55, 1635–1640.
Li, X., and He, S. (2009). Seismically Induced Slope Instabilities and the Corresponding Treatments: the Case of a Road in the Wenchuan Earthquake Hit Region. J. Mt. Sci. 6 (1), 96–100. doi:10.1007/s11629-009-0197-1
Liu, H. J., Love, P. E. D., Sing, M. C. P., Niu, B., and Zhao, J. (2019). Conceptual Framework of Life-Cycle Performance Measurement: Ensuring the Resilience of Transport Infrastructure Assets. Transp. Res. Part D Transp. Environ. 77, 615–626. doi:10.1016/j.trd.2019.10.002
Bruneau, M., Chang, S. E., Eguchi, R. T., Lee, G. C., O’Rourke, T. D., Reinhorn, A. M., et al. (2012). A Framework to Quantitatively Assess and Enhance the Seismic Resilience of Communities. Earthquake Spectra 19 (4), 733–752.
Ming, L. I., Ziyu, Z., and Yinnan, W. (2011). An Interactive Discussion on the Overall Urban Design and Master Plan in the New Town of Beichuan. City Plan. Rev. 35 (S2), 37–42.
Ministry of housing and urban rural development of the people’s Republic of China (2013). Practice of Urban and Rural Planning for Post-Wenchuan Earthquake Reconstruction in Sichuan Province. Beijing, China: China Architecture & Building Press.
Okraszewska, R., Romanowska, A., Wołek, M., Oskarbski, J., Birr, K., and Jamroz, K. (2018). Integration of a Multilevel Transport System Model into Sustainable Urban Mobility Planning. Sustainability 10 (2), 479. doi:10.3390/su10020479
Parker, R. N., Densmore, A. L., Rosser, N. J., de Michele, M., Li, Y., Huang, R., et al. (2011). Mass Wasting Triggered by the 2008 Wenchuan Earthquake Is Greater Than Orogenic Growth. Nat. Geosci. 4 (7), 449–452. doi:10.1038/ngeo1154
Pescaroli, G., and Alexander, D. (2016). Critical Infrastructure, Panarchies and the Vulnerability Paths of Cascading Disasters. Nat. Hazards 82 (1), 175–192. doi:10.1007/s11069-016-2186-3
Porse, E. L. E. A. (2016). Network Analysis and Visualizations of Water Resources Infrastructure in California: Linking Connectivity and Resilience. J. Water Resour. Plan. Manag. doi:10.1061/(asce)wr.1943-5452.0000556
Porta, S., Crucitti, P., and Latora, V. (2006). The Network Analysis of Urban Streets: A Dual Approach. Phys. A Stat. Mech. its Appl. 369 (2), 853–866. doi:10.1016/j.physa.2005.12.063
Yin, Q., Li, Z., Zhu, Y., Guo, F., Zhu, S., Zhu, C., et al. (2012). Recasting Backbone: Review on Urban System Reconstruction Planning after Wenchuan Earthquake. City Plan. Rev. 36 (09), 53–58.
Qiang, Y., and Xu, J. (2019). Empirical Assessment of Road Network Resilience in Natural Hazards Using Crowdsourced Traffic Data. Int. J. Geogr. Inf. Sci. IJGIS 34, 1–17. doi:10.1080/13658816.2019.1694681
Saberi, M., Mahmassani, H. S., Brockmann, D., and Hosseini, A. (2017). A Complex Network Perspective for Characterizing Urban Travel Demand Patterns: Graph Theoretical Analysis of Large-Scale Origin-Destination Demand Networks. Transportation 44 (6), 1383–1402. doi:10.1007/s11116-016-9706-6
Selçuk, A. S., and Yücemen, M. S. (1999). Reliability of Lifeline Networks under Seismic Hazard. Reliab. Eng. Syst. Saf. 65 (3), 213–227.
Sharifi, A., and Yamagata, Y. IEEE, 1–5.Major Principles and Criteria for Development of an Urban Resilience Assessment Index, Proceedings of the 2014 International Conference and Utility Exhibition on Green Energy for Sustainable Development (ICUE), Pattaya, Thailand, 19 March 2014,
Shifu, W. (2013). City Safety:from Wenchuan Earthquake to Beijing 7.21 Rainstorm Disaster-Are We Really Ready. City Plan. Rev. 37 (02), 60–66.
Twumasi-Boakye, R., and Sobanjo, J. O. (2021). A Computational Approach for Evaluating Post-disaster Transportation Network Resilience. Sustain. Resilient Infrastructure 6 (3-4), 235–251. doi:10.1080/23789689.2019.1605754
Wang, J., Mo, H., Wang, F., and Jin, F. (2011). Exploring the Network Structure and Nodal Centrality of China's Air Transport Network: A Complex Network Approach. J. Transp. Geogr. 19 (4), 712–721. doi:10.1016/j.jtrangeo.2010.08.012
Wei, L., and Wen, H. U. (2015). Towards a Self-Organization Mode: Case Studies on Post-earthquake Reconstruction Planning in Wenchuan and Lushan. City Plan. Rev. 39 (09), 27–32.
Xu, C., Xu, X., Yao, X., and Dai, F. (2014). Three (Nearly) Complete Inventories of Landslides Triggered by the May 12, 2008 Wenchuan Mw 7.9 Earthquake of China and Their Spatial Distribution Statistical Analysis. Landslides 11 (3), 441–461. doi:10.1007/s10346-013-0404-6
Xuanmei Fan, C. H. J. J. (2018). What We Have Learned from the 2008 Wenchuan Earthquake and its Aftermath: A Decade of Research and Challenges. Eng. Geol. 241.
Yan-Bi, H., and Yan-Dong, Z. (2019). Resource Redistribution and Health Inequality in Post-disaster Recovery: on Three Surveys of Wenchuan Earthquake Recovery. Chin. J. Sociol. 39 (06), 214–237.
Yang, X.-H., Cheng, Z., Chen, G., Wang, L., Ruan, Z.-Y., and Zheng, Y.-J. (2018). The Impact of a Public Bicycle-Sharing System on Urban Public Transport Networks. Transp. Res. Part A Policy Pract. 107, 246–256. doi:10.1016/j.tra.2017.10.017
Liu, Y. J., Liu, S. Q., Liu, B. T., and Liu, S. Z. (2010). Bearing Capacity of Resources and Environment of Ya′an——heavily damaged area by Wenchuan Earthquake. Resour. Environ. Yangtze Basin 19 (5), 554–559.
Keywords: resilience, complex network analysis, road network, Wenchuan earthquake, extremely severe disaster areas
Citation: Wei M, Fang SJ, Chen S, Lin Ry, Huang Y and Yang L (2022) Resilience Assessment of Road Networks in the Extremely Severe Disaster Areas of the Wenchuan Earthquake. Front. Earth Sci. 10:834302. doi: 10.3389/feart.2022.834302
Received: 13 December 2021; Accepted: 27 April 2022;
Published: 17 May 2022.
Edited by:
Pan Xiong, Beijing Meteorological Information Center, ChinaReviewed by:
Lingling Shen, Beijing Meteorological Information Center, ChinaPierre Gehl, Bureau de Recherches Géologiques et Minières, France
Wenfeng Zheng, University of Electronic Science and Technology of China, China
Shuanglin Li, Central South University, China
Dingde Xu, Sichuan Agricultural University, China
Copyright © 2022 Wei, Fang, Chen, Lin, Huang and Yang. This is an open-access article distributed under the terms of the Creative Commons Attribution License (CC BY). The use, distribution or reproduction in other forums is permitted, provided the original author(s) and the copyright owner(s) are credited and that the original publication in this journal is cited, in accordance with accepted academic practice. No use, distribution or reproduction is permitted which does not comply with these terms.
*Correspondence: Yong Huang, aHlvbmdAY3F1LmVkdS5jbg==
 Meng Wei
 Song Jing Fang2