- 1State Key Laboratory of Coking Coal Exploitation and Comprehensive Utilization, Pingdingshan, China
- 2College of Municipal and Environmental Engineering, Henan University of Urban Construction, Pingdingshan, China
Effective filtering of the infrasound signal generated by coal samples is the basis for realizing the prediction of the infrasound of coal sample damage. Based on the infrasonic signal test of the coal samples during the loading process, a simulation method was used to construct a mixed signal containing noise signals and infrasound signals. Three methods are used to filter the mixed signal, including wavelet filtering, EMD filtering, and EMD-wavelet joint filtering. The filtering effect was compared by correlation coefficient, signal-to-noise ratio, and frequency domain waveform graph. The comparison results showed that the EMD-wavelet joint filtering method had the highest correlation coefficient and signal-to-noise ratio after noise filtering, and the noise signal in the frequency domain waveform diagram was the most thorough. It provides a new method for filtering infrasound signals in the process of coal sample loading, which is greatly significant for improving the accuracy of infrasound prediction of coal sample damage.
Introduction
Infrasound mainly refers to sound waves with a frequency between 0.01 and 20 Hz. As a low-frequency wave, it has the characteristics of low frequency and long wavelength. Compared with conventional acoustic wave prediction methods, it has the advantages of long propagation distance and small attenuation, and has a better application prospect in coal and rock failure prediction (Jia et al., 2017a; Marchetti et al., 2019; Jia et al., 2021). In the process of coal and rock deformation and failure, sound waves of different frequencies and amplitudes are generated due to the coupling of internal deformation and air in the coal and rock. Based on the establishment of the relationship between coal sample deformation and acoustic response, the internal deformation law of coal and rock samples can be inverted by monitoring the changes of acoustic waves. Therefore, the effective acquisition and processing of sound waves has an important impact on the accuracy of coal samples damage prediction. However, in the actual monitoring process, noise signals are inevitably included in the collected sound waves, which cause serious interference to the monitoring results and affect the accuracy of prediction. In order to effectively filter out noise signals, previous scholars have carried out a lot of researches. Some scholars have improved the signal acquisition instrument to control the signal frequency acquisition range, reducing the interference of unnecessary signals on the acquisition results (Fiala et al., 1965; Park and Robertson, 2009; Chen et al., 2020a; Zhou et al., 2020). Some scholars filtered the collected signals by constructing FIR filters, Butterworth filters, Kalman filters, and other band-pass filters to filter out the noise signals in the test results (Flandrin et al., 2004; Christov et al., 2017; Jianping et al., 2017; Jia et al., 2017b; Shibendu et al., 2020; Fang et al., 2021). Regardless of whether it is transforming a signal acquisition instrument or constructing a band-pass filter, it can only filter the noise signal in the non-target frequency band. When the frequency of the noise signal is close to that of the target signal, it is difficult to filter out using conventional filtering methods. Hence, some scholars have proposed wavelet filtering methods that think noise signals mainly contain high-frequency components (Daubechies, 2015; Patidar et al., 2015; Thirumala et al., 2015; DomínguezNavarro José et al., 2021; Gnutti et al., 2021; Zhao, 2021). Firstly, the collected signal was decomposed into the high-frequency part and low-frequency part, then the high-frequency signal was thresholded using the threshold method, and finally the processed signals were combined. The wavelet filtering method has a good filtering effect, but the choice of wavelet basis function and threshold processing method is required. Different selection results have very different processing effects, which increases the difficulty of choosing the basis function and threshold method (Zongchun et al., 2011; Zhu et al., 2015; Chen et al., 2017; Li et al., 2020; Wang et al., 2021; Yun et al., 2021). In order to solve the problem of basis function selection, some scholars proposed the empirical mode decomposition (EMD) method (Jiang et al., 2015; Kang et al., 2020; Sun et al., 2020; Bouchair et al., 2021; Chen et al., 2021; Qi et al., 2021; Vishnu et al., 2021), which could decompose the signal according to its own time scale without the need for basis function selection. The signal is decomposed into different eigenmode functions (IMF). The changing characteristics of sound waves at different frequencies are represented by different IMF components. According to the analysis needs, the IMF components of different frequencies are combined to effectively filter the non-target frequency bands. Because the filtering method effectively retains the abrupt characteristics of the signal, it has a better processing effect for abrupt and discontinuous signals, especially for coal and rock failure signals with stable environmental noise (Zhang et al., 2017; Chen et al., 2020b). However, the EMD filtering method does not process the decomposed signal, and there may be noise signals in the IMF components. In order to make full use of the advantages of EMD filtering and wavelet filtering and effectively filter out the noise signal in the collected signal, this paper proposed an EMD-wavelet joint filtering method. First, the EMD filter method was used to decompose the signal; then, the wavelet filter was used to threshold the IMF components. Finally, the signal was reorganized to effectively filter out the noise signal interference and improve the accuracy of coal and rock damage prediction.
Characteristics of the Infrasound Signal of Coal Samples
Infrasound Test Experiment of Coal Sample Failure
1) Experimental principle
During the stress loading process, due to the size effect and the way of stress, the internal skeleton of the coal samples is not uniformly stressed, and there is a stress concentration phenomenon in a local area. At the same time, due to the difference in the distribution of pores and cracks in the coal samples and the strong heterogeneity of the internal structure, the distribution of weak surfaces in the coal samples is uneven. Therefore, as the increase of stress on the internal coal matrix skeleton during the process of stress loading, firstly, the release of local stress is caused by partial stress concentration area or the local coal samples failure in the weak surface development area, and then the stress concentration, weak surface failure and stress release of the next level weak surface are occurred again. The process is repeated as the loading progresses until the overall resistance of the coal samples is insufficient and the overall damage occurs. Different failure characteristics of coal samples at different deformation stages lead to different frequencies, and amplitudes of sound waves are generated by the coupling between coal samples and air. The difference in the characteristics of acoustic events is mainly controlled by the internal deformation of the coal sample, which is the external manifestation of the internal deformation of the coal sample.
2) Experimental device
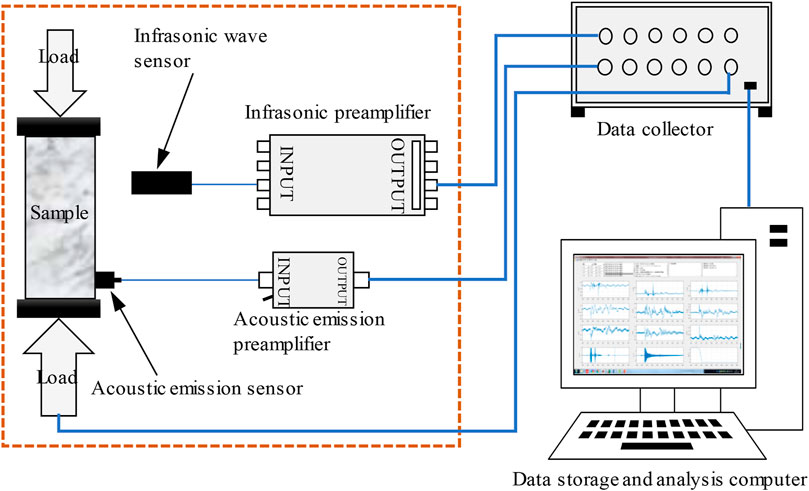
The experimental device used in the test are from the coal and rock stress loading device of Henan Polytechnic University, the CASI-ISM-2013 high-precision capacitive infrasound acquisition system developed by the Institute of Acousti, Chinese Academy of Sciences, and the multi-channel fully digital PCI-2 acoustic emission acquisition system of the American Physical Acoustics Corporation. The device mainly includes an axial compression loading system, a stress-strain acquisition system, an infrasound acquisition/analysis system, and an acoustic emission acquisition/analysis system. The experimental principle diagram is shown in Figure 1.
3) Coal sample preparation
According to the purpose of the test, coal samples were collected at Jincheng Sihe Mine, Jiaozuo Jiulishan Mine, Jiaozuo Guhanshan Mine, Anyang Main Coking Mine, and Yima Gengcun Mine. Each mine was divided into one group and each group had six samples. A total of 30 coal samples were taken for experimental testing. By analyzing the results, it was found that the test results were similar, and the infrasound response law was similar. In order to avoid the repetition of the discussion, Jincheng Sihe Mine was taken to the collection, test, and analysis of the coal sample as an example to make a detailed discussion. According to the test requirements, coal samples were collected at Sihe Mine in Jincheng Mining Area. The coal sample was 3# coal seam anthracite. The coal sample collection was carried out on the fresh coal wall of the working face. The site was sealed and then brought back to the laboratory. According to the requirements of rock mechanics experiment sample preparation, the coal sample was processed into a standard column sample with a diameter of 50 mm × 100 mm, and the flatness of the upper and lower surfaces of the coal sample met the requirements of the rock mechanics experiment test. A total of eight coal samples were prepared, of which two were standby samples. The prepared coal samples were sealed, stored, and put on standby.
4) Testing procedure
During the test, the specific test steps were as follows:
1) The acoustic emission sensor was fixed, then the coal sample was put into the sample cylinder, and the infrasonic sensor was fixed.
2) The infrasound acquisition parameters were set and the environmental noise test was carried out. When the ambient noise was stable, the next operation could be carried out. When there were many abnormal fluctuations in environmental noise, other time periods were chosen for the test.
3) The loading parameters were set, the load control was selected, and the loading speed was 200 N/s. The acquisition parameters were set at the same time. Acoustic emission threshold was adjusted according to the actual environment. The sampling frequency of infrasound was 0.1 kHz.
4) The stress loading device, the acoustic emission collection device, and the infrasound collection device were activated at the same time. The sonic test of the coal sample loading process was started.
5) Loading was continuous until the coal sample was destroyed.
Infrasound Test results of Coal Sample Failure
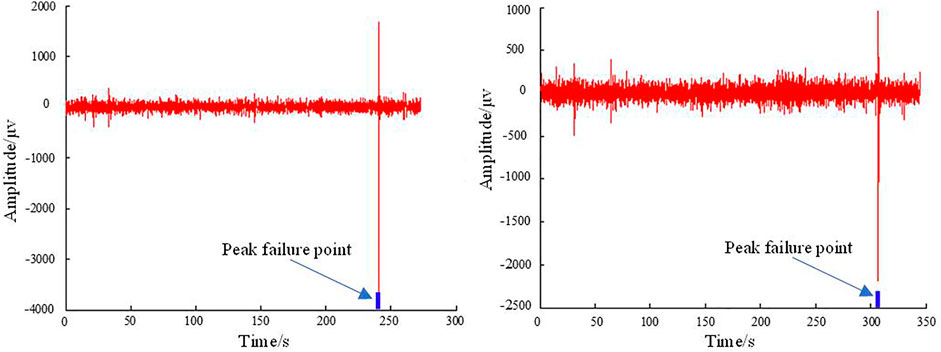
According to the experimental purpose and experimental plan, the infrasound test of the coal samples was carried out during the loading process. Though the analysis of the characteristics of infrasound changed during the loading process of coal samples, the change rules were similar. In order to avoid the repetition of the discussion, 1# coal sample and 2# coal sample were selected for detailed analysis (Figure 2).
According to the test results, it could be seen that the infrasound signal of the coal sample showed abrupt characteristics during the loading process. Especially before and after the peak was destroyed, the sudden change of the infrasonic signal was obvious. Therefore, when the signal filtering method was optimized, the filtering method should be able to better adapt to the abrupt infrasound signal.
Establishment of a Filtering Effect Evaluation Index
In order to visually and quantitatively evaluate the denoising effect, an evaluation index has been established. By comparing the changes of evaluation indexes before and after denoising, the denoising effects of different denoising methods were quantitatively evaluated. A reasonable denoising method could not only completely remove the noise but also ensure the accuracy of the signal after denoising and avoid serious signal distortion caused by denoising. Therefore, the denoising effect could be evaluated in terms of the degree of denoising of the signal and the accuracy of the signal after denoising. Two parameters, signal-to-noise ratio and correlation coefficient, were used as evaluation indicators.
The signal-to-noise ratio refers to the ratio of the effective signal to the noise signal in the signal, which can be expressed as (Reninger et al., 2011; Ding et al., 2021; XinXin et al., 2021):
where SNR is the signal-to-noise ratio, dB. Ps is the effective power of the signal, W. Pn is the effective power of noise, W.
The correlation coefficient refers to the correlation between the two sets of data before and after denoising, which can be expressed as:
where r is the correlation coefficient. xi is the signal function before denoising, yi is the signal function after denoising, and n is the number of samples.
The rationality of the denoising method was quantitatively evaluated by comparing the signal-to-noise ratio and correlation coefficient before and after processing.
Filtering Method Optimization
During the infrasonic signal test, due to the influence of the surrounding environment, mechanical equipment, human activities and other factors, the test signal contained part of the noise signal. Since the test result analysis is affected by the noise signal, the test result needs to be filtered and denoised.
The purpose of filtering and denoising the signal is to reduce the noise part of the test signal and remove the non-analyzed frequency band signal in the test signal. At present, the commonly used signal filtering methods include wavelet analysis, wavelet packet analysis, EMD analysis, and so on. Among them, wavelet analysis and EMD are the most widely used (Dragomiretskiy and Zosso, 2014; Tang and Wang, 2015; Liu et al., 2019; Wang et al., 2020). A large number of environmental noise signals were included in the test signals of this study, and it was difficult to achieve better filtering effects using band-pass filtering methods. Therefore, the adaptability and accuracy of the test results were compared using wavelet analysis and EMD analysis methods to optimize the signal filtering method.
Wavelet Filtering
Due to the influence of the environment and test equipment, real signal and noise signal are included by the test signal. It can be expressed as:
where y(t) is the test signal, x(t) is the real signal, and e(t) is the noise signal.
The purpose of denoising using the wavelet method is to remove the noise signal and extract the real signal. The principle of wavelet denoising is to perform wavelet decomposition on the original signal, which is decomposed into the high-frequency coefficient and low-frequency coefficient, where noise usually exists in the high-frequency part. Then, the high-frequency coefficients are thresholded using the threshold method, and the processed wavelet is reconstructed to obtain the denoised acoustic signal. The whole process includes wavelet decomposition, threshold processing, and reconstruction.
1) Wavelet decomposition
There are many wavelet bases to choose, which need to be selected according to the characteristics of waveform and wavelet. The selection principle is as follows: (1) Tight support. Tight support is related to the time–frequency locality. The narrower the tight support is, the better the locality is. (2) Symmetry. The distortion problem is affected. It is related to whether the wavelet filtering characteristic has a linear phase. (3) Orthogonality. The differentiability of wavelets is expressed. (4) Smoothness, which has a greater impact on frequency resolution. (5) The order of the vanishing matrix. The larger the order is, the stronger the ability to reflect the high-frequency details of the signal is.
The determination of the number of decomposition layers is also a key factor affecting the denoising effect. The more the decomposition layer is, the more thorough the filtering of the noise signal is. It is conducive to completely remove the noise signal. However, too many decomposition layers can easily cause the distortion of the signal, resulting in the lack of effective information contained in the signal, which affects the analysis of the later signal. The number of decomposition layers is too small to effectively remove the noise signal. Therefore, the decomposition effect under different decomposition levels is compared with the signal characteristics to determine the optimal decomposition level.
2) Threshold processing
Threshold processing is processing high-frequency coefficients through the obtained threshold to achieve filtering. The threshold processing process mainly includes the acquisition of the threshold and the selection of the threshold processing method. Threshold acquisition is based on the analysis of the original signal and noise signal, and the threshold is selected based on the signal-to-noise ratio. The commonly used threshold optimization methods include fixed threshold, minimum maximum variance threshold, heuristic threshold, unbiased likelihood estimation threshold, etc. The denoising effect of fixed threshold and heuristic threshold is more thorough, while the minimum maximum variance threshold and unbiased likelihood estimation threshold are relatively few. When the high-frequency part of the signal crosses more with the noise signal, the effective signal can be effectively distinguished from the noise signal and it has a better denoising effect. In the actual application process, the signal characteristics of the noise signal and the test signal should be analyzed and compared, and then an appropriate threshold acquisition method should be established according to the analysis result.
At present, the commonly used threshold processing methods are the soft threshold method and hard threshold method. Soft threshold processing is a relatively smooth processing method. The graphics are relatively smooth after noise reduction processing. Hard threshold processing is a “one size fits all” processing principle, which can better retain some of the abrupt characteristics in the original signal. Therefore, in the signal processing process, the threshold value processing method is optimized for purposes according to the signal characteristics and analysis methods.
3) Reconstruction
The purpose of reconstruction is to reconstruct the processed signal, perform signal processing, and analyze according to the characteristics of the reconstructed signal.
EMD Filtering
The EMD denoising method is based on the signal decomposition method, which decomposes the signal into multiple IMF components and residuals. IMF components represent sound waves in different frequency ranges. According to the needs, the sound waves in different frequency bands are combined to remove the sound waves in the non-analyzed frequency band. Therefore, the EMD denoising method can filter non-stationary signals.
According to the denoising principle and denoising method of EMD, filters such as band pass, low pass, and high pass are gradually formed. Several commonly used filters are as follows:
1) Low pass filter
The filter achieves filtering by filtering out high-frequency signals and removes the high-frequency components in the IMF component, which can be expressed as:
where
2) High pass filter
The filter is to filter out low-frequency signals to achieve filtering. The low-frequency components in the IMF layer are filtered out, which can be expressed as:
where
3) Band pass filter
The filter achieves filtering by filtering high-frequency signals and low-frequency signals outside the pass band. The low-frequency and high-frequency components in the IMF layer are filtered out, which can be expressed as
where
The filtering method can retain the abrupt characteristics of the signal, especially for signal testing under environmental conditions with known background noise, or for low-frequency signal testing in high-frequency environmental noise, which has a good filtering effect. Therefore, the method can be used to filter the test signal of the coal sample destruction process.
EMD-Wavelet Joint Filtering
Both EMD denoising method and wavelet denoising have good denoising effects, but the denoising principles are different. In order to make full use of the advantages of wavelet denoising and EMD denoising, a filtering method combining wavelet filtering and EMD filtering is proposed. On the basis of decomposing the signal, thresholding is performed on each IMF layer, and finally the signal in the analysis frequency band is reorganized to achieve filtering.
The specific denoising process of the denoising method is as follows:
1) The test signal is decomposed by EMD, and the IMF components of each layer are obtained;
2) The threshold value of each layer is calculated based on the threshold value acquisition method;
3) The threshold processing method is preferred, and each layer is thresholded, respectively;
4) The denoised IMF component is reorganized to obtain the processed signal.
Comparison of Filtering Effects
Original Waveform Construction
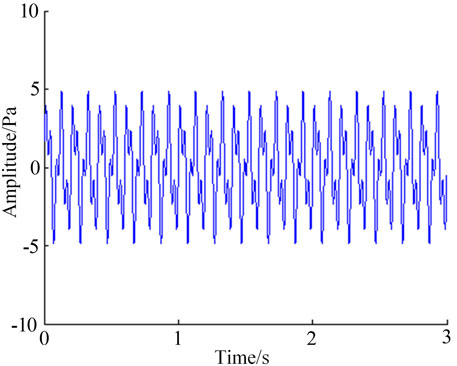
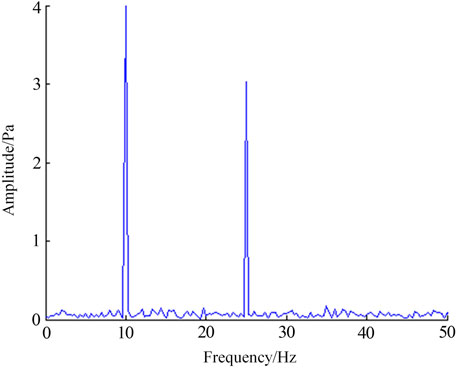
In order to evaluate the rationality of wavelet denoising, EMD denoising, and EMD-wavelet joint filtering methods, the 10- and 25-Hz signal are taken as an example, as shown in .
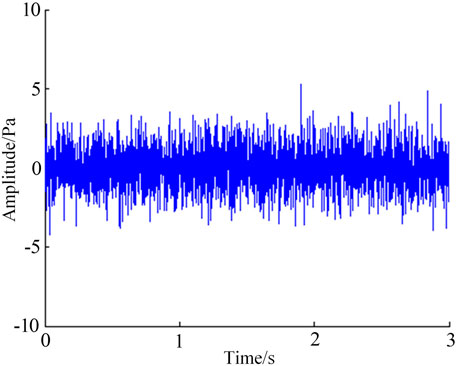
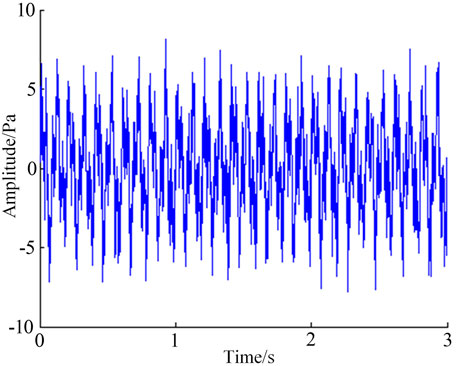
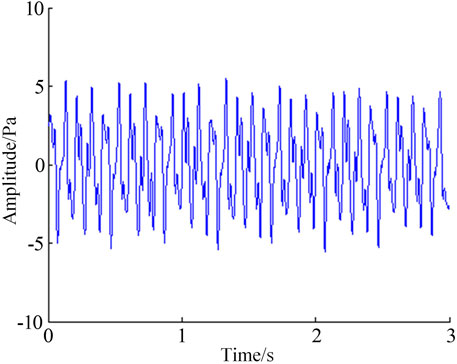
Artificial noise is added to the signal, the addition of 6dB white noise is taken as an example. The original signal waveform is shown in Figure 3. The noise signal waveform is shown in Figure 4. The signal waveform after adding noise is shown in Figure 5.
Waveform Comparison
1) Wavelet denoising waveform
The wavelet denoising method is used to combine the characteristics of the original signal and the noise signal to perform the optimization of the wavelet base, the determination of the number of decomposition layers, the acquisition of the threshold, and the determination of the threshold processing method. MATLAB software is used to denoise the noisy signal through self-programming. The signal-to-noise ratio of the denoised signal and the correlation coefficient between the denoised signal and the original signal is calculated. The signal waveform after denoising is shown in Figure 6.
From the waveform diagram after wavelet denoising, it can be seen that the noise signal contained in the infrasound signal is significantly reduced after denoising. However, there are still some noise signals in the processed signal, compared with the original signal, which cannot be completely removed. To a certain extent, it can be explained that wavelet denoising has a certain denoising effect.
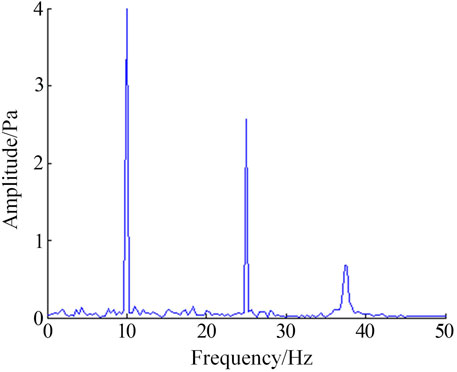
In order to further understand the change characteristics of the signal in the frequency domain after denoising, the signal is analyzed in the frequency domain, and the analysis result is shown in Figure 7.
2) EMD denoising waveform
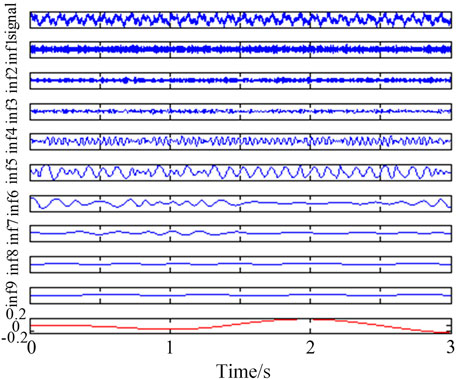
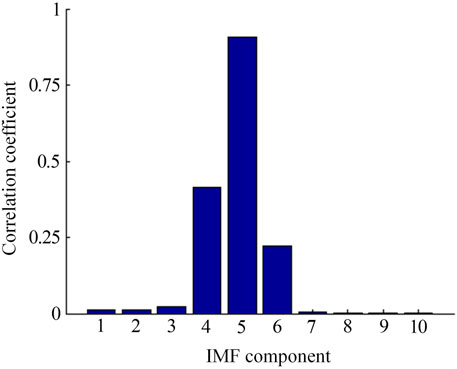
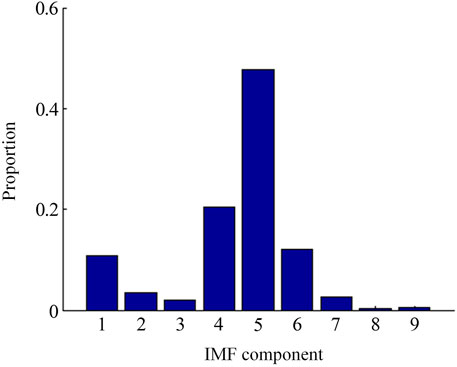
The EMD analysis method is used to empirically decompose the original signal to obtain a series of IMF components, as shown in Figure 8. The correlation coefficient of each IMF component and the original signal and the energy ratio of each IMF component are calculated. The calculation results are shown in Figures 9, 10.
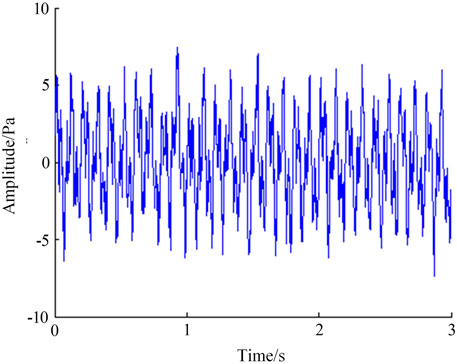
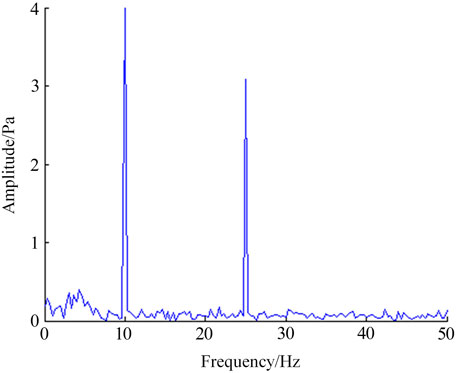
According to the calculation results, it can be concluded that the acoustic energy of the original signal is mainly distributed on the first seven IMF components, especially the IMF4, IMF5, and IMF6 components, and the other components are less. At the same time, according to the calculation results of the correlation coefficient, the correlation between the IMF4, IMF5, and IMF6 components is good with the original signal. The correlation coefficients of other IMF components are much less than 0.03, which is poor. Therefore, the signal is reconstructed according to the IMF4, IMF5, and IMF6 components. The signal-to-noise ratio of the reconstructed signal and the correlation coefficient between the reconstructed signal and the original signal are calculated. The signal waveform after denoising is shown in Figure 11. The frequency domain analysis result is shown in Figure 12.
From the waveform diagram after denoising, it can be seen that the noise signal in the infrasound signal is obviously reduced after EMD denoising processing, but there is still a certain amount of noise signal, indicating that the EMD denoising method has a certain denoising effect.
The signal-to-noise ratio of the signal was 8.7 dB after EMD denoising. The correlation coefficient between the denoised signal and the original signal was 0.94. It showed that the signal-to-noise ratio of the signal after EMD denoising had been improved, and had a strong correlation with the original signal. At the same time, the spectrum of the denoised signal was analyzed with 10 and 25 Hz as the main frequency. The results showed that it was consistent with the initial signal as a whole and fluctuates slightly near 5 Hz, which showed the rationality of the denoising method.
3) EMD-wavelet joint denoising waveform
Although the EMD denoising method can denoise the signal, the signal denoising is not thorough enough. Therefore, the EMD-wavelet joint denoising method is proposed on the basis of the EMD denoising method. The processed IMF components are reconstructed through the soft threshold processing of different IMF components, and then the signal denoising is realized. The denoising results of EMD wavelet joint denoising method are shown in Figure 13. The spectrum of the denoised signal is shown in Figure 14.
Parameter comparison
The signal-to-noise ratio, correlation coefficient, and frequency domain characteristics of the three denoising methods after denoising are compared, as shown in Table 1. The signal-to-noise ratio of the signal is the highest after the EMD-wavelet joint denoising method denoises. The signal after denoising has the strongest correlation with the original signal, and the frequency domain analysis result is consistent with the original signal. It is concluded that the EMD-wavelet joint denoising method has better denoising effect.
Conclusion
Based on the analysis of the existing denoising methods, the EMD-wavelet joint denoising method is proposed, combined with the change characteristics of the abrupt infrasound signal. Using the method of combining theoretical analysis and simulation calculation, different denoising methods and time-frequency analysis methods are compared and analyzed with MATLAB software to compile a program, and the denoising and time-frequency analysis methods are optimized. The conclusions are as follows.
1) The infrasonic signal is generated during the loading process of the coal sample, and the signal is dominated by abrupt signals. When the peak value of the coal sample is destroyed, the infrasonic signal has obvious mutation characteristics.
2) Different denoising methods are analyzed theoretically. According to the characteristics of abrupt infrasonic signal and the shortcomings of existing denoising methods, an EMD wavelet joint denoising method is proposed.
3) An evaluation system with SNR, correlation coefficient, and frequency domain characteristics as evaluation indicators is established with the MATLAB software. The denoising effects of different denoising methods are evaluated by simulation. Finally, an EMD-wavelet joint denoising that is more suitable for the denoising of abrupt infrasonic signals is selected.
Data Availability statement
The raw data supporting the conclusion of this article will be made available by the authors, without undue reservation.
Author Contributions
JZ, MW, and BJ contributed to conception and design of the study. JZ organized and coordinated the study. BJ and YW carried out the sample collection and experimental test. JZ, MW, and BJ established the model and analyzed the data. BJ wrote the first draft of the manuscript. All authors contributed to manuscript revision and read and approved the submitted version.
Funding
This work was supported by the Natural Science Youth Fund of Henan Province (project number: 212300410105), Key Scientific Research Projects Plan of Henan Higher Education Institution (project number: 20A620002), and Open Research Fund of State Key Laboratory of Coking Coal Exploitation and Comprehensive Utilization, China Pingmei Shenma Group.
Conflict of Interest
The authors declare that the research was conducted in the absence of any commercial or financial relationships that could be construed as a potential conflict of interest.
Publisher’s Note
All claims expressed in this article are solely those of the authors and do not necessarily represent those of their affiliated organizations, or those of the publisher, the editors, and the reviewers. Any product that may be evaluated in this article, or claim that may be made by its manufacturer, is not guaranteed or endorsed by the publisher.
References
Bouchair, A., Selouani, S. A., and Amrouche, A. (2021). Improved Empirical Mode Decomposition Using Optimal Recursive Averaging Noise Estimation for Speech Enhancement. Circuits, Systems, Signal. Process. 156 (2), 1–28. doi:10.1007/s00034-021-01767-w
Chen, J., Liu, S., and Tao, J. (2020). Analysis of Low-Frequency Oscillation Based on Sure Wavelet Threshold De-noising and MCEEMD-HHT Method. High Voltage Eng. 46 (1), 151–160. doi:10.13336/j.1003-6520.hve.20190624010
Chen, Q., Li, W., Jiang, C., Zhou, Z., and Min, S. (2021). Separation and Compensation of Geometric Errors of Rotary axis in 5-axis Ultra-precision Machine Tool by Empirical Mode Decomposition Method. J. Manufacturing Process. 68 (3), 1509–1523. doi:10.1016/j.jmapro.2021.06.057
Chen, Y., Cheng, Y., and Liu, H. (2017). Application of Improved Wavelet Adaptive Threshold De-noising Algorithm in FBG Demodulation. Optik 132 (4), 243–248. doi:10.1016/j.ijleo.2016.12.052
Chen, Z., Wei, W., and Yue, L. (2020). Laboratory Investigation of Characteristics of Infrasonic Sound during Rock Failures under Different Types of Loading[J]. J. Shaoxing University 40 (4), 9–19.
Christov, I., Neycheva, T., Schmid, R., Stoyanov, T., and Abächerli, R. (2017). Pseudo-real-time Low-Pass Filter in ECG, Self-Adjustable to the Frequency Spectra of the Waves. Med. Biol. Eng. Comput. 55 (9), 1579–1588. doi:10.1007/s11517-017-1625-y
Daubechies, I. (2015). The Wavelet Transform, Time-Frequency Localization and Signal Analysis[J]. J. Renew. Sustain. Energ. 36 (5), 961–1005. doi:10.1109/18.57199
Ding, Q., Zhijie, H., and Yimin, S. (2021). Study on Optimization of Picking up First Arrival Time of Microseismic Signals with Different Signal-To-Noise Ratio. Coal Technol. 40 (12), 119–125.
DomínguezNavarro José, A., LopezGarcia Tania, B., and Sandra Minerva, V. (2021). Applying Wavelet Filters in Wind Forecasting Methods[J]. Energies 14 (11), 3181. doi:10.3390/en14113181
Dragomiretskiy, K., and Zosso, D. (2014). Variational Mode Decomposition. IEEE Trans. Signal. Process. 62 (3), 531–544. doi:10.1109/tsp.2013.2288675
Fang, Y., Chen, Z., Yu, L., and Fei, S. (2021). Contactless Interactive Control Technology with a Switching System Based on Butterworth Filter and Modified strong Tracking Kalman Filter. Proc. Inst. Mech. Eng. J. Syst. Control. Eng. 235 (8), 1532–1541. doi:10.1177/09596518211003391
Fiala, W. T., Hilliard, J. K., Renkus, J. A., and Van Houten, J. J. (1965). Electropneumatic Acoustic Generator. The J. Acoust. Soc. America 37, 1177–1178. doi:10.1121/1.1939396
Flandrin, P., Rilling, G., and Goncalves, P. (2004). Empirical Mode Decomposition as a Filter Bank. IEEE Signal. Process. Lett. 11 (2), 112–114. doi:10.1109/lsp.2003.821662
Gnutti, A., Guerrini, F., Adami, N., Migliorati, P., and Leonardi, R. (2021). A Wavelet Filter Comparison on Multiple Datasets for Signal Compression and Denoising. Multidim Syst. Sign Process. 32 (2), 791–820. doi:10.1007/s11045-020-00753-w
Jia, B., Jianping, W., and Wen, Z. (2017). Study on Prediction of Coal Sample Damage by Infrasound[J]. Prog. Geophys. 32 (4), 1773–1778.
Jia, B., Wan, X., and Quan, L. (2021). Study on Prediction Method of Infrasound Waves for Concrete Structure Destruction in Underground Space[J]. Iranian J. Sci. Technol. Trans. Civil Eng. 45 (4), 562–570. doi:10.1007/s40996-020-00562-y
Jia, B., Wei, J.-p., Ge, H.-y., Wen, Z.-h., and Zhang, H.-t. (2017). Study on Infrasonic Characteristics of Coal Samples in Failure Process under Uniaxial Loading. Results Phys. 7 (6), 4371–4378. doi:10.1016/j.rinp.2017.11.018
Jiang, L. H., Fu, C., and Liu, W. Q. (2015). Lidar Back Scattering Signal Denoising Method Based on Adaptive Multi-Scale Morphological Filtering and EMD[J]. Infrared Laser Eng. 44 (5), 1673–1679.
Jianping, W., Jia, B., and Wen, Z. (2017). Study on Precursory Characteristics of Granite Failure Based on Infrasonic Energy[J]. Results Phys. 07 (3), 2925–2932. doi:10.1016/j.rinp.2017.08.025
Kang, S., Lu, Z., and Wang, F. (2020). Partial Discharge Signal Denoising Method Based on Variational Mode Decomposition and Singular Value Decomposition[J]. J. Henan Polytechnic Univ. ( Nat. Science) 39 (6), 119–126.
Li, X., Wang, L. X., and Duan, Z. Q. (2020). Application of Improved Adaptive Wavelet Noise Reduction in Laser Gyroscope Signal Processing[J]. Laser Optoelectronics Prog. 57 (21), 243–248.
Liu, B., Hu, W. P., and Zhou, X. (2019). Recognition of Denatured Biological Tissue Based on Variational Mode Decomposition and Multi-Scale Permutation Entropy. Acta Physica Sinica 68 (2), 253–261. doi:10.7498/aps.68.20181772
Marchetti, E., Walter, F., Barfucci, G., Genco, R., Wenner, M., Ripepe, M., et al. (2019). Infrasound Array Analysis of Debris Flow Activity and Implication for Early Warning. J. Geophys. Res. Earth Surf. 124 (2), 567–587. doi:10.1029/2018jf004785
Park, J., and Robertson, J. (2009). A Portable Infrasound Generator. J. Acoust. Soc. Am. 125 (4), EL148–51. doi:10.1121/1.3093797
Patidar, S., Pachori, R. B., and Rajendra Acharya, U. (2015). Automated Diagnosis of Coronary Artery Disease Using Tunable-Q Wavelet Transform Applied on Heart Rate Signals. Knowledge-Based Syst. 82 (5), 1–10. doi:10.1016/j.knosys.2015.02.011
Qi, W., Wang, X., and Wang, B. (2021). Echo Signal Denoising Based on Optimized Variational Mode Decomposition Algorithm[J]. Laser Optoelectronics Prog. 58 (20), 79–92. doi:10.3788/lop202158.2007001
Reninger, P.-A., Martelet, G., Deparis, J., Perrin, J., and Chen, Y. (2011). Singular Value Decomposition as a Denoising Tool for Airborne Time Domain Electromagnetic Data. J. Appl. Geophys. 75 (2), 264–276. doi:10.1016/j.jappgeo.2011.06.034
Sun, Z., Xi, X., Yuan, C., Yang, Y., and Hua, X. (2020). Surface Electromyography Signal Denoising via EEMD and Improved Wavelet Thresholds. Math. Biosciences Eng. MBE 17 (6), 6945–6962. doi:10.3934/mbe.2020359
Shibendu, M., Rajib, K., and Mandal, D. (2020). Optimal Modelling of (1+α) Order Butterworth Filter under the CFE Framework[J]. Fractal and Fractional 4 (4), 55. doi:10.3390/fractalfract4040055
Tang, G. J., and Wang, X. L. (2015). Parameter Optimized Variational Mode Decomposition Method with Application to Incipient Fault Diagnosis of Rolling Bearing[J]. J. Xi'an Jiao-tong Univ. 49 (5), 73–81. doi:10.7652/xjtuxb201505012
Thirumala, K., Umarikar, A. C., and Jain, T. (2015). Estimation of Single-Phase and Three-Phase Power-Quality Indices Using Empirical Wavelet Transform. IEEE Trans. Power Deliv. 30 (1), 445–454. doi:10.1109/tpwrd.2014.2355296
Vishnu, R., Kumar, Y. B., and Nair, A. K. M. (2021). An Investigation of the Elevated Aerosol Layer Using a Polarization Lidar Over a Tropical Rural Site in India. Boundary-layer Meteorol. 178 (2), 323–340. doi:10.1007/s10546-020-00573-2
Wang, X., Zhao, J., and Zhu, T. (2020). Ultrasonic echo Denoising in Liquid Density Measurement Based on Improved Variational Mode Decomposition[J]. J. Meas. Sci. Instrumentation 11 (04), 326–334. doi:10.3969/j.issn.1674-8042.2020.04.003
Wang, Z., Liu, X., and Liu, X. (2021). Wavelet and Empirical Mode Decomposition Denoising for GLAS Full Waveform Data[J]. Laser Optoelectronics Prog. 58 (23), 364–371. doi:10.3788/lop202158.2328001
XinXin, M., LiFeng, M., and Cong, Y. (2021). Research on Wavelet Denoising Method for Semi-airborne Transient Electromagnetic Data. Prog. Geophys. 36 (03), 1287–1296.
Yun, Q., Qiong, L., and Qian, H. (2021). Seismic Signal Denoising Method Based on VMD and Improved Wavelet Threshold[J]. Comput. Tech. Geophys. Geochemical Exploration 43 (06), 690–696. doi:10.3969/j.issn.1001-1749.2021.06.02
Zhang, L., Sun, X., and Zhan, Q. (2017). Research of Filtering Method for Blasting Vibration Signals Based on CEEMD and Correlation Function Property. Water Resour. Hydropower Eng. 48 (6), 37–42.
Zhao, Y. (2021). Denoising Method of cable Partial Discharge Signals Based on VMD and Wavelet Threshold Reconstruction[J]. J. Xi’an Univ. Sci. Technol. 41 (4), 739–746.
Zhou, Z., Zhang, Y., and Lijuan, L. (2020). Design of MEMS Gyro Array Signal Acquisition System Based on FPGA[J]. Instrument Tech. Sensor 41 (09), 101–105.
Zhu, J., Zhang, Z., and Kuang, C. (2015). A Reliable Evaluation Indicator of Wavelet Denoising[J]. Geomatics Inf. Sci. Wuhan Univ. 40 (5), 688–694. doi:10.13203/j.whugis20130417
Keywords: coal sample failure, infrasound, filtering, signal-to-noise ratio, analogue simulation
Citation: Zhang J, Wang M, Jia B and Wang Y (2022) Study on Optimization of Infrasound Filtering Method for Coal Sample Failure under Load. Front. Earth Sci. 10:834234. doi: 10.3389/feart.2022.834234
Received: 13 December 2021; Accepted: 10 January 2022;
Published: 21 February 2022.
Edited by:
Jinyang Fan, Chongqing University, ChinaReviewed by:
Wenyu Lv, Xi’an University of Science and Technology, ChinaHuafu Qiu, Xi’an University of Science and Technology, China
Copyright © 2022 Zhang, Wang, Jia and Wang. This is an open-access article distributed under the terms of the Creative Commons Attribution License (CC BY). The use, distribution or reproduction in other forums is permitted, provided the original author(s) and the copyright owner(s) are credited and that the original publication in this journal is cited, in accordance with accepted academic practice. No use, distribution or reproduction is permitted which does not comply with these terms.
*Correspondence: Jianguo Zhang, emhhbmdqZ196QDEyNi5jb20=; Bing Jia, amlhX3lhbmcxMTAxQDE2My5jb20=
 Jianguo Zhang
 Man Wang1