 Stuart Mead
 Jonathan Procter
 Mark Bebbington
 Cecilia Rodriguez-Gomez
94% of researchers rate our articles as excellent or good
Learn more about the work of our research integrity team to safeguard the quality of each article we publish.
Find out more
ORIGINAL RESEARCH article
Front. Earth Sci., 28 March 2022
Sec. Volcanology
Volume 10 - 2022 | https://doi.org/10.3389/feart.2022.832531
This article is part of the Research TopicVolcanic Forecasting, Crisis Management, and Risk CommunicationView all 8 articles
Hazard assessment for infrastructure proximal to a volcanic vent raises issues that are often not present, or not as severe in hazard assessments for more distal infrastructure. Proximal regions are subject to a greater number of hazardous phenomena, and variability in impact intensity increases with the hazard magnitude. To probabilistically quantify volcanic hazard to infrastructure, multiple volcanic hazards and their effects on exposed elements need to be considered. Compared to single-hazard assessments, multi-hazard assessments increase the size and complexity of determining hazard occurrence and magnitude, typically introducing additional uncertainties in the quantification of risk. A location-centred approach, focusing on key locations rather than key hazards, can simplify the problem to one requiring identification of hazards with the potential to affect the location, followed by assessment of the probability of these hazards and their triggering eruptions. The location-centred approach is more compatible to multi-source hazards and allows for different hazard estimation methodologies to be applied as appropriate for the infrastructure type. We present a probabilistic quantification of volcanic hazard using this location centred approach for infrastructure within Te Papakura o Taranaki National Park, New Zealand. The impact to proposed park infrastructure from volcanic activity (originating from Mt. Taranaki) is quantified using a probability chain to provide a structured approach to integrate differing hazard estimation methods with eruption probability estimates within asset lifetimes.
This location-centered approach provides quantitative estimates for volcanic hazards that significantly improve volcanic hazard estimates for infrastructure proximal to the Taranaki summit vent. Volcanic mass flows, predominantly pyroclastic surges or block and ash flows, are most likely (probability >0.8) to affect walking tracks if an eruption occurs. The probability of one or more eruption(s) in the next 50 years is estimated at 0.35–0.38. This use of probability chains and a location centered assessment demonstrates a technique that can be applied to proximal hazard assessments globally.
The unique landforms and features of volcanic environments are attractive tourist destinations and often protected areas (e.g. national parks) to minimise environmental impact and manage visitor pressure (Erfurt-Cooper, 2011). Infrastructure such as visitor centres, walking tracks and viewing platforms are often placed within these areas to facilitate and manage access (Erfurt-Cooper, 2011). Due to their function, these facilities are located in regions where proximal hazards and impacts occur (e.g. 2012 eruption of Te Maari, New Zealand, Leonard et al., 2014; Leonard et al., 2014 eruption of Ontake, Japan, Oikawa et al., 2016). Understanding the magnitude and occurrence of these hazards is therefore critical to appropriate risk management and mitigation (Jolly et al., 2014). Appropriately placed and designed infrastructure and assets are a primary factor in increasing resilience and reducing risk (Keys and Green, 2008) and quantitative assessments have emerged as a preferred tool for robust decision making (Jolly et al., 2014; Komendantova et al., 2016).
Te Papakura o Taranaki (formerly Egmont National Park), New Zealand is one example of a national park with facilities proximal to an active volcano. The 2518 m andesitic stratovolcano Taranaki and ancient Kaitake and Pouakai volcanoes all lie within the park boundaries with walking tracks and visitor centres located across the volcanoes slopes. The proximity of this infrastructure to the summit and parasitic vent (Panitahi/Fanthams Peak) of Taranaki means at least some of these assets will be affected by volcanic phenomena including ballistics, pyroclastic flows, debris avalanches and ashfall in the next eruption. However, the magnitude and likelihood of these hazards is unquantified except for a broad measure of ‘Highest hazard’ from Neall and Alloway (1996), despite the recentness of last volcanic activity (∼200–250 years ago, Lerner et al., 2019a). This study attempts to rectify the information gap through a probabilistic volcanic hazard assessment for infrastructure within the national park.
Volcanic eruptions intrinsically pose several types of hazards varying in dynamics, frequency and method of action on exposed infrastructure. Volcanic hazard assessments are therefore ideally multi-hazard to enable quantitative ranking of hazards and identification of significant risks (Sandri et al., 2014). Quantitative volcano multi-hazard assessments are reasonably common, typically utilising event-trees (Newhall and Hoblitt, 2002) in various forms (e.g. Sandri et al., 2014; Tonini et al., 2016; Sandri et al., 2018; Wild et al., 2019) to quantify the probability of eruptions and the subsequent phenomena. Most of these assessments are hazard-centred approaches, where the hazard source defines the impact area which is then used to evaluate potential effects (Komendantova et al., 2016). An alternate method for multi-hazard and multi-risk assessment is a location-centred approach (Carpignano et al., 2009), where the target location of value is defined first, followed by identification of hazard sources and effect (Komendantova et al., 2016). This approach can have many benefits, particularly when considering infrastructure. Location based approaches are more compatible with multi-source hazards (e.g. Sandri et al., 2018) and separation of locations allows for different hazard and impact estimation methodologies to be applied as appropriate for the location and asset (Galderisi and Limongi, 2021). For example, low-value linear infrastructure (walking tracks) can have different accuracy requirements and different hazard intensity estimation methods when compared to single point, high-value locations (visitor centres).
To inform asset risk within Te Papakura o Taranaki, this study develops a probabilistic volcanic hazard assessment for infrastructure utilising a location-centred approach. In this approach, infrastructure elements (walking tracks and visitor centres) are considered separately, allowing different hazard estimation methodologies to be applied when appropriate. The hazard assessment uses a probability chain to provide a structured approach to integrating different hazard methodologies with conditional probabilities of eruption occurrence and size.
Mt. Taranaki (2518 m) is an andesitic stratovolcano with more than 170,000 years of geologic history (Alloway et al., 2005; Zernack et al., 2009). It is the southernmost in a chain of four andesitic cone volcanoes along the NW-SE trending Taranaki volcanic lineament (Neall et al., 1986). Volcanism along the Taranaki lineament has migrated South-East over the quaternary, beginning with Paritutu volcano north of New Plymouth, followed by Kaitake, Pouakai, and, most recently, Taranaki volcanoes.
The volcanic activity of Mt. Taranaki appears cyclical, with geologic history and ring plain deposits dominated by large-scale destruction events of former Taranaki edifices (Neall et al., 1986; Zernack et al., 2011; Zernack and Procter, 2021). Large, unconfined debris flows initiated from destruction of these edifices led to drastic landscape changes and drainage pattern alteration, spawning many secondary sediment-and-water flows. Regrowth of the Taranaki cone follows through smaller-scale activity, including small explosive eruptions, lava flows and dome growth. This activity can shift into larger scale explosive activity with large Plinian and sub-Plinian eruptions (Torres-Orozco et al., 2017a), block-and-ash flows (Cronin et al., 2021), and the generation of long-runout, but confined mass flows (Zernack, 2021).
The proximal section of Mt. Taranaki consists mostly of small lava flows and scoria deposits emplaced in the previous 10,000 years (Neall et al., 1986). Proximal deposit sequences at Taranaki (Torres-Orozco et al., 2017b) indicate multiple fall deposits (37 in total) and pyroclastic flow deposits (73 in total) from 53 different eruption episodes in the last 5,000 years from either the Taranaki summit or Panitahi (Fanthams Peak) satellite vent. The Taranaki ring plain is dominated by voluminous debris avalanche and debris flow deposits, with some lahar and pyroclastic flow deposits (Neall et al., 1986; Zernack, 2021). Large, unconfined debris avalanche deposits are present in all but the north-west sector of Taranaki, where the older Kaitake and Pouakai volcanoes and their deposits break the symmetry of the Taranaki debris avalanche deposits. Smaller debris avalanche or lahar deposits (Warea, Kahui, Te Popo, Ngatoro formations) are more confined to channel banks with evidence of non-cohesive debris flows, hyperconcentrated flows of varied origins (including block-and-ash flows) and transitions to streamflow (Zernack et al., 2009). The eastern sector of the ring plain (NNE to SSE) contains multiple tephra fall deposits, following the predominant wind direction in the region (Alloway et al., 1995; Alloway et al., 2005; Turner et al., 2009). Recent effusive activity has emplaced (and collapsed) lavas and smaller domes on the summit of Mt. Taranaki (Neall et al., 1986; Platz et al., 2012; Torres-Orozco et al., 2017a; Lerner et al., 2019b; Zernack and Procter, 2021).
The most recent flank collapse debris avalanche occurred approximately 7,500 years ago (Opua formation, South West of Taranaki, Zernack and Procter, 2021). The upper section of Mt. Taranaki (consisting of lavas and smaller domes) was created from activity since this debris flow. Numerous tephra deposits after the emplacement of the Opua debris avalanche indicate regular explosive eruptions with intermittent lava flows. At around 3,300 years ago, lava flows and scoria deposits were produced from Panitahi (a satellite vent North of the Mt. Taranaki summit), potentially marking the end of its construction (Neall et al., 1986), although eruption episodes sourced from Panatahi are observed up to approximately 1,500 years ago (Torres-Orozco et al., 2017a). Throughout the recent history (especially post-28,000 years ago), numerous large (>107 m3) tephra falls have been recorded between debris flows, with an average periodicity of 330 years (Alloway et al., 1995; Turner et al., 2008). However, these tephras also show cyclic variation with periods (∼1,000–1500 years in duration) of high tephra deposition separated by periods of low eruption frequency (Damaschke et al., 2018). Eruptions appear to occur in rapid sequences either culminating in, or originating from, large debris flows (Alloway et al., 1995; Zernack and Procter, 2021). Activity since the last debris avalanche is represented through 53 different eruption episodes identified in proximal deposits on Taranaki (Torres-Orozco et al., 2017b). These indicate complex eruption sequences associated with the generation of ashfall deposits and small-scale pyroclastic density currents from eruption columns, longer-runout block-and-ash flows, and syn-eruptive or secondary lahars following valley and river channels in the Taranaki region (Torres-Orozco et al., 2017a; Torres-Orozco et al., 2017b). The last 1000 years of activity (the Maero Eruptive Period, Neall, 1979; Platz et al., 2007; Lerner et al., 2019b) is dominated by small eruptions (VEI 3-4) with domes being formed and then destroyed through gravitational collapse or eruptive activity which are recorded in the volcaniclastic (block-and-ash flow, debris flow, rock fall and ashfall) deposits preserved in the NW sector of Taranaki (Platz et al., 2007; Procter et al., 2010).
Several huts, visitor centres and walking tracks are located within Te Papakura o Taranaki and proximal to both vents of Taranaki volcano (Figure 1). The two visitors centres, Dawson Falls and North Egmont, located South-East and North-East of the summit respectively are main visitor access points into the park. The focus in this hazard assessment is on the tracks, infrastructure and huts along the eastern flank of Taranaki, primarily the Taranaki Crossing track network and North Egmont Visitors Centre (shown in Figure 1). The Taranaki Crossing network extends from Dawson Falls visitors centre, along the eastern slopes of Taranaki, crossing Manganui Gorge towards Boomerang slip, with access to North Egmont Visitors Centre. The latter part of the network continues (the Pouakai Crossing, starting from approximately Boomerang slip) through the Ahukawakawa Swamp, over the Pouakai Range towards Mangorei Road. This network is being developed into a high-quality visitor experience through planned track and boardwalk updates, improvement of toilet facilities, and hut and visitors centre upgrades (Department of Conservation, 2021). These tracks and infrastructure all lie within the near-vent hazard zone (Neall and Alloway, 1996) and are likely to be impacted in future eruptions of Taranaki volcano, from either the summit vent or Panitahi.
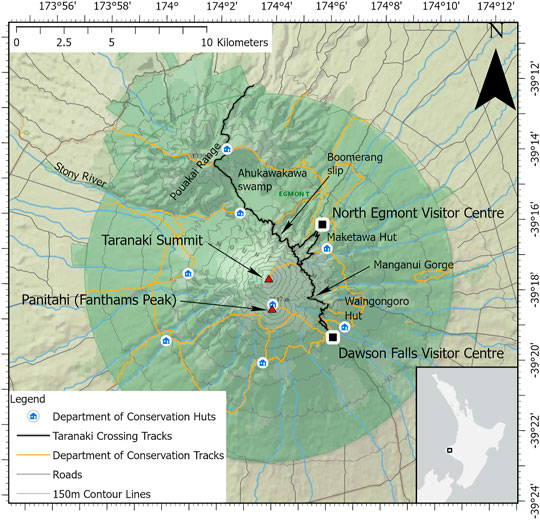
FIGURE 1. Department of Conservation tracks and huts in Te Papakura o Taranaki, highlighting key locations in this hazard assessment.
Proximal deposit sequences of 53 eruption records from ∼5 ka indicate the dominant proximal hazards are from ashfall and pyroclastic density currents (Torres-Orozco et al., 2017b). Ashfall thicknesses within the National Park are typically under 80 cm per episode, but can total up to 240 cm thickness (formed from multiple fall events). Following the primary wind direction, these tephras are mostly deposited on the northeast and southeast flanks of Taranaki (Torres-Orozco et al., 2017a); however the variable low-level winds could be expected to deposit tephra in all directions proximal to the volcano.
Pyroclastic flow deposits observed at Taranaki include block-and-ash flows, dense PDC’s and dilute surge or blast type PDC’s (Torres-Orozco et al., 2018). Block-and-ash flows, formed from collapsing lava domes at the summit are most common in the North-West sector of Taranaki towards Stony River (Procter et al., 2010; Platz et al., 2012; Lerner et al., 2019b) and are most likely to mark the onset of an eruption at Taranaki (Torres-Orozco et al., 2017a). As the conduit supplying magma to the surface clears, unsteady eruption columns may collapse, forming pyroclastic flows of ash and pumice (Torres-Orozco et al., 2017a) following incised channels along the flanks of Taranaki. Dilute surge or blast-type PDC’s are less channelised and often found mantling topography on Taranaki (Torres-Orozco et al., 2018), formed from laterally-directed blasts or ash-cloud surges of dome/column collapse flows, posing a hazard outside of incised channels on the flanks of Taranaki.
The Taranaki ring plain is dominated by large debris avalanche and lahar deposits, bounded only by Pouakai volcano in the North-West and Taranaki fault to the East (Neall, 1979; Zernack et al., 2011). Larger debris avalanches travel the 25–40 km from the Mt. Taranaki edifice to the coastline, with volumes ranging from approximately 0.3–7.5 km3 of material, and can be several metres thick at the coastline (Zernack et al., 2011). The scale and magnitude of debris avalanches from Mt. Taranaki is observable from the number and size of the hummocks and thickness of deposits (Procter et al., 2021). Lahars have similarly travelled to the coastline, with recent (historical) lahar activity confined to the NW catchment (Stony/Hangatahua River) through remobilisation of accumulated volcaniclastics. Infrastructure along the eastern flanks of Taranaki is located within the source areas for these volcanic mass flows and would likely be affected by the primary event in the case of lahars (e.g. pyroclastic fall or flows) or during triggering (e.g. flank collapse) processes for debris avalanches.
Considering the current state of the Taranaki summit (blocked conduit capped by a lava dome), an opening explosive eruption phase is most likely to occur following unrest (Ogburn et al., 2015; Torres-Orozco et al., 2018), clearing the high viscosity (i.e. cold rock) magma and lava from the conduit. This episode is likely to generate very proximal hazardous phenomena such as volcanic ballistic projectiles (VBP) and may lead to an effusive phase generating lava domes or flows. Limited data on individual flow units for lava flows and the distribution (size, location) of ballistic particles introduce difficulties in effectively quantifying the occurrence and impact of these hazards. VBP’s are observed in proximal records (Torres-Orozco et al., 2017b) and presumed to occur up to 4 km from the summit vent (Torres-Orozco et al., 2018). Lava flows are identified up to ∼5 km from the summit (Neall, 1979; Zernack et al., 2009; Cronin et al., 2021).
The volcanic hazards from Taranaki volcano were categorised into 6 different hazard zones, varying in frequency, by Neall and Alloway (1996). This hazard map (Figure 2), at 1:100,000 scale, is still a relevant representation of hazard across the Taranaki region based on past activity. However, the map lacks detail required for decision making for proximal infrastructure. With reference to previous eruption episodes at Taranaki, more detail is provided for individual hazards in the proximal zone through a hazard assessment methodology described and demonstrated in the following sections.
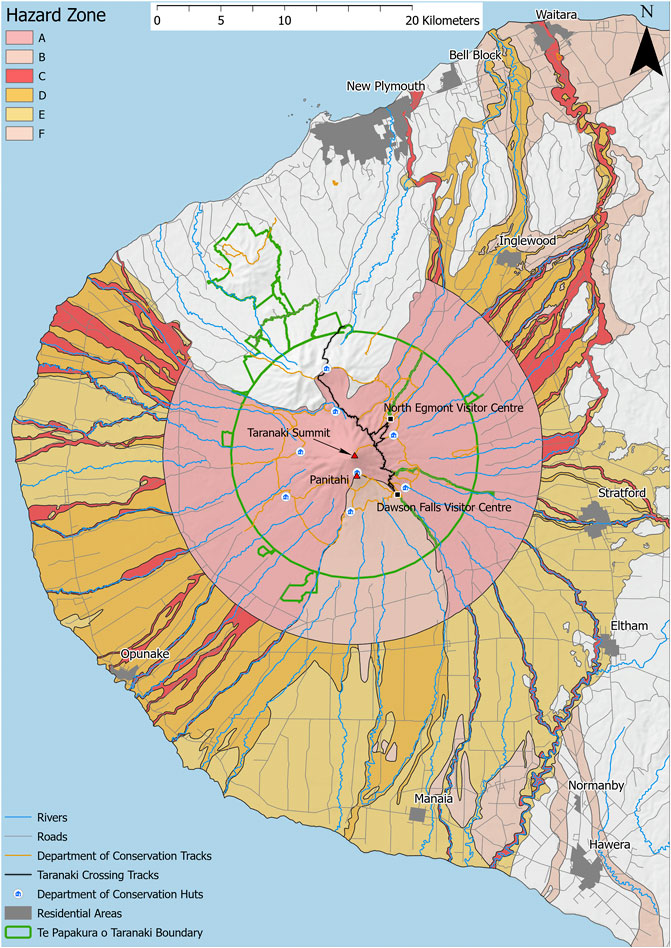
FIGURE 2. Taranaki volcanic hazard map and zones from Neall and Alloway (1996). Zone (A) is region of highest hazard from Taranaki Summit near-vent effects; (B) is region of highest hazard from Panitahi (Fanthams Peak) near-vent effects; (C) is region of highest hazard from distant effects, including lahars; (D) is region of intermediate hazard from lahars and associated floods; (E) is area affected by large debris avalanches and lahars; (F) is area affected by rare large debris avalanches and lahars.
The next eruption of Taranaki is likely to be a complex event, with a variety of volcanic phenomena and hazards from multiple episodes or phases of an eruption. An event tree, showing the progression of hazard outcomes from volcanic activity is a well-established approach to estimate the likely volcanic hazards and their probabilities (Newhall and Hoblitt, 2002; Sandri et al., 2014) and has been previously applied to Taranaki volcano (Torres-Orozco et al., 2018; Wild et al., 2019). Considering the current summit conditions of Taranaki (blocked conduit capped by a lava dome), an opening eruptive phase is most likely to occur following magmatic unrest (Torres-Orozco et al., 2018). This is supported by expert elicitation in Bebbington et al. (2018) indicating the next eruption is most likely to be at least VEI3, (i.e. large enough to clear the conduit and lava dome). This opening phase is likely to involve a sudden (explosive) removal of the summit dome, with subsequent explosions, eruption columns or effusive activity, generating hazards such as ashfall, ballistics, lava domes, block-and-ash flows and pyroclastic surges.
Using the event-trees of Torres-Orozco et al. (2018) for large Plinian eruptions of Taranaki and components of the Sandri et al. (2014) event-tree, a simplified probability chain for the opening phase of the next Mt. Taranaki eruption was created, shown in Figure 3. This probability chain is used as a framework for hazard assessment to account for differences in proximal infrastructure (broadly, linear vs. point based). While source probabilities of eruption size are the same for all infrastructure, this framework allows hazard calculation methods to differ depending on infrastructure without affecting the probability calculation method. Note this chain is not strictly an event-tree as the final node is not mutually exclusive; however the calculation of probabilities is similar. The probability of each node in the chain is conditional on the previous, with the probability of the outcome (e.g. ballistics occurring in a VEI2 or smaller eruption) being the product of all previous node probabilities. That is:
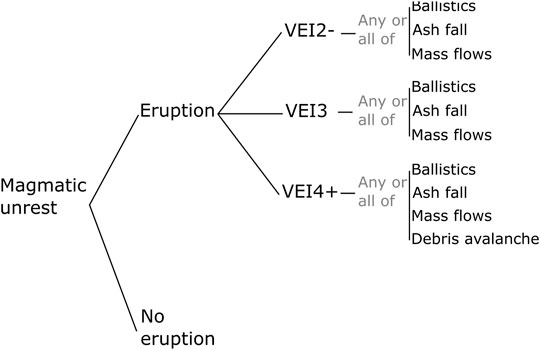
FIGURE 3. Simplified conditional probability chain for main hazards to affect proximal infrastructure within Te Papakura o Taranaki.
The conditional probability chain is a simplified depiction of all processes and hazards at Taranaki volcano, and is applicable only to the proximal processes and hazards.
In any size eruption, any or all ballistic, ashfall and mass flow (lahars, block-and-ash flows, pyroclastic flows) hazards may occur, with the probability of affecting any (or all) proximal infrastructure increasing with eruption size. Pathways for large Taranaki eruptions, including post-opening phases and other hazards are shown in Torres-Orozco et al. (2018). The conditional probability chain simplifies Taranaki volcano by assuming eruptions will only occur from the summit vent, excluding unnecessary branches (such as satellite vent eruptions) that can decrease key probabilities in an event tree (Newhall and Hoblitt, 2002). Preliminary hazard assessments for Panitahi peak eruptions show similar results to summit vent eruptions with hazard concentrated in near-Panitahi regions, indicating there is a small contribution to hazard probabilities along the eastern sector of Taranaki from Panitahi. Alternative vent locations (conditional probabilities given an eruption estimated in Wild et al., 2019) include Panitahi (probability of 0.14) or a new satellite vent (probability of 0.02), hence the summit vent eruption probability is 0.84.
Estimation of probabilities within the probability chain requires a pragmatic approach considering the data (or lack thereof) and expected variability in proximal areas. In our approach, volcano-specific data or models are preferred when available and variability is not expected to be high (e.g. ashfall at distal huts, eruption occurrence estimates). However, missing data (e.g. through a lack of study or erosional processes removing deposits) usually occur where variability and impact is expected to be high (e.g. ashfall in proximal tracks, pyroclastic flows). In these instances, global datasets (containing historic observations) are utilised to provide a robust estimate considering the magnitude of impact in proximal areas.
Source probabilities for the timing and size of the next eruption of Taranaki were obtained from Bebbington et al. (2018) and Damaschke et al. (2018). Estimates in Bebbington et al. (2018) were derived via Cooke’s classical method from opinions elicited from 28 New Zealand volcano and quantitative risk experts. The Damaschke et al. (2018) study was data-based, using tephra layers in sediment cores to model eruption occurrence. Both models yielded a similar probability of 0.35–0.38 of at least 1 eruption in the next 50 years.
The present probability of the next eruption being VEI 3 is estimated at over 0.85, with VEI 2 or lower and VEI4 both approximately ∼0.07 and a probability of 0.01 for VEI 5 (Bebbington et al., 2018). The high probability for a VEI 3 eruption is supported by the Ogburn et al. (2015) analysis of global dome growth episodes and evidence from the most recent (Maero) eruptive period of Taranaki (Platz et al., 2007) that suggest a large explosive eruption may be necessary to clear the blocked conduit.
As there is no historic evidence of dome growth and collapse at Mt. Taranaki, we use the “DomeHaz” global dome growth dataset and analysis of Ogburn et al. (2015) to elicit pathways to dome growth episodes capable of generating hazardous block-and-ash flows. The Ogburn et al. (2015) analysis notes it is most common to have an explosive eruption before dome growth episodes. Assuming an explosive eruption is required to precede a new episode of dome growth capable of producing hazardous block-and-ash flows, and using the minimum dome extrusion rate (6.0 m3s−1) for the latest dome growth episode (‘Pyramid’, Platz et al., 2007); the probability tree of Ogburn et al. (2015) suggests there is a 0.73 probability of a dome growth episode, if an eruption occurs.
Edifice failures causing debris avalanches at Taranaki volcano follow a steady-state recurrence pattern with a background annual probability of 0.00018 (Zernack et al., 2012). The triggering mechanisms for previous edifice failures of Taranaki are unknown (except for the Ngaere event, Alloway et al., 2005), although the high pumice content of debris avalanche deposits at Taranaki suggests there is an association with major explosive magmatic activity (Zernack et al., 2009; Zernack and Procter 2021). In this chain, we have therefore assumed the background annual probability (0.00018) of a debris avalanche is unaffected by eruptions smaller than VEI4, but may increase for VEI≥4 eruptions.
An estimate of Annual exceedance probabilities (AEP) for ashfall thicknesses given an eruption was calculated using the method of Bebbington et al. (2008), with eruption likelihood from Damaschke et al. (2018), and volumes matched to VEIs, using the elicited probability of eruption VEIs in (Bebbington et al., 2018). This method estimates ashfall thickness exceedance probabilities through Monte Carlo samples of an empirical ashfall thickness model (Rhoades et al., 2002) for the eruption frequency-volume relationship (determined from Damaschke et al., 2018 and Bebbington et al., 2018). Ashfall hazard was calculated at Dawson Falls Visitor Centre, North Egmont Visitor Centre, Maketawa and Waingongoro Huts. The ashfall exceedance probabilities given an eruption (top chart), annually (middle) and over 50 years (bottom) are shown in Figure 4. These thicknesses are representative of ash thicknesses expected in the more distal (away from vent) sections of the track. Jenkins et al. (2014) suggest moderate damage (i.e. those requiring repair) to complete roof collapse occurs for unreinforced rooves on timber supports at ash thicknesses of between 100 and 600 mm, depending on the quality of roof construction and materials. Smaller ash thicknesses will require clean-up and basic repairs (i.e. reduced maintenance intervals). Any rainwater sources will need to be tested for (chemical) suitability as drinking water following ashfall.
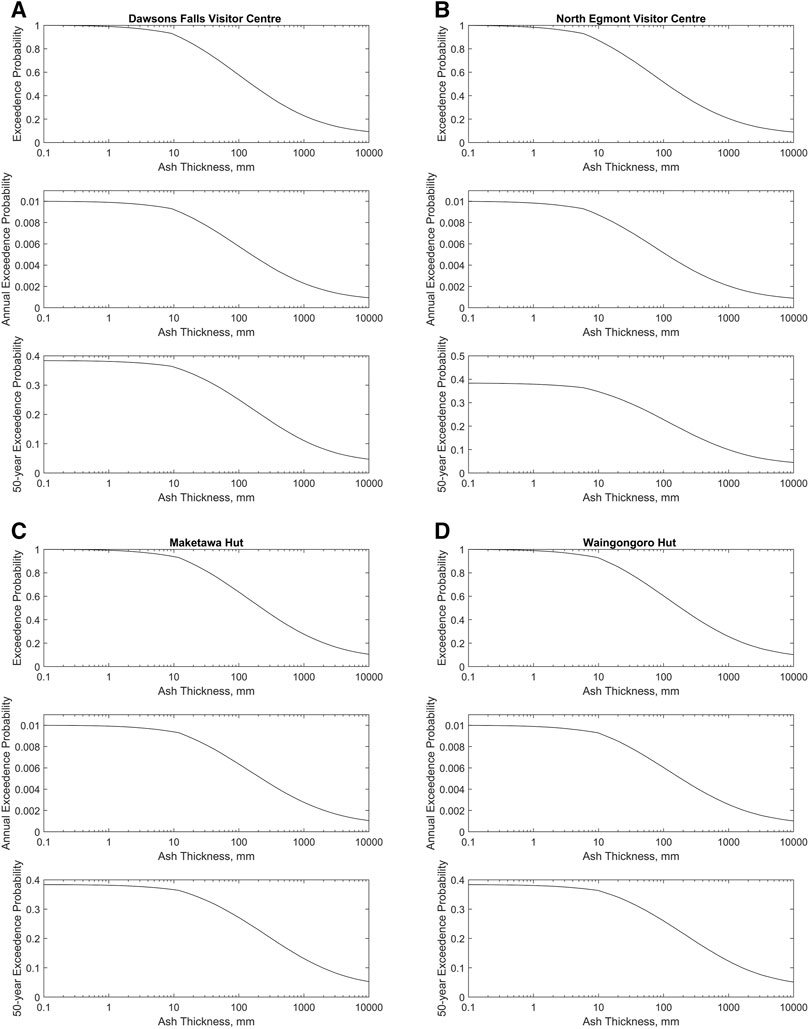
FIGURE 4. Ashfall thickness exceedance probability at (A) Dawsons Falls Visitor Centre, (B) North Egmont Visitor Centre, (C) Maketawa Hut, (D) Waingongoro Hut. Top chart shows exceedance probability given an eruption, middle shows Annual exceedance probability, bottom shows 50 years exceedance probability.
In general, ashfall thicknesses decrease exponentially with distance from the source vent (Pyle, 1989). This means the hazard magnitude (thickness) can be extreme in near-vent (i.e. proximal) areas. However, ashfall thickness in proximal areas are also highly dependent on conditions such as wind, eruption style and the size distribution of ash. This can lead to significant variability in ashfall thicknesses (and estimates) around a vent (Bebbington et al., 2008).
In particular, low-level winds at Taranaki are highly variable in speed and direction, limiting the ability to define a dominant ‘axis’ of ashfall thinning. Taking an assumption that any low-level wind direction is equally likely, we use ashfall exceedance probabilities of Newhall and Hoblitt (2002) for ashfall thicknesses 5 km from the vent, shown in Table 1. This method uses empirical data on ashfall thickness, with the exceedance probability for each event calculated as

TABLE 1. Exceedance probabilities of ash fall thickness (in cm) 5 km from the vent, given an eruption of VEI 1-2, VEI3 and VEI≥4 from Newhall and Hoblitt (2002), showing the probability of thicknesses between 10 and 50 cm.
The impact of ash on linear infrastructure (i.e. tracks) can be minimal at small thicknesses (e.g. a cm-thick covering will have negligible effects), but may increase rapidly to total loss as ashfall buries infrastructure. We estimate that damage requiring manual repair (i.e. clean-up and moving of ash) starts at approximately 10 cm of ash, up to 50 cm, using analogous estimates from urban areas (Hayes et al., 2015). Table 1 shows the exceedance probability for tephra fall thicknesses (in cm) 5 km from the vent for this range of thicknesses, given eruptions of VEI≤2, VEI 3 and VEI ≥4. Note this estimate is taken at 5 km from the summit, and thicknesses at the track (∼2.3–4 km from summit) are likely to be larger.
Empirical estimates, using the same Newhall and Hoblitt (2002) approach for ashfall, of pyroclastic flow run-out exceedance probabilities from global datasets indicate a pyroclastic flow is likely to travel further than the North Egmont Visitors Centre (probabilities of 0.58 for a VEI2 or lower, 0.90 for a VEI3, and 0.95 for a VEI4 or higher; Newhall and Hoblitt, 2002), but does not account for directionality effects in the flow generation mechanism.
The pyroclastic flow deposits observed in Torres-Orozco et al. (2017b) can suggest the occurrence frequency (per eruption) of pyroclastic flows near North Egmont Visitors Centre. Pyroclastic flow deposits are observed 13 times (41% of the 31 eruptions) in section S (a deposit sequence in Torres-Orozco et al. close to, but 40 m lower in elevation than the North Egmont Visitors Centre), with individual deposits being up to 20 cm thick. On exposed ridges (i.e. sections R and T, similar topographic setting to North Egmont Visitors Centre), fewer deposits are observed with thicknesses smaller than those in the valley (Torres-Orozco et al., 2017b). Some pyroclastic flows may not have left a significant deposit or erosion processes may have removed some deposits, so the frequency of deposits in section S should be considered a lower bound to the probability of a pyroclastic flows occurring near North Egmont Visitors Centre (i.e. p ≥ 0.41, given an eruption). Given the topographic setting of the visitors centre and expected PDC flow thicknesses, these would be in the form of ash-cloud surges (dilute, turbulent mixtures of hot ash and air) decoupled from the dense flow within valleys. Direct damage to buildings can be variable in these areas (“intermediate” to “peripheral” in Baxter et al., 2005), mainly affecting non-structural elements such as windows and door frames; however heat from the ash is likely to char wooden structures, potentially triggering fires through combustion of fittings and furnishings (Baxter et al., 2005).
The likelihood of block-and-ash flows affecting the North Egmont Visitors Centre is controlled by the summit morphology of Mt. Taranaki. Currently, the summit contains remnants of a lava dome (∼1.5 × 10⁶ m3) within a 420 m diameter crater breach facing NW (i.e. “The Chute”, towards Hangatahua River, Platz et al., 2012). This morphology directs most block-and-ash flows towards the NW sector of Egmont National Park; the past ∼800 years of block-and-ash flows have almost exclusively impacted this sector (Procter et al., 2010). Mead et al. (2022) simulated 1024 possible realisations of block-and-ash flows from the Mt. Taranaki summit at various dome and volume configurations using the Titan2D simulator (Patra et al., 2005). The simulations spanned dome volumes between 105 and 107 m3, orientations of 0–180°, and dome locations up to 210 m from the current dome location, sampled in a space filling design (latin hypercube sampling). The simulation data were used to create a statistical surrogate (‘emulator’, Bayarri et al., 2009) of maximum block-and-ash flow heights near the visitors centre, shown in Figure 5. In the (approximate) current dome configuration, the surrogate model suggests block-and-ash flows greater than 0.5 m in height may occur if summit domes are larger than 106 m3.
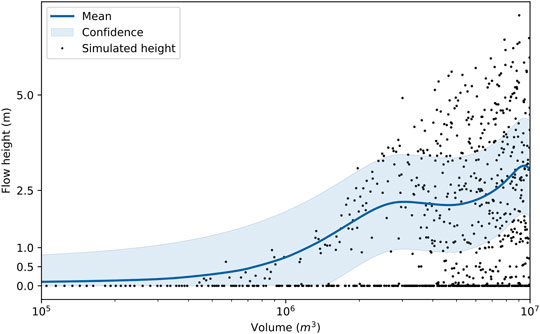
FIGURE 5. Simulated maximum flow heights near North Egmont Visitors Centre for all simulations of Mead et al. (2022) (black dots), emulated mean height and 95% confidence interval (blue line and shading) for dome collapses located and oriented similar to the current remnant dome of Taranaki.
An estimate of block-and-ash flow height exceedance probabilities (conditional on an eruption and dome collapse) was calculated for dome collapse volumes greater than 1.5 × 10⁶ m3 by sampling the Mead et al. (2022) emulator at 100,000 different dome configurations ranging uniformly in location (±150 m N and S from current dome location) and orientation (0–180°), with volumes drawn (up to a maximum of 1.0 × 10⁷ m3) from a power law distribution fitted to the record of andesitic dome collapses (Harnett et al., 2019), shown in Figure 6. For the approximate current dome configuration (dashed line), the exceedance probabilities are ∼0.6 for flow heights of 2 m, but below 0.1 for 3 m flow heights. If a new dome growth episode (0.73 probability given an eruption, Ogburn et al., 2015; Procter et al., 2019) occurs in a different configuration (within 150 m of the current vent), the exceedance probabilities (solid line) are lower for flow heights less than 3 m, but the probability of larger flows is increased (∼0.1 for flow heights ≥4 m). While block-and-ash flows will generate ash cloud surges, the topographic position of North Egmont Visitors Centre (40 m higher than valley floor) would provide some protection (i.e. superficial and non-structural damage most likely) for all but the largest of block-and-ash flows, which have a very low probability.
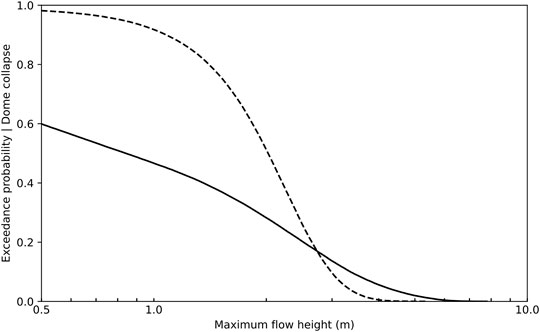
FIGURE 6. Estimated exceedance probability (conditional on an eruption and dome collapse) for block-and-ash flow heights from the current summit dome location and orientation (dashed line) and from a new summit dome location and orientation (solid line, also conditional on a dome growth episode).
A range of pyroclastic flow types have been observed in proximal deposits at Taranaki (Torres-Orozco et al., 2017b). Block-and-ash flows, formed from collapsing lava domes at the summit are most common in the North-West sector of Taranaki towards Stony River (Platz et al., 2007; Procter et al., 2010; Platz et al., 2012) and are most likely to mark the onset of an eruption at Taranaki (Torres-Orozco et al., 2017a). As the conduit supplying magma to the surface clears, unsteady eruption columns may collapse, forming pyroclastic flows of ash and pumice (Torres-Orozco et al., 2017a). Field evidence (Torres-Orozco et al., 2017b) suggests these pyroclastic flows are less channelised and can affect any volcanic flanks.
Despite the complexities of multiple flow types and source dynamics, pyroclastic flow mobility is strongly dependent on the VEI (Newhall and Hoblitt, 2002). We use pyroclastic flow run-out exceedance probabilities from Newhall and Hoblitt (2002) (Table 2) to estimate the probability of volcanic mass flows affecting Taranaki Crossing tracks at eruptions sizes of VEI≤2, VEI 3 and VEI ≥4. Figure 7 shows the probability of pyroclastic flows reaching or travelling further than the track, given a VEI≤2 eruption. Hazard is highest in the Manganui gorge to Boomerang slip sector of the track, being highly likely (probability >0.8) that a pyroclastic flow generated in an eruption would travel further than the track. In larger eruptions (VEI 3 and VEI ≥4, see Supplementary Material for maps), it is almost certain (probability >0.95) that a pyroclastic flow could travel well beyond the track.
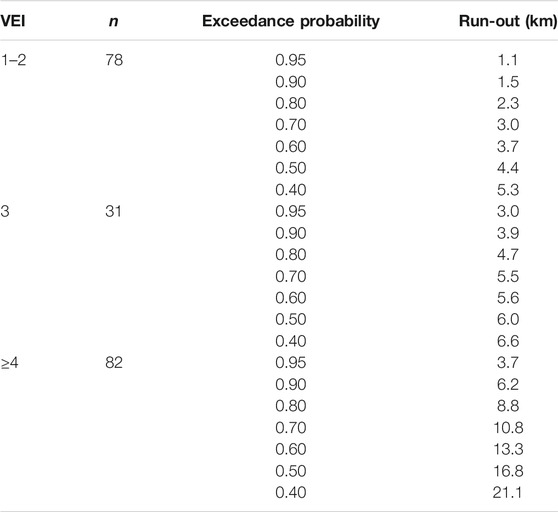
TABLE 2. Pyroclastic flow run-out (in km) exceedance probabilities (given an eruption) for VEI1-2, VEI3 and VEI≥4 from Newhall and Hoblitt (2002), probabilities less than 0.4 are not shown here.
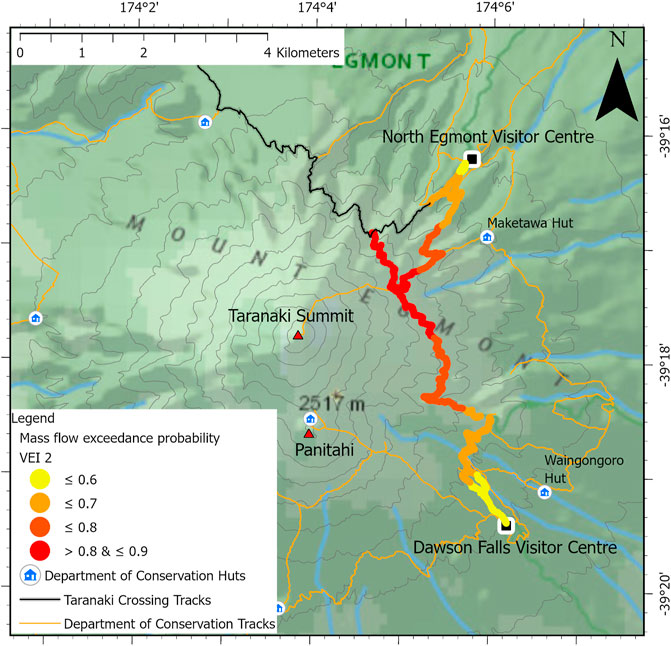
FIGURE 7. Exceedance probability for volcanic mass flows reaching or travelling further than Taranaki crossing track following a VEI≤2 eruption.
Ballistics, blocks >10 cm diameter explosively ejected from the vent or dome are likely to occur (to an unknown degree) at Taranaki during explosive clearing of the conduit and/or dome. Evidence of ballistics is present in proximal deposits at Taranaki (Torres-Orozco et al., 2017a); however the distribution (size, location) and relationship to eruption phases is so far unquantified. To estimate the distribution and impact of potential ballistics, we simulated 1 million realisations of ballistic trajectories from the summit dome, ejected with velocities normally distributed around 200 m/s (std. dev. of 50 m/s) at angles up to 30° from vertical, and ballistic diameters of 256 mm (lava block density ∼2,500 kg/m3) using the GBF ballistic simulator (Biass et al., 2016). Ejection velocities and angles were taken from the Fitzgerald et al. (2014) best-fit values of the August 2012 Tongariro (Upper Te Maari crater) eruption, ballistic diameter was taken as approximately the largest block shown in Torres-Orozco et al. (2017a) for Taranaki.
Ballistic impact locations were counted on a 100 m square grid (10,000 m2) as counts of impact per million ballistics. Mean impact energies in each grid across most tracks was greater than 3,600 J, well in excess of energies required to perforate all but reinforced concrete (Williams et al., 2017), meaning the probability of damage is controlled by the probability of impact. Assuming the track is 1 m wide, ∼ 200 ballistics could impact a 10 km section of track for every million ballistics ejected from Taranaki. However, the number of ballistics with a diameter of 256 mm or greater is likely to be much less than 1 million. For example, the 2012 eruption of Te Maari (a VEI 2 eruption, but a different eruption style) generated ∼13,000 ballistic particles (Fitzgerald et al., 2014). A similar number of ballistics at Taranaki would imply ∼2.6 ballistics could impact every 10 km of track, shown in Figure 8. While energies may scale with eruption size, the generation of ballistics is volume limited (i.e. only a finite number of 256 mm blocks can be created) in an initial explosive eruption to clear the conduit. Therefore, the number of ballistics per 10 km for larger eruptions is likely to be greater than the VEI2 lower bound, but may not increase proportionally to ash volume (i.e. not factor of 10 with VEI).
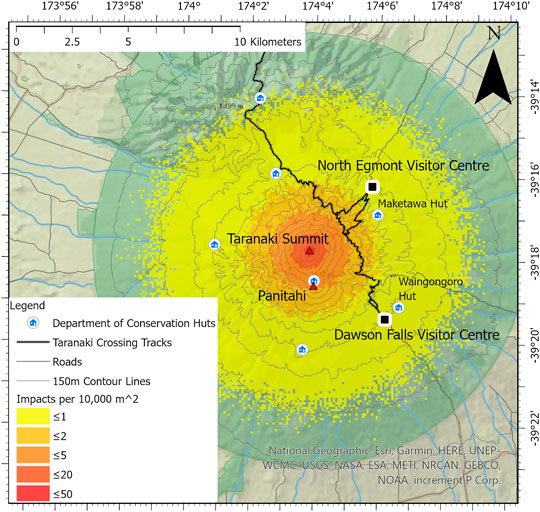
FIGURE 8. Count of ballistic particle impacts per 10,000 ballistic particles with a diameter of 256 mm.
Stability of the current Mt. Taranaki edifice was assessed using three-dimensional limit equilibrium analysis (LEA, Reid et al., 2000). Limit equilibrium analysis indicates edifice stability through the factor of safety (FOS), calculated as the ratio of forces resisting slope collapse (e.g. friction, cohesion) to forces acting to cause collapse (e.g. gravity, increased pore-water pressure). Factors of safety <1.0 indicate that collapse forces are higher than resisting forces (and slope failure is likely), while a FOS >1.0 indicates nominal stability of the slope (i.e. resisting forces are higher than gravitational forces). This approach has been applied to assess stability of various volcanic edifices around the globe (Reid et al., 2000; Vallance et al., 2004; Reid et al., 2010; Ball et al., 2018). The factor of safety for Mt. Taranaki is shown in Figure 9, using homogenous subsurface material properties similar to those used in other stratovolcano LEA studies (Ball et al., 2018; Kereszturi et al., 2020).
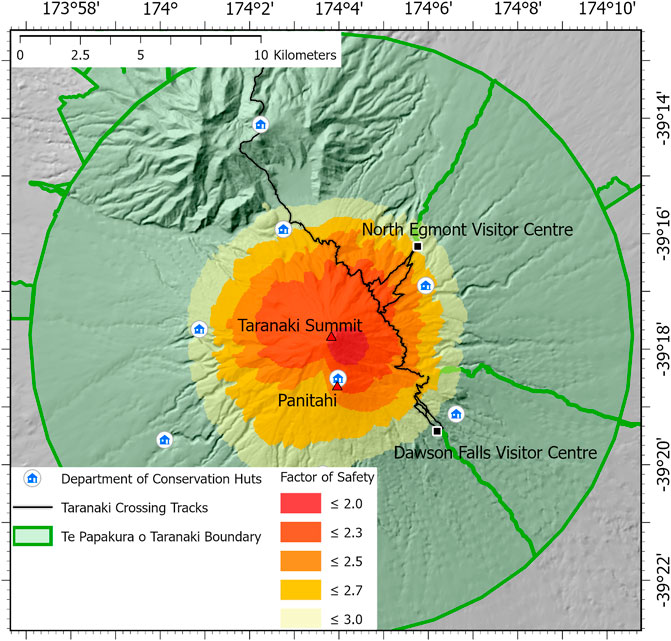
FIGURE 9. Minimum factor of safety for Mt. Taranaki edifice, calculated using Bishop’s simplified method in 3D.
Figure 9 shows the FOS of the Mt. Taranaki edifice is between 2.0 and 3.0 (FOS >3 are not shown), indicating the volcano is stable in its current form. The area of lowest FOS is the South-East flank of Mt. Taranaki, between the Northern and Southern Summit routes. The lower FOS in this region is caused by the steep slopes of the volcano flank (near Panitahi) increasing (relative) gravitational forces. The Eastern sector is nominally less stable than the remainder of the flank, and could pose an increased hazard; however, there is little difference in stability around the volcano and a large disturbance to stability (∼1–2 times the current resisting forces) is still required to create conditions leading to any flank instability and debris avalanches. To identify the probable source location of a debris avalanche affecting the Taranaki Crossing project area, we assume that potential slope failures with FOS <3, identified using the Reid et al. (2000) method, are equally likely due to the similarity in stability across the edifice. Overall, 48.5% of all potential failures (where FOS <3) occur in the Eastern sector of the volcano spanning the Taranaki crossing, with 23.8% occurring in the North-East sector likely to affect North Egmont Visitors Centre.
Given the Mt. Taranaki edifice is currently stable, a trigger is required to initiate debris avalanche collapse. Collapses can be triggered from a variety of changes to the volcano, including (but not limited to): saturation of material reducing the effective friction, changes to groundwater flow, alteration of subsurface material causing a reduction in cohesion and magmatic influences causing instability (Zernack et al., 2009; Zernack and Procter 2021). These catastrophic events are well studied and characterized in Taranaki, and were examined in the form of a stability limit range by Zernack et al. (2012), who estimate a current annual collapse probability of 0.00018.
As large eruptions are also likely to cause flank instability and collapse, the likelihood of eruption-triggered debris avalanches also needs to be assessed. Zernack et al. (2012) identified 14 debris avalanche deposits with volumes greater than 1 km3 over the past 130,000 years, corresponding to a frequency of 1 per 9,300 years Alloway et al. (1995) identified at least 10 major Taranaki-sourced tephra deposits in the last 28,000 years. Assuming these correspond to large (VEI≥4) eruptions, the frequency of large eruptions is approximately 1 per 2,800 years. From the ratio of large eruptions to debris avalanches, and assuming that debris avalanches are caused by large eruptions, the probability of a debris avalanche given a VEI≥4 eruption is at most 0.30. Using the current annual probability of a VEI≥4 eruption from Bebbington et al. (2018), we can estimate the current probability of collapse given a large eruption. By the theorem of total probability,
Assuming that P(collapse|no VEI 4+) is negligible in accordance with the FOS, equation 2 simplifies to
Given a failure, potential debris avalanche volumes calculated through LEA are shown in Figure 10. The flow volumes vary with local topography however, indicating that walking tracks mostly lie within the failure zones of debris avalanches, and total damage is likely on affected sectors of the track if a debris avalanche was to occur. Debris avalanches within the volume ranges shown in Figure 10 are likely to cause widespread destruction in proximal areas of the National Park, given the history of debris avalanches at Taranaki (Zernack, 2021).
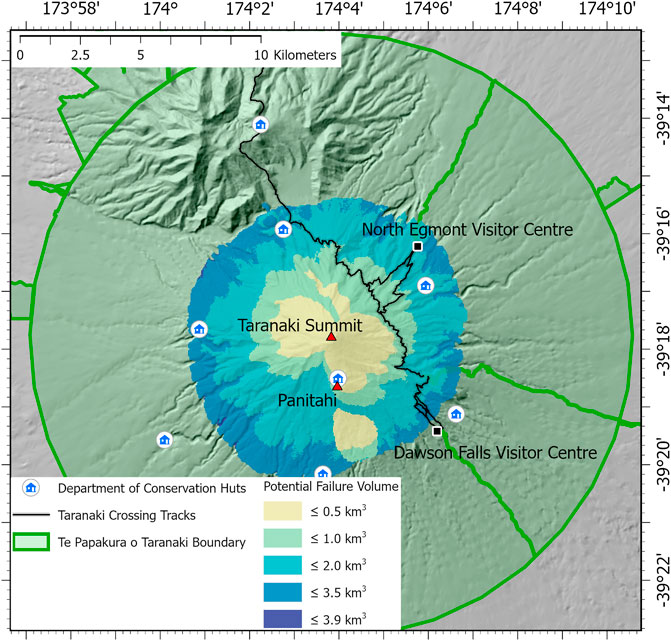
FIGURE 10. Potential failure volumes for FOS <3.0 at Mt. Taranaki.
The generation of lahars requires a readily mobile source of volcanic sediment (e.g. from ashfall, debris avalanche or pyroclastic flow deposits) within the catchment, supply of water (e.g. snow, rainfall) and a trigger such as intense rainfall or eruption on snow/ice (Vallance and Iverson, 2015). Lahars are likely to occur following any explosive eruption of Taranaki. Primary lahars affecting tracks around the volcano require a source of volcanic material (i.e. from block-and-ash flows) as well as seasonal snow/ice coverings. The probability of such climatic conditions is difficult to estimate; however, primary lahar occurrence is still limited by sediment source probabilities. Therefore, primary lahars could occur with similar probabilities as pyroclastic flows if the climatic pre-conditions (i.e. a large volume of snow) are present.
Lahars may travel further than a block-and-ash or pyroclastic flow due to their increased mobility, increasing hazard further from the vent (Thouret et al., 2020). Taranaki lahars may also initiate post-eruption from heavy rainfall mobilising eruption deposits (Cronin et al., 2021). The source area for these lahars (primary and secondary) is on upper catchments, through which much of the Taranaki Crossing tracks travel. These source areas are likely to already be impacted by the eruption material supplying the lahars. Therefore, we consider the probability of lahars affecting infrastructure to be conditional on (and therefore limited by) the probability of pyroclastic flows or ashfall affecting proximal infrastructure.
Taranaki crossing tracks and infrastructure within the National Park in general are likely to be affected by an eruption of Mt. Taranaki due to proximity to the summit vent. The probability chain (Figure 3), updated with estimated probabilities for Taranaki crossing tracks is shown in Figure 11. All probabilities except “Eruption” are conditional, where the overall probability of an outcome is the product of all preceding probabilities.
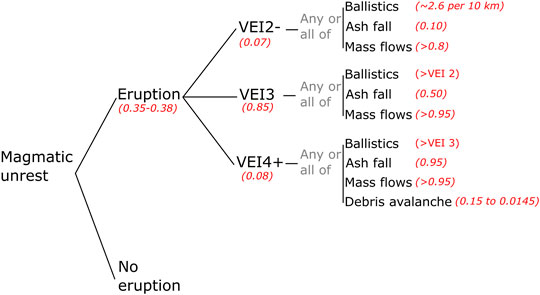
FIGURE 11. Simplified conditional probability chain with probabilities for main hazards to affect Taranaki Crossing project tracks in the next 50 years. Ashfall probabilities relate to the probability of >10 cm of ashfall falling on Taranaki Crossing project tracks.
Current eruption likelihood estimates (Bebbington et al., 2018; Damaschke et al., 2018) indicate there is a 0.35–0.38 probability of at least one eruption occurring within the next 50 years. The scale of eruption impacts is dependent on the eruption size, with eruption style, generated hazards and environmental factors (e.g. wind) affecting impacts. Eruption effects could range from minor disruption (e.g. closure of tracks/park for several days) to large-scale damage to huts, tracks and facilities requiring new visitor and park management strategies. Expert elicitation (Bebbington et al., 2018) suggests medium sized eruptions are more likely than very large and very small eruptions, and the most likely size of the next eruption is a VEI 3 (0.85 probability). This would cause minor to moderate disruption to the National Park as a whole, but may significantly affect proximal park infrastructure.
In terms of hazards, volcanic mass flows (lahars, pyroclastic flows or block and ash flows) are almost certain to affect the Taranaki crossing following the most likely VEI 3 eruption (probability ∼0.99), with ashfall thicker than 10 cm being likely (probability ∼0.51). These probabilities are more representative of the proximal sections of the Taranaki crossing tracks between Manganui Gorge and Boomerang slip, and lower probabilities (and damage) expected for tracks further from the summit. Estimated probabilities for key hazards are shown in Table 3, and are conditional on 1) an eruption occurring (probability between 0.35 and 0.38 of one or more eruptions in the next 50 years) and 2) the likelihood of a specific size eruption.

TABLE 3. Summary of estimated probabilities affecting Taranaki Crossing project tracks.
Table 4 summarises estimated hazard probabilities at North Egmont Visitors Centre using the same probability chain, but with hazard estimation methods differing (for ashfall and block-and-ash flows) to provide a more detailed quantification of hazard in this location.
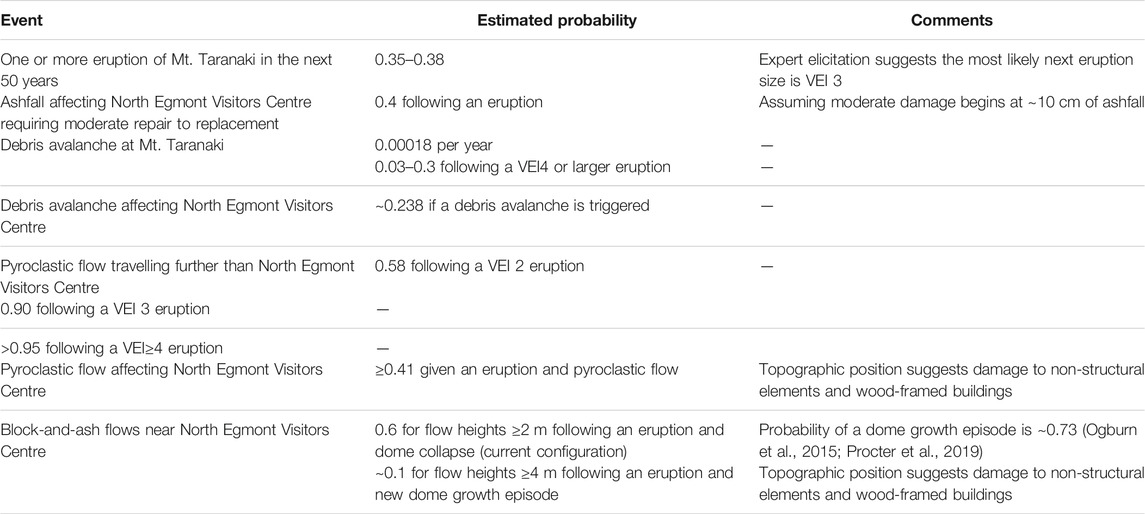
TABLE 4. Summary of estimated probabilities for events at North Egmont Visitors Centre.
We have taken a location-centered approach (Carpignano et al., 2009) to constructing a probabilistic volcano hazard analysis for proximal infrastructure at Taranaki. The focus on exposed locations/infrastructure, and not the hazard, simplifies event-tree type hazard assessments and allows substitution or simplification of appropriate hazard estimation methodologies given the infrastructure and its exposure. Some key simplifications are:
• calculation of ashfall exceedance probabilities across all walking tracks is debatable using the Bebbington et al. (2008) method, due to the statistical nature of the method, proximity to the vent and consequent difficulty in distinguishing a low-level wind pattern; whereas the empirical estimation of Newhall and Hoblitt (2002) is more robust and hence suitable.
• Proximity to the hazard source enables grouping of lahar, block-and-ash and pyroclastic flow hazards due to the similarity in impacts, mitigation strategies and generation mechanisms.
• The summit vent was assumed as the source of the eruption, as the probabilities of impact to Taranaki Crossing (shown in Table 3) did not materially change with the satellite cone (Panitahi) as the source.
• This hazard assessment is valid for the next eruption or opening phase at the Taranaki summit. Continued activity (particularly debris avalanches) could alter volcano morphology, requiring a new assessment. Further damage in post-opening phases is likely (Torres-Orozco et al., 2018), but the impact of the initial phase would likely require different management decisions, and therefore impact limits, for exposed infrastructure.
These decisions enable a quantitative estimate of hazard that is reasonable within the scope of the infrastructure, its exposure and potential costs. However, some assumptions may not be appropriate for distal infrastructure, different elements or locations. For example, hazards from Panitahi eruptions may cause larger effects on tracks and infrastructure located in the SW of the park. Critically, the use of empirical global datasets for hazard estimates where volcano-specific data/models were insufficient (i.e. ashfall and pyroclastic flow hazard for walking tracks) limits the applicability to areas where topographic effects (e.g. channelization) are expected to be minimal due to proximity to the summit vent. Specific data for Taranaki volcano may be used to augment these datasets; however caution is required for proximal assessment where preservation of deposits can be limited (Torres-Orozco et al., 2017b). For example, deposit sequences near North Egmont Visitors Centre suggest a ≥0.41 probability of pyroclastic flows, whereas the Newhall and Hoblitt (2002) data suggest the probability is ≥ 0.58. Here, we favour the use of global datasets as the historical observations have provided a more conservative estimate of impact.
Regardless of differing hazard methodologies or assumptions, the probability chain (Figure 3) provides a structured approach to considering conditional probabilities in order to provide quantitative estimates (Table 3, Table 4) of volcanic hazards for the infrastructure. This is a significant improvement to volcanic hazard assessment proximal to the Taranaki summit vent, and is particularly useful in supporting decision-making for asset planning and infrastructure management within the national park.
Through a location-centered approach, volcanic hazards at infrastructure proximal to the Taranaki summit vent have been quantified probabilistically. The assessment shows walking tracks and North Egmont Visitors Centre are likely to be affected by an eruption of the summit vent of Taranaki. The probability of an eruption in the next 50 years is approximately 0.35–0.38, with the most likely eruption size being VEI 3 (probability 0.85 conditional on an eruption).
Given an eruption, the scale of eruption hazards is conditional on its size; therefore a conditional probability chain was constructed to provide quantitative hazard estimates that are methodology-agnostic. Small eruptions (VEI 2 or less) are likely to affect some parts of the track with volcanic mass flows (probability >0.8), while ashfall impacts are likely to be minor (probability of 0.1 to exceed 9 cm of ash at 5 km from the vent) and volcano ballistic impacts are estimated to occur at a rate of 2.6 for every 10 km of track. Eruptions larger than VEI 2 are almost certain to cause impact from volcanic mass flows, with the chance of more than 10 cm of ashfall (an estimated threshold for requiring manual clean-up) estimated as between 0.5 and 0.95. In addition to these hazards, very large eruptions (VEI 4 or greater) may also trigger debris avalanches (0.15–0.015 probability) affecting the eastern sector of Taranaki. Different ashfall and block-and-ash flow estimation methodologies were applied to quantify hazard at North Egmont Visitors Centre, where block-and-ash flows greater than 2 m in depth are expected to occur with a probability of 0.6, given a dome growth episode (probability ∼0.73) and statistical estimates of the ashfall probability for more than 10 cm of ash estimated at 0.4, given an eruption.
The hazard assessment methodology demonstrated here provides a pathway to quantify volcanic multi-hazards for proximal infrastructure, where appropriate estimation methods may vary between infrastructure and potential magnitude of the hazard. This results in quantitative estimates of volcanic hazards, a significant improvement to previous hazard assessments proximal to the Taranaki summit vent.
The raw data supporting the conclusion of this article will be made available by the authors, without undue reservation.
SM, JP and MB contributed to conception, design, statistical analysis and writing of the manuscript. CR-G and SM contributed to modelling components of the manuscript.
This research has been supported by the Resilience to Nature’s Challenges National Science Challenge “Volcanism” science programme and the New Zealand Department of Conservation.
The authors declare that the research was conducted in the absence of any commercial or financial relationships that could be construed as a potential conflict of interest.
All claims expressed in this article are solely those of the authors and do not necessarily represent those of their affiliated organizations, or those of the publisher, the editors and the reviewers. Any product that may be evaluated in this article, or claim that may be made by its manufacturer, is not guaranteed or endorsed by the publisher.
The authors acknowledge the use of New Zealand eScience Infrastructure (NeSI) high-performance computing facilities as part of this research.
The Supplementary Material for this article can be found online at: https://www.frontiersin.org/articles/10.3389/feart.2022.832531/full#supplementary-material
Alloway, B., McComb, P., Neall, V., Vucetich, C., Gibb, J., Sherburn, S., et al. (2005). Stratigraphy, Age, and Correlation of Voluminous Debris‐avalanche Events from an Ancestral Egmont Volcano: Implications for Coastal plain Construction and Regional hazard Assessment. J. R. Soc. New Zealand 35 (1-2), 229–267. doi:10.1080/03014223.2005.9517782
Alloway, B., Neall, V. E., and Vucetich, C. G. (1995). Late Quaternary (post 28,000 Year B.P.) Tephrostratigraphy of Northeast and central Taranaki, New Zealand. J. R. Soc. New Zealand 25 (4), 385–458. doi:10.1080/03014223.1995.9517496
Ball, J. L., Taron, J., Reid, M. E., Hurwitz, S., Finn, C., and Bedrosian, P. (2018). Combining Multiphase Groundwater Flow and Slope Stability Models to Assess Stratovolcano Flank Collapse in the Cascade Range. J. Geophys. Res. Solid Earth 123 (4), 2787–2805. doi:10.1002/2017JB015156
Baxter, P. J., Boyle, R., Cole, P., Neri, A., Spence, R., and Zuccaro, G. (2005). The Impacts of Pyroclastic Surges on Buildings at the Eruption of the Soufriére Hills Volcano, Montserrat. Bull. Volcanol 67 (4), 292–313. doi:10.1007/s00445-004-0365-7
Bayarri, M. J., Berger, J. O., Calder, E. S., Dalbey, K., Lunagomez, S., Patra, A. K., et al. (2009). Using Statistical and Computer Models to Quantify Volcanic Hazards. Technometrics 51 (4), 402–413. doi:10.1198/TECH.2009.08018
Bebbington, M., Cronin, S. J., Chapman, I., and Turner, M. B. (2008). Quantifying Volcanic Ash Fall hazard to Electricity Infrastructure. J. Volcanology Geothermal Res. 177 (4), 1055–1062. doi:10.1016/j.jvolgeores.2008.07.023
Bebbington, M. S., Stirling, M. W., Cronin, S., Wang, T., and Jolly, G. (2018). National-level Long-Term Eruption Forecasts by Expert Elicitation. Bull. Volcanol 80 (6), 56. doi:10.1007/s00445-018-1230-4
Biass, S., Falcone, J.-L., Bonadonna, C., Di Traglia, F., Pistolesi, M., Rosi, M., et al. (2016). Great Balls of Fire: A Probabilistic Approach to Quantify the hazard Related to Ballistics - A Case Study at La Fossa Volcano, Vulcano Island, Italy. J. Volcanology Geothermal Res. 325, 1–14. doi:10.1016/j.jvolgeores.2016.06.006
Carpignano, A., Golia, E., Di Mauro, C., Bouchon, S., and Nordvik, J. P. (2009). A Methodological Approach for the Definition of Multi‐risk Maps at Regional Level: First Application. J. Risk Res. 12 (3-4), 513–534. doi:10.1080/13669870903050269
Cronin, S. J., Zernack, A. V., Ukstins, I. A., Turner, M. B., Torres-Orozco, R., Stewart, R. B., et al. (2021). The Geological History and Hazards of a Long-Lived Stratovolcano, Mt. Taranaki, New Zealand. New Zealand J. Geology. Geophys. 64 (2-3), 1–23. doi:10.1080/00288306.2021.1895231
Damaschke, M., Cronin, S. J., and Bebbington, M. S. (2018). A Volcanic Event Forecasting Model for Multiple Tephra Records, Demonstrated on Mt. Taranaki, New Zealand. Bull. Volcanol 80 (1), 9. doi:10.1007/s00445-017-1184-y
Department of Conservation, (2021). Taranaki Crossing. Available at: https://www.doc.govt.nz/our-work/taranaki-crossing/ (Accessed February 15, 2022).
Erfurt-Cooper, P. (2011). Geotourism in Volcanic and Geothermal Environments: Playing with Fire? Geoheritage 3 (3), 187–193. doi:10.1007/s12371-010-0025-6
Fitzgerald, R. H., Tsunematsu, K., Kennedy, B. M., Breard, E. C. P., Lube, G., Wilson, T. M., et al. (2014). The Application of a Calibrated 3D Ballistic Trajectory Model to Ballistic hazard Assessments at Upper Te Maari, Tongariro. J. Volcanology Geothermal Res. 286, 248–262. doi:10.1016/j.jvolgeores.2014.04.006
Galderisi, A., and Limongi, G. (2021). A Comprehensive Assessment of Exposure and Vulnerabilities in Multi-Hazard Urban Environments: A Key Tool for Risk-Informed Planning Strategies. Sustainability 13, 9055. doi:10.3390/su13169055
Harnett, C. E., Thomas, M. E., Calder, E. S., Ebmeier, S. K., Telford, A., Murphy, W., et al. (2019). Presentation and Analysis of a Worldwide Database for Lava Dome Collapse Events: the Global Archive of Dome Instabilities (GLADIS). Bull. Volcanology 81 (3), 1–17. doi:10.1007/s00445-019-1276-y
Hayes, J. L., Wilson, T. M., and Magill, C. (2015). Tephra Fall Clean-Up in Urban Environments. J. Volcanology Geothermal Res. 304, 359–377. doi:10.1016/j.jvolgeores.2015.09.014
Jenkins, S., Wilson, T., Magill, C., Miller, V., Stewart, C., Marzocchi, W., et al. (2014). Volcanic Ash Fall hazard and Risk: Technical Background Paper for the UN-ISDR 2015 Global Assessment Report on Disaster Risk Reduction.
Jolly, G. E., Keys, H. J. R., Procter, J. N., and Deligne, N. I. (2014). Overview of the Co-ordinated Risk-Based Approach to Science and Management Response and Recovery for the 2012 Eruptions of Tongariro Volcano, New Zealand. J. Volcanology Geothermal Res. 286, 184–207. doi:10.1016/j.jvolgeores.2014.08.028
Kereszturi, G., Schaefer, L. N., Miller, C., and Mead, S. (2020). Hydrothermal Alteration on Composite Volcanoes: Mineralogy, Hyperspectral Imaging, and Aeromagnetic Study of Mt Ruapehu, New Zealand. Geochem. Geophys. Geosyst. 21 (9), e2020GC009270. doi:10.1029/2020GC009270
Keys, H. J. R., Green, P. M., and Green, P. M. (2008). Ruapehu Lahar New Zealand 18 March 2007: Lessons for Hazard Assessment and Risk Mitigation 1995-2007. J. Disaster Res. 3 (4), 284–296. doi:10.20965/jdr.2008.p0284
Komendantova, N., Scolobig, A., Garcia-Aristizabal, A., Monfort, D., and Fleming, K. (2016). Multi-risk Approach and Urban Resilience. Ijdrbe 7 (2), 114–132. doi:10.1108/IJDRBE-03-2015-0013
Leonard, G. S., Stewart, C., Wilson, T. M., Procter, J. N., Scott, B. J., Keys, H. J., et al. (2014). Integrating Multidisciplinary Science, Modelling and Impact Data into Evolving, Syn-Event Volcanic hazard Mapping and Communication: A Case Study from the 2012 Tongariro Eruption Crisis, New Zealand. J. Volcanology Geothermal Res. 286, 208–232. doi:10.1016/j.jvolgeores.2014.08.018
Lerner, G. A., Cronin, S. J., Bebbington, M. S., and Platz, T. (2019b). The Characteristics of a Multi-Episode Volcanic Regime: the post-AD 960 Maero Eruptive Period of Mt. Taranaki (New Zealand). Bull. Volcanol 81 (11), 61. doi:10.1007/s00445-019-1327-4
Lerner, G. A., Cronin, S. J., Turner, G. M., and Rowe, M. C. (2019a). Paleomagnetic Determination of the Age and Properties of the 1780-1800 AD Dome Effusion/collapse Episode of Mt. Taranaki, New Zealand. Bull. Volcanol 81 (3), 1–20. doi:10.1007/s00445-019-1275-z
Mead, S., Procter, J., and Bebbington, M. (2022). Probabilistic Volcanic Mass Flow hazard Assessment Using Statistical Surrogates of Deterministic Simulations. Earth Space Sci. Open Archive [Preprint]. doi:10.1002/essoar.10510568.1
Neall, V. E., and Alloway, B. V. (1996). Volcanic Hazard Map of Western Taranaki. Palmerston North: Massey University.
Neall, V. E. (1979). Geological Map of New Zealand: Sheets P19, P20, & P21: New Plymouth, Egmont, and Manaia. Department of Scientific and Industrial Research.
Neall, V., Stewart, R., and Smith, I. (1986). History and Petrology of the Taranaki Volcanoes. Royal Soc. New Zealand Bulletin 23, 251–263.
Newhall, C., and Hoblitt, R. (2002). Constructing Event Trees for Volcanic Crises. Bull. Volcanol 64 (1), 3–20. doi:10.1007/s004450100173
Ogburn, S. E., Loughlin, S. C., and Calder, E. S. (2015). The Association of Lava Dome Growth with Major Explosive Activity (VEI ≥ 4): DomeHaz, a Global Dataset. Bull. Volcanol 77 (5), 40. doi:10.1007/s00445-015-0919-x
Oikawa, T., Yoshimoto, M., Nakada, S., Maeno, F., Komori, J., Shimano, T., et al. (2016). Reconstruction of the 2014 Eruption Sequence of Ontake Volcano from Recorded Images and Interviews. Earth Planet. Sp 68 (1), 79. doi:10.1186/s40623-016-0458-5
Patra, A. K., Bauer, A. C., Nichita, C. C., Pitman, E. B., Sheridan, M. F., Bursik, M., et al. (2005). Parallel Adaptive Numerical Simulation of Dry Avalanches over Natural Terrain. J. Volcanology Geothermal Res. 139 (1-2), 1–21. doi:10.1016/j.jvolgeores.2004.06.014
Platz, T., Cronin, S. J., Cashman, K. V., Stewart, R. B., and Smith, I. E. M. (2007). Transition from Effusive to Explosive Phases in Andesite Eruptions - A Case-Study from the AD1655 Eruption of Mt. Taranaki, New Zealand. J. Volcanology Geothermal Res. 161 (1–2), 15–34. doi:10.1016/j.jvolgeores.2006.11.005
Platz, T., Cronin, S. J., Procter, J. N., Neall, V. E., and Foley, S. F. (2012). Non-explosive, Dome-Forming Eruptions at Mt. Taranaki, New Zealand. Geomorphology 136 (1), 15–30. doi:10.1016/j.geomorph.2011.06.016
Procter, J., Bebbington, M. S., and Mead, S. (2019). Pouakai Crossing Volcanic hazard Assessment. New Zealand: Volcanic Risk Solutions.
Procter, J. N., Cronin, S. J., Platz, T., Patra, A., Dalbey, K., Sheridan, M., et al. (2010). Mapping Block-And-Ash Flow Hazards Based on Titan 2D Simulations: a Case Study from Mt. Taranaki, NZ. Nat. Hazards 53 (3), 483–501. doi:10.1007/s11069-009-9440-x
Procter, J. N., Zernack, A. V., and Cronin, S. J. (2021). “Computer Simulation of a Volcanic Debris Avalanche from Mt. Taranaki, New Zealand,” in Volcanic Debris Avalanches: From Collapse to Hazard. Editors M. Roverato, A. Dufresne, and J. Procter (Cham: Springer International Publishing), 281–310. doi:10.1007/978-3-030-57411-6_11
Pyle, D. M. (1989). The Thickness, Volume and Grainsize of Tephra Fall Deposits. Bull. Volcanol 51 (1), 1–15. doi:10.1007/BF01086757
Reid, M. E., Brien, D. L., and Waythomas, C. F. (2010). Preliminary Slope-Stability Analysis of Augustine Volcano: Chapter 14 in the 2006 Eruption of Augustine Volcano. Alaska: US Geological Survey.
Reid, M. E., Christian, S. B., and Brien, D. L. (2000). Gravitational Stability of Three-Dimensional Stratovolcano Edifices. J. Geophys. Res. 105 (B3), 6043–6056. doi:10.1029/1999JB900310
Rhoades, D. A., Dowrick, D. J., and Wilson, C. J. N. (2002). Volcanic Hazard in New Zealand: Scaling and Attenuation Relations for Tephra Fall Deposits from Taupo Volcano. Nat. Hazards 26 (2), 147–174. doi:10.1023/A:1015608732356
Sandri, L., Thouret, J.-C., Constantinescu, R., Biass, S., and Tonini, R. (2014). Long-term Multi-hazard Assessment for El Misti Volcano (Peru). Bull. Volcanol 76 (2), 1–26. doi:10.1007/s00445-013-0771-9
Sandri, L., Tierz, P., Costa, A., and Marzocchi, W. (2018). Probabilistic Hazard from Pyroclastic Density Currents in the Neapolitan Area (Southern Italy). J. Geophys. Res. Solid Earth 123 (5), 3474–3500. doi:10.1002/2017JB014890
Thouret, J.-C., Antoine, S., Magill, C., and Ollier, C. (2020). Lahars and Debris Flows: Characteristics and Impacts. Earth-Science Rev. 201, 103003. doi:10.1016/j.earscirev.2019.103003
Tonini, R., Sandri, L., Rouwet, D., Caudron, C., Marzocchi, W., and Suparjan, (2016). A New Bayesian Event Tree Tool to Track and Quantify Volcanic Unrest and its Application to Kawah Ijen Volcano. Geochem. Geophys. Geosyst. 17 (7), 2539–2555. doi:10.1002/2016GC006327
Torres-Orozco, R., Cronin, S. J., Damaschke, M., and Pardo, N. (2017a). Diverse Dynamics of Holocene Mafic-Intermediate Plinian Eruptions at Mt. Taranaki (Egmont), New Zealand. Bull. Volcanol 79 (11), 76. doi:10.1007/s00445-017-1162-4
Torres-Orozco, R., Cronin, S. J., Pardo, N., and Palmer, A. S. (2017b). New Insights into Holocene Eruption Episodes from Proximal deposit Sequences at Mt. Taranaki (Egmont), New Zealand. Bull. Volcanol 79 (1), 3. doi:10.1007/s00445-016-1085-5
Torres-Orozco, R., Cronin, S. J., Pardo, N., and Palmer, A. S. (2018). Volcanic hazard Scenarios for Multiphase Andesitic Plinian Eruptions from Lithostratigraphy: Insights into Pyroclastic Density Current Diversity at Mount Taranaki, New Zealand. GSA Bull. 130 (9-10), 1645–1663. doi:10.1130/B31850.1
Turner, M. B., Bebbington, M. S., Cronin, S. J., and Stewart, R. B. (2009). Merging Eruption Datasets: Building an Integrated Holocene Eruptive Record for Mt Taranaki, New Zealand. Bull. Volcanol 71 (8), 903–918. doi:10.1007/s00445-009-0274-x
Turner, M. B., Cronin, S. J., Bebbington, M. S., and Platz, T. (2008). Developing Probabilistic Eruption Forecasts for Dormant Volcanoes: a Case Study from Mt Taranaki, New Zealand. Bull. Volcanol 70 (4), 507–515. doi:10.1007/s00445-007-0151-4
Vallance, J. W., and Iverson, R. M. (2015). “Lahars and Their Deposits,” in The Encyclopedia of Volcanoes. Editor H. Sigurdsson (Academic Press), 649–664. doi:10.1016/B978-0-12-385938-9.00037-7
Vallance, J. W., Schilling, S., Devoli, G., Reid, M., Howell, M., and Brien, D. (2004). Lahar Hazards at Casita and San Cristóbal Volcanoes, Nicaragua. Reston, VA: US Geological Survey.
Wild, A. J., Wilson, T. M., Bebbington, M. S., Cole, J. W., and Craig, H. M. (2019). Probabilistic Volcanic Impact Assessment and Cost-Benefit Analysis on Network Infrastructure for Secondary Evacuation of Farm Livestock: A Case Study from the Dairy Industry, Taranaki, New Zealand. J. Volcanology Geothermal Res. 387, 106670. doi:10.1016/j.jvolgeores.2019.106670
Williams, G. T., Kennedy, B. M., Wilson, T. M., Fitzgerald, R. H., Tsunematsu, K., and Teissier, A. (2017). Buildings vs. Ballistics: Quantifying the Vulnerability of Buildings to Volcanic Ballistic Impacts Using Field Studies and Pneumatic Cannon Experiments. J. Volcanology Geothermal Res. 343, 171–180. doi:10.1016/j.jvolgeores.2017.06.026
Zernack, A. V., Cronin, S. J., Bebbington, M. S., Price, R. C., Smith, I. E. M., Stewart, R. B., et al. (2012). Forecasting Catastrophic Stratovolcano Collapse: A Model Based on Mount Taranaki, New Zealand. Geology 40 (11), 983–986. doi:10.1130/G33277.1
Zernack, A. V., Cronin, S. J., Neall, V. E., and Procter, J. N. (2011). A Medial to Distal Volcaniclastic Record of an Andesite Stratovolcano: Detailed Stratigraphy of the Ring-plain Succession of South-West Taranaki, New Zealand. Int. J. Earth Sci. (Geol Rundsch) 100 (8), 1937–1966. doi:10.1007/s00531-010-0610-6
Zernack, A. V., Procter, J. N., and Cronin, S. J. (2009). Sedimentary Signatures of Cyclic Growth and Destruction of Stratovolcanoes: A Case Study from Mt. Taranaki, New Zealand. Sediment. Geology. 220 (3), 288–305. doi:10.1016/j.sedgeo.2009.04.024
Zernack, A. V., and Procter, J. N. (2021). “Cyclic Growth and Destruction of Volcanoes,” in Volcanic Debris Avalanches: From Collapse to Hazard. Editors M. Roverato, A. Dufresne, and J. Procter (Cham: Springer International Publishing), 311–355. doi:10.1007/978-3-030-57411-6_12
Zernack, A. V. (2021). “Volcanic Debris-Avalanche Deposits in the Context of Volcaniclastic Ring Plain Successions-A Case Study from Mt. Taranaki,” in Volcanic Debris Avalanches: From Collapse to Hazard. Editors M. Roverato, A. Dufresne, and J. Procter (Cham: Springer International Publishing), 211–254. doi:10.1007/978-3-030-57411-6_9
Keywords: volcanic forecasting, event tree, probablistic hazard assessment, volcanic hazard, volcanic mass flows, volcanic ashfall, volcano ballistic hazard
Citation: Mead S, Procter J, Bebbington M and Rodriguez-Gomez C (2022) Probabilistic Volcanic Hazard Assessment for National Park Infrastructure Proximal to Taranaki Volcano (New Zealand). Front. Earth Sci. 10:832531. doi: 10.3389/feart.2022.832531
Received: 09 December 2021; Accepted: 03 March 2022;
Published: 28 March 2022.
Edited by:
Karen Fontijn, Université libre de Bruxelles, BelgiumReviewed by:
Ben Clarke, University of Leicester, United KingdomCopyright © 2022 Mead, Procter, Bebbington and Rodriguez-Gomez. This is an open-access article distributed under the terms of the Creative Commons Attribution License (CC BY). The use, distribution or reproduction in other forums is permitted, provided the original author(s) and the copyright owner(s) are credited and that the original publication in this journal is cited, in accordance with accepted academic practice. No use, distribution or reproduction is permitted which does not comply with these terms.
*Correspondence: Stuart Mead, cy5tZWFkQG1hc3NleS5hYy5ueg==
Disclaimer: All claims expressed in this article are solely those of the authors and do not necessarily represent those of their affiliated organizations, or those of the publisher, the editors and the reviewers. Any product that may be evaluated in this article or claim that may be made by its manufacturer is not guaranteed or endorsed by the publisher.
Research integrity at Frontiers
Learn more about the work of our research integrity team to safeguard the quality of each article we publish.