- 1School of Civil Engineering, Shaoxing University, Shaoxing, China
- 2Key Laboratory of Rock Mechanics and Geohazards of Zhejiang Province, Shaoxing University, Shaoxing, China
- 3State Key Laboratory of Safety and Health for Metal Mines, Maanshan, China
With the ending of deep-concave open-pit phosphorite extractions and gradual exhausting of shallow mineral resources, stoping of phosphorite seams has entered or will enter into underground mining. Particularly for excavating slightly inclined thin and medium-thick phosphorite orebodies, roof and surface control under different mining methods is crucial for safe and efficient exploitations. In this study, the study area is located in Kunyang Phosphorite Mine characterized by slightly inclined thin and medium-thick deposits. Based on the occurrence conditions, orebody thickness, dip angle, and more factors, the mining methods of underground phosphorite are selected, including room and pillar mining, cement backfill mining, and caving mining. Numerical analysis on roof deformation and surface subsidence under the three methods is performed. The results show that the amount of roof and surface subsidence decreases successively by the caving method, room and pillar method, and cement backfill method. The maximum roof and surface subsidence by the caving method is 45.7 and 13.3 cm, respectively. Regarding shallow orebodies, the open-pit slope is obviously disturbed by the caving method and room and pillar mining method. Hence, slope displacement monitoring should be emphasized. Compared with the other two methods, the backfill mining method can use mined wastes as backfill materials and has less influence on the roof and surface during stoping and is better at controlling slope stability.
Introduction
Phosphorite is not renewable and replaceable. As an important strategic resource, it is the material basis of food supply and fine phosphorus chemical production (Dhahri et al., 2016; Zhang et al., 2020). Phosphorite deposits in China are dominated by sedimentary phosphorite that accounts for 79% of the reserves. The average grade of Chinese phosphorite is only about 17%. More than 75% of ore beds are inclined or mildly inclined, with thin-to-medium thickness. With the ending of stoping of deep-concave open-pit phosphorite orebodies and gradual depletion of shallow mineral resources (Ren et al., 2020), an increasing number of phosphorite mines in China are about to embark on or have stepped into underground mining (Li et al., 2019; Zhou et al., 2019; Yao et al., 2020). Many open-pit mines, including metal mines, nonmetallic mines, and coal mines, have transferred into underground excavations in other countries (Li et al., 2006; Zheng et al., 2014; Li Xiaoshaug et al., 2021), such as Kiirunavaara Mine in Sweden, Kidd Greek Copper Mine in Canada, and Pyhasalmi Iron Mine in Finland. Domestic examples having converted from open-pit to underground mining include Fenghuangshan Iron Mine in Jiangsu Province, Tongguanshan Copper Mine in Anhui Province, Liangshan Iron Mine in Jiangxi Province, Jinling Iron Mine in Shandong Province, and so on. Only a few open-pit phosphorite mines have transferred into underground mining. On the other hand, phosphorite is mainly sedimentary, occurrences of which are far distinct from those of metal ores (Deng and Bian 2007; Steiner et al., 2015). To this day, few publications are involved with the stoping of phosphorite seams with slight inclination and thin-to-medium thickness. Systematical analysis of roof deformation and surface subsidence during mining of this kind of orebody has never performed before.
In the global scientific community, there are some scholars who have investigated the stratum movement and surface deformation during phosphorite mining through theoretical analysis, numerical simulation, laboratory test, and other approaches. Chi et al. (2020) proposed a slice and strip mining method for mildly inclined orebodies and optimized the mining parameters on the basis of country rock disturbance and stress distribution. Considering the actual technical and economic conditions of current phosphorite mines, Li et al. (2015) discussed the mining methods of deep phosphorite through field investigation, theoretical analysis, and engineering analogy. Taking Heiliangshan Phosphorite Mine as the engineering background, Chen et al. (2018) analyzed the bearing mechanism, failure pattern, and main influencing factors of deep ore pillars and deduced a formula for calculating the safety coefficient of square pillars based on Platts’ theory and Bieniawski formula. Zheng et al. (2015) studied the failure process and modes of rockfalls during underground phosphorite mining based on field investigation and laboratory experiments using a gravitational simulation device. Huang et al. (2017) developed a comprehensive real-time monitoring system for high and steep slopes to continuously inspect slope stability in the process of shifting from open-pit to underground mining at Xifeng Phosphorite Mine in Guizhou province. They also examined the stress and displacement changes under the combined impacts of open-pit and underground mining. Researchers in other countries mainly studied the influence of phosphorite mining on the environment (Abed et al., 2008; Gnandi et al., 2009; Abou El Anwar et al., 2020; Galmed et al., 2020; Paat et al., 2021). In general, systematical research on overburden movement and surface deformation in the process of converting open-pit to underground phosphorite mining has not been performed. The investigation on this issue under different mining methods for slightly inclined thin and medium-thick phosphorite orebodies is even rare.
Therefore, in this article, Kunyang Mine with slightly inclined thin and medium-thick phosphorite deposits is taken as the research background. Underground mining methods are selected first, including the room and pillar mining method, cement backfill mining method, and caving mining method. Then, roof deformation and surface subsidence in underground phosphorite mining by these three methods are analyzed based on numerical simulations. It is expected to enrich the theory and practice of complex and difficult underground mining in China and provide guidance on the stoping of phosphorite or other nonmetallic orebodies.
Description of the Mine Site
Kunyang Phosphorite Mine is located at 72.0 km southwest of Kunming City and is 2.0 km south away from Dianchi Lake. Currently, open-pit mining is carried out in the east and west stopes of the fourth district. The average dip angle of the orebodies is 16°, gentle in the east region and steep in the west region. There are two phosphorite seams sandwiching a soft layer with an average thickness of about 1.0 m. The interlayer is thicker in the east and thinner in the west. The overall occurrence of the orebodies is consistent with the mountain slope, extending to both sides of the mountain along the strike. The orebodies gradually have a deletion and extend to the deep, and the thickness of the interlayer becomes thinner. The average thickness of the phosphorite seams is 7∼8 m. The soft interlayer is sorted out after mining. The earth surface is planned to be stripped to a level of about 2,160∼2,170 m, the designed final mining elevation is 2,100 m, the final slope height is about 62 m, and the dip length is about 88 m, as detailed in the numerical model described in Model establishment and simulation scheme.
As open-pit mining gradually transfers to the deep of the earth surface, the stripping ratio increases. Continued application of open-pit mining can cause surpassing of the economic and reasonable stripping ratio. Moreover, transport distance increases and slope safety problems become prominent, leading to a large increase of safety management investment and production cost. Accordingly, phosphorite mining is bound to face the challenge of shifting open-pit extractions to underground excavations.
Selection of the Mining Methods
In underground extractions regarding nonmetallic orebodies, the main mining methods in China include open stoping, backfill mining, caving mining, and shrinkage stoping (Yu et al., 2017; Jiang et al., 2020; Xu et al., 2021). The most common form of open stoping is room and pillar mining which has the advantages of simple layout of rooms, mature mining technology, and good roof management. The height of the room is the thickness of the orebody. The length of the room ranges from 50 to 60 m, and the width of the room is 6∼15 m. Ore pillars with a width of 5∼10 m are successively retained. Barrier pillars can also be set. The biggest advantage of backfill mining is that it can effectively control the deformation of the overlying strata and restrain surface subsidence. The cement backfill mining method is widely used by adding gel materials to the backfill materials. Loose backfill materials can be condensed to form a whole with certain strength so that the backfill quality can be improved as well as the mining conditions. Meanwhile, with the support of the backfill body (Li et al., 2020; Li Meng et al., 2021), further pillar recovery can be conducted for reducing ore dilution and loss rates.
Caving mining is applied in flat-laying or slightly dipping orebodies with medium thickness. Within an orebody, a long-wall or short-wall face advances along the strike. As the mining face continues to proceed, a mined void is formed. The country rock does not collapse immediately but is temporarily supported by pillars. Until the exposed roof is large enough, all or part of the country rock is collapsed so that the caved blocks can fill the mined void and play a role in controlling the mine pressure in the stope. In this method, the developing entry layout as well as the cutting process is simple. Generally, the overburden above the gob presents a regular three-zone distribution. Sufficient caved blocks, surrounding rocks, and face supports jointly constitute an integrated support system.
In conclusion, according to the changes in the thickness and inclination of the phosphorite deposits in Kunyang Phosphorite Mine, three mining methods, namely, room and pillar mining, cement backfill mining, and caving mining are selected for numerical research on roof deformation and surface subsidence during phosphorite stoping.
Model Establishment and Simulation Scheme
Model Establishment
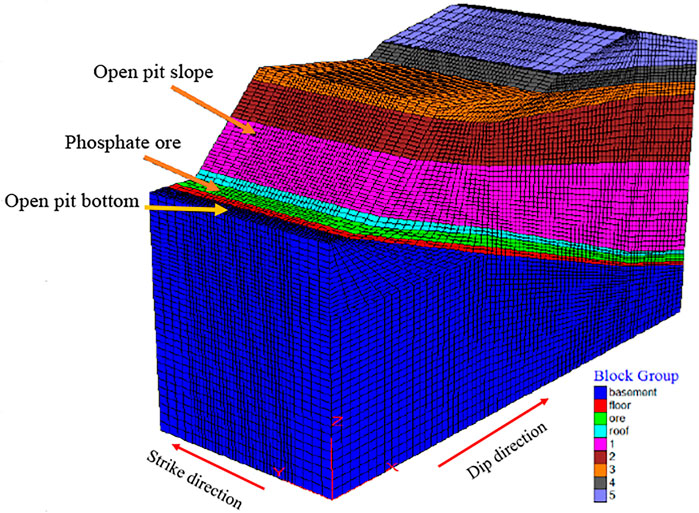
Based on the geological conditions of the study site, the model is 400 m wide along the dip and extends 210 m from the surface. Along the strike, the designed excavation length is 90 m in total. To eliminate the boundary effect, the model length is 3∼5 times the minimum advance distance. 30-m-length pillars are reserved at both ends. Therefore, the model strike length is 150 m in total, as shown in Figure 1. The Mohr–Coulomb model is utilized as the constitutive model. To closely mimic the physical fields in reality, roller boundary, restricting the movement in the X direction and allowing the movement in the Y and Z directions. Similarly, along the boundary in the strike direction, the Y axis is supported by roll shafts to constrain the movement in the Y direction. The rock mass can move along the X and Z directions. In the vertical direction, only the Z axis is supported by the roller boundary in the bottom to constrain the displacement in the Z direction. The top surface is a free face without any constraints. The layout of developing entries is simplified, and the entry, shaft, inclined shaft, crossheading, and ore chute are simplified as entities.
According to current mining conditions and layout of Kunyang Phosphorite Mine, the structural parameters of rooms and pillars for the three mining methods are set as follows (Please refer to Figure 2):
1) In room and pillar mining, the length of ore rooms along the strike is 12 m, the pillar width is 6 m, and the orebody length in the dip direction is 60 m.
2) On the basis of the room and pillar method, backfill mining is used to first fill the mined-out room and then extract the ore pillar.
3) In caving mining, the orebody length is 90 m along the strike direction and 60 m along the dip direction.
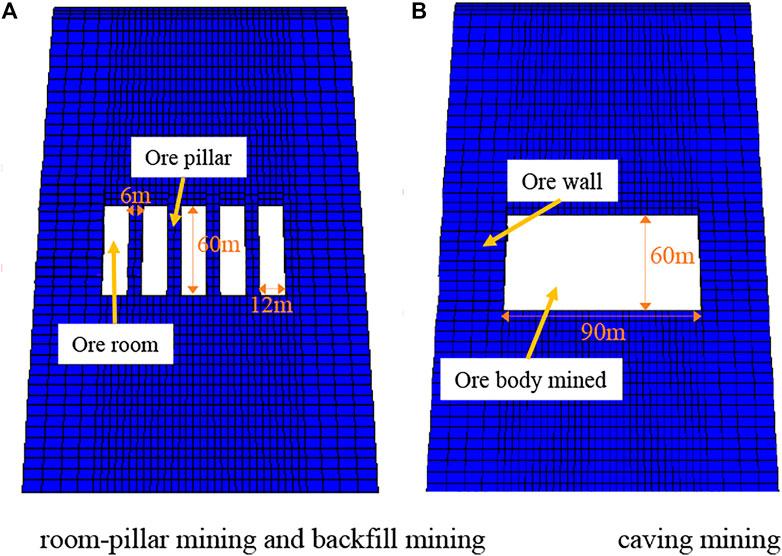
FIGURE 2. Structure and size of rooms and pillars. (A) Room and pillar mining and backfill mining. (B) Caving mining.
Modeling Scheme
The numerical software 3.0 version of FLAC3D is used to simulate the roof deformation and surface subsidence in underground phosphorite mining by the room and pillar mining method, cement backfill mining method, and caving mining method. The detailed modeling schemes by these three methods are shown in Figures 3–5.
Room and Pillar Mining Method
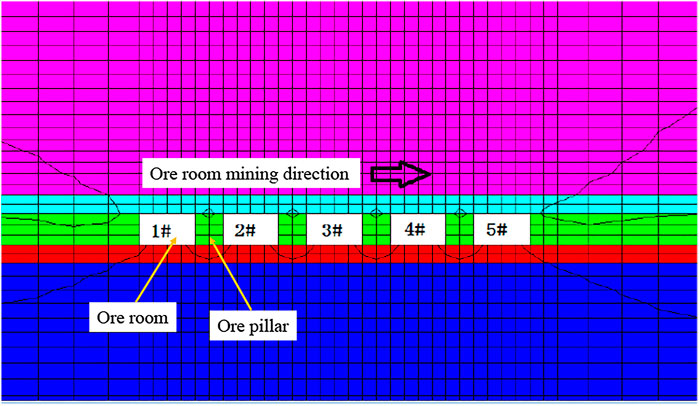
Ore rooms are arranged in the orebody, as shown in Figure 3. Along the strike, the room length is 12.0 m and the pillar width is 6.0 m. The ore rooms are serially numbered as 1# to 5#. They are excavated in sequence (not at once) and then separated by retained ore pillars that are serially named as Ⅰ to Ⅳ.
Backfill Mining Method
The cement backfill mining method is adopted, and the layout of the developing entry is similar to that in room and pillar mining. However, the cement backfill system, layout of the backfill drift, and backfill and recovery operations at the working face need to be arranged. The selected structural parameters of ore rooms and pillars are the same as those in room and pillar mining. First, the orebodies hosted in the rooms are excavated one by one. In the ore room, the backfill work lags behind a certain distance to the work face (one ore body). That is, 1# room is excavated and then 2# room will be excavated. 1# room will be backfilled and then the excavation of 3# room and the backfill of 2# room, this loop continues until all the ore rooms are excavated and backfilled. After all the ore rooms are mined out, recovery and backfill of the ore pillar begins. The mining and backfill schematic of rooms and pillars is illustrated in Figure 4.
Caving Mining Method
The work face progresses along the strike. The gob roof collapses completely. The whole dip length is taken as the work face length (60.0 m). The advance length of the orebody is 90.0 m so as to make a comparison with the other two mining methods. To reduce calculation time, element meshing is facilitated and convergence is speeded up; each advance distance is set at 15.0 m, and the orebody is excavated six times in total, as shown in Figure 5. During modeling, orebody mining is carried out according to the sequence numbers 1–6.
Model Parameters
After sample collection in the field, rock specimens are prepared in the laboratory. The processed specimens have good integrity without (or with few) weak structural planes. Thereby, the mechanical parameters obtained in the laboratory tests cannot fully render the mechanical properties of natural rock masses.
In order to precisely present the mechanical characteristics of rock masses, in situ test or back analysis needs to be performed. Among many methods, the Hoek–Brown empirical formula is extensively utilized for rock mechanical evaluation in geotechnical engineering. Hoek et al. introduced the empirical method for evaluating the mechanical parameters of rock masses and pointed out that rock strength can be estimated by the Hoek–Brown criterion:
where σ1 and σ3 are the maximum and minimum principal stresses when the rock mass fails, respectively, and the compressive stress is specified as positive. σci is the uniaxial compressive strength of the intact rock.
In the formulae, GSI is the geological strength index with a value range of 0–100, which can be comprehensively assessed in combination with the rock mass structure with structural plane conditions. D is the disturbance factor varying between 0 and 1, indicating the influence degree of blasting damage and stress relaxation resulted by excavations. mi is the rock mass parameter that can be evaluated by triaxial tests.
According to the abovementioned Hoek–Brown empirical formula and laboratory mechanical tests, the parameters of phosphorite and roof and floor rock in the fourth district of Kunyang Phosphorite Mine can be obtained (Table 1). Backfill mining simulation in this study is based on the mechanical properties of the backfill materials in other districts, as listed in Table 2.
Simulation Results and Discussions
Roof Deformation Law
Room and Pillar Mining Method
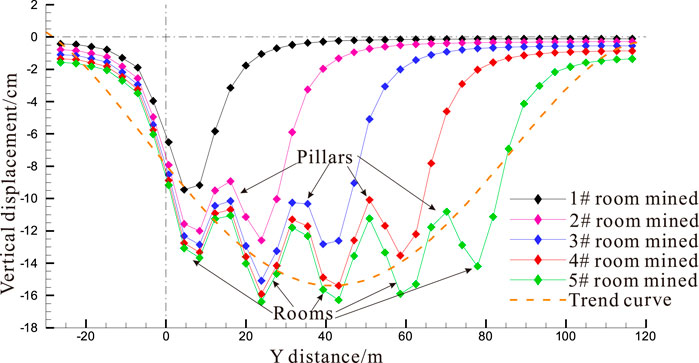
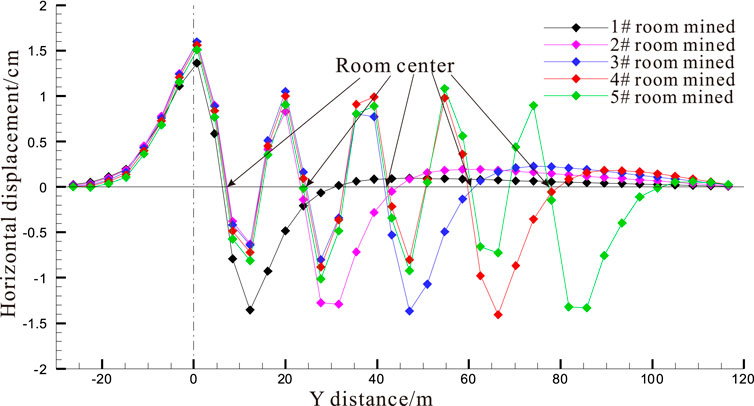
Displacement monitoring lines are set in the roof, 4 m above the ore rooms. The vertical and horizontal displacement curves at the roof are plotted in Figures 6, 7, respectively. In the Figures, Y = 0 corresponds to the position at which the first work face begins. As more rooms are mined out, roof subsidence increases gradually. The roof rocks above the two endwalls have relatively small subsidence and tend to be stable.
As illustrated in Figure 6, each wave trough suggests the roof subsidence above one gob, and each wave peak manifests the roof subsidence above a pillar. After Room 1# is excavated, the roof has a large vertical displacement of about 9.6 cm. Then, the adjacent Room 2# is mined out and the roof displacement increases to 12.1 cm. After this, the increment of roof subsidence diminishes, indicating that mining disturbance is weakened. In the end, when Room 5# is extracted, maximum subsidence is observed in the rocks above the 2#, 3#, and 4# rooms which are supported by interval pillars, However, Rooms 1# and 5# are supported by interval pillars and barrier pillars (end walls), producing smaller roof subsidence. The orange curve in Figure 6 is the trend line of vertical roof displacement. The roof in the center area has the maximum vertical displacement and gradually becomes stable when approaching the end walls.
In Figure 7, the right horizontal direction is the positive direction of the Y axis, that is, “+” refers to the right horizontal displacement and “−” denotes the left horizontal displacement. From Figure 7, it can be found that roof subsidence leads to horizontal movement of the rocks over the walls. After Room 1# is extracted, the horizontal displacement of the roof center is zero. Extending to both sides, the horizontal displacement of the roof shows a symmetric distribution along the roof center. After stoping Room 2#, an interval pillar is left unmined. There is no horizontal displacement in the rock mass above the pillar center. The roof at the left above the pillar center horizontally moves toward the left direction, with a decrease in displacement. The roof at the right above the pillar center horizontally moves to the right direction, but the value becomes smaller. With the extractions of more rooms, the orebody at the right side experiences the change of being the endwall to an interval pillar, and horizontal displacement curves undergo a reverse of direction. The horizontal displacement of Room 1# is negative after excavating, that is, negative on the Y axis with a value of 1.4–1.6 cm. After mining Room 2#, the horizontal displacement of the roof left away from the pillar decreases to 0.6–1.1 cm in the negative direction, while the horizontal displacement of the roof right away from the pillar decreases to 0.9–1.1 cm in the positive direction. As Rooms 3#, 4#, and 5# being mined in sequence, the horizontal displacement gradually tends to be stable.
Cement Backfill Mining Method
Figure 8 displays the vertical displacement curves of the roof at 4 m above the rooms during cement backfill mining. It can be seen that the roof vertical displacement during backfill mining is similar to that in room and pillar mining. After Room 1# is excavated, the vertical displacement curve is completely the same as that in room and pillar mining. With the mining of another room and the backfill of the previous room, tendencies and shapes of the curves are generally similar. The overall displacement amount decreases significantly, but the roof subsidence is still affected by the working room and secondary excavation of the adjacent room. After the completion of Room 5#, a maximum value (11.9 cm) of roof subsidence is observed, 27.88% less than that by the room and pillar method (16.5 cm). After Room 5# is backfilled, the roof subsidence only has a small increase by about 0.5 cm in comparison with the roof subsidence after Room 4# is filled.
Caving Mining Method
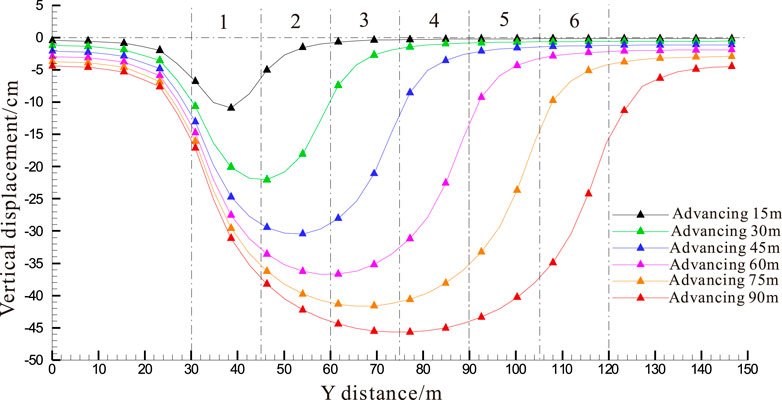
In caving mining, the work face advances along the strike. The gob is unsupported by pillars. As mining proceeds, the roof releases pressure significantly, the relief area increases as well, and the vertical displacement of the roof becomes larger. During advancing the work face, displacement monitoring lines are arranged at 4 m over the gob to record the variations of vertical and horizontal displacements of the roof. Figure 9 presents the vertical displacement curves of the roof above the gob at different advance distances.
Since the gob has no other supports except the surrounding orebodies in caving mining, continuous uniform subsidence appears in the roof as mining progresses. When the work face advances a distance of 15, 30, 45, 60, 75, and 90 m, the corresponding maximum vertical displacement of the roof is 10.9, 22.0, 30.4, 36.9, 41.8, and 45.7 cm, respectively, all located in the roof above the gob center.
The orebody in front of the work face produces a large displacement as the face advances. The subsidence of the roof about 12∼15 m far ahead the work face approaching 0. After face advanced 45 m, the influence range of vertical displacement increases and obvious subsidence occurs in the orebody far ahead the work face. As a whole, the vertical displacement of the roof over the gob exhibits an axisymmetric distribution along the centerline of the gob. Mining is stopped when the work face advances 90 m. The vertical displacement of the roof at 20 m distance from the centerline of the gob is relatively stable and forms a flat “bowl-shape” distribution.
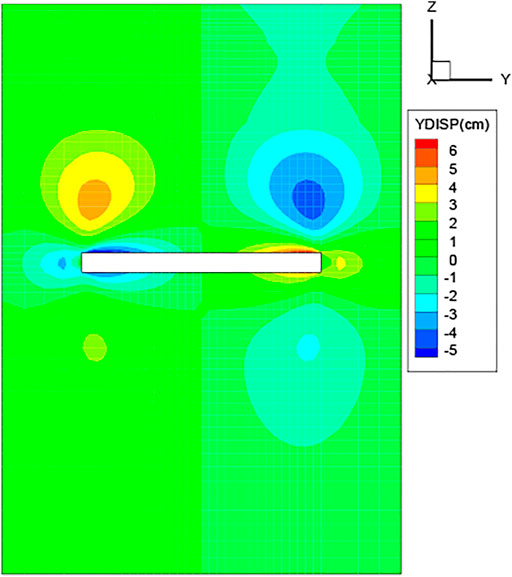
Figure 10 is a cloud map of horizontal displacement of the stope along the strike (Y distance) after the work face advanced 90 m. In the Figure, the right horizontal direction is the positive direction of the Y axis, that is, “+” refers to right horizontal displacement and “−” denotes left horizontal displacement. The horizontal displacement is symmetrically distributed along the center line of the gob, but the directions are opposite. Generally, the left part of the overlying rocks produces right horizontal displacement, while the right part of the overlying rocks horizontally moves to the left direction. The areas with maximum horizontal displacement in the two parts are both located in the rocks approaching the walls. Within the range of 8 m around the end walls, the left roof, floor, and wall generate left horizontal displacement. However, the right roof, floor, and wall produce right horizontal displacement.
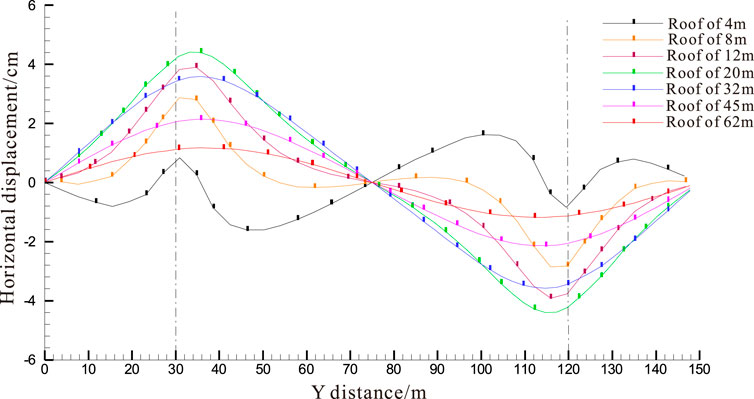
It is noticed from Figure 11 that the horizontal displacement curves of the roof at different heights above the rooms are symmetrically distributed along the center of the gob. The overlying rocks at 8 m above the walls have a larger horizontal displacement due to subsidence of the center, leading to relative horizontal movement. The maximum horizontal displacement is about 4.3 cm in the overlying rocks 20 m above the gob and 5 m away from the wall center. At the areas of 4 and 8 m above the roof, the overlying rocks above the walls produce horizontal displacement different from other areas in the direction. This may be due to the fact that the gob has no support during mining. The interaction between the roof and walls can be simplified as “cantilever beam”. The rocks above the walls are subjected to shearing action. Large shear stress is produced and makes the rocks distorted locally. In addition, ore walls are in a zone of high-stress concentration. Ore walls are always under pressure in the mining process, resulting in large lateral pressure and deformation in the rocks.
Surface Movement Characteristics
Room and Pillar Mining Method
The roof collapses after exploiting the orebody hosted in the room. This causes subsidence of the overburden and produces network fractures that gradually extend upward. When more rooms are excavated and the span is longer, the overburden subsidence intensifies and gradually spreads to the surface. Supplementary Figure S1 provides an isosurface drawing of overburden subsidence after five rooms are excavated. The surface movement is mainly concentrated in the surface area directly above the ore rooms. There is an open pit at the left side of the surface, with a slope angle of 45°. According to Figure 12, room and pillar mining has little influence on the slope.
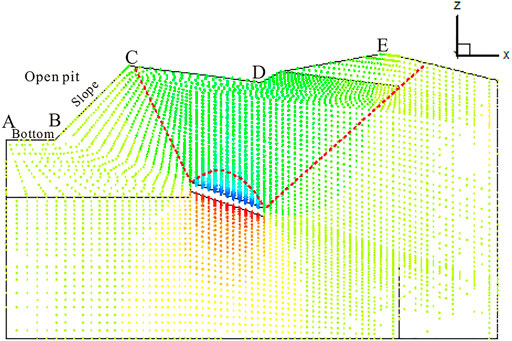
FIGURE 12. Vector graph of vertical displacements of the overburden and surface during room and pillar mining.
Displacement monitoring lines are set at the surface along the advance direction to observe the vertical displacement of the surface during room and pillar mining, as shown in Figure 13.
Points A, B, C, D, and E in Figure 13 correspond to the positions at the surface in Figure 12, respectively. Point A is set at the bottom of the open pit. Points B and C are located at the foot and the crest of the slope, respectively. Point D is at the lowest position of a surface depression directly above the working face. Point E is at the mountain peak.
From Figure 13, it is noted that the vertical displacement of the surface increases with the mining process. The maximum displacement is observed at the left part of the surface depression, namely, 4.96 cm. The vertical displacement of Point D is 4.7 cm. There is no obvious subsidence at the bottom of the open pit (Point A) and the foot of the slope (Point B). Vertical displacement starts from the middle part of the slope. The displacement at the crest of the slope (Point C) and at the mountain peak (Point E) is about 1.0 cm. The surface subsidence increases as more rooms are mined; however, the incremental amplitude decreases gradually.
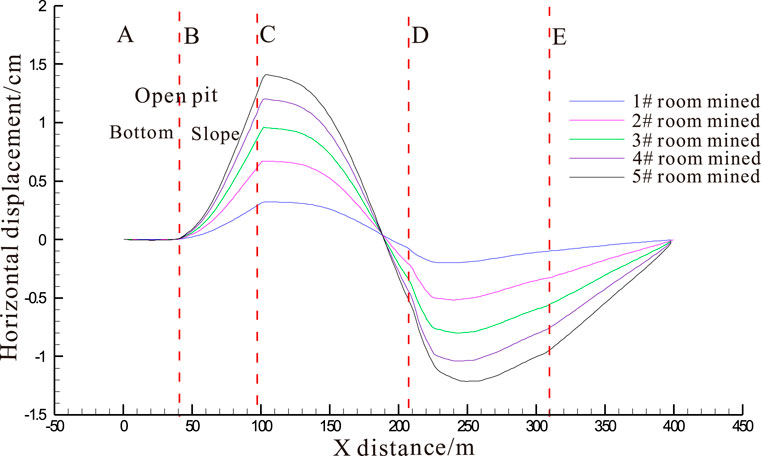
The horizontal displacement curves of the surface in the mining process are given in Figure 14. It is clearly seen that the open pit and the slope foot are hardly disturbed by mining operations and have no horizontal displacement. Right horizontal displacement occurs at the middle part of the slope. The maximum horizontal displacement is 1.4 cm, located at the site about 5 m right away from the slope top (Point C). The horizontal displacement of the surface depression is relatively small. The lowest point of the depression (Point D) produces a left horizontal displacement of 0.5 cm. The displacement of the mountain peak (Point E) is 0.9 cm. From the depression to the hillside boundary, the entire mountain slopes have a left horizontal displacement, and the mountain slope has a right strike. Therefore, the mountain slopes are basically in a stable state.
Cement Backfill Mining Method
After Room 1# is mined and before it is filled, surface subsidence occurs, and the value is the same as that in room and pillar mining. Afterward, with continuous mining and backfilling, the roof is being supported by pillars, surrounding rocks, and backfill materials. The roof subsidence is gradually restricted. Compared with room and pillar mining, the roof subsidence is greatly relieved during backfill mining, and the surface deformation decreases as well.
Figure 15 depicts the vertical displacement curves of the surface during pillar mining and backfilling in sequence. It shows that the maximum value of roof subsidence is 2.72 cm when all mining and backfill activities are completed. The bottom of the open pit has the same subsidence with the slope foot (about 1.1 mm). At 65 m along the X distance, subsidence increases gradually from 2.1 mm at the central part of the slope to 9.3 mm at the crest of the slope (Point C). The depression is always the worst area affected by mining activities. The left slope about 10 m away from Point D produces a maximum subsidence (2.72 cm) which is about 45.2% less than the maximum subsidence in room and pillar mining (4.96 cm). Compared with the room and pillar method, the disturbance to the right mountain slope is also greatly reduced. The influence on the surface 50 m right away from Point E decreases sharply.
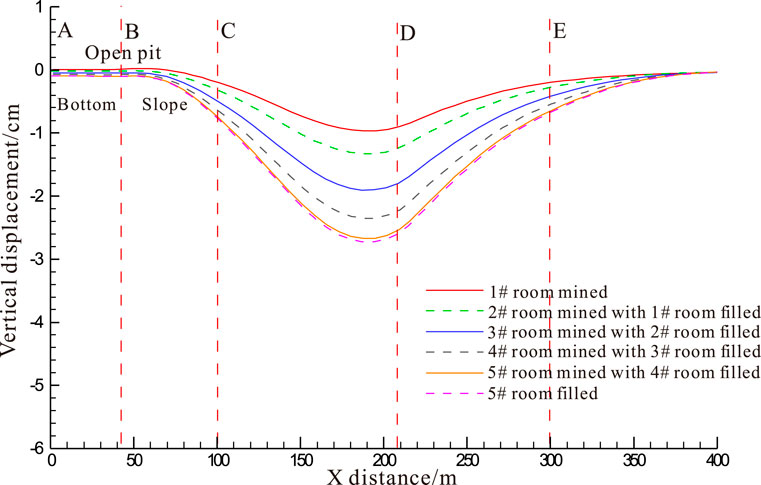
FIGURE 15. Vertical displacement curves of the surface as pillar mining and backfilling in sequence.
The horizontal displacement curves of the surface during pillar mining and backfilling in sequence are shown in Figure 16. It is clear that there is no horizontal displacement at the bottom of the open pit. The horizontal displacement of the open-pit slope gradually increases from 2.4 to 9.3 mm, with a right direction. From the slope crest (Point C) to the surface depression, the horizontal displacement of the surface gradually decreases. Afterward, from Point D to the mountain peak (Point E), the surface moves horizontally to the left direction. When all pillars are retreated and filled, the horizontal displacement is about 8.2 mm. The right slope of the mountain still generates left horizontal displacement, but the displacement magnitude is significantly reduced compared with that in room and pillar mining.
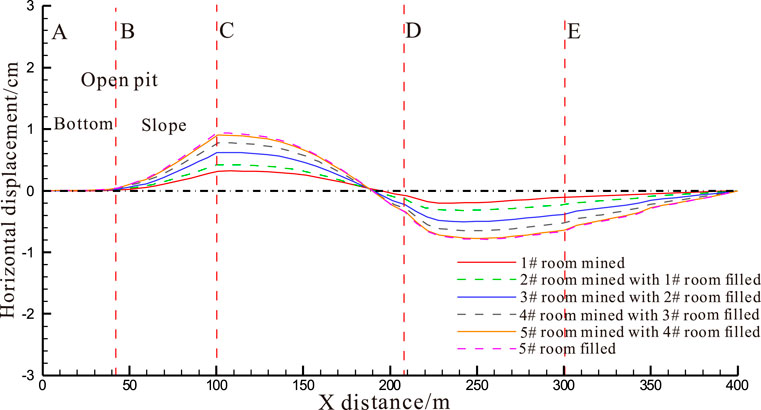
FIGURE 16. Horizontal displacement curves of the surface as pillar mining and backfilling in sequence.
Caving Mining Method
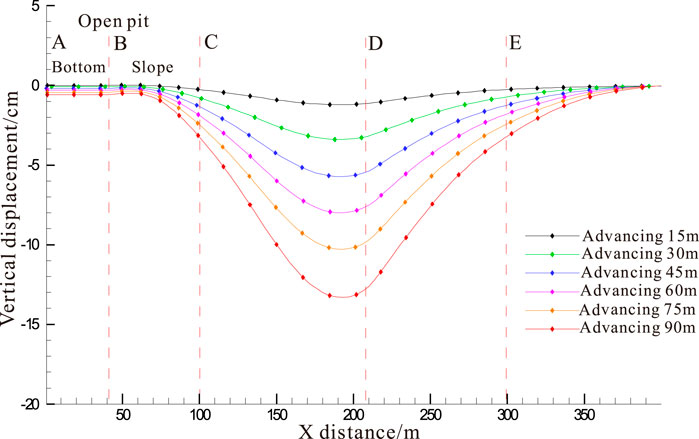
In caving mining, the gob area continues to increase as the work face advances, and the disturbance range continues to expand to the surface in the vertical direction. It poses potential risks to open-pit slope stability and mountain safety. Therefore, monitoring lines are set at the surface along the dip to record the vertical displacement of the surface under different advance distances (Figure 17).
When the first face advances 15 m, there is little subsidence at the bottom of the open pit (Point A). When advancing 30∼45 m ahead, the vertical displacement at Point A is 1.8∼3.0 mm. When the advance distance is 90 m, the open pit subsidence is 5.7 mm. In the process of advancing, the slope of the open pit is obviously disturbed by mining operations. The influence degree increases gradually from the foot to the crest of the slope. To the end of mining operations, the vertical displacement at the slope top (Point C) is 3.71 cm. The slope at both sides of the depression shows obvious subsidence, and the disturbance degree increases as advance distance increases. The maximum subsidence (13.31 cm) is located at about 10 m left away from Point D (the lowest position of the depression). The subsidence of the mountain peak (Point E) has a linear increase. The displacement of the right hillside gradually decreases along the dip.
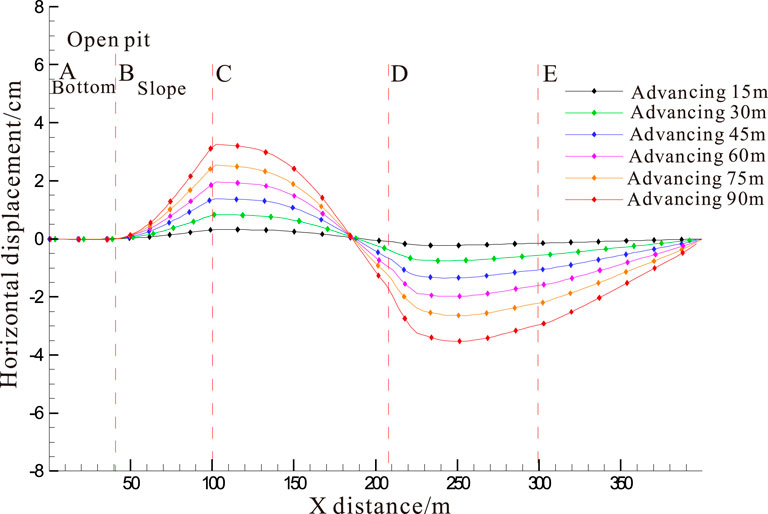
Figure 18 plots the horizontal displacement curves of the surface at different advance distances. It can be seen that no horizontal displacement occurs at the bottom of the open pit. This indicates that advance distance has little disturbance to the bottom of the open pit. There is no obvious horizontal displacement at the foot of the slope (Point B). The horizontal displacement gradually increases from the slope foot upward the top of the slope (Point C), and the direction is forwarding the positive X axis. The horizontal displacement at Point C increases nearly linearly as the advance distance increases, namely, increases from 0.31 cm as the advance distance is 15 m, to 1.8 cm as face advances forward 45 m, and finally to 3.1 cm when all excavations are finished. From the top of the slope (Point C) to the surface depression, a right horizontal displacement occurs. The right slope of the depression, the mountain peak, and the right mountain slope gradually moves to the left, and the displacement value gradually increases with advancing distance. Hence, mountain slope monitoring should be highlighted in the next stage of mining.
Main Conclusion
Based on the fourth district in Kunyang Phosphorite Mine, according to the occurrence conditions, orebody thickness, dip angle, and other parameters, three mining methods including room and pillar mining, cement backfill mining, and caving mining are selected for comparison analysis; numerical simulation by means of FLAC3D is applied to investigate roof deformation and surface slope stability. The main conclusions are drawn below:
1) Caving mining causes maximum roof subsidence, followed by room and pillar mining, and cement backfill mining causes minimum roof subsidence with the supporting of backfill materials. Compared with the maximum vertical displacement the roof in room and pillar mining (16.2 cm), the maximum vertical displacement the roof in caving mining is 45.7 cm, and then the roof has the minimum subsidence in cement backfill mining (12.1 cm).
2) The disturbance to the earth surface decreases successively by the caving mining method, room and pillar mining method, and cement backfill mining method. When the caving method is adopted, the maximum surface subsidence is 13.3 cm, and the maximum horizontal displacement of the surface is 4.3 cm. During room and pillar mining, the maximum surface subsidence is 4.96 cm and the maximum horizontal displacement of the surface is 1.5 cm. In cement backfill mining, the maximum surface subsidence is 2.72 cm and the maximum surface horizontal displacement is 1.02 cm. Due to the shallow depth of orebodies, surface displacement by the caving and room and pillar methods is larger. Therefore, the monitoring of mountain slope displacement should be highlighted.
3) Caving mining has the greatest influence on the overlying rocks and Earth’s surface. In the mining process, the bottom of the open pit produces a vertical displacement of 5.7 mm, while it is not disturbed in room and pillar mining and backfill mining. The slope of the open pit is obviously disturbed, and the disturbance is intensified from the slope foot to slope top. In room and pillar mining, the slope foot is stable, and the subsidence starts from the middle part of the slope. As more rooms are mined out, the increment of the roof subsidence gradually slows down. In cement backfill mining, the maximum roof subsidence is 2.72 cm, which is 45.2% less than that in room and pillar mining.
4) At present, the room and pillar mining method is still mostly preferred in nonmetallic mining due to abundant experience and mature and reliable technology, but the pillars are not easy to recover by this method. The backfill mining method can use mined wastes as backfill materials and has little influence on the Earth’s surface. It is able to facilitate roof management and improve work safety. The caving mining method has the advantages of simple layout and low rate of orebody loss and dilution, but it is poor at controlling mine pressure and may induce large roof and surface subsidence.
Data Availability Statement
The original contributions presented in the study are included in the article/Supplementary Material, further inquiries can be directed to the corresponding authors.
Author Contributions
XL and YW developed the outline of this research and wrote the initial version of the manuscript. YH and CZ were responsible for data processing and figure plotting. HZ edited the manuscript. All authors reviewed and finalized the manuscript.
Funding
This work was supported by the National Natural Science Foundation of China (41867033) and Postdoctoral Science Foundation of China (2019M650144) and State Key Laboratory of Safety and Health for Metal Mines (zdsys2019-005).
Conflict of Interest
The authors declare that the research was conducted in the absence of any commercial or financial relationships that could be construed as a potential conflict of interest.
Publisher’s Note
All claims expressed in this article are solely those of the authors and do not necessarily represent those of their affiliated organizations, or those of the publisher, the editors, and the reviewers. Any product that may be evaluated in this article, or claim that may be made by its manufacturer, is not guaranteed or endorsed by the publisher.
Supplementary Material
The Supplementary Material for this article can be found online at: https://www.frontiersin.org/articles/10.3389/feart.2022.831856/full#supplementary-material
SUPPLEMENTARY FIGURE S1 | Isosurface drawing of vertical displacements of the overburden and surface during room and pillar mining.
References
Abed, A. M., Sadaqah, R., and Kuisi, M. A. (2008). Uranium and Potentially Toxic Metals during the Mining, Beneficiation, and Processing of Phosphorite and Their Effects on Ground Water in Jordan. Mine Water Environ. 27, 171. doi:10.1007/s10230-008-0039-3
Abou El-Anwar, E. A., Mekky, H. S., and Abd El Rahim, S. H. (2020). Discovery of Spherulitic Dahllite Associated with Carbonates at Hamadat Phosphorite Mine, Qusseir, Central Eastern Desert, Egypt. Carbonates Evaporites 35, 106. doi:10.1007/s13146-020-00637-x
Chen, S. M., Wu, A. X., Wang, Y. M., and Chen, X. (2018). Analysis of Influencing Factors of Pillar Stability and its Application in Deep Mining. J. Cent. South Univ. (Science Technology) 49, 2050–5057. doi:10.11817/j.issn.1672−7207.2018.08.027
Chi, X. W., Chai, Z. J., He, Z. L., Zhang, C. R., and Ren, G. G. (2020). Research on Stratified Mining and Surrounding Rock Control of Gently Inclined Medium Thick Orebodies. Metal Mine 10, 92–97. doi:10.19614/j.cnki.jsks.202010009
Deng, J., and Bian, L. (2007). Investigation and Characterization of Mining Subsidence in Kaiyang Phosphorus Mine. J. Cent. South. Univ. Technol. 14, 413–417. doi:10.1007/s11771-007-0081-5
Dhahri, F., Benassi, R., Mhamdi, A., Zeyeni, K., and Boukadi, N. (2016). Structural and Geomorphological Controls of the Present-Day Landslide in the Moulares Phosphate Mines (Western-central Tunisia). Bull. Eng. Geol. Environ. 75, 1459–1468. doi:10.1007/s10064-015-0827-5
Galmed, M. A., Nasr, M. M., and Khater, A. E.-S. M. (2020). Petrology of Early Paleogene Phosphorite Deposits in Hazm Al-Jalamid, Northwest Saudi Arabia. Arab J. Geosci. 13, 829. doi:10.1007/s12517-020-05852-3
Gnandi, K., Boroon, M. H. R., and Dimitri, D. D. (2009). Distribution, Speciation, and Extractability of Cadmium in the Sedimentary Phosphorite of Hahotoé-Kpogamé (Southern Togo). Aquat. Geochem. 15, 485–495. doi:10.1007/s10498-009-9062-7
Huang, B., Zhang, M. Q., Chi, E. A., and Deng, G. J. (2017). Stability Analysis and Monitoring of High-Steep Slope Based on Underground Mining Transferred from Open-Pit. Mining Res. Develop. 37, 52–55. doi:10.13827/j.cnki.kyyk.2017.02.013
Jiang, F., Zhou, H., Sheng, J., Li, X., Hu, Y., and Zhou, Y. (2020). Evaluation of Safety and Deformation Characteristics of Cemented Tailings Backfill Mining Disturbed Area Near Shafts: a Case Study in China. Geomech. Geophys. Geo-energ. Geo-resour. 6, 54. doi:10.1007/s40948-020-00176-8
Li, M., Zhang, J., Li, A., and Zhou, N. (2020). Reutilisation of Coal Gangue and Fly Ash as Underground Backfill Materials for Surface Subsidence Control. J. Clean. Prod. 254, 120113. doi:10.1016/j.jclepro.2020.120113
Li, W. X., Zhang, S. T., Liang, X. L., Mei, S. H., and Dai, L. F. (2006). Analysis of Rock Mass Displacements Due to Underground Mining of Phosphorus Ore-deposit in Yichang Mining Areas. Rock Soil Mech. 27, 137–140. doi:10.16285/j.rsm.2006.01.027
Li, X. B., Cao, Z. W., Zhou, J., Huang, L. Q., Wang, S. F., Yao, J. R., et al. (2019). Innovation of Mining Models and Construction of Intelligent green Mine in Hard Rock Mine: In Kaiyang Phosphate Mine as an Example. Chin. J. Nonferrous Met. 29, 2364–2380. doi:10.19476/j.ysxb.1004.0609.2019.10.18
Li, X., Li, Q., Hu, Y., Teng, L., and Yang, S. (2021). Evolution Characteristics of Mining Fissures in Overlying Strata of Stope after Converting from Open-Pit to Underground. Arab J. Geosci. 14, 2795. doi:10.1007/s12517-021-08978-0
Li, Y. J., Li, X. S., and Wang, M. L. (2015). Investigation on the Mining Way of Deep Orebody in Jianshan Phosphate of Yunnan Phosphate Chemical Group. Mining Res. Develop. 35, 9–11. doi:10.13827/j.cnki.kyyk.2015.07.003
Li, Meng, M., Zhang, J., Huang, P., Sun, Q., and Yan, H. (2021). Deformation Behaviour of Crushed Waste Rock under Lateral Cyclic Loading. Rock Mech. Rock Eng. 54, 6665–6672. doi:10.1007/s00603-021-02607-8
Paat, A., Roosalu, T., Karu, V., and Hitch, M. (2021). Important Environmental Social Governance Risks in Potential Phosphorite Mining in Estonia. Extractive Industries Soc. 8, 100911. doi:10.1016/j.exis.2021.100911
Ren, Q., Wang, F., Chen, B., Zhao, M., Peng, Z., and Yang, M. (2020). Study on Stability Prediction of Pillars Based on Bieniawski Pillar Strength Formula: a Case of a Phosphate Mine. Geotech Geol. Eng. 38, 4033–4044. doi:10.1007/s10706-020-01275-9
Steiner, G., Geissler, B., Watson, I., and Mew, M. C. (2015). Efficiency Developments in Phosphate Rock Mining over the Last Three Decades. Resour. Conservation Recycling 105, 235–245. doi:10.1016/j.resconrec.2015.10.004
Xu, S., Liang, R., Suorineni, F. T., and Li, Y. (2021). Evaluation of the Use of Sublevel Open Stoping in the Mining of Moderately Dipping Medium-Thick Orebodies. Int. J. Mining Sci. Technol. 31, 333–346. doi:10.1016/j.ijmst.2020.12.002
Yao, N., Li, P. C., Wang, Q. H., Ye, Y. C., Sun, L. J., Deng, X. M., et al. (2020). Synergetic Mining Technology for Strip-Filling Zone of Gently Inclined Phosphate Deposits under Complex Terrain. Metal Mine 5, 109–116. doi:10.19614/j.cnki.jsks.202005016
Yu, S.-f., Wu, A.-x., Wang, Y.-m., and Li, T. (2017). Pre-reinforcement Grout in Fractured Rock Masses and Numerical Simulation for Optimizing Shrinkage Stoping Configuration. J. Cent. South. Univ. 24, 2924–2931. doi:10.1007/s11771-017-3706-3
Zhang, Y. M., Li, W. C., and Wang, H. J. (2020). Status Quo of Development and Utilization of Phosphate Resources in China. Ind. Minerals Process. 6, 43–46. doi:10.16283/j.cnki.hgkwyjg.2020.06.011
Zheng, D., Frost, J. D., Huang, R. Q., and Liu, F. Z. (2015). Failure Process and Modes of rockfall Induced by Underground Mining: A Case Study of Kaiyang Phosphorite Mine Rockfalls. Eng. Geology. 197, 145–157. doi:10.1016/j.enggeo.2015.08.011
Zheng, D., Huang, R. Q., and Huang, G. (2014). Mechanism of rockfall with Anti-dip and Top Hard-Bottom Soft Rock by Underground Mining-A Case Study of rockfall in Kaiyang Phosphorite, Guizhou. J. Eng. Geology. 22, 464–473. doi:10.13544/j.cnki.jeg.2014.03.016
Keywords: phosphorite underground mining, roof deformation, surface subsidence, backfill mining, slope stability
Citation: Li X, Wang Y, Hu Y, Zhou C and Zhang H (2022) Numerical Investigation on Stratum and Surface Deformation in Underground Phosphorite Mining Under Different Mining Methods. Front. Earth Sci. 10:831856. doi: 10.3389/feart.2022.831856
Received: 09 December 2021; Accepted: 31 January 2022;
Published: 04 March 2022.
Edited by:
Thomas Oommen, Michigan Technological University, United StatesReviewed by:
Nan Zhou, China University of Mining and Technology, ChinaMohammadhossein Sadeghiamirshahidi, Montana Technological University, United States
Copyright © 2022 Li, Wang, Hu, Zhou and Zhang. This is an open-access article distributed under the terms of the Creative Commons Attribution License (CC BY). The use, distribution or reproduction in other forums is permitted, provided the original author(s) and the copyright owner(s) are credited and that the original publication in this journal is cited, in accordance with accepted academic practice. No use, distribution or reproduction is permitted which does not comply with these terms.
*Correspondence: Yunjin Hu, eXVuamluaHVAMTI2LmNvbQ==; Changbing Zhouyunjin, emhvdWNoYW5nYmluZ0B1c3guZWR1LmNu
 Xiaoshuang Li
 Yunmin Wang
 Yunjin Hu
 Changbing Zhou
 He Zhang