 Zhikuo Sun
 Xin Gao2
 Jiangbo Jin
 Xiao Dong
- 1Southern Marine Science and Engineering Guangdong Laboratory (Zhuhai), Zhuhai, China
- 2ICCES, Institute of Atmospheric Physics, Chinese Academy of Sciences, Beijing, China
- 3State Key Laboratory of Satellite Ocean Environment Dynamics, Second Institute of Oceanography, Ministry of Natural Resources, Hangzhou, China
The upper zonal oceanic circulations in the tropical Pacific play a crucial role in modulating weather and climate in the tropical Pacific Ocean. However, they are poorly simulated in state-of-the-art climate models. We apply a simple bias correction scheme by only assimilating observed sea surface temperature (SST) data into a coupled earth system model, named the Chinese Academy of Sciences Earth System Model version 2 (CAS-ESM 2.0), to better reproduce the upper zonal currents in tropical oceans. There are mainly two reasons for this usage of SST assimilating method: 1) SST has dominant effects on the air–sea interactions over the tropical region; 2) The lack of effective and long-term ocean-current observation data currently. Our results show that the SST assimilation can significantly improve the strength of the Pacific Equatorial Undercurrent (EUC), the North Equatorial Countercurrent (NECC) and the South Equatorial Current (SEC) through reducing biases in the air–sea turbulence flux. Nevertheless, the SST assimilation has limited effects on improving the simulation of the spatial structure of these zonal currents in the tropical Pacific. The improvement of the wind stress curl over the tropical Pacific region mainly contributes to the improved simulated strength of the Pacific EUC, the NECC and the SEC. It also connects to the reduced biases in atmospheric convective precipitation and sea-level pressure induced by the reduction of the SST bias.
Highlights
1. We mainly show the effects of the sea surface temperature assimilation on the upper zonal currents over the tropical Pacific in a coupled model.
2. The strength of the Pacific Equatorial Undercurrent, the North Equatorial Countercurrent and the South Equatorial Current significantly increases through the reduction of the SST bias.
3. The improvements in the simulated wind stress curl over the tropical Pacific are mainly due to the improved air–sea interaction simulation with the SST assimilation.
Introduction
The upper zonal oceanic circulations in the tropical Pacific (10°S−10°N) are mainly characterized by three zonal ocean currents: the eastward Equatorial Under Current (EUC) and North Equatorial Countercurrent (NECC) and the westward South Equatorial Current (SEC). The Pacific EUC is an intense subsurface eastward jet located at the Pacific equator with a maximum velocity of greater than 1.0 m/s (Philander, 1973). The Pacific NECC is an eastward upper-ocean zonal flow between 2 and 10°N, with a maximum value of approximately 0.4 m/s near 140°W (Johnson et al., 2002). The Pacific SEC controls a wide range of ocean between 15°S and 4°N and splits into a northern and a southern branch (Wyrtki, 1974), herein referred to as SEC(N) and SEC(S), due to a near-equatorial minimum in the westward surface flow or sometimes the eastward surface flow (McPhaden and Taft, 1988; Johnson et al., 2002). These Pacific upper zonal currents play crucial roles in transporting heat, salt, carbon and oxygen nutrients and modulate atmospheric precipitation, winds and tropical cyclone intensities in the tropical Pacific Ocean (Picaut et al., 1996; Delcroix and Picaut 1998; Bonjean 2001; Kim and Jin, 2011; Bellenger et al., 2014; Hu et al., 2015; Hu et al., 2021). The above currents are also thought to be important factors in the representation of ENSO in coupled models (Jin et al., 2006).
The upper zonal oceanic circulations in the tropical Pacific are poorly simulated in state-of-the-art climate models currently. Zhu et al. (2020) evaluate 50 models from the Coupled Model Inter-Comparison Project phase 6 (CMIP6) and find that simulations of the Pacific EUC and the NECC tend to be weak. Compared to the observed value of ∼0.3 m/s, the annual mean zonal speed of the NECC given by the model is only approximately 0.1 m/s, while the EUC is also underestimated by approximately 3.7 Sv in the CMIP6 multi-model ensemble. The weak upper zonal oceanic currents are mainly caused by the model’s deficiency in simulating the surface wind stress curl (WSC) (Sun et al., 2019; Zhu et al., 2020), which is attributed to the significant double intertropical convergence zone (ITCZ) bias in the tropical North Pacific and the coarse resolution of ocean models. Currently, few studies have focused on evaluating the Pacific SEC simulation in CMIP6 and we take the Pacific SEC into consideration in this study. As there are no effective and long-term ocean-current observation datasets, it’s difficult to directly assimilate ocean currents. Therefore, one motivation of the present study is to provide some additional and possibly useful information that could help us to improve the simulation of upper zonal oceanic circulations in the tropical Pacific region.
Here, we aim to reproduce the Pacific upper zonal currents through assimilating the tropical Pacific sea surface temperature (SST) to reduce the common tropical SST biases—for instance, the cold SST biases in the western tropical Pacific and the excessive westward extension of the cold-tongue bias in the eastern equatorial Pacific (Zhou et al., 2020). We also aim to investigate the impacts of SST on the upper zonal currents in the tropical Pacific Ocean. One reason is that the effective and long-term SST observation data are easier to obtain. Another is that the SST plays an important role in air–sea interactions (Richter and Tokinaga, 2020), including the atmospheric 10 m wind and the corresponding surface wind stress (Wallace et al., 1989; Chelton et al., 2001). Compared with mid-to-high latitudes, the Coriolis force in the tropical region is small and the wind field has a strong influence on the upper ocean currents. The air–sea momentum flux, also known as surface wind stress, is crucial for the proper simulation of the upper zonal oceanic circulations in the tropical Pacific (Sverdrup 1947; Kessler et al., 2003; Zheng and Zhu, 2010; Thomas et al., 2014; Sun et al., 2019). The reduction of SST bias can effectively improve the 10 m wind and surface wind stress through air-sea interaction, including the large-scale, non-adiabatic heating and changes in atmospheric circulation. Our research provides the possibility to further improve the simulation of upper ocean currents in ocean models.
This paper proceeds as follows. The model, data and simulation scheme are described in Introduction. The results of numerical experiments are introduced in Model, Numerical Experimental Design, Methodology and Data, which is followed by a discussion and summary in Improvements of the Upper Zonal Currents With SST Simulation.
Model, Numerical Experimental Design, Methodology and Data
Model
The coupled model used in the present study is the second version of the Chinese Academy of Sciences Earth System Model (CAS-ESM2.0)—which consists of IAP-AGCM5.0 (Zhang et al., 2020) for atmosphere, revised LICOM2.0 for ocean (Liu et al., 2012; Dong et al., 2021), CoLM (Dai et al., 2004; Ji et al., 2014) for land surface, CICE4.0 (Hunke and Lipscomb, 2008) for sea ice and the Weather Research and Forecasting (WRF) model. The horizontal resolution of IAP AGCM5.0 is approximately 1.4° latitude × 1.4° longitude and has 35 vertical levels with a model top at 2.2 hPa. The domain of revised LICOM2.0 is located between 78.5°S and 87.5°N with a 1° zonal resolution. The meridional resolution is refined to 0.5° between 10°S and 10°N and increases gradually from 0.5 to 1° between 10 and 20°. There are 30 levels in the vertical direction with 10 m per layer in the upper 150 m. The horizontal resolution of CoLM and CICE 4.0 is the same with the atmosphere model and ocean model, respectively. The infrastructure of the Community Earth System Model (CESM) Coupler seven is adopted to ensure these components coupled together. Additional components in CAS-ESM2.0 include the IAP Vegetation Dynamics Model, the IAP fire model, the IAP ocean biogeochemistry model, the atmospheric aerosol, the chemistry model and various emission models. The details of CAS-ESM2.0 can be found in Zhang et al. (2020). Here, four climate components are the focus in this study, including atmosphere, ocean, land and sea ice.
Numerical Experimental Design
CAS-ESM2.0 is a newcomer in the community and it is the first time to participate in the historical CMIP6 experiment. Corresponding datasets have been uploaded onto the Earth System Grid Federation (ESGF) data server for CMIP6 users to download. Here, we estimate the impact of realistic SST on the simulation of upper zonal currents in the tropical Pacific Ocean by running two historical experiments: one without applying the assimilated method is denoted as “SST-noAssim” and the other with applying the assimilated method is denoted as “SST-Assim”. The SST assimilated scheme applied in this study is the SST nudging method proposed by Keenlyside et al. (2005) and this method is widely used for generating the initial conditions and correcting the subsurface temperature field in climate model (Chen et al., 2020). The SST nudging method is that the simulated SSTs are nudged towards the observed SST through damping constant with latitude. The damping constant equals to 0.25 days [about 3.8 × 10³ W/(m K)] between 30°S and 30°N in the global area, which means that the simulated SSTs are nudged towards the daily observed SST four times 1 days. Poleward of 30°S and 30°N, the damping constant linearly decreases to zero at 60°S and 60°N. The observed daily mean SSTs used in our research are from the NOAA High-Resolution Blended Analysis of Sea Surface Temperature dataset (Reynolds et al., 2007). These two experiments are all integrated for 33 years from 1982 to 2014 and the SST-Assim experiment starts from the 1982 state of SST-noAssim experiment. Through comparing the results between SST-noAssim and SST-Assim experiments, we can further estimate the effects of SST bias reduction on zonal currents in the tropical Pacific. In this study, we mainly focus on the EUC, the NECC and the SEC.
Methodology and Data
To better understand the dynamic of the EUC, NECC and SEC in these two experiments, the zonal volume transport in the tropical Pacific is diagnosed following Sverdrup (1947) and Kessler et al. (2003). The equation for the zonal transport is derived from momentum equations as follows:
Here,
The following observational datasets are used in this study:
1) Daily mean SSTs from NOAA’s High-Resolution Blended Analysis of Sea Surface Temperature dataset from 1982 to 2014, version 2.1, with a horizontal resolution of 0.25° * 0.25° (Reynolds et al., 2007).
2) Wind stress from the Scatterometer Climatology of Ocean Winds (SCOW) dataset, with a horizontal resolution of 0.25° *0.25°, based on 8 years (September 1999-August 2007) of QuikSCAT scatterometer data (Risien and Chelton, 2008).
3) In situ observation of ocean currents, also known as Johnson climatology, which is primarily constructed during the 1990s and contains ten meridional sections: 143
4) NCAR’s monthly ocean temperature dataset from the Simple Ocean Data Assimilation version (SODAsi.3) from 1982 to 2013, with a horizontal resolution of 0.5° *0.5° (Giese et al., 2016).
Improvements of the Upper Zonal Currents With SST Simulation
Assimilation of the Tropical Pacific SST
Figure 1 shows the spatial distribution of climatological SST in the tropical Pacific (25°S−25°N, 120°E−90°W). Observationally, an SST maximum above 28°C locates in the tropical western Pacific (20°S−20°N, 120°E−160°W), hereafter referred to as the ‘‘warm pool’’ (Wyrtki, 1989). The spatial pattern of the whole warm pool is distributed from northwest to southeast. Two zonal high-SST strips do not follow a north–south symmetrical structure between the two hemispheres: One locates in the north Pacific and spans the entire Pacific, the formation of which is related to the Pacific ITCZ. The other locates in the south Pacific and the boundary only extends eastward to approximately 140°W, which also has a larger east-west temperature gradient compared to the north zonal high-SST strip.
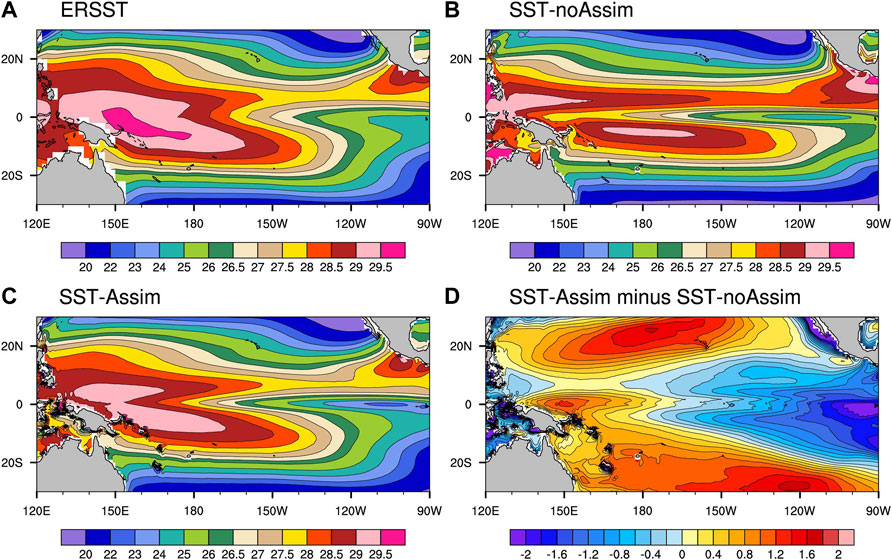
FIGURE 1. Annual mean SST from (A) ERSST, (B) SST-noAssim experiment and (C) SST-Assim experiment; (D) The difference between SST-Assim experiment and SST-noAssim experiment (SST-Assim minus SST-noAssim). The average period of observations and model results is from 1982 to 2014, the unit is °C.
The SST simulated in the SST-noAssim experiment exhibits significant biases compared with the observations (Figure 1B). Especially in the western tropical Pacific region, the warm pool is separated into north and south parts by a low-temperature strip, which extends westward from the East Pacific at the equator. This low-temperature strip is related to the persistent cold equatorial SST bias in the tropical Pacific and is a common bias in coupled climate models (Adam et al., 2018; Samanta et al., 2019). The spatial pattern of the warm pool in the SST-noAssim experiment is more biased towards a west-east distribution, instead of a northwest-southeast distribution in the observation. Moreover, the high-SST strip in the south zone extending further eastward attributes to the longstanding double-ITCZ bias in the tropical Pacific (Tian and Dong, 2020).
The simulated tropical Pacific SST in the SST-Assim experiment is largely improved compared to the SST-noAssim experiment (Figure 1C). The cold bias in the subtropical Pacific and western Pacific and the warm bias in the extra-equatorial eastern Pacific improve significantly in the SST-Assim experiment (Figure 1D). The warm pool west of 160°E is still connected in the northern and southern hemispheres and distributes in northwest-southeast direction. The high-SST zonal strip becomes more similar to the observations especially in the southern hemisphere. Need to mention, although the bias in the excessive westward extension of the equatorial Pacific cold tongue is alleviated, the cold bias in the eastern equatorial Pacific increases in the SST-Assim experiment (Figure 1D). It indicates that the SST-Assim experiment exhibits a larger east-west temperature gradient in the equatorial tropical Pacific compared with the SST-noAssim experiment. The possible reason is that although the intensity of SST nudging is the strongest in the tropics, the evolution of the coupled model is also important and needs to be fully considered here. Therefore, the assimilated SST still deviates to some extent from the observation.
Reduced Biases of Tropical Pacific Upper Zonal Ocean Currents
To investigate the impacts of SST bias reduction in the simulation of upper zonal ocean currents in the tropical Pacific, Figure 2 shows the observed and simulated vertical-meridional sections of the mean zonal current at three longitudes, 180°E, 140°W, and 110°W, representing the western, central and eastern equatorial Pacific, respectively. The observation is from the Johnson climatology dataset (Johnson et al., 2002) and allows the direct estimation of the properties of near-equatorial currents, including the measurement of the velocity of the tropical upper Pacific Ocean current. Both experiments capture the eastward NECC, the westward SEC and the eastward EUC well in the tropical Pacific. There were two subsurface eastward jets on two sides of the EUC in the observations (Figures 2A,B), representing the North Subsurface Countercurrent (NSCC) and the South Subsurface Countercurrent (SSCC) (Wyrtki and Kilonsky, 1984), respectively. However, the NSCC and the SSCC cannot be portrayed separately in both simulations probably relating to the coarse resolution of ocean model.
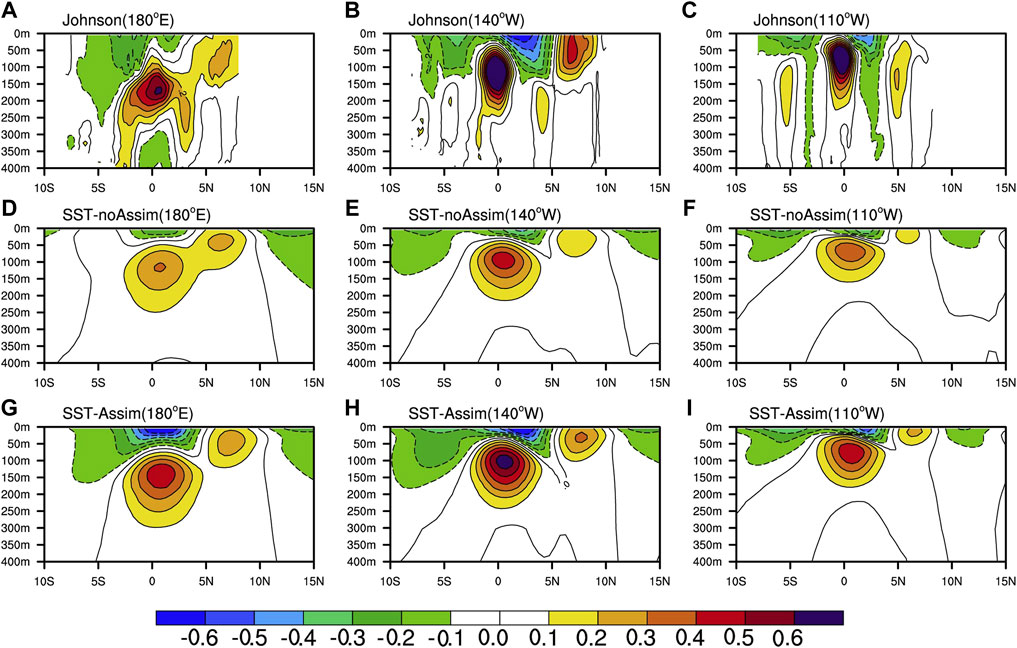
FIGURE 2. Meridional–vertical sections of annual mean zonal currents (m/s) at (A) 180°E, (B) 140°W, and (C) 110°W for Johnson et al. (2002) climatology (D–F) and (G–I) are the same as (A–C) but for the SST-noAssim experiment and the SST-Assim experiment, respectively. The contour interval for all the panels is 0.1 m/s. The eastward (westward) velocities are shown as solid (dashed) lines. The average period of the model data is from 1985 to 2000, and the positive values indicate an eastward direction.
Regarding the simulation of the Pacific EUC, both experiments exhibit very weak current strength at all longitudes relative to the observations (Figure 2). Compared with the SST-noAssim experiment, the Pacific EUC has significant improvements in strength in the SST-Assim experiment. The maximum values of the observed EUC are approximately 0.6, 1.0, 1.0 m/s at 180°E, 140°W and 110°W, respectively. The corresponding values are approximately 0.3 (0.4) m/s, 0.4 (0.6) m/s and 0.3 (0.4) m/s in the SST-noAssim (SST-Assim) experiment, respectively. The weak simulation of the Pacific EUC further shows in the vertical zonal sections of the EUC in the equatorial Pacific shown in Figure 3, in which the eastward subsurface ocean current represents the EUC and accompanies by the westward South Equatorial Current (SEC) above it (Figure 3). The maximum of the equatorial EUC locates at ∼ 135°W, with values of 1.0, 0.4 and 0.6 m/s for the observation, the SST-noAssim experiment and the SST-Assim experiment, respectively. The maximum difference of Pacific EUC between SST-Assim and SST-noAssim experiment can reach 0.2 m/s, clearly shown in Figure 3D.
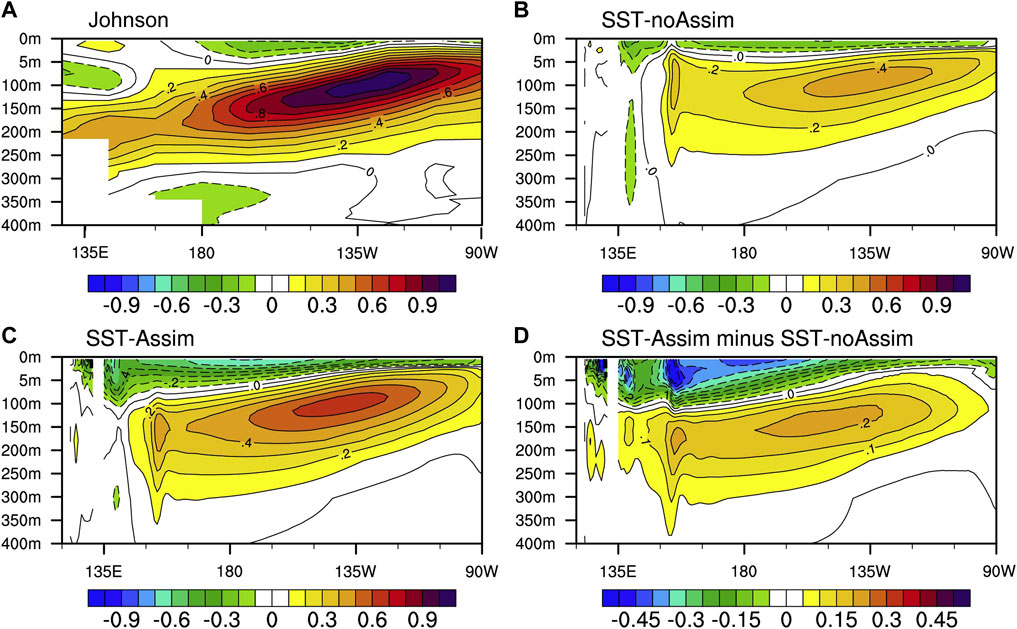
FIGURE 3. Longitude–depth diagram of annual mean zonal current (shaded and contour; in m/s; eastward in solid, and westward in dashed lines) at the equator (0°N) for (A) Johnson data, (B) SST-noAssim experiment and (C) SST-Assim experiment, respectively; (D) The difference between SST-Assim experiment and SST-noAssim experiment (SST-Assim minus SST-noAssim). The average period for the model data is from 1985 to 2000, and the positive values indicate an eastward direction.
As for the center depth of the Pacific EUC, the observed EUC centers locate at approximately 180, 130 and 80 m at 180°E, 140°W and 110°W, respectively (Figure 2), exhibiting a tilting-up structure from west to east. Both experiments can reasonably simulate this tilting-up structure but the simulated center depth is relatively shallow, especially at 180°E and 140°W. The corresponding values are 120 m at 180°E and 100 m at 140°W for both two experiments. Furthermore, we also find that both experiments have deeper bottom boundary depth of the EUC, greater than 400 m in the equatorial western and central Pacific, whereas the corresponding value is only less than 350 m in the observations (Figure 3).
The strength of the Pacific NECC also has significant improvements under more realistic SST, especially in the central and eastern Pacific (Figure 2). The observational maximum speeds of the NECC are approximately 0.2, 0.4 and 0.2 m/s at 180°E, 140°W and 110°W, respectively. The corresponding values are 0.2 (0.2), 0.1 (0.3), and 0.1 (0.2) m/s in the SST-noAssim (SST-Assim) experiment, respectively. As for the center depth of the Pacific NECC, small improvements are found and both experiments have shallower center depth compared with the observation data. The observational center depths of the Pacific NECC are approximately 75, 50 and 150 m at 180°E, 140°W and 110°W, respectively. But the corresponding values are only approximately 40 m (50 m), 30 m (30 m) and 20 m (20 m) for the SST-noAssim (SST-Assim) experiment. Both two experiments have deeper bottom boundary depth, greater than 400 m, which is only ∼200 m in the observations.
As for the SEC, the SST-Assim experiment has more accurate strength compared to the SST-noAssim experiment. The maximum speeds are 0.2 (0.6), 0.4 (0.6), and 0.3 (0.5) m/s for the SST-noAssim (SST-Assim) experiment at 180°E, 140°W and 110°W, respectively. And the corresponding observed values are 0.2, 0.6 and 0.5 m/s, respectively. We find that the SEC strength in the SST-Assim experiment is almost equivalent to the observations in the central and eastern Pacific. But the SST-Assim experiment gets stronger SEC in the western Pacific compared with the observations (Figure 2G). The downward extending depth of the Pacific SEC is shallower for both experiments, which has been slightly alleviated in the SST-Assim experiment.
The SST-nudging also improves the simulation of year-to-year variations of these three zonal ocean currents. Figure 4 shows the interannual variability of the zonal volume transport at 140°W of the Pacific EUC, NECC and SEC, respectively. We choose SODA reanalysis data as the “real” data to evaluate the experiments due to lack of continuously long-time observed equatorial zonal current data. SST-Assim experiment has stronger Pacific EUC, NECC and SEC compared with SST-noAssim experiment, closer to the SODA reanalysis data and consistents with our previous results shown from Figures 2, 3. The correlation coefficients of the interannual variability of these three zonal currents between the SST-Assim experiment and SODA reanalysis are all higher than the SST-noAssim experiment, from 0.25 to 0.63 for EUC, 0.27 to 0.51 for NECC and −0.1 to 0.4 for SEC, respectively. The lower correlation between SST-noAssim and SODA reanalysis relative to SST-Assim experiment may be resulted from the inconsistent the model year and the actual year.
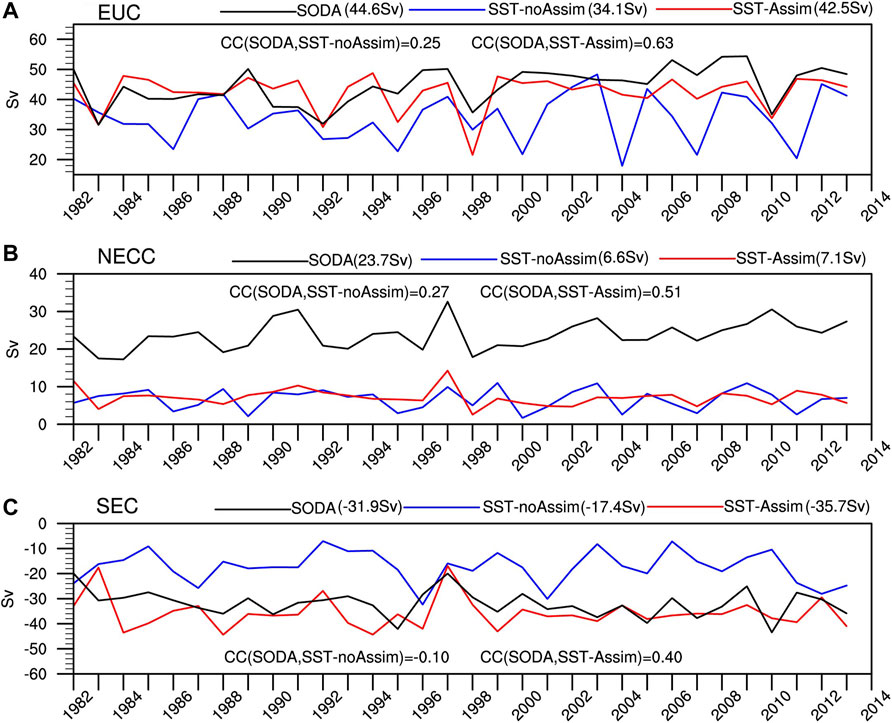
FIGURE 4. The interannual variability of the zonal volume transport at 140°W of the Pacific (A) EUC, (B) NECC and (C) SEC of the SODA (black line), SST-noAssim experiment (blue line) and SST-Assim experiment (red line), respectively (units: Sv; 1Sv = 106 m3/s). Values in the parentheses mean the annual average values from 1982 to 2013 at 140°W. The abbreviation “CC” represents the correlation coefficient value.
Key Processes for Improving the Zonal Currents in the Tropical Pacific
To further investigate the effects of sea-temperature bias reduction on zonal currents in the tropical Pacific, Figure 5 shows the latitude-depth diagram of annual mean oceanic temperature and zonal current, averaged from 160°E to 110°W for the reanalysis data (SODA) and model results. Compared with the SST-noAssim experiment, the averaged Pacific EUC, NECC and SEC are stronger in the SST-Assim experiment. Here, the strength of these zonal currents can be linked to temperature distribution. For instance, the formation of the NECC and the SEC is related to the north-south meridional temperature gradient: the negative meridional temperature gradient between 5 and 10°N and the positive meridional temperature gradient between 0 and 5°N in the northern hemisphere, connected to the strength of the NECC and SEC(N), respectively. Similarly, the formation of the Pacific SEC(S) in the southern hemisphere is related to the negative meridional temperature gradient between 5°S and 0°N. The difference between two experiments is further shown in Figure 5D: the north-south meridional temperature gradient increases due to the warmer subsurface temperatures at 8°S and 6°N in the SST-Assim experiment. The stronger absolute values of these north–south meridional temperature gradients, along with the corresponding stronger zonal ocean current, can partly explain the improved simulation of the Pacific NECC and the SEC in the SST-Assim experiment.
FIGURE 5. Latitude–depth diagram of annual mean oceanic temperature (shaded, in °C) and zonal current (white contours, eastward in solid and westward in dashed lines), averaged over 160°E—110°W for (A) the reanalysis data SODA, (B) SST-noAssim experiment and (C) SST-Assim experiment, respectively; (D) The difference between SST-Assim experiment and SST-noAssim experiment (SST-Assim minus SST-noAssim). The average period of SODA (temp and U) is from 1982 to 2013. The average period of the model data is from 1982 to 2014.
To further investigate the relationship between the change in SST, surface wind stress and zonal ocean currents, the annual mean surface wind stress and WSC of the observations and both experiments are shown in Figure 6. Compared to the SST-noAssim experiment, the improvements in wind stress field in the SST-Assim experiment mainly include the following two points: 1) the easterly wind stress in the equatorial Pacific is strengthened; 2) the subtropical easterly trade wind stress between 5 and 10° in both hemispheres becomes weaker. The strengthening of the easterly wind stress at the equator, combined with the weaker northeasterly trade wind stress between 5 and 10°N in the northern hemisphere, leads to a weaker positive WSC in the ITCZ region in the SST-Assim experiment and becomes more consistent with the observations (Figures 6A–C). Similarly, the strengthening of the easterly wind at the equator, accompanied by the weaker southeasterly wind stress between 5 and 10°S in the southern hemisphere in the SST-Assim experiment, leads to a positive center in the WSC difference in the south of 5°S between two experiments (SST-Assim minus SST-noAssim, Figure 6D). This positive center in the WSC difference corresponds to the more realistic simulation of the “sandwich-like” WSC structure (negative–positive–negative) between 0°N and 20°S in the northeast–southwest direction in the SST-Assim experiment, which is consistent with the observations and cannot be seen in the SST-noAssim experiment (Figure 6).
FIGURE 6. Annual mean wind stress curl (WSC, shaded, in *10–7 N/m3) and wind stress vector (arrows, in N/m2) from (A) SCOW, (B) SST-noAssim experiment, (C) SST-Assim experiment and (D) the difference between SST-Assim experiment and SST-noAssim experiment (SST-Assim minus SST-noAssim). The average period of the model data is from 1982 to 2014.
The zonal Sverdrup transport contributed by the linear wind term is shown in Figure 7B to illustrate the relationship between the surface wind stress and the zonal Sverdrup transport in more detail. According to the wind-driven zonal transport formula (Eq. 1), the wind-driven zonal transport (U) is mainly determined by the zonal integration of the meridional gradient of the WSC (
FIGURE 7. (A) The difference in annual mean WSC (shaded, in *10–7 N/m3) and wind stress vector (arrows, in N/m2) between SST-Assim experiment and SST-noAssim experiment (SST-Assim minus SST-noAssim); (B) the difference in annual mean zonal Sverdrup transport (shaded, in m2/s) between SST-Assim experiment and SST-noAssim experiment (SST-Assim minus SST-noAssim) and the positive values indicate an eastward direction. The average period of the model data is from 1982 to 2014.
Summary and Discussion
In our present study, we apply a simple assimilated scheme using only SST data to a coupled earth system model named CAS-ESM2.0 and try to better reproduce the upper zonal currents in the tropical Pacific Ocean. It is achieved by reducing air-sea turbulence flux (especially for wind stress flux) biases and providing useful guides for model improvement and development. Through comparing the results of the SST-noAssim experiment with no-assimilated scheme and the SST-Assim experiment with SST-assimilation, we find that the simulated SST in the SST-Assim experiment becomes more reasonable in the tropical Pacific. In the SST-Assim experiment, the equatorial low-SST strip, which extends excessively westward from the East Pacific and relates to the persistent cold equatorial SST bias in the tropical Pacific in many coupled climate models, is improved to the west of 170°W. Moreover, the spatial pattern of the warm pool (which was above 28°C) becomes closer to the observations and distributes from the biased west-east distribution converting to the observational northwest-southeast distribution. Need to mention, although the intensity of SST nudging is the strongest in the tropics, the temperature evolution in coupled models especially for vertical diffusion process is also important. The assimilated SST still deviates to some extent from the observation and the impacts of different SST assimilation methods are relatively small for this problem. Maybe assimilating the sea temperature from sea surface to the depth of 2000 m is a choice and will make the SST simulation better.
The SST has significant effects on the strength of the Pacific EUC, the NECC and the SEC across the tropical Pacific. The maximum of the equatorial Pacific EUC locating at ∼135°W increases from 0.4 m/s in the SST-noAssim experiment to 0.6 m/s in the SST-Assim experiment and the corresponding value in the observations is 1.0 m/s. The maximum speed of the Pacific NECC at 140°W rises from approximately 0.1 m/s in the SST-noAssim experiment to 0.3 m/s in the SST-Assim experiment and the corresponding value in the observations is 0.4 m/s. The speed of the Pacific SEC increases to almost the same as the observations in the Central and Eastern Pacific, but becomes too strong in the western Pacific in the SST-Assim experiment.
The improvements in the strength of the Pacific EUC, the NECC and the SEC in the SST-Assim experiment are mainly related to the improvements in the surface wind stress and its curl. As shown in Figure 7A, there are five centers of WSC difference between the SST-Assim and the SST-noAssim experiment locating between 10°S and 10°N to the east of 150°W. As for the biased spatial structure of the upper Pacific equatorial zonal currents, including the shallower center depth and deeper bottom boundary of the Pacific EUC and the NECC, limited improvements are found. Here, we only pay attention to the downward extending depth of Pacific SEC, which is still shallower and slightly alleviated in the SST-Assim experiment.
Zheng et al. (2014) shows that the SST impacts the surface wind stress predominantly through the changes in total diabatic heating and sea-level pressure (SLP). Diabatic heating is often represented by only the latent heating related to precipitation (convective precipitation), due to the lack of cloud data and the small contribution from the cloud radiative heating (Lin, 2007). Therefore, we show the differences in annual mean SST, atmospheric convective precipitation, surface wind stress and SLP between two experiments (SST-Assim minus SST-noAssim) in Figure 8 to further illustrate the influence of SST assimilation on the simulation of tropical equatorial zonal ocean currents. The SST difference distributes in the west-warm-east-cold pattern, accompanied by the zonal precipitation difference in west-strong-east-weak pattern and the SLP difference in west-low-east-high distribution between two experiment. Therefore, a stronger easterly wind forms in the tropical Pacific in the SST-Assim experiment compared to the SST-noAssim experiment (Figure 8). Similarly, the meridional difference in SST between two experiments contributes to the differences of southwestly wind stress locating between 0 and 20°N and northwestly wind stress locating between 0°N and 20°S, with the warmer SST and the lower SLP center being in the subtropical Pacific in the SST-Assim experiment (Figure 8). Further analyses of the specific relationship between the SST, surface wind and the surface wind stress will be performed in our future work. The present study highlights the importance of improved tropical SST in reproducing tropical upper zonal ocean currents in coupled models. The reduction in SST bias can be achieved to some extent by increasing the spatial resolution (Balaguru et al., 2021) and oceanic parameterization scheme (Noh et al., 2016).
FIGURE 8. (A) The difference in annual mean SST (°C) between SST-Assim experiment and SST-noAssim experiment (SST-Assim minus SST-noAssim); (B) the difference in annual mean convective precipitation (mm/d) between SST-Assim experiment and SST-noAssim experiment (SST-Assim minus SST-noAssim); (C) the difference in annual mean sea surface pressure (shaded, in hPa) and wind stress vector (arrows, in N/m2) between SST-Assim experiment and SST-noAssim experiment (SST-Assim minus SST-noAssim); the average period of the model data is from 1982 to 2014.
Data Availability Statement
The original contributions presented in the study are included in the article/Supplementary Material, further inquiries can be directed to the corresponding authors.
Author Contributions
JJ and FZ designed experiments and provided research guidance for this article; ZS, JJ, and FZ analyzed experimental results and write the manuscript; XG, JH, HZ, XD, and QZ further give the suggestions and corrections for this manuscript.
Funding
This work is jointly supported by the Key Research Program of Frontier Sciences, the Chinese Academy of Sciences (Grant No. ZDBS-LY-DQC010), the National Natural Science Foundation of China (Grant No’s 42005123, 41991282; 41876012, and 42175045), the Strategic Priority Research Program of the Chinese Academy of Sciences (Grant No. XDB42000000), and the open fund of State Key Laboratory of Satellite Ocean Environment Dynamics, Second Institute of Oceanography (Grant No. QNHX 2017). The simulations were performed on supercomputers provided by the Earth System Science Numerical Simulator Facility (EarthLab).
Conflict of Interest
The authors declare that the research was conducted in the absence of any commercial or financial relationships that could be construed as a potential conflict of interest.
Publisher’s Note
All claims expressed in this article are solely those of the authors and do not necessarily represent those of their affiliated organizations, or those of the publisher, the editors and the reviewers. Any product that may be evaluated in this article, or claim that may be made by its manufacturer, is not guaranteed or endorsed by the publisher.
References
Adam, O., Schneider, T., and Brient, F. (2018). Regional and Seasonal Variations of the Double-ITCZ Bias in CMIP5 Models. Clim. Dyn. 51 (1), 101–117. doi:10.1007/s00382-017-3909-1
Balaguru, K., Van Roekel, L. P., Leung, L. R., and Veneziani, M. (2021). Subtropical Eastern North Pacific SST bias in earth system models. J. Geophys. Res. Oceans 126 (8), e2021JC017359.
Bellenger, H., Guilyardi, É., Leloup, J., Lengaigne, M., and Vialard, J. (2014). ENSO Representation in Climate Models: From CMIP3 to CMIP5. Clim. Dyn. 42 (7), 1999–2018. doi:10.1007/s00382-013-1783-z
Bonjean, F. (2001). Influence of Surface Currents on the Sea Surface Temperature in the Tropical Pacific Ocean. J. Phys. Oceanogr. 31 (4), 943–961. doi:10.1175/1520-0485(2001)031<0943:ioscot>2.0.co;2
Chelton, D. B., Esbensen, S. K., Schlax, M. G., Thum, N., Freilich, M. H., Wentz, F. J., et al. (2001). Observations of Coupling between Surface Wind Stress and Sea Surface Temperature in the Eastern Tropical Pacific. J. Clim. 14 (7), 1479–1498. doi:10.1175/1520-0442(2001)014<1479:oocbsw>2.0.co;2
Chen, X., Wang, H., Zheng, F., and Cai, Q. (2020). An Ensemble-Based SST Nudging Method Proposed for Correcting the Subsurface Temperature Field in Climate Model. Acta Oceanol. Sin. 39 (3), 73–80. doi:10.1007/s13131-020-1568-2
Dai, Y., Dickinson, R. E., and Wang, Y.-P. (2004). A Two-Big-Leaf Model for Canopy Temperature, Photosynthesis, and Stomatal Conductance. J. Clim. 17, 2281–2299. doi:10.1175/1520-0442(2004)017<2281:atmfct>2.0.co;2
Delcroix, T., and Picaut, J. (1998). Zonal Displacement of the Western Equatorial Pacific “Fresh Pool”. J. Geophys. Res. 103 (C1), 1087–1098. doi:10.1029/97jc01912
Dong, X., Jin, J., Liu, H., Zhang, H., Zhang, M., Lin, P., et al. (2021). CAS-ESM2.0 Model Datasets for the CMIP6 Ocean Model Intercomparison Project Phase 1 (OMIP1). Adv. Atmos. Sci. 38 (2), 307–316. doi:10.1007/s00376-020-0150-3
Giese, B. S., Seidel, H. F., Compo, G. P., and Sardeshmukh, P. D. (2016). An Ensemble of Ocean Reanalyses for 1815-2013 with Sparse Observational Input. J. Geophys. Res. Oceans 121 (9), 6891–6910. doi:10.1002/2016jc012079
Hu, D., Wu, L., Cai, W., Gupta, A. S., Ganachaud, A., Qiu, B., et al. (2015). Pacific Western Boundary Currents and Their Roles in Climate. Nature 522 (7556), 299–308. doi:10.1038/nature14504
Hu, S., Lu, X., Li, S., Wang, F., Guan, C., Hu, D., et al. (2021). Multi-decadal Trends in the Tropical Pacific Western Boundary Currents Retrieved from Historical Hydrological Observations. Sci. China Earth Sci. 64 (4), 600–610. doi:10.1007/s11430-020-9703-4
Hunke, E. C., and Lipscomb, W. H. (2008). CICE: The Los Alamos Sea Ice Model User’s Manual, Version 4. Los Alamos: Los Alamos National Laboratory Tech. Rep. LA-CC-06-012, 76.
Ji, D., Wang, L., Feng, J., Wu, Q., Cheng, H., Zhang, Q., et al. (2014). Description and Basic Evaluation of Beijing Normal University Earth System Model (BNU-ESM) Version 1. Geosci. Model. Dev. 7, 2039–2064. doi:10.5194/gmd-7-2039-2014
Jin, F. F., Kim, S. T., and Bejarano, L. (2006). A Coupled‐stability index for ENSO. Geophys. Res. Lett. 33 (23), 1. doi:10.1029/2006gl027221
Johnson, G. C., Sloyan, B. M., Kessler, W. S., and McTaggart, K. E. (2002). Direct Measurements of Upper Ocean Currents and Water Properties across the Tropical Pacific during the 1990s. Prog. Oceanography 52 (1), 31–61. doi:10.1016/s0079-6611(02)00021-6
Keenlyside, N., Latif, M., Botzet, M., Jungclaus, J., and Schulzweida, U. (2005). A Coupled Method for Initializing El Niño Southern Oscillation Forecasts Using Sea Surface Temperature. Tellus A: Dynamic meteorology and oceanography 57 (3), 340–356. doi:10.3402/tellusa.v57i3.14661
Kessler, W. S., Johnson, G. C., and Moore, D. W. (2003). Sverdrup and Nonlinear Dynamics of the Pacific Equatorial Currents*. J. Phys. Oceanogr. 33 (5), 994–1008. doi:10.1175/1520-0485(2003)033<0994:sandot>2.0.co;2
Kim, S. T., and Jin, F. F. (2011). An ENSO Stability Analysis. Part I: Results from a Hybrid Coupled Model. Clim. Dyn. 36 (7-8), 1593–1607. doi:10.1007/s00382-010-0796-0
Lin, J.-L. (2007). The Double-ITCZ Problem in IPCC AR4 Coupled GCMs: Ocean-Atmosphere Feedback Analysis. J. Clim. 20, 4497–4525. doi:10.1175/jcli4272.1
Liu, H., Lin, P., Yu, Y., and Zhang, X. (2012). The Baseline Evaluation of LASG/IAP Climate System Ocean Model (LICOM) Version 2. Acta Meteorol. Sin 26 (3), 318–329. doi:10.1007/s13351-012-0305-y
McPhaden, M. J., and Taft, B. A. (1988). Dynamics of Seasonal and Intraseasonal Variability in the Eastern Equatorial Pacific. J. Phys. Oceanography 18 (1713), 1520–0485. doi:10.1175/1520-0485(1988)018<1713:dosaiv>2.0.co;2
Noh, Y., Ok, H., Lee, E., Toyoda, T., and Hirose, N. (2016). Parameterization of Langmuir Circulation in the Ocean Mixed Layer Model Using LES and its Application to the OGCM. J. Phys. Oceanography 46 (1), 57–78. doi:10.1175/jpo-d-14-0137.1
Philander, S. G. H. (1973). Equatorial Undercurrent: Measurements and Theories. Rev. Geophys. 11 (3), 513–570. doi:10.1029/rg011i003p00513
Picaut, J., Ioualalen, M., Menkes, C., Delcroix, T., and Mcphaden, M. J. (1996). Mechanism of the Zonal Displacements of the Pacific Warm Pool: Implications for ENSO. Science 274 (5292), 1486–1489. doi:10.1126/science.274.5292.1486
Reynolds, R. W., Smith, T. M., Liu, C., Chelton, D. B., Casey, K. S., and Schlax, M. G. (2007). Daily High-Resolution-Blended Analyses for Sea Surface Temperature. J. Clim. 20 (22), 5473–5496. doi:10.1175/2007jcli1824.1
Richter, I., and Tokinaga, H. (2020). An Overview of the Performance of CMIP6 Models in the Tropical Atlantic: Mean State, Variability, and Remote Impacts. Clim. Dyn. 55, 2579–2601. doi:10.1007/s00382-020-05409-w
Risien, C. M., and Chelton, D. B. (2008). A Global Climatology of Surface Wind and Wind Stress fields from Eight Years of QuikSCAT Scatterometer Data. J. Phys. Oceanography 38 (11), 2379–2413. doi:10.1175/2008jpo3881.1
Samanta, D., Karnauskas, K. B., and Goodkin, N. F. (2019). Tropical Pacific SST and ITCZ Biases in Climate Models: Double Trouble for Future Rainfall Projections? Geophys. Res. Lett. 46 (4), 2242–2252. doi:10.1029/2018gl081363
Sun, Z., Liu, H., Lin, P., Tseng, Y. H., Small, J., and Bryan, F. (2019). The Modeling of the North Equatorial Countercurrent in the Community Earth System Model and its Oceanic Component. J. Adv. Model. Earth Syst. 11 (2), 531–544. doi:10.1029/2018ms001521
Sverdrup, H. U. (1947). Wind-driven Currents in a Baroclinic Ocean; with Application to the Equatorial Currents of the Eastern Pacific. Proc. Natl. Acad. Sci. 33 (11), 318–326. doi:10.1073/pnas.33.11.318
Thomas, M. D., De Boer, A. M., Johnson, H. L., and Stevens, D. P. (2014). Spatial and Temporal Scales of Sverdrup Balance*. J. Phys. Oceanography 44 (10), 2644–2660. doi:10.1175/jpo-d-13-0192.1
Tian, B., and Dong, X. (2020). The Double‐ITCZ Bias in CMIP3, CMIP5, and CMIP6 Models Based on Annual Mean Precipitation. Geophys. Res. Lett. 47, 8. doi:10.1029/2020gl087232
Wallace, J. M., Mitchell, T. P., and Deser, C. (1989). The Influence of Sea-Surface Temperature on Surface Wind in the Eastern Equatorial Pacific: Seasonal and Interannual Variability. J. Clim. 2 (12), 1492–1499. doi:10.1175/1520-0442(1989)002<1492:tiosst>2.0.co;2
Wyrtki, K. (1974). Equatorial Currents in the Pacific 1950 to 1970 and Their Relations to the Trade Winds. J. Phys. Oceanogr. 4 (3), 372–380. doi:10.1175/1520-0485(1974)004<0372:ecitpt>2.0.co;2
Wyrtki, K., and Kilonsky, B. (1984). Mean Water and Current Structure during the Hawaii-to-Tahiti Shuttle experiment. J. Phys. Oceanogr. 14 (2), 242–254. doi:10.1175/1520-0485(1984)014<0242:mwacsd>2.0.co;2
Wyrtki, K. (1989). “Some Thoughts about the West Pacific Warm Pool,” in Proceedings of the Western pacific International Meeting and Workshop on TOGA COARE (New Caledonia: ORSTOM/Nouméa), 99–109.
Zhang, H., Zhang, M., Jin, J., Fei, K., Ji, D., Wu, C., et al. (2020). Description and Climate Simulation Performance of CAS‐ESM Version 2. J. Adv. Model. Earth Syst. 12 (12), e2020MS002210. doi:10.1029/2020ms002210
Zheng, F., Fang, X.-H., Yu, J.-Y., and Zhu, J. (2014). Asymmetry of the Bjerknes Positive Feedback between the Two Types of El Niño. Geophys. Res. Lett. 41, 7651–7657. doi:10.1002/2014GL062125
Zheng, F., and Zhu, J. (2010). Coupled Assimilation for an Intermediated Coupled ENSO Prediction Model. Ocean Dyn. 60 (5), 1061–1073. doi:10.1007/s10236-010-0307-1
Zhou, S., Huang, G., and Huang, P. (2020). Excessive ITCZ but Negative SST Biases in the Tropical Pacific Simulated by CMIP5/6 Models: The Role of the Meridional Pattern of SST Bias. J. Clim. 33 (12), 5305–5316. doi:10.1175/jcli-d-19-0922.1
Keywords: SST bias correction, air-sea interaction, the upper zonal currents, CAS-ESM, tropical pacific
Citation: Sun Z, Gao X, Jin J, He J, Zheng F, Zhang H, Dong X and Zeng Q (2022) The Improvements of the Upper Zonal Currents by SST Assimilation Over the Tropical Pacific in a Coupled Climate Model. Front. Earth Sci. 10:828253. doi: 10.3389/feart.2022.828253
Received: 03 December 2021; Accepted: 21 February 2022;
Published: 18 March 2022.
Edited by:
Guihua Wang, Fudan University, ChinaReviewed by:
Shang-Min Long, Hohai University, ChinaJingzhi Su, Chinese Academy of Meteorological Sciences, China
Shijian Hu, Institute of Oceanology (CAS), China
Copyright © 2022 Sun, Gao, Jin, He, Zheng, Zhang, Dong and Zeng. This is an open-access article distributed under the terms of the Creative Commons Attribution License (CC BY). The use, distribution or reproduction in other forums is permitted, provided the original author(s) and the copyright owner(s) are credited and that the original publication in this journal is cited, in accordance with accepted academic practice. No use, distribution or reproduction is permitted which does not comply with these terms.
*Correspondence: Jiangbo Jin, amluamlhbmdib0BtYWlsLmlhcC5hYy5jbg==; Fei Zheng, emhlbmdmZWlAbWFpbC5pYXAuYWMuY24=