- 1School of Atmospheric Sciences, Sun Yat-sen University, Southern Marine Science and Engineering Guangdong Laboratory (Zhuhai), Zhuhai, China
- 2Guangdong Province Key Laboratory for Climate Change and Natural Disaster Studies, Sun Yat-sen University, Zhuhai, China
- 3Department of Aviation Meteorology, Civil Aviation University of China, Tianjin, China
- 4Key Laboratory of Tropical Atmosphere‐Ocean System, Ministry of Education, Zhuhai, China
- 5Institute of Urban Meteorology, CMA, Beijing, China
The southwest vortex (SWV), a low-pressure system bringing severe rainfall in southwest China, is one of the most important synoptic systems in China. Using both the National Centers for Environmental Prediction Final (NCEP-FNL) operational global analysis dataset and the Weather Research and Forecasting (WRF) model simulation, a sophisticated SWV with dual-core structure (DCSWV) over the Sichuan Basin in 2010 was studied. The DCSWV system consisted of two cores, one near Leshan City (named “C1”) and another near Langzhong City (named “C2”). The high-resolution WRF model reproduced the life cycle of the DCSWV well. The diagnostic analysis of the vorticity budget indicated that the stretching and tilting terms played important roles in the development stage of “C1”, while the stretching and vertical advection of vorticity were the major contributors to the formation and development stage of “C2”, which implied the importance of moisture convergence and ascending motion. Sensitivity experiments showed that the DCSWV was closely associated with the release in latent heat as well as the effect of topography. The great release in latent heat provided significantly positive feedback to the DCSWV system, which was decisive to the formation and development stages of “C2”. The topography of the Tibetan Plateau and the Yun-Gui Plateau affected the location and duration of the DCSWV.
Introduction
Sichuan Basin (SCB), a fertile expanse with low hills and plains almost entirely encircled by mountains, is located in the east of Tibetan Plateau (TP), west of Wu Mountain, north of Yun-Gui Plateau, and south of Daba Mountains, China (Figure 1A). In such complex terrain conditions, a mesoscale southwest vortex (SWV) is often observed over the SCB. Statistically, the severity of heavy precipitation caused by the SWV ranks the second in China, while precipitation from the tropical cyclones ranks the first (Wang et al., 1996). Therefore, the comprehensive understanding on the SWV is necessary, especially in the summer time.
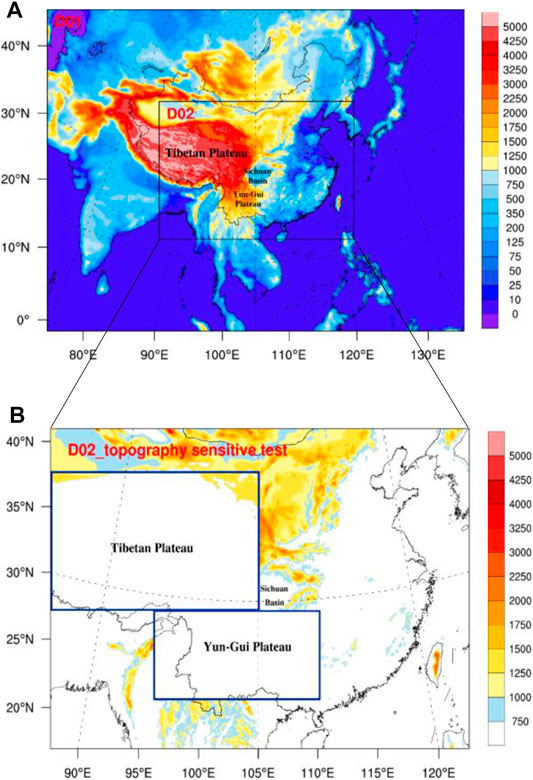
FIGURE 1. (A) Two domains (D01–D02) used in the Weather Research and Forecasting (WRF) simulations and (B) the modified topography (m, shaded) for D02 in the NOTER experiment. The Tibetan Plateau, Yungui Plateau, and Sichuan Basin are marked. Two blue boxes indicate the areas of the NOTER experiment.
Typically, the SWV is a cyclonic low-pressure system with significant baroclinic structures and complex temperature–humidity characteristics (Ye and Gao, 1979; Lu, 1986) between 700 and 850 hPa levels (Kuo et al., 1986; Lu, 1986). The air near the SWV is nearly moist adiabatic (Wang et al., 1993). The vorticity peaks at about 750 hPa (Feng et al., 2016). The vortex circulation in a strong SWV system is deep, which can extend up to 100 hPa (Chen et al., 1998).
With the rapid development of high-resolution reanalysis dataset, a new structure of SWV was first discovered by Zhou et al. (2017). They found that the SWV appeared with “double-yolk” or dual-core structure (DCSWV) sometimes. In other words, a big SWV embodied two small vortices. Later, Wu et al. (2018) further gave a strict definition of the DCSWV: two small coexisting vortices should be enclosed by the isohypse of the SWV, while their core centers should be within the southwest China (26–33° N, 100–108° E). Different from the conventional SWV, the DCSWV has two warm and moist centers, as well as two strong updrafts. It is accompanied by intensive precipitation centers, which brings wider rainfall range and greater influence to the regions (Zhou et al., 2017; Wu et al., 2018).
However, previous studies about the DCSWV only preliminarily revealed its structural characteristics (Zhou et al., 2017; Wu et al., 2018). The physical processes responsible for the initiation and intensification of the DCSWV are yet to be comprehensively explored. Previous studies suggested that the latent heat and topography can largely contribute to the initiation and intensification of the typical SWV (Ye and Gao, 1979; Ye, 1981; Wu and Chen, 1985; Chen and Dell’Osso, 1984; Kuo et al., 1986; Lu, 1986; Wang and Orlanski, 1987; Raymond and Jiang, 1990; Kuo et al., 1988; Fu et al., 2010; Jiang et al., 2012; Li et al., 2017). How about their roles in the DCSWV? How do they contribute to the initiation and intensification of the DCSWV? To address these, a typical DCSWV event, which occurred on July 16–17, 2010 over the SCB, is chosen, and the vorticity budget diagnostic is employed to investigate which physical processes are responsible for the initiation and intensification of the DCSWV.
The paper is organized as follows. The data and methodology are described in the Data and methodology section. In the Overview of the DCSWV event on July 16–17, 2010 section, an overview of the case study based on observation is presented. The simulated evolution of the DCSWV and the possible impacts of latent heat and topography on the DCSWV is discussed in the Modeling simulation and possible mechanisms of the evolution of the DCSWV section. Finally, the Summary and discussion section gives a summary and discussion.
Data and methodology
Data and model design
The 6-hourly National Centers for Environmental Prediction Final operational global analysis (NCEP-FNL) with the horizontal resolution of 1.0° × 1.0° was used to investigate the large-scale circulation associated with the DCSWV.
The Advanced Research Weather Research and Forecasting (WRF-ARW) model Version 3.6.1 (Skamarock et al., 2008) was applied to perform model simulations. The horizontal resolutions of the outer and inner domains were 30 and 10 km, with 284 × 397 and 218 × 280 grid points, respectively. There were 30 vertical levels, and the model top was set at 50 hPa. The model domain configurations are shown in Figure 1. The FNL data were used as the initial and boundary conditions. In the control simulation (hereafter CTL), the following physics and parameterization schemes were employed, which had been largely used for simulating the extreme precipitation and synoptic systems near the TP (Liu et al., 2019; Qin and Zou, 2019) the WRF single-moment three-class microphysics scheme (Hong et al., 2004), the Rapid Radiative Transfer Model longwave radiation scheme (Mlawer et al., 1997), the Dudhia shortwave radiation scheme (Dudhia, 1989), the Monin–Obukhov surface layer scheme (Janjić, 2002), the Noah land surface scheme (Ek et al., 2003), and the Kain–Fritsch cumulus scheme (Alapaty et al., 2012) in both domains. The 5-h model spin-up time had been tested to be optimal for simulating the DCSWV. Therefore, all the simulations started from 12:00 UTC July 16, 2010 and continued for 30 h.
Two sensitivity experiments were designed to investigate the effects of latent heat and topography on the DCSWV. In the first experiment (NOLH), the latent heat was turned off (i.e., set “cu_physics = 0” and “no_mp_heating = 1” in the WRF namelist), while all other progresses of physics and parameterizations remained the same as those in the CTL experiment. The second experiment (NOTER) is similar to the CTL experiment, but the terrain heights in the west of the SCB including the TP (26°–40°N, 84.5°–105°E) and the south of the SCB including the Yun-Gui Plateau (22°–30°N, 96°–111°E) were set to 500 m (Figure 1B).
In addition, the high-resolution CMORPH global precipitation analyses data and the Japan’s second Multifunctional Transport Satellite (MTSAT-2) IR1 brightness temperature data were used to examine the convective activities, which further confirmed the existence of the DCSWV. The CMORPH precipitation data (1-hourly, 0.1° × 0.1°) combined the National Oceanic and Atmospheric Administration/Climate Prediction Center morphing technique dataset with hourly gage rainfall data from about 30,000 automatic weather stations (Pan et al., 2012). This precipitation product had been widely used in the mesoscale research field (Shen et al., 2013). The brightness temperature data (hourly, 0.05° × 0.05°) is obtained from Japan’s second Multifunctional Transport Satellite (MTSAT-2) IR1 instrument (Takeuchi et al., 2007).
Methods
The evolution of the SWV can be represented by vorticity effectively (Fu et al., 2010; Feng et al., 2020), the diagnosis of vorticity budget was used here to probe into the detailed evolution process from a single-core SWV to the DCSWV. According to Zhang (1992), the vorticity equation can be written as Eq. 1:
The local time rate of change of vorticity was abbreviated as TOT. The HAV is the horizontal advection term of the absolute vorticity, which includes relative vorticity and planetary vorticity. The VAV denotes the vertical advection term of vorticity. The STR, TIL, and RES are the stretching term, tilting term, and residual term effect due to friction, respectively.
Latent heat release is crucial to the generation and development of the SWV (Ye, 1981; Kuo et al., 1986; Wang and Orlanski, 1987; Kuo et al., 1988; Fu et al., 2010). To investigate the effect of the diabatic heating in the genesis process of the DCSWV from a single SWV, the atmospheric apparent heat source (Q1) is calculated using Eq. 2 from Yanai et al. (1973):
where Cp is the specific heat of dry air at constant pressure,
Overview of the southwest vortex with dual-core structure event on July 16–17, 2010
At 12:00 UTC July 16, 2010, a typical DCSWV event occurred over the SCB. This event lasted about 14 h and dissipated at 06:00 UTC July 17, 2010. The DCSWV resulted in more than 100-mm 24-hourly accumulated precipitation in 51 cities. In Bazhong City, 1.92 million people were affected, and direct economic losses were about 910 million RMB (Wang and Zhang, 2011).
To investigate the life span of the DCSWV, Figure 2 shows the 6-hourly geopotential height and wind field using the NCEP-FNL from 12:00 UTC July 16 to 06:00 UTC July 17, 2010. At 12:00 UTC July 16 in Figures 2A,B, a low-pressure system within the isolines of 3,108-gpm was observed over southwest China. The center of this typical mesoscale SWV was near Leshan City (29°N, 104°E), marked as “C” in Figure 2. Meanwhile, a tropical low was located in the west of the South China Sea and brought southerlies wind from the ocean to the SCB. At 18:00 UTC July 16 in Figures 2C,D, the DCSWV appeared, which satisfied the criteria for a typical SWV reported by Lu (1986). A sub-mesoscale low-pressure vortex, marked as “C2” in Figures 2C,D, emerged near Langzhong City (31.5°N, 106°E). At the time, there were two vortices, “C1” and “C2”, coexisting over the SCB. Both vortices were embedded by the 3,108-gpm isotypes. It was apparent that the sub-mesoscale SWV “C1” and “C2” were born from the single-core “C”. Based on the criteria of Orlanski (1975), two mesoscale vortices “C1” and “C2” were regarded as the meso-β-scale vortex. The dual-core structure of SWV became more obvious at 00:00 UTC July 17 (Figures 2E,F). The DCSWV was mature and presented a typical double-yolk structure. It gradually moved to the northeast along with the southerly airflow, extending its influence beyond the SCB. At 06:00 UTC July 17 in Figures 2G,H, the dual-core structure disappeared and turned into a single-core structure. The center of the core was marked as “C3” in Figure 2.
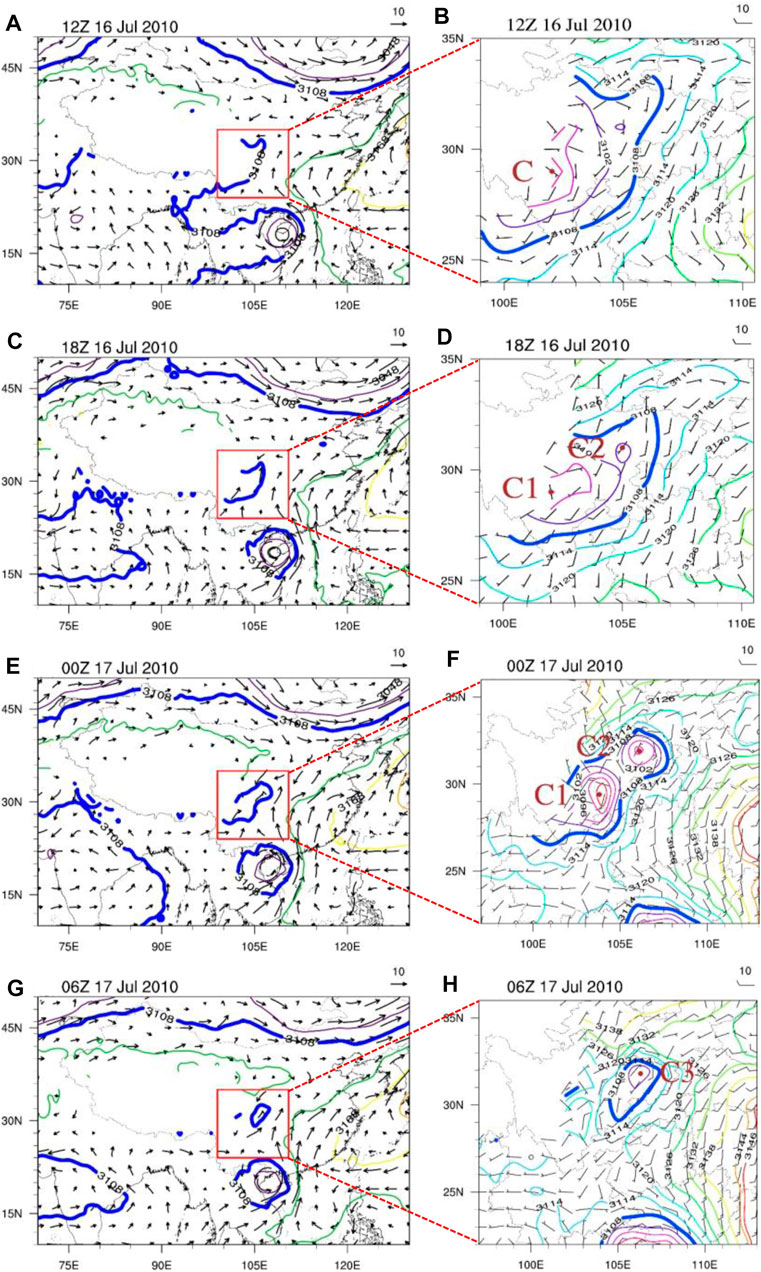
FIGURE 2. Spatial distributions of the 700 hPa geopotential height (gpm, contours) and wind field (m s−1, arrows) at (A,B) 12:00 UTC July 16, (C,D) 18:00 UTC July 16, (E,F) 00:00 UTC July 17, and (G,H) 06:00 UTC July 17. C, C1, C2, and C3 denote the southwest vortices (SWVs), and the brown dots represent their centers (the same in the following figures, if applicable).
The evolution of precipitation distribution associated with the DCSWV was prominent. At 12:00 UTC July 16, the precipitation center was located in the northeast of the center of SWV “C” (Figure 3A). At 18:00 UTC July 16, the intensity of precipitation was stronger, and there were obvious precipitation centers below the DCSWV (Figure 3B). Six hours later, two significant precipitation maxima (>100 mm) appeared in the west of “C1” and the east of “C2” (Figure 3C). Two precipitation maxima further demonstrated the existence of the DCSWV and provided better atmospheric thermal conditions. Compared with the typical SWV, the influence range of two rain belts accompanying DCSWV was wider. At the 06:00 UTC July 17, the precipitation decreased remarkably (Figure 3D). The rain belt shifted to the east, and the two vortices dissipated and transformed to a single-core “C3”.
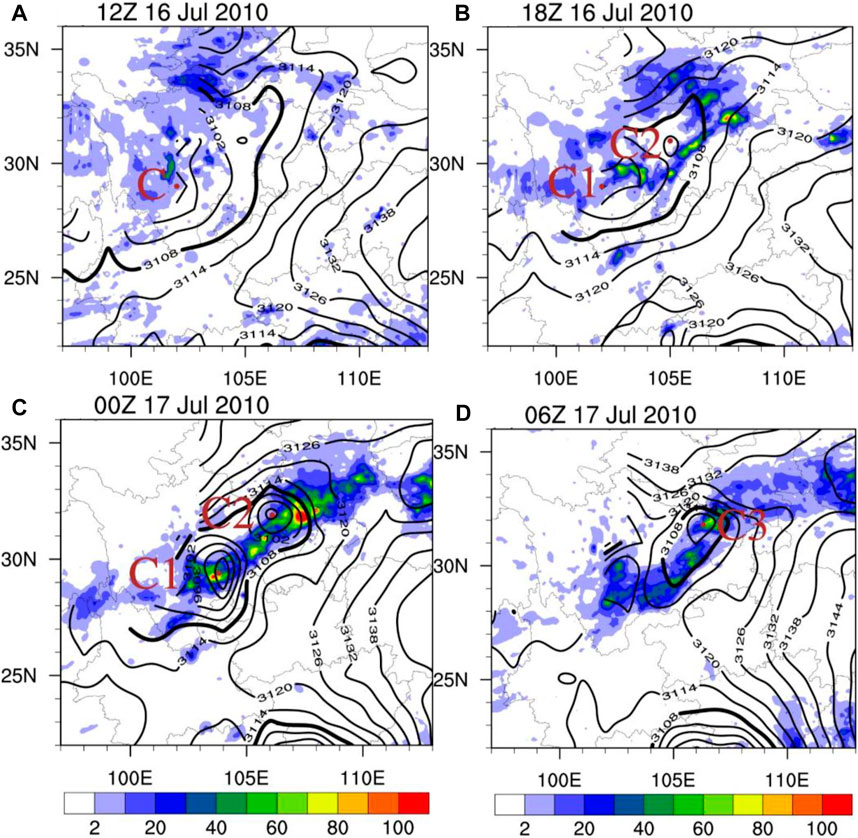
FIGURE 3. Spatial distributions of the 700 hPa geopotential height (gpm, contours) and the pre-6-h accumulated precipitation (mm, shaded) at (A) 12:00 UTC July 16, (B) 18:00 UTC July 16, (C) 00:00 UTC July 17, and (D) 06:00 UTC July 17.
The hourly MTSAT-2 brightness temperature also indicated the evolution of the two meso-β-scale vortices (Figure 4). Observations showed that the organized cloud clusters were located near two meso-β-scale vortices. At 12:00 UTC July 16, the convective cloud clusters were mainly located in the western part of vortex “C” (Figure 4A). Six hours later, accompanying the formation of two vortices, mesoscale convective cloud clusters were observed in their eastern part (Figure 4B). At 00:00 UTC July 17 (Figure 4C), the cloud clusters were also located near two vortices. Following the eastward movement of two meso-β-scale vortices, convective cloud clusters also moved to the downstream region. The precipitation and cloud clusters, thus, both demonstrated the dual-core structure of SWV.
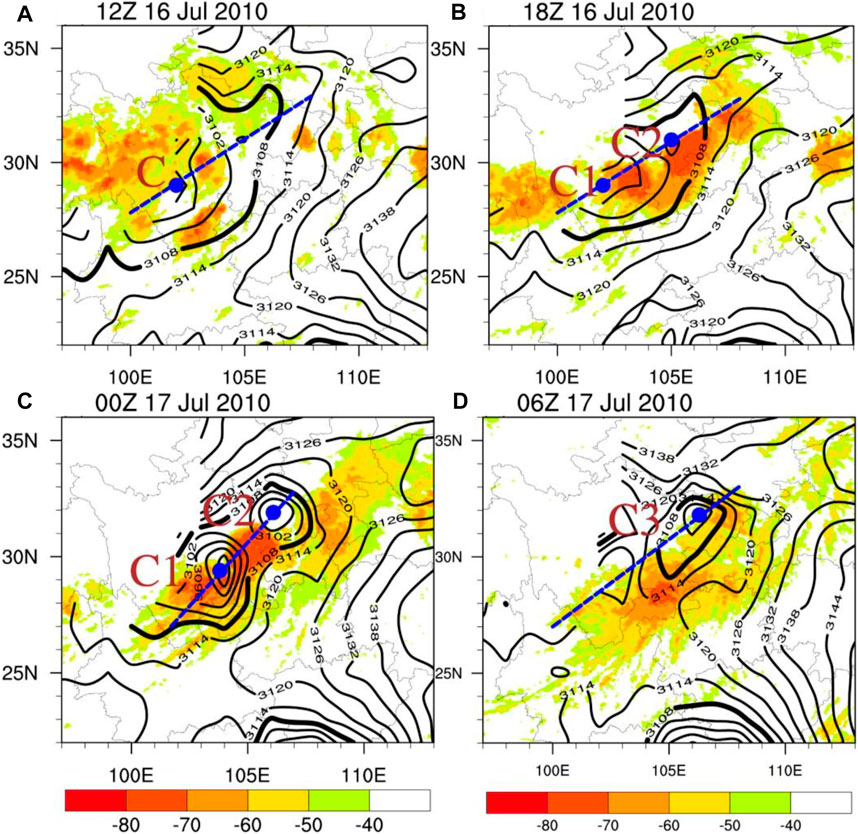
FIGURE 4. Spatial distributions of the 700 hPa geopotential height (gpm, contours) and Japan MTSAT-2 infrared temperature (°C, shaded) at (A) 12:00 UTC July 16, (B) 18:00 UTC July 16, (C) 00:00 UTC July 17, and (D) 06:00 UTC July 17. The blue lines are used to intercept the cross sections in Figures 5, 6.
A planetary wave trough was observed from Lake Baikal to the SCB (not shown), which favored the formation of the SWV (Kuo et al., 1986). There was an area of high pressure over the SCB at 200 hPa (not shown), demonstrating that SWV with a dual-core structure was similar with the typical SWV, which was usually visible in the lower troposphere at 700 and 850 hPa (Kuo et al., 1986; Lu, 1986).
Figure 5 showed the vertical cross sections of the pseudoequivalent potential temperature and relative vorticity over the central points of the SWVs along the lines was shown in Figure 4. At 12:00–18:00 UTC July 16 (Figures 5A, B), the shallow positive vorticity in the lower troposphere indicated that DCSWV was a shallow weather system in the initiation stage. At 00:00 UTC July 17 (Figure 5C), in the mature stage, two positive relative vorticity centers were observed as the “C1” and “C2”. The positive vorticity extended upward from the low level. The slightly westward-tilted “C1” was deeper than “C2”, where the vorticity extended from the surface to 200 and 400 hPa, respectively. The vorticity of the two vortices both peaked at 700 hPa. Six hours later, in the dissipating stage, “C1” and “C2” transformed to “C3”, which was likely the succession of “C2” (Figure 5D). The results of Figure 6 agree well with Figure 5. Two distinct centers of upward motion were observed over “C1” and “C2” from 18:00 UTC July 16 to 00:00 UTC July 17, which extended from surface to about 100 hPa. Besides, the nearly saturated relative humidity around the “C1” and “C2” demonstrated the moist features of the DCSWV.
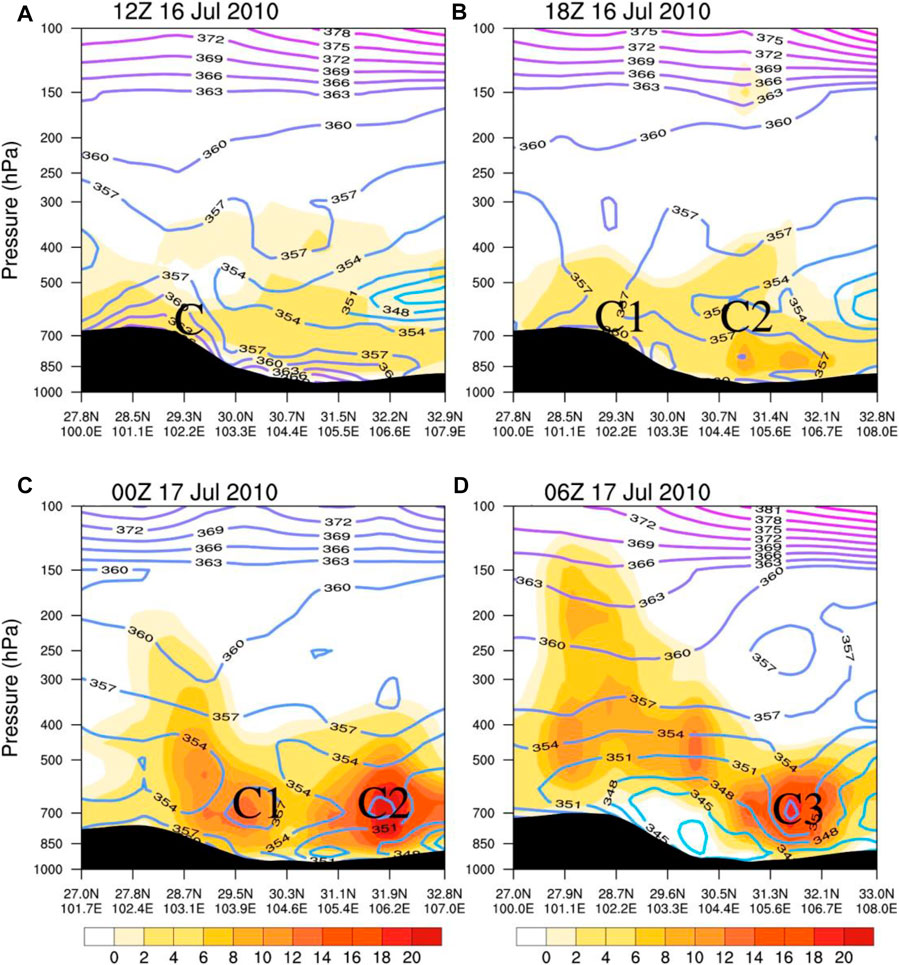
FIGURE 5. Vertical cross sections of the pseudoequivalent potential temperature (K, contours) and relative vorticity (10−5 s−1, shaded) at (A) 12:00 UTC July 16, (B) 18:00 UTC July 16, (C) 00:00 UTC July 17, and (D) 06:00 UTC July 17. The black areas at the bottom of the figures represent the topography (the same in the following figures).
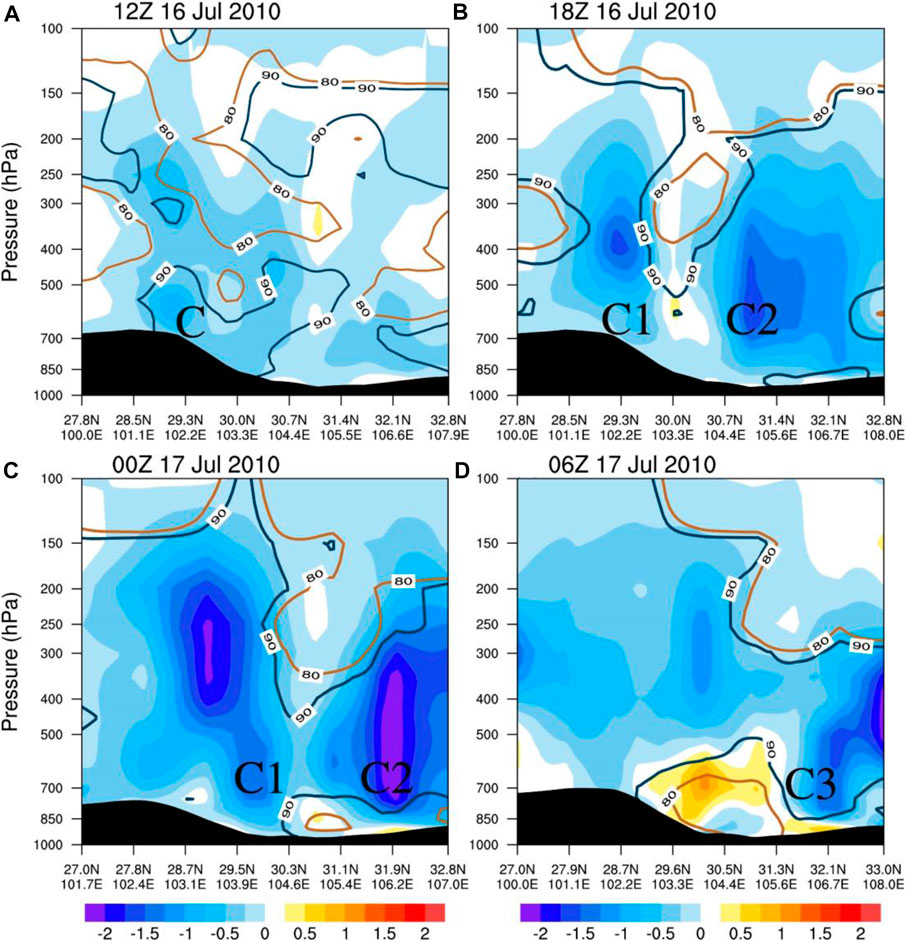
FIGURE 6. Vertical cross-section of the vertical velocity (Pa s−1, shaded) and the relative humidity (%, contours) at (A) 12:00 UTC July 16, (B) 18:00 UTC July 16, (C) 00:00 UTC July 17, and (D) 06:00 UTC July 17.
Modeling simulation and possible mechanisms of the evolution of the southwest vortex with dual-core structure
Modeling results
To quantify the capability of the WRF model in simulating the evolution of DCSWV, the FNL data were first gridded as the domain 2 of WRF model. The correlation coefficients between the WRF (simulated variables in domain 2) and the FNL data, including the 700 hPa geopotential height, U-component of wind, and V-component of wind at 18:00 UTC July 16 and 00:00 UTC 17 July 17, 2010 were calculated (Table 1). The correlation coefficients of the geopotential height were up to 0.87. Meanwhile, those of the U-component and the V-component of winds reached 0.83 and 0.86, respectively. All of them were statistically significant at the 99% confidence level. These indicated that the WRF simulations could well capture the evolution of DCSWV.

TABLE 1. List of the correlation coefficients of the 700 hPa geopotential height, 700-hPa U-component of wind, and 700-hPa V-component of wind between the control simulation (CTL) run (Domain 02) data and FNL data.
The evolution of the DCSWV was divided into five stages (Figure 7). At the first stage (16:00 UTC July 16), the single-core stage, the typical SWV, vortex “C”, was enclosed by the 3,108-gpm isoline (Figure 7A). At the second stage (17:00 UTC July 16), the DCSWV initiation stage, the 3,108-gpm isoline extended northward, and the vortex “C2” appeared northeast of “C1”. The simulated positions “C1” were basically consistent with the observation, while “C2” was located in the south of the observed “C2” (Figure 7B). The warm and moist southwest and southeast flows near the east of the TP led to the unstable stratification (Figure 8B) and upward movement (not shown) in the lower troposphere of “C1” and “C2”. It was worth noting that “C1” formed at higher topography, and “C2” formed in the SCB. Whether the topography had a significant impact on the formation of “C2” will be tested in the Topography effect section.
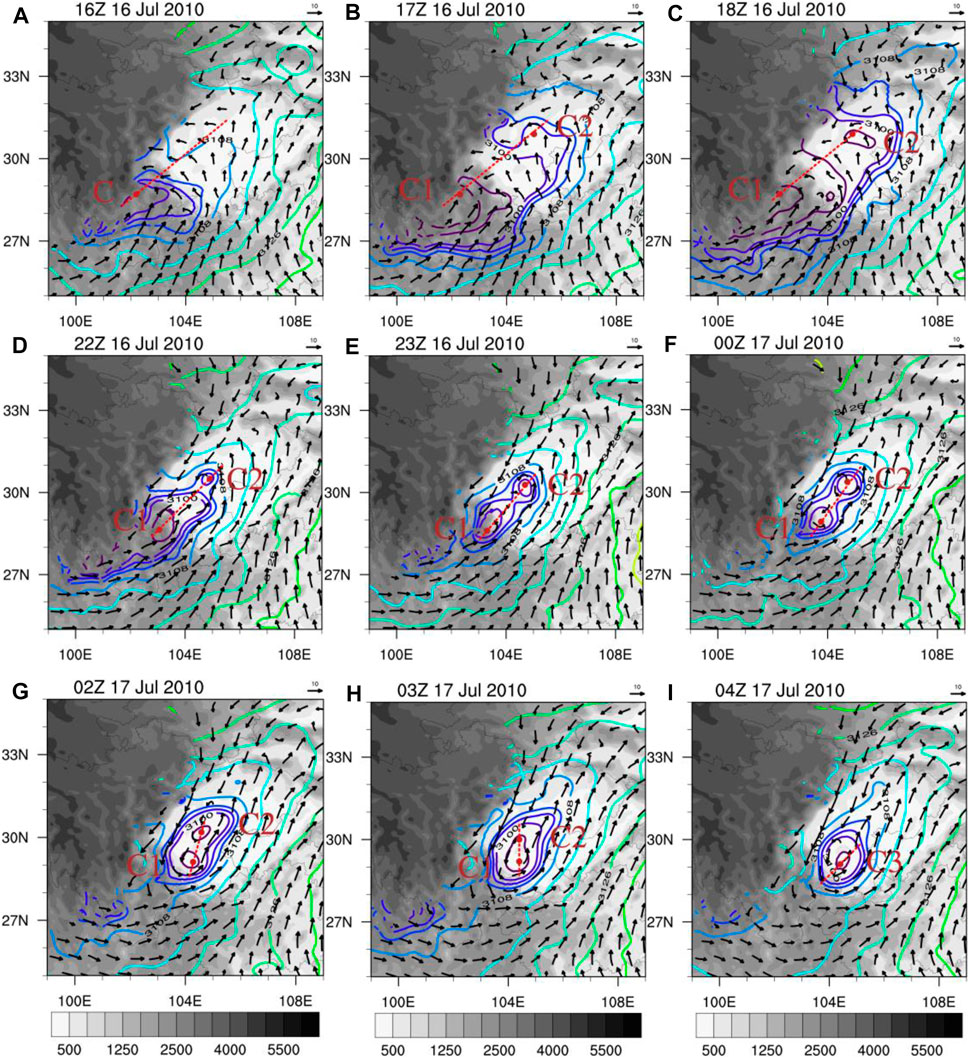
FIGURE 7. Modeling simulated 700 hPa geopotential height (gpm, contours), wind field (m s−1, arrows), and terrain height (m, shaded) from the control simulation (CTL) experiment inside Domain 02 at (A) 16:00 UTC July 16, (B) 17:00 UTC July 16, (C) 18:00 UTC July 16, (D) 22:00 UTC July 16, (E) 23:00 UTC July 16, (F) 00:00 UTC July 17, (G) 02:00 UTC July 17, (H) 03:00 UTC July 17, and (i) 04:00 UTC July 17. The red dots denote the centers of SWVs. The red lines indicate the transects of the cross sections in Figure 8.
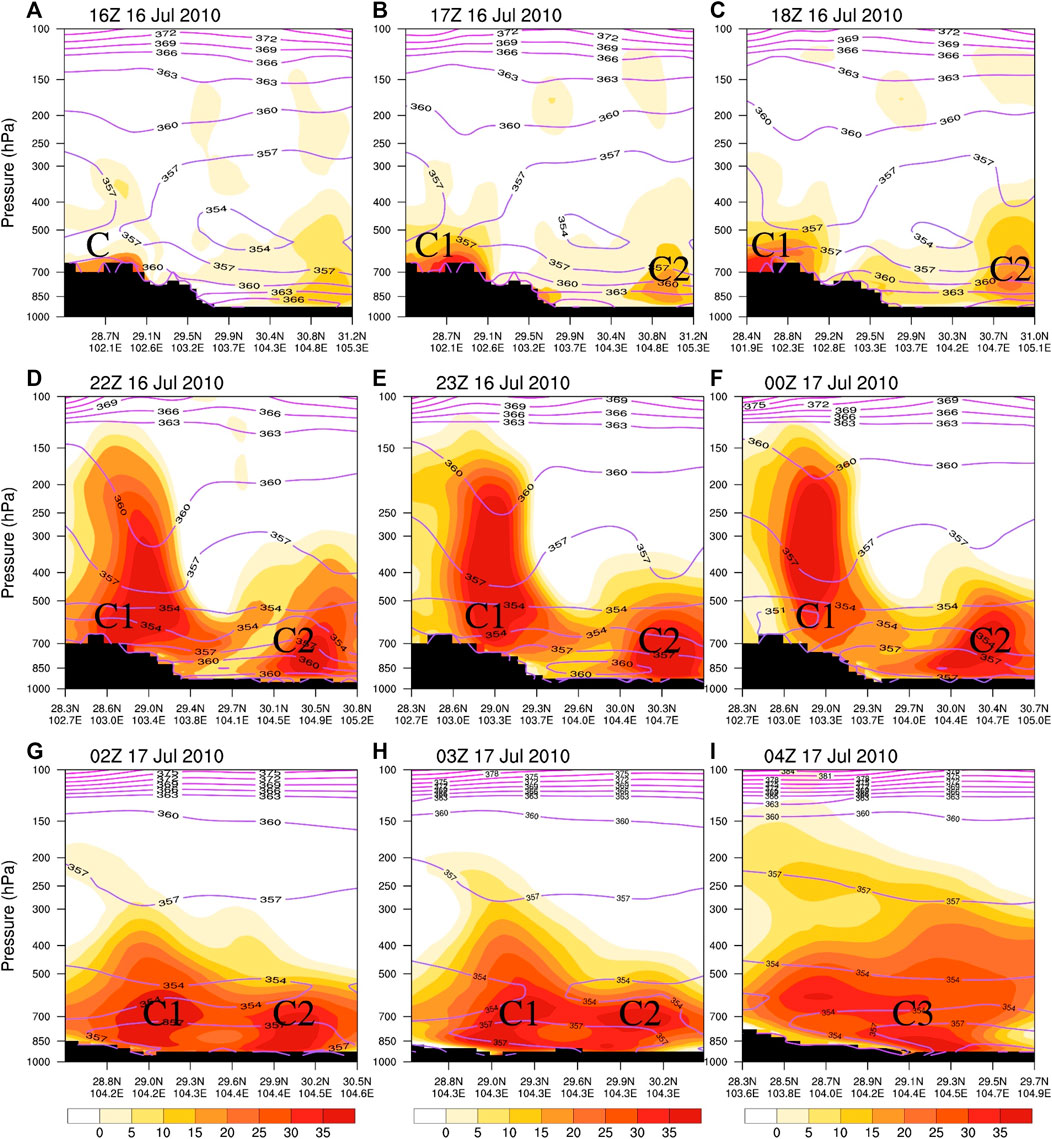
FIGURE 8. Vertical cross sections of the pseudoequivalent potential temperature (K, contours) and relative vorticity (10−5 s−1, shaded) from the CTL experiment at (A) 16:00 UTC July 16, (B) 17:00 UTC July 16, (C) 18:00 UTC July 16, (D) 22:00 UTC July 16 (E) 23:00 UTC July 16, (F) 00:00 UTC July 17, (G) 02:00 UTC July 17, (H) 03:00 UTC July 17, and (i) 04:00 UTC July 17.
At the third stage (18:00–22:00 UTC July 16), the DCSWV intensification stage (Figures 7C, D), a typical DCSWV was developing. Two cores were embedded in the 3,108-gpm isohypse, which was consistent with the observation (Figure 5B). The two obvious lower-tropospheric positive vorticity centers, as well as warm and moist conditions, facilitated the initiation and intensification of the DCSWV (Figure 5B, Figures 8C,D).
At the fourth stage (23:00 UTC July 16 to 02:00 UTC July 17), the mature stage, the structure of the DCSWV became more obvious (Figures 7E,G). The northeasterly to the north of DCSWV and the southwesterly to the south of DCSWV brought “C1” and “C2” closer. Two corresponding positive vorticity centers exhibited a double-yolk structure (Figures 8E,G).
At the fifth stage (03:00 UTC July 17 to 04:00 UTC July 17), the DCSWV entered into the decay stage. The typical pattern of two closed SWVs gradually disappeared, while the vorticity of “C2” gradually weakened at 03:00 UTC July 17 (Figure 8H). After 1 h, “C1” and “C2” dissipated and became a single-core vortex “C3”. Only a single strong positive vorticity center was observed. In the entire process, the DCSWV lasts for about 11 h from initiation to dissipation.
Main factors of influencing the evolution of the southwest vortex with dual-core structure
Vorticity budget
Since the vorticity budget is an effective measurement to analyze the development of the SWV (Fu et al., 2014; 2017), the vorticity budget for the DCSWV was calculated to study the relative importance of each term in the vorticity budget equation to the DCSWV. The key region of SWVs was defined as an area within the radius of 1° from the center of the vortex. As shown in Figure 9, the regional averaged vorticity budgets for key regions “C”, “C1”, “C2”, and “C3” were examined, respectively. At 16:00 UTC July 16 (the single-core stage of SWV), the moisture divergence (Figure 10) and vertical motion dominated the key region of “C”. Under these favorable conditions, the convergence-related STR and VAV terms were the main contributions of the positive vorticity budget of “C”. From 17:00 to 23:00 UTC July 16 (the formation of the DCSWV), due to intensified convection (Figure 9C), the convection-related TIL term transported the positive vortex from the lower troposphere to the upper level, which increased from −8.5 × 10⁻⁹ to 7.2 × 10⁻⁹s−2, acting as the second contribution of cyclonic vorticity “C1” at 700 hPa. At the same time, convergence and ascending motion intensified rapidly, while the convection around the key region of “C1” was active (Figure 9C). The convergence-related STR acted as the main contribution to the cyclonic vorticity of “C1” at 700 hPa, and convective-related TIL was the second contribution (Figure 9A). These terms resulted in the increase in the total vorticity budget (TOT). This feature suggested that the STR and TIL terms played important roles in the development of “C1”. After 23:00 UTC 16 July, the “C1” within DCSWV entered the mature stage, and the HAV and TIL terms were favorable to the increase in cyclonic vorticity “C1”. With the evolution of the vortex, after 01:00 UTC July 17, the HAV term increased rapidly and maintained the cyclonic vorticity in the vortex region together with the TIL term. At 04:00 UTC July 17, the DCSWV dissipated and transformed to “C3”. Terms of HAV and TIL were the main contributions to “C3” cyclonic vorticity.
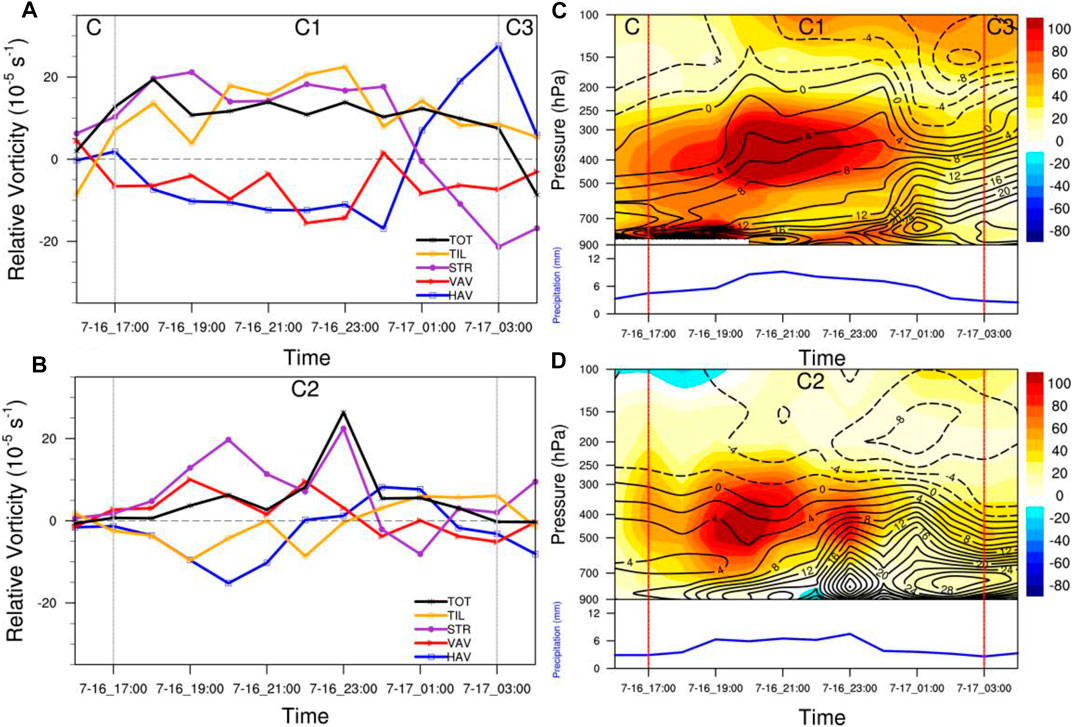
FIGURE 9. Regionally averaged vorticity budget terms (units: 10−9 s−2) for (A) C, C1, C3, and (B) C2 at 700 hPa, and time–pressure sections of apparent heat source Q1 (K day−1, shaded), relative vorticity (10−5 s−1, black contours), and regional mean precipitation over the key region (mm, blue line) from 16:00 UTC July 16 to 04:00 UTC July 17 in the CTL experiment for (C) C, C1, C3, and (D) C2. HAV, VAV, STR and TIL denote horizontal advection of vorticity, vertical advection of vorticity, stretching, and tilting, respectively. The local time rate of change of vorticity is abbreviated as TOT. Vertical gray solid lines mark the start and end time of the SWVs.
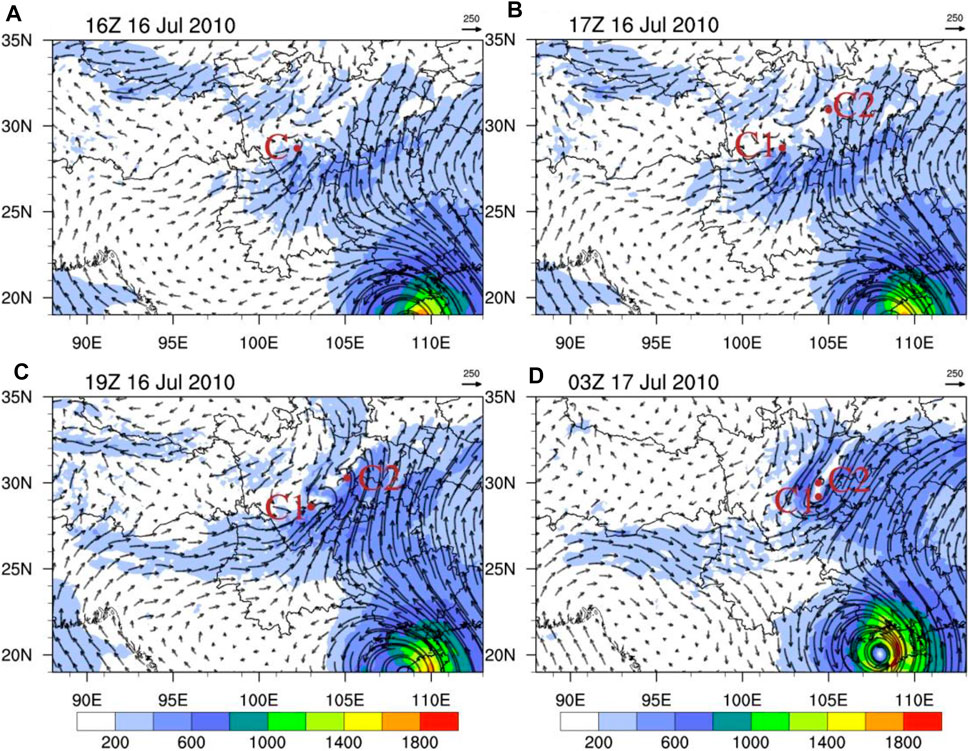
FIGURE 10. Vertical integration of water vapor fluxes from 1,000 to 300 hPa (shadings and arrows, unit: kg m−1 s−1) by the CTL experiment at (A) 16:00 UTC July 16, (B) 17:00 UTC July 16, (C) 19:00 UTC July 16, and (D) 03:00 UTC July 17.
The TOTs of “C2” were smaller than those of “C1” on the whole (Figures 9A, B). At 16:00 UTC July 16 (the initiation stage of the DCSWV), the STR term mainly increased the cyclonic vorticity of “C2” within the key region of the DCSWV (Figure 9B). Moreover, the vertical upward movement was enhanced in the “C2” key region (not shown), and the term VAV became a second contributor to “C2” development. From 17:00 to 23:00 UTC July 16 (during the initiation and intensification stages of the DCSWV), the terms of STR and VAV were the main contributions to the vorticity tendency of “C2”. During the DCSWV mature stage (23:00 UTC July 16 to 02:00 UTC July 17), “C2” evolved rapidly (Figure 9B), and its cyclonic vorticity increased because of the terms of TIL and HAV. After 03:00 UTC July 17, the TIL term decreased gradually, leading to the negative TOT and dissipating of “C2”.
Overall, moisture convergence and vertical motion were evident within the key region of the DCSWV. As a result, the convergence-related STR and the VAV term related to ascending motion could increase the DCSWV cyclonic vorticity. However, the STR and TIL terms played important roles in the development stage of “C1”, while the STR and VAV terms were the main positive contributors to the formation and development stages of “C2”.
Latent heat release effect
There were obvious water vapor convergence and convection activities in the key area before the formation of the DCSWV (Figures 9C,D). As the previous studies suggested, latent heat release can largely contribute to the formation and development of SWV (Ye, 1981; Kuo et al., 1986; Wang and Orlanski, 1987; Raymond and Jiang, 1990; Kuo et al., 1988; Fu et al., 2010; Li et al., 2017). In order to explore the influence of latent heat release on the evolution of the DCSWV, we calculated Q1, relative vorticity, and regional mean precipitation in the key region (Figures 9C,D).
It is well known that water vapor flux has an important role in the release of latent heat. Figure 10 showed the vertical integration of water vapor fluxes from 1,000 to 300 hPa by the CTL experiment. As shown in Figure 10, the DCSWV formed at 17:00 UTC July 16, with one water vapor channel from the South China Sea to the key area of “C1”, which provided sufficient moisture to trigger convection and release lots of convective condensation latent heat. Since 19:00 UTC July 16, two southerly water vapor channels from the Bay of Bengal and the South China Sea converged and ascended over the key region of the DCSWV, which further enhanced water vapor convergence and ascending motion, releasing more latent heat to warm the lower and middle troposphere in the key region of “C1”. The process increased the vorticity between 850 and 700 hPa (Raymond and Jiang, 1990), which promoted the DCSWV significantly (Figure 9C). The positive feedback between the enhanced latent heat and the vorticity of “C1” indicated that latent heat release played an important role in the development of “C1”. After 23:00 UTC July 16, “C1” within the DCSWV reached the mature stage, with a Q1 maximum center located in the middle and lower troposphere over the key region, which was conducive to the obvious positive vorticity center at 850–700 hPa. With the decreasing water vapor transportation from the Bay of Bengal, moisture convergence and ascending motion became weaker, leading to a weaker positive vorticity. One hour later, the vortex “C1” dissipated and transformed to “C3”.
Compared with “C1”, Q1 maximum over the key area of “C2” was mainly located at the 700–200 hPa (Figures 9C,D). Before 17:00 UTC on July 16, when “C2” had not yet formed, the key area was warm and moist (Figure 8A) due to the influence of the southeasterly wind. A strong upward motion also existed at the same time. These favorable physical conditions were beneficial to trigger convective activities. The associated latent heat then warmed the regional atmosphere, which was favorable to increase the vorticity in the lower troposphere and form “C2” in the DCSWV. After 23:00 UTC July 16, “C2” entered the mature stage. Similar to “C1”, precipitation and Q1 enhanced rapidly near the key area of “C2” due to the moisture transportation and accumulation from the Bay of Bengal and the South China Sea (Figure 10). Meanwhile, an obvious positive vorticity center appeared as the vorticity was enhanced in the lower layer. This indicated that latent heat release also played an important role in the development stage of “C2”. Finally, the DCSWV dissipated at 04:00 UTC July 17 as latent heat release weakened (Figure 9D).
The above analyses showed that the latent heat release played an important role in the overall evolution of the DCSWV. During the evolution of DCSWV, a large amount of water vapor from the ocean converged into its key area making the lower troposphere warm and wet (Figures 8, 10). These conditions, combined with the remarkable ascending motion caused by moisture convergence, could trigger convection, as well as the convective condensational latent heat release, resulting in the production of cyclonic vorticity, and the formation and development of the DCSWV. Therefore, a favorable circulation related to the DCSWV occurred through the positive feedback from the increased latent heat associated with convective activities.
To further verify the importance of latent heat release on the DCSWV, the NOLH experiment was performed, and the results were compared with CTL run. At 18:00 UTC on July 16, a shallow SWV core (marked as “C”) at 700 hPa was observed over the SCB in the NOLH experiment (Figure 11C). The NOLH results showed weaker pseudoequivalent potential temperature and relative vorticity than those in the CTL results (not shown). Q1 and rainfall over the key area of “C” were also weak (Figure 12) because the latent heat release was turned off, which was consistent with our speculation. Moreover, a dual-core structure as the DCSWV could not be found in the NOLH experiment (Figure 11). It means that the positive feedback of latent heat release on the vortex disappeared, making it difficult to develop the SWV “C” and further trigger another core like “C2”. With lack of positive feedback mechanism without latent heat release, DCSWV could not be formed. Therefore, the release of latent heat was the important and decisive factor in the formation and maintenance of the DCSWV.
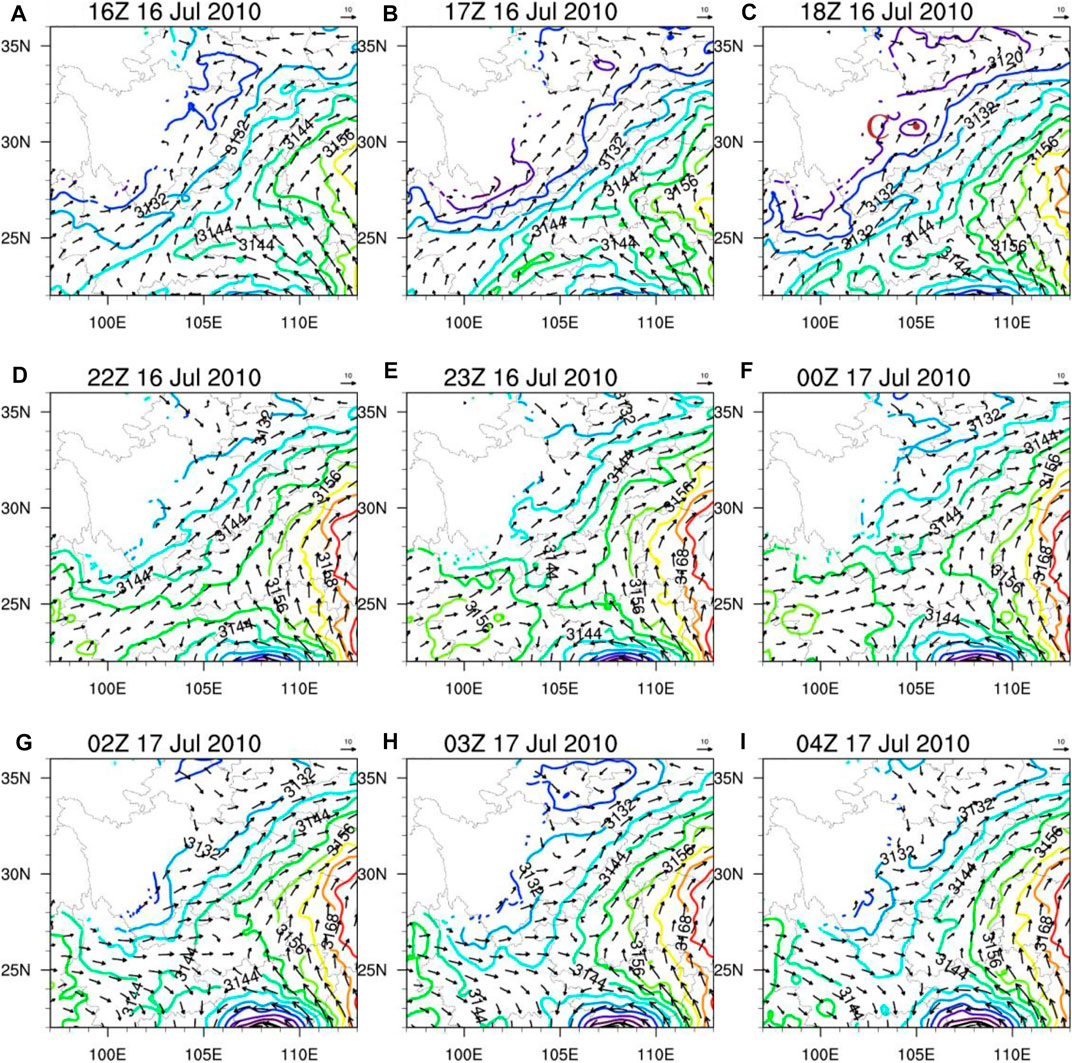
FIGURE 11. The 700 hPa geopotential height (gpm, contours) and wind field (m s−1, arrows) for the NOLH experiment at (A) 16:00 UTC July 16, (B) 17:00 UTC July 16, (C) 18:00 UTC July 16, (D) 22:00 UTC July 16 (E) 23:00 UTC July 16, (F) 00:00 UTC July 17, (G) 02:00 UTC July 17, (H) 03:00 UTC July 17, and (i) 04:00 UTC July 17.
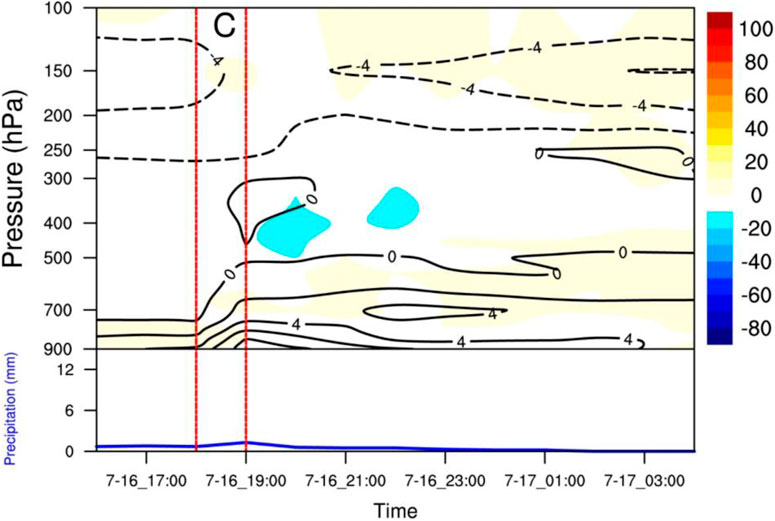
FIGURE 12. Time–pressure sections of apparent heat source Q1 (K day−1, shaded), relative vorticity (10−5 s−1, black contours), and regional mean precipitation in the key region of C (mm, blue line) from 16:00 UTC July 16 to 04:00 UTC July 17 by the NOLH experiment.
Topography effect
Previous studies have documented that the formation and development of the SWV is influenced by the complex topography of the TP (Ye and Gao, 1979; Wu and Chen, 1985; Lu, 1986; Jiang et al., 2012). To investigate the contribution of terrain on the evolution of the DCSWV, NOTER experiment was conducted (Figure 13). Compared with the CTL run with topography, the NOTER experiment exhibited a similar DCSWV pattern with different location and duration. The simulated southwesterly and southeasterly winds were stronger than those in the CTL run. The strong southerlies is the key factor to the formation of SWV (Li et al., 2017). The strong cyclonic wind shear formed because of the southwest and southeast airflow over the region where the terrain was removed. Strong convergence also occurred in the lower troposphere. Different from the CTL run, the “C1” and “C2” in the NOTER experiment appeared almost simultaneously at 19:00 UTC July 16. Moreover, the size of the DCSWV was significantly larger due to the stronger southerlies with the absence of topography influence of the TP and the Yun-Gui Plateau (Figures 7, 13).
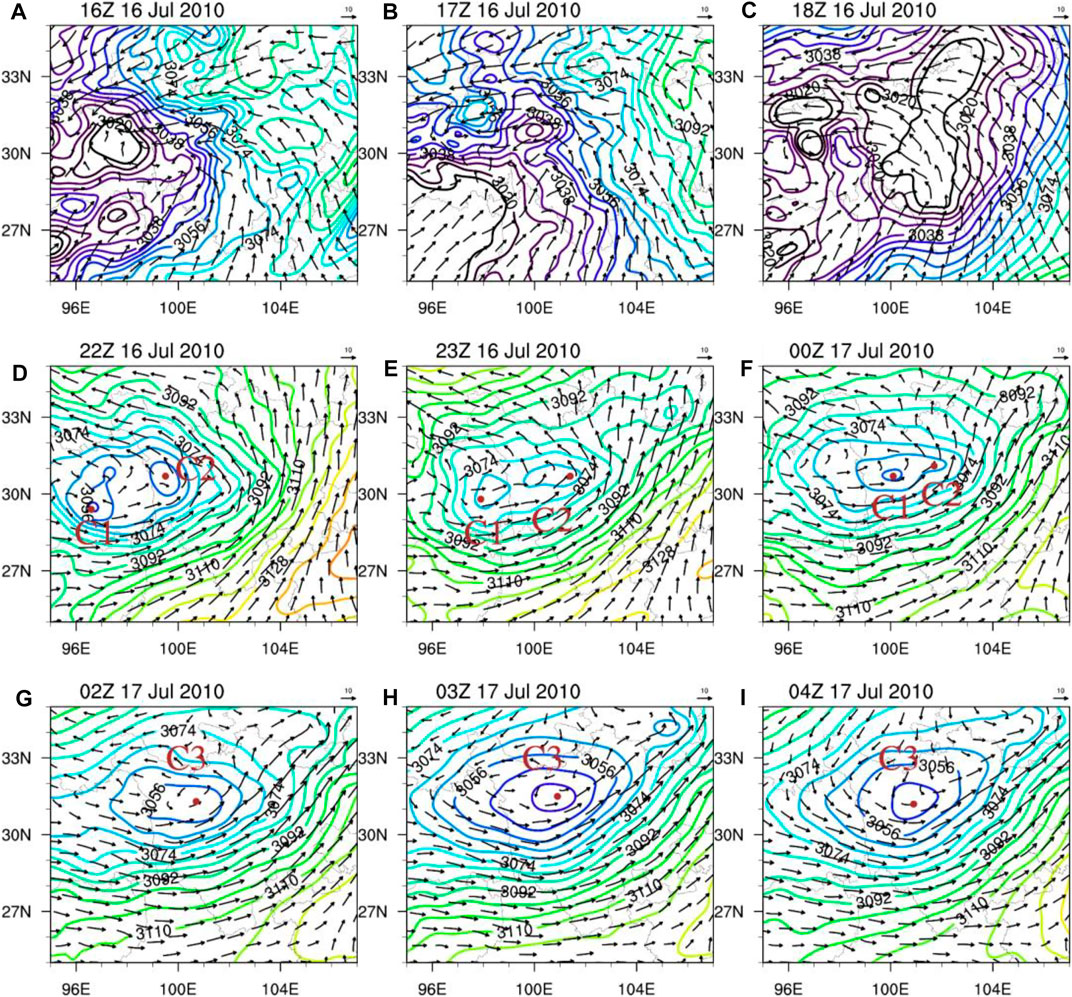
FIGURE 13. 700 hPa geopotential height (gpm, contours) and wind field (m s−1, arrows) for the NOTER experiment at (A) 16:00 UTC July 16, (B) 17:00 UTC July 16, (C) 18:00 UTC July 16, (D) 22:00 UTC July 16 (E) 23:00 UTC July 16, (F) 00:00 UTC July 17, (G) 02:00 UTC July 17, (H) 03:00 UTC July 17, and (i) 04:00 UTC July 17.
Before the generation of the DCSWV, the positive vorticity in the key region of the DCSWV was mainly contributed by the STR and VAV terms (Figure 14A). The intense convergence and vertical motions were conducive to the convection, which favor the associated latent heat warming the atmosphere rapidly (Figure 14B). As shown in Figure 14A, terms of VAV and HAV were the main positive contributions to the formation of the DCSWV at 20:00 UTC July 16, while HAV and TIL terms were beneficial to its maintenance until 00:00 UTC July 17. During the evolution of the DCSWV, Q1 warmed the surrounding atmosphere in the middle and upper layers (Figure 14B). Compared with the CTL run (Figures 9C,D and Figure 14), the Q1 and precipitation were weaker, and the duration of the DCSWV was shorter (lasting about 5 h) in the NOTER experiment.
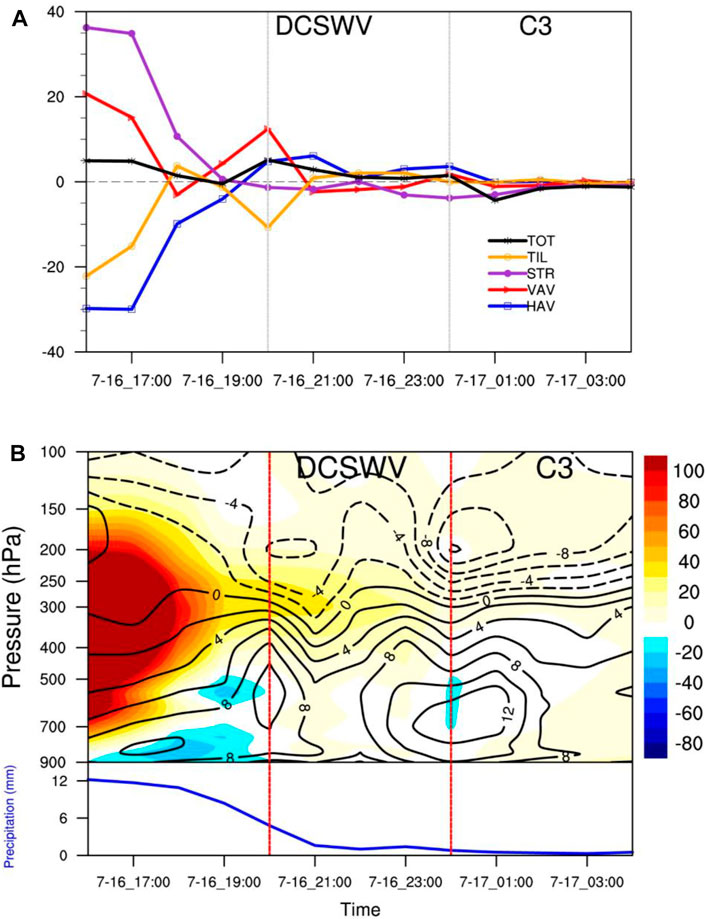
FIGURE 14. (A) Regionally averaged vorticity budget terms (units: 10−9 s−2) of SWVs and (B) time–pressure sections of apparent heat source Q1 (K day−1, shaded), relative vorticity (10−5 s−1, black contours), and regional mean precipitation within the key region (mm, blue line) from 16:00 UTC July 16 to 04:00 UTC July 17 in the NOTER experiment.
To sum up, although the lateral friction in the TP and Yun-Gui Plateau were not the decisive factors for the formation of the DCSWV as latent heat, the topographical forcing and dynamical instability could influence the location, size, and duration of the DCSWV.
Summary and discussion
The DCSWV is difficult to be recognized with coarse observations, partly because its spatial and temporal scales are too small to be captured. Therefore, this study used the NCEP-FNL dataset and the WRF model to investigate and simulate the evolution of the DCSWV, as well as examine the influence of latent heat release and topography on the DCSWV. The major conclusions are summarized below:
1) The observed SWV occurred from 12:00 UTC July 16 to 06:00 UTC July 17, 2010. Two rain belts and cloud clusters were observed near the SWV “C1” and “C2”, which further confirmed the presence of the DCSWV. Meanwhile, a westerly trough was observed from Lake Baikal to the SCB, which was favorable for the formation of vortexes. Besides, this DCSWV was most visible in the lower troposphere with two centers at 700 and 850 hPa, and the precipitation brought by the DCSWV had a more severe and extensive impact on the local region compared with a typical single SWV.
2) The DCSWV could be divided into five stages, with a lifetime of 11 h from gestation to dissipation. In the gestation stage of the DCSWV, the lower troposphere was warm and wet, indicating that the atmosphere was unstable. In the development and mature stage, the DCSWV had two obvious relative vorticity centers horizontally, “C1” and “C2”, which was similar to the “double-yolk” structure, and it should be noted that “C1” was deeper and stronger than “C2”. These two cores both had warm and moist vertical structures along with two clear centers of upward motion.
3) The vorticity budget showed that the contribution terms to the initiation and intensification of “C1” and “C2” were different. The STR and TIL terms were the main positive contributors to the intensification of “C1”, while the STR and VAV terms played important roles in the initiation and intensification of “C2”, which implied the importance of moisture convergence and ascending motion. In fact, abundant water vapor was transported by southerlies from the Bay of Bengal and the South China Sea to the key region of the DCSWV. Abundant water vapor flux benefited the stronger moisture convergence and upward motion, which led to the release in convective latent heat that increased lower-troposphere vorticity. These thermodynamic conditions were favorable to the evolution of the DCSWV. Such positive feedback was good for the intensification stage of “C1” and decisive to the initiation and intensification stages of “C2.” Furthermore, NOLH and NOTER experiments showed that topographical forcing and dynamical instability were insufficient to maintain the DCSWV without latent heat, while the TP and Yun-Gui Plateau topography could influence the location, size, and duration of the DCSWV.
This study gives details of the possible mechanism of the DCSWV using dynamic diagnosis and WRF simulation to a typical DCSWV case, which is helpful to weather forecasters to learn more about the DCSWV. Although the individual case is representative, the sample size is limited. Therefore, more cases of the DCSWV, as well as the wave instability and other forcing factors will be worth further study over the SCB to clarify the common physical characteristics of the DCSWV in more detail.
Data Availability Statement
The NCEP-FNL reanalysis data were obtained from https://rda.ucar.edu/datasets/ds083.2/. The ERA5 reanalysis data were retrieved from https://www.ecmwf.int/en/forecasts/datasets/reanalysis-datasets/era5. The MTSAT-2 IR1 brightness temperature data were downloaded from http://weather.is.kochi-u.ac.jp/archive-e.html. The CMORPH global precipitation data is available at http://data.cma.cn.
Author Contributions
ZW conducted the analyses. HL supervised the study. ZW, HL, KC, and KW wrote the manuscript. ZW, HL, KC, KW, and WZ contributed to the discussion of the results.
Funding
This work of ZW and HL was jointly supported by the National Natural Science Foundation of China (42075008), the Special Foundation for the security capacity building of China Civil Aviation Administration of China (20600822). This work of KC was jointly supported by the National Key R&D Program of China (2019YFC1510400), the National Natural Science Foundation of China (41975052), the Innovation Group Project of the Southern Marine Science and Engineering Guangdong Laboratory (Zhuhai) (311021001), and the Guangdong Province Key Laboratory for Climate Change and Natural Disaster Studies (2020B1212060025).
Conflict of Interest
The authors declare that the research was conducted in the absence of any commercial or financial relationships that could be construed as a potential conflict of interest.
Publisher’s Note
All claims expressed in this article are solely those of the authors and do not necessarily represent those of their affiliated organizations, or those of the publisher, the editors, and the reviewers. Any product that may be evaluated in this article, or claim that may be made by its manufacturer, is not guaranteed nor endorsed by the publisher.
References
Alapaty, K., Herwehe, J. A., Otte, T. L., Nolte, C. G., Bullock, O. R., Mallard, M. S., et al. (2012). Introducing Subgrid‐scale Cloud Feedbacks to Radiation for Regional Meteorological and Climate Modeling. Geophys. Res. Lett. 39, L24809. doi:10.1029/2012GL054031
Chen, S.-J., and Dell'osso, L. (1984). Numerical Prediction of the Heavy Rainfall Vortex over Eastern Asia Monsoon Region. J. Meteorol. Soc. Jpn. 62, 730–747. doi:10.2151/jmsj1965.62.5_730
Chen, Z.-M., Miao, Q., and Min, W.-B. (1998). A Case Analysis on Mesoscale Structure of Severe Southwest Vortex. Q. J. Appl. Meteorology 9, 18–27.
Dudhia, J. (1989). Numerical Study of Convection Observed during the winter Monsoon experiment Using a Mesoscale Two-Dimensional Model. J. Atmos. Sci. 46, 3077–3107. doi:10.1175/1520-0469(1989)046<3077:nsocod>2.0.co;2
Ek, M. B., Mitchell, K. E., Lin, Y., Rogers, E., Grunmann, P., Koren, V., et al. (2003). Implementation of Noah Land Surface Model Advances in the National Centers for Environmental Prediction Operational Mesoscale Eta Model. J. Geophys. Res. 108, 8851. doi:10.1029/2002JD003296
Feng, S. L., Jin, S. L., Fu, S. M., Sun, J. H., and Zhang, Y. C. (2020). Formation of a Kind of Heavy‐precipitation‐producing Mesoscale Vortex Around the Sichuan Basin: An Along‐track Vorticity Budget Analysis. Atmos. Sci. Lett. 21, e949. doi:10.1002/asl2.949
Feng, X., Liu, C., Fan, G., Liu, X., and Feng, C. (2016). Climatology and Structures of Southwest Vortices in the NCEP Climate Forecast System Reanalysis. J. Clim. 29 (21), 7675–7701. doi:10.1175/JCLI-D-15-0813.1
Fu, S., Jian-Hua, S., Si-Xiong, Z., and Wan-Li, L. (2010). The Impact of the Eastward Propagation of Convective Systems over the Tibetan Plateau on the Southwest Vortex Formation in Summer. Atmos. Oceanic Sci. Lett. 3, 51–57. doi:10.1080/16742834.2010.11446836
Fu, S.-M., Sun, J.-H., Luo, Y.-L., and Zhang, Y.-C. (2017). Formation of Long-Lived Summertime Mesoscale Vortices over Central East China:Semi-Idealized Simulations Based on a 14-Year Vortex Statistic. J. Atmos. Sci. 74, 3955–3979. doi:10.1175/JAS-D-16-0328.1
Fu, S., Li, W., Sun, J., Zhang, J., and Zhang, Y. (2014). Universal Evolution Mechanisms and Energy Conversion Characteristics of Long-Lived Mesoscale Vortices over the Sichuan Basin. Atmos. Sci. Lett. 16, 127–134. doi:10.1002/asl2.533
Hong, S.-Y., Dudhia, J., and Chen, S.-H. (2004). A Revised Approach to Ice Microphysical Processes for the Bulk Parameterization of Clouds and Precipitation. Monthly Weather Rev. 132, 103–120. doi:10.1175/1520-0493(2004)132<0103:aratim>2.0.co;2
Janjić, Z. I. (2002). Nonsingular Implementation of the Mellor-Yamada Level 2.5 Scheme in the NCEP Meso Model. NCEP Off. note 437, 61.
Jiang, X., Li, Y., Zhao, X., and Koike, T. (2012). Characteristics of the Summertime Boundary Layer and Atmospheric Vertical Structure over the Sichuan basin. J. Meteorol. Soc. Jpn. 90, 33–54. doi:10.2151/jmsj.2012-C03
Kuo, Y.-H., Cheng, L., and Anthes, R. A. (1986). Mesoscale Analyses of the Sichuan Flood Catastrophe, 11–15 July 1981. Monthly Weather Rev. 114, 1984–2003. doi:10.1175/1520-0493(1986)114<1984:maotsf>2.0.co;2
Kuo, Y. H., Cheng, L., and Bao, J. W. (1988). Numerical Simulation of the 1981 Sichuan Flood. Part I: Evolution of a Mesoscale Southwest Vortex. Monthly Weather Rev. 116, 2481–2504. doi:10.1175/1520-0493(1988)116<2481:NSOTSF>2.0.CO;2
Li, L., Zhang, R., and Wen, M. (2017). Genesis of Southwest Vortices and its Relation to Tibetan Plateau Vortices. Q.J.R. Meteorol. Soc. 143, 2556–2566. doi:10.1002/qj.3106
Liu, W. G., Chen, H. S., and Yu, M. (2019). Impacts of Cumulus Convective Parameterization Schemes on Simulation of East Asian Summer Circulation and Rainfall. Chin. J. Atmos. Sci. 43 (1), 64–74. [in Chinese]. doi:10.3878/j.issn.1006-9895.1801.17222
Lu, J.-H. (1986). Introduction to the Southwest Vortex (In Chinese). Beijing: Meteorological Press, 276.
Mlawer, E. J., Taubman, S. J., Brown, P. D., Iacono, M. J., and Clough, S. A. (1997). Radiative Transfer for Inhomogeneous Atmospheres: RRTM, a Validated Correlated-K Model for the Longwave. J. Geophys. Res. 102, 16663–16682. doi:10.1029/97JD00237
Orlanski, I. (1975). A Rational Subdivision of Scales for Atmospheric Processes. Bull. Am. Meteorol. Soc. 56, 527–530. Available at: https://www.jstor.org/stable/26216020.
Pan, Y., Shen, Y., Yu, J. J., and Zhao, P. (2012). Analysis of the Combined Gauge-Satellite Hourly Precipitation over China Based on the OI Technique. Acta Meteorologica Sinica 70, 1381–1389. [in Chinese].
Qin, Z., and Zou, X. (2019). Impact of AMSU-A Data Assimilation over High Terrains on QPFs Downstream of the Tibetan Plateau. J. Meteorol. Soc. Jpn. 97, 1137–1154. doi:10.2151/jmsj.2019-064
Raymond, D. J., and Jiang, H. (1990). A Theory for Long-Lived Mesoscale Convective Systems. J. Atmos. Sci. 47, 3067–3077. doi:10.1175/1520-0469(1990)047<3067:atfllm>2.0.co;2
Shen, Y., Pan, Y., Yu, J. J., Zhao, P., and Zhou, Z. J. (2013). Quality Assessment of Hourly Merged Precipitation Product over China. Trans. Atmos. Sci. 36, 37–46. [in Chinese]. doi:10.13878/j.cnki.dqkxxb.2013.01.005
Skamarock, W. C., Klemp, J. B., Dudhia, J., Gill, D. O., Barker, D., Duda, M. G., and Powers, J. G. (2008). A Description of the Advanced Research WRF Version 3 (Note NCAR/TN-475+STR). University Corporation for Atmospheric Research 113. NCAR Tech. doi:10.5065/D68S4MVH
Takeuchi, W., Nemoto, T., Kaneko, T., and Yasuoka, Y. (2007). Development of MTSAT Data Processing, Visualization and Distribution System on WWW. J. Jpn. Soc. photogrammetry remote sensing 46, 42–48. doi:10.4287/jsprs.46.6_42
Wang, B. (1987). Study of a Heavy Rain Vortex Formed over the Eastern Flank of the Tibetan Plateau. Monthly weather Rev. 115, 1370–1393. doi:10.1175/1520-0493(1987)115<1370:soahrv>2.0.co;2
Wang, M., and Zhang, Y. (2011). Diagnostic Analysis on Continual Rainstorm from July 16 to July 18, 2010. Plateau Mountain Meteorology Res. 31, 43–48. [in Chinese].
Wang, W., Kuo, Y.-H., and Warner, T. T. (1993). A Diabatically Driven Mesoscale Vortex in the lee of the Tibetan Plateau. Monthly weather Rev. 121, 2542–2561. doi:10.1175/1520-0493(1993)121<2542:addmvi>2.0.co;2
Wang, Z. S., Wang, Y., and Liang, Y. (1996). “A Numerical Simulation Study of a Heavy Rain Event Induced by a Southwest Vortex,” in Experimental, Synoptical and Dynamical Studies of Heavy Rain (Beijing, China: China Meteorological Press), 257–267. [in Chinese].
Wu, G.-X., and Chen, S.-J. (1985). The Effect of Mechanical Forcing on the Formation of a Mesoscale Vortex. Q.J.R. Meteorol. Soc. 111, 1049–1070. doi:10.1002/qj.49711147009
Wu, Z. Z., Liu, H. W., and Pan, L. L. (2018). Analysis of a Binary Southwest Vortex and its Precipitation over the Sichuan basin on 4–5 August 2011. J. Chengdu Univ. Inf. Technol. 33, 681–687. doi:10.16836/j.cnki.jcuit.2018.06.014 [in Chinese]
Yanai, M., Esbensen, S., and Chu, J.-H. (1973). Determination of Bulk Properties of Tropical Cloud Clusters from Large-Scale Heat and Moisture Budgets. J. Atmos. Sci. 30, 611–627. doi:10.1175/1520-0469(1973)030<0611:dobpot>2.0.co;2
Ye, D. (1981). Some Characteristics of the Summer Circulation over the Qinghai-Xizang (Tibet) Plateau and its Neighborhood. Bull. Amer. Meteorol. Soc. 62, 14–19. doi:10.1175/1520-0477(1981)062<0014:scotsc>2.0.co;2
Ye, D., and Gao, Y.-X. (1979). The Meteorology of the Qinghai-Xizang (Tibet) Plateau. Beijing: Science Press, 278. [in Chinese].
Zhang, D.-L. (1992). The Formation of a Cooling-Induced Mesovortex in the Trailing Stratiform Region of a Midlatitude Squall Line. Monthly weather Rev. 120, 2763–2785. doi:10.1175/1520-0493(1992)120<2763:tfoaci>2.0.co;2
Keywords: southwest vortex, dual-core structure, numerical simulation, latent heat, topography
Citation: Wu Z, Liu H, Chan KTF, Wu K, Zhang W and Wang D (2022) Effects of Topography and Latent Heat on the Evolution of a Mesoscale Dual-Core Southwest Vortex Over Sichuan Basin, China. Front. Earth Sci. 10:827601. doi: 10.3389/feart.2022.827601
Received: 02 December 2021; Accepted: 21 January 2022;
Published: 04 March 2022.
Edited by:
Sanjeev Kumar Jha, Indian Institute of Science Education and Research, IndiaReviewed by:
Chenghai Wang, Lanzhou University, ChinaDevanil Choudhury, University of Bergen, Norway
Copyright © 2022 Wu, Liu, Chan, Wu, Zhang and Wang. This is an open-access article distributed under the terms of the Creative Commons Attribution License (CC BY). The use, distribution or reproduction in other forums is permitted, provided the original author(s) and the copyright owner(s) are credited and that the original publication in this journal is cited, in accordance with accepted academic practice. No use, distribution or reproduction is permitted which does not comply with these terms.
*Correspondence: Haiwen Liu, aHdsaXVAY2F1Yy5lZHUuY24=
 Zhenzhen Wu
 Haiwen Liu3*
 Kelvin T. F. Chan
 Kaijun Wu