- 1Operational Systems Development Department, National Institute of Meteorological Sciences/KMA, Jeju, South Korea
- 2Typhoon Research Center, Jeju National University, Jeju, South Korea
Sea surface height changes due to the tropical cyclone (TC)-induced water mixing in the Yellow Sea, Korea, were investigated using temperature and salinity profile data obtained by two Argo floats during the summer and fall of 2018 and 2020. Strong winds and low pressure, which are important characteristics of TCs, caused horizontal and vertical sea surface water movement and induced water mixing. This caused an increase in mixed layer depth, a decrease in water density, and an increase in specific volume. Specific volume changes related to the water steric effect were directly linked to sea surface height changes. During the TC Soulik (1819) period, the thermocline deepened by more than 10 m, and the steric sea level was increased by more than 3 cm. Other TC cases, such as Jebi (1821), Trami (1824), and Kong-Rey (1825), showed sea level increases of 1–2 cm. In 2020, 3 TCs–Bavi (2008), Maysak (2009), and Haishen (2010)—showed minor sea level increases (about 0.5–1 cm) because of weak mixing due to their high moving speeds or weak impacts. As a post-TC impact, the water mixing could cause a rise in sea levels due to the steric effect of seawater.
Introduction
Tropical cyclones (TCs) severely impact oceanic environments in terms of external and internal water bodies (Ginis, 2002; D'Asaro et al., 2011; Pun et al., 2011; Harris, 1963). When a TC moves over the sea, the sea level rises in the central area of the TC, and high waves form around the TC. The sea level rise is directly related to the convergence of wind-induced water transport and to the inverse barometric effect of low pressure, and high waves are related to wind stress on the sea surface. The TC, in turn, is affected by the oceanic environment due to air–sea interactions. Recent research suggests that warm eddies and high ocean heat content areas play an important role in TC intensity fluctuations (Lin et al., 2005; Lin et al., 2008; Lu et al., 2016). These external phenomena occur when a TC approaches and disappear soon after it moves away.
As an internal effect on the ocean, TCs induce vertical mixing of warmer upper waters with colder lower waters due to velocity shear and turbulent flow changes affecting the temperature and salinity profiles, which results in thermocline and halocline layer fluctuations (Mao et al., 2000; Baranowski et al., 2011; Vincent et al., 2012; Kang et al., 2020). Based on Argo float observations, Baranowski et al. (2011) found that water surface cooling was caused by increased entrainment induced by the thermocline due to turbulent mixing and that vertical mixing could result in salinity changes, which eventually led to a greater or fluctuating mixed layer depth. Vincent et al. (2012) used the wind power index to investigate the cooling processes caused by TCs with high energy transfer to the upper ocean and showed that the cooling process and temperature stratification steepness differed according to the wind’s power. Kang et al. (2020) also used daily Argo float observations in the Yellow Sea, Korea, and found that the temperature and salinity profiles during the passage of a typhoon exhibited a sudden deepening of the thermocline and halocline, which then moved 30–50 m up and down in the upper layer.
Many previous studies on the impact of TCs on oceans have focused on the mechanism by which oceans respond to TC conditions (Pei et al., 2015; Zhang et al., 2016; Pei et al., 2019). These studies have shown that most external events occur during the passage of TCs and quickly dissipate afterward. However, internal effects, such as subsurface heat anomalies caused by vertical water mixing, persist over considerably longer periods (Korty et al., 2008; Jansen et al., 2010). Pasquero and Emanuel (2008) studied the global effects of the interplay between TCs and upper ocean heat content and suggested that at least one-third of the heat anomaly could remain in a tropical region for more than 1 year. Mei et al. (2013) used satellite-derived sea surface height to quantify cyclone-induced ocean warming by directly monitoring the thermal expansion of water, and their results suggest that TC-induced mixing is closely related to sea surface height changes and that its effects could be associated with climatological variations.
Although sea surface height changes and TC-induced mixing could be related, direct observation-based work of this relationship is lacking. Therefore, this study aimed to investigate how much of sea surface height could be changed by TC-induced water mixing using Argo float–observed temperature and salinity profiles in the Yellow Sea. The main research question was to what extent height increased due to increased water volume directly related to TC-induced water mixing during the summer and fall of 2018 and 2020.
The data and methods used in this study are described in Data and Methods. The buoy data analysis, Argo float–measured temperature and salinity profile changes, and specific volume of water and steric sea level (SSL) changes are reported and discussed in Results and Discussion . Finally, Conclusions summarizes the results and presents the conclusions.
Data and Methods
The Korea Meteorological Administration (KMA) operates more than 20 ocean buoys around the Korean peninsula to detect and monitor extreme weather phenomena above oceans, since they can be run automatically even under the TC condition in the summer and fall. These buoys provide marine meteorological information, such as wind, sea-level pressure, air and water temperature, and waves, at 30-min or 1-h intervals (http://www.kma.go.kr). The buoy data used in this study were obtained from two stations: Chilbaldo buoy, which was established at 34.7933°N, 125.7769°E on 1 July 1997, and Seohae170 buoy, which was established at 36.1333°N, 124.0569°E on 5 November 2019 (Figure 1). These stations were selected because they were near Argo float profiling areas and TC tracks. Marine meteorological data (August 15−10 October 2018) from Chilbaldo buoy were mainly investigated for TC cases of 2018, such as Typhoons Soulik (1819), Jebi (1821), Trami (1824), and Kong-Rey (1825), whereas Seohae170 buoy data (August 21−14 September 2020) were used for TCs of 2020, such as Bavi (2008), Maysak (2009), and Haishen (2010). These TCs were selected because they directly or indirectly affected the Yellow Sea in the summer and fall of each year. TC track and intensity information was obtained from the Regional Specialized Meteorological Center, Tokyo (https://www.jma.go.jp).
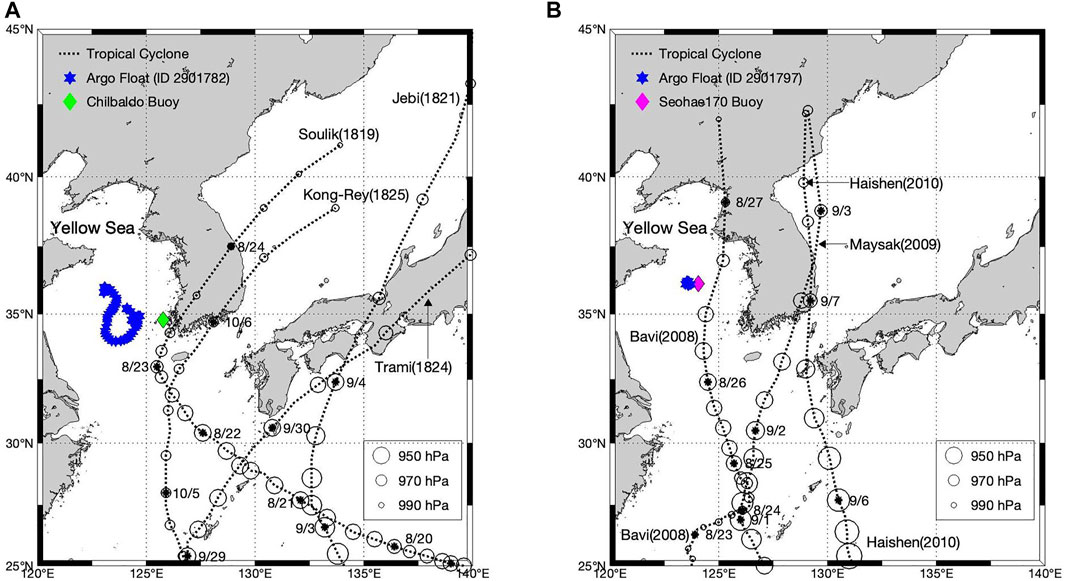
FIGURE 1. Location map of the ocean buoys, Argo float tracks, and tracks of each tropical cyclone around the Korean Peninsula in (A) August–October 2018, and (B) August–September 2020.
To investigate the internal ocean response during or after the passage of a TC, the water temperature and salinity profiles of the same area are needed. However, manual observations at sea are not possible under such weather conditions. To overcome this observation limitation, Argo floats have been used to determine the ocean temperature and salinity profiles from the surface to a depth of 2000 m in the open ocean in 10-days cycles as part of the integrated global ocean observation program (https://argo.ucsd.edu). The National Institute of Meteorological Sciences/KMA first deployed Argo floats in the Yellow Sea in 2017. Since the Yellow Sea is shallower, with a maximum depth of 80 m, and shows greater variation of the ocean characteristics than the open ocean, a different profiling scheme, including one- or 2-day profiling cycles, 1-m vertical resolution, 60-m parking-depth, and stronger buoyant force, was set up prior to deployment. Two Argo floats were deployed in 2018, and another two were deployed in 2020. In this study, data from one Argo float were used for each year. In Figure 1A, the blue stars show the track of Argo float 2901782 from August 15 to 14 October 2018, and in Figure 1B, the blue stars show the track of Argo float 2901797 from August 21 to 14 September 2020. During this period, interestingly this float was not moved a lot and it looked like staying at the same point.
Water temperature and salinity changes are directly related to the water density which also causes water volume change. In this study, the international equation of state for seawater, IES80 (UNESCO, 1981), was used to calculate the water density. Since the sea water volume change is inversely related to water density, seawater volume-induced SSL changes can be estimated as:
where
Results and Discussion
TC Cases and Ocean Status
Figure 1 shows the tracks of the 2018 and 2020 TCs directly or indirectly affecting the area around the Korean Peninsula during August, September, and October. In 2018, 4 TCs—Soulik (1819), Jebi (1821), Trami (1824), and Kong-Rey (1825)—affected the area around the peninsula (Figure 1A). Soulik (1819) and Kong-Rey (1825) had direct impacts, whereas Jebi (1821) and Trami (1824) had indirect impacts. In 2020, 3 TCs—Babi (2008), Maysak (2009), and Haishen (2010)—made landfall and directly impacted the study area from August 21 to September 14. As shown in Figure 1B, Babi (2008) almost passed over the buoy and Argo float 2901797 on 26 August 2020, with a central pressure of 970 hPa, while the other two were about 100 km away from the buoy and float when they approached the Korean Peninsula on September 2 and 6 September 2020, respectively. According to the KMA’s weather stations, the central pressure of both TCs was 955–960 hPa when it made landfall near Busan City, Korea.
Figure 2 shows the central pressure, wind speed, wave height, and water temperature changes recorded by Chilbaldo buoy from August to October 2018. The sea-level pressure data clearly showed signals from the 4 TCs. Since Soulik (1819) on August 23–24 and Kong-Rey (1825) on 6 October 2018 passed very near the buoy, the sea-level pressure was relatively low, the wind speed exceeded 17–19 m/s, the significant wave height was over 4 m, and the maximum wave height was 6 m. On the other hand, the wind speed in cases of TCs that did not pass near the buoy was 7–12 m/s. In the Trami (1824) case, the wind speed was about 10 m/s, and the maximum wave height was almost 6 m, possibly because of the longer duration of strong winds compared to other TCs, with a wind speed of 9–10 m/s maintained for more than 1 day. Therefore, strong winds and high waves under TC conditions, which cause strong mixing in the upper water layer, resulting in a sudden drop in water temperature, can be expected.
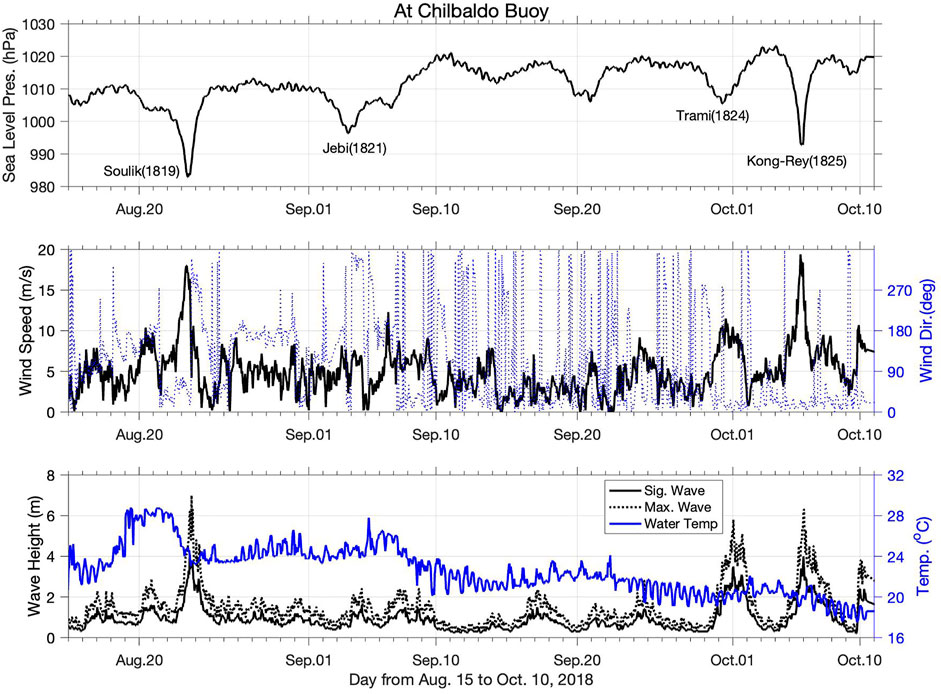
FIGURE 2. Time series of sea level pressure, wind speeds and direction, and wave height and water temperature obtained by the Chilbaldo buoy station from August 15 to October 10, 2018. Time is in UTC units.
The time series of water temperature shown in the bottom panel of Figure 2 reveals several phenomena. First, when TCs passed over this area, a sudden decrease in the sea surface temperature (SST) occurred. Especially on August 23–24, 2018, Soulik (1819) caused a water temperature reduction of almost 4 °C. The temperature then started to recover before Jebi (1821)’s approach. This process was repeated in every TC case. It can be concluded that the decrease in water temperature during the summer–fall season was accelerated by TC-induced water mixing. Moreover, there was also tidal variation such as semidiurnal and spring-neap variations, which may also have caused the expansion and contraction of the summer low SST area and temperature front formation along the southwestern coast of Korea (Lie, 1989; Cho et al., 1995; Kang and Lee, 2014).
Figure 3 shows the air–sea situation in the central area of the Yellow Sea in August and September 2020. As mentioned before, there were 3 TCs during this period. Babi (2008) passed over the buoy on 26 August 2020, and the recorded sea-level pressure was almost 970 hPa. The closest proximity of Maysak (2009) and Haishen (2010) to the float was about 100 km, and the sea-level pressure recorded at Seohae170 buoy was about 995 hPa for both TCs. The wind speed was about 25 m/s in the Bavi (2008) case and 12–13 m/s in the Maysak (2009) and Haishen (2010) cases, with a rotational direction. Regarding the duration of the wind’s impact on the ocean, the Bavi (2008) case was relatively shorter than the other cases. In terms of wave height, the maximum wave height in the Bavi (2008) case was about 9 m and the significant wave height was 7 m. This wave height could be developed by the sudden increase in wind speed. In other two cases, the maximum wave height was 4 m, and the significant wave height was 2 m.
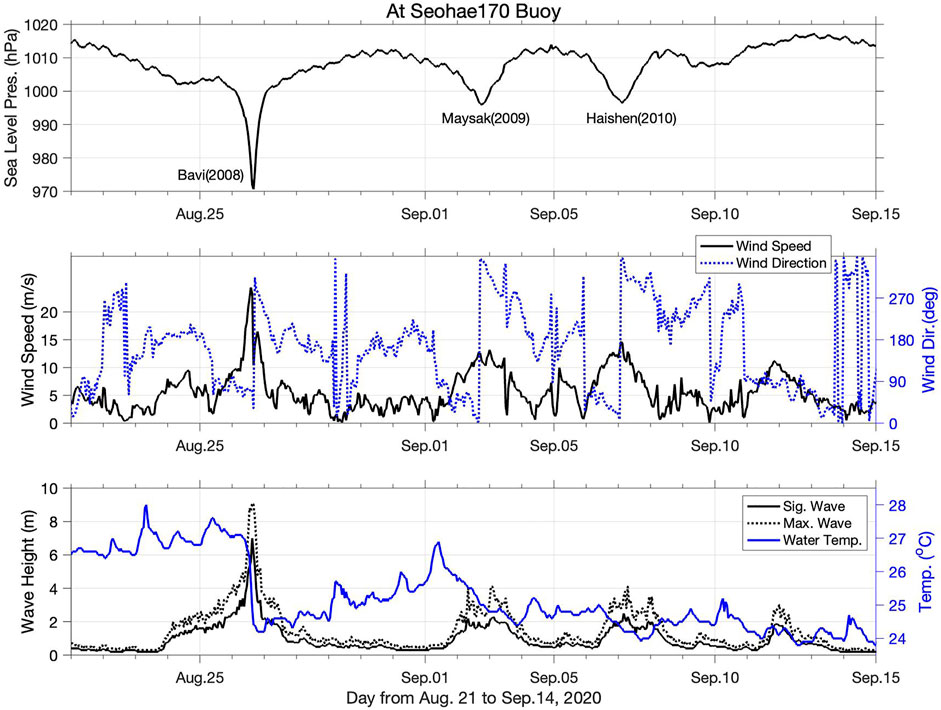
FIGURE 3. Time series of sea level pressure, wind speeds and direction, and wave height and water temperature obtained by the Seohae170 buoy station from August 21 to September 14, 2020. Time is in UTC units.
The water temperature showed a sudden drop during the passage of TCs, followed by a recovery process. On August 26, September 1, and 6 September 2020, the water temperature decreased by about 3, 2.5, and 1°C, respectively, and then recovered, with some fluctuations. The decrease on August 26 occurred rapidly in the space of a few hours, while that on September 1 was gradual, occurring over a period of almost 3 days, which means that the longer cooling could have a deeper impact on the ocean. In terms of total period, as in 2018, TC activity accelerated the water cooling process from summer to fall. Diurnal water temperature fluctuations were observed in the central Yellow Sea area, while semidiurnal fluctuations were observed in coastal areas (bottom panel of Figure 2). It may be speculated that the diurnal variation in water temperature is caused by tides. However, this topic is beyond the scope of this study.
Vertical Temperature and Salinity Changes
To see what is going on inside the ocean during the passage of a TC, water temperature and salinity profile data are needed. In reality, it is impossible for a ship to perform a CTD cast under such high-risk weather conditions. The deployment of unmanned floats, such as Argo floats, is a solution to this problem. Figure 4 shows the vertical distribution of water temperature and salinity profiled in 1-day cycles by Argo float 2901782 between August 15 and 14 October 2018. According to the Chilbaldo buoy data presented in section 3-1, sudden decreases in pressure was occurred when TCs were approaching. For example, August 23, September 3, September 30, and 6 October 2018 showed inverted peaks in sea-level pressure.
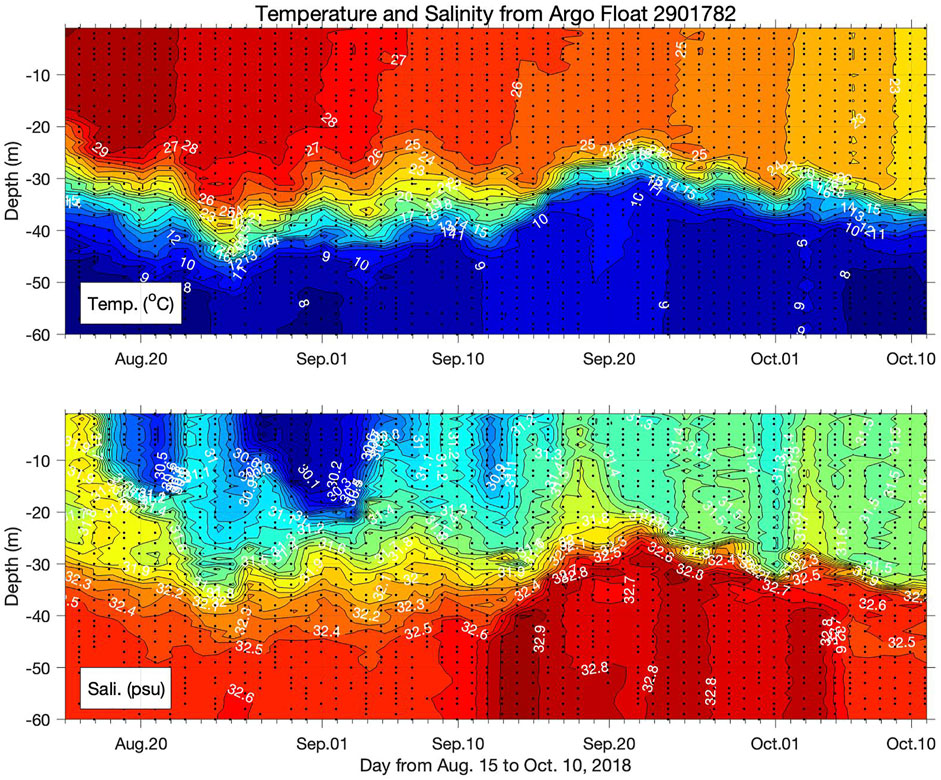
FIGURE 4. Vertical distribution of water temperature and salinity in the Yellow Sea obtained by Argo float 2901782 from August 15 to October 10, 2018. The black dots indicate the observation depths.
As shown in the water temperature profile in the top panel of Figure 4, the thermocline fluctuated between 25 and 45 m, and the upper layer temperature showed a homogeneous vertical distribution. When a TC passes over the sea, the upper layer can be mixed by the strong winds and high waves, resulting in a homogeneous distribution. In this case, however, the upper layer was already mixed, so it is difficult to find evidence of TC-induced mixing. Nevertheless, the vertical changes in the thermocline could provide such evidence. For example, on August 23, the thermocline started to deepen, reached its maximum depth on August 26, and began to recover until August 27. At this stage, the thermocline moved from 30 m to almost 45 m, and the water temperature change at a depth of 40 m was over 8°C when water mixing was at its peak. Even the water temperature change rate differed due to the external TC conditions. The same process was observed on September 3–5, September 28–October 2, and October 5–6. It is worth noting that the deepening of the thermocline started when a TC was approaching and peaked one or 2 days after the TC had passed. In the Trami (1824) case, it started on September 28, peaked on October 1, and recovered 1 day later.
The salinity distribution showed clearer evidence of TC-induced vertical mixing, even in the upper layer. As shown in the bottom panel of Figure 4, the halocline was at a depth of 25–40 m and exhibited a barrier of low salinity in the upper layer and a barrier of high salinity in the deeper layer. The difference between two layers was about 2 psu. Like the thermocline, this layer exhibited depth fluctuations on August 23–27, September 3–5, and September 28–2 October 2018. The profile change showed homogenizing salinity in the vertical direction in the upper layer during the TC impact period around August 24, September 5, September 29–30, and 6 October 2018. This finding suggests that the water temperature and salinity profiles were affected by the TCs and persisted for several days afterward. Moreover, it can be expected that the water volume may be changed by the steric effect.
Let us consider another TC impact case in the Yellow Sea in 2020. Figure 5 shows the 2-day cycle of Argo float 2901797, which was deployed in the study area on 11 November 2019, and remained for one and a half years. Between August 21 and 14 September 2020, this float remained in an almost fixed area, so the profile data could represent the water temperature and salinity in the central area of the Yellow Sea. However, since the observation interval was 2 days, the float had certain limitations in recording detailed profile changes in terms of the ocean’s response to TCs. Especially in cases of fast-moving TCs, it is difficult to determine the exact ocean response during TC impact periods. TC Bavi (2008) passed near the Argo float with strong winds and low sea-level pressure on 26 August 2020, however the moving speed of every 6 hours was 25.9, 38.9, 38.9, and 53.8 km/h from 06:00 UTC on August 26 to 00:00 UTC on August 27. The moving speeds of Maysak (2009) and Haishen (2010) were 35.5–58.3 km/h and 44.5–51.9 km/h when they were approaching the Korean Peninsula. This means that none of these TCs had enough time to seriously impact the sea.
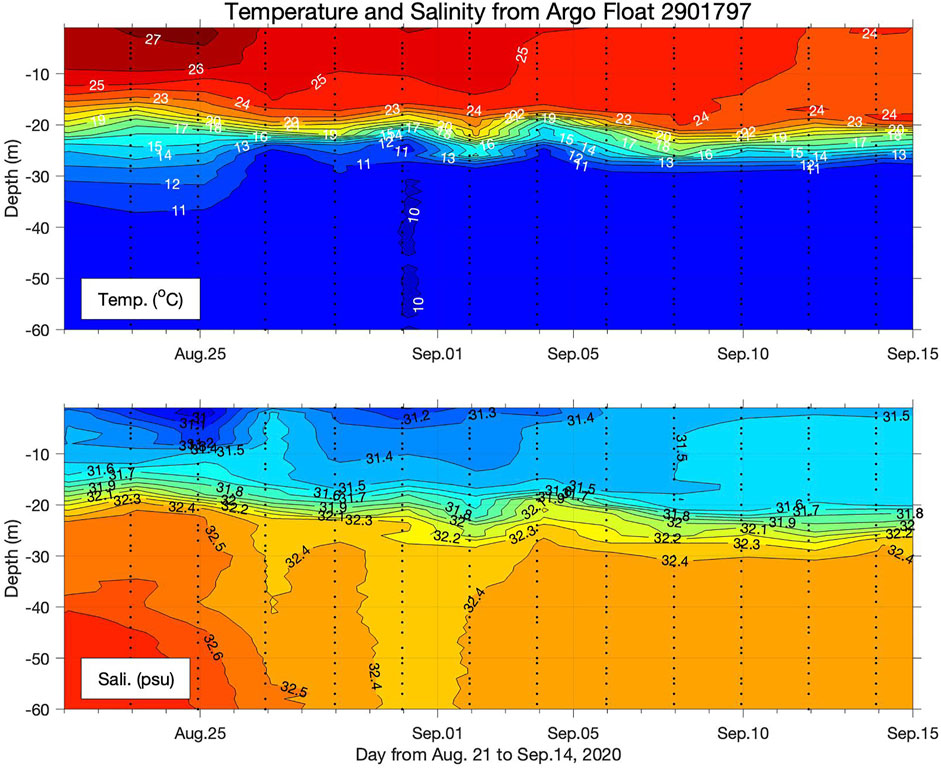
FIGURE 5. Vertical distribution of water temperature and salinity in the Yellow Sea obtained by Argo float 2901797 from August 21 to September 14, 2020. The black dots indicate the observation depths.
As shown in the top panel of Figure 5, the surface temperature decreased from 27 to 25°C on August 25–26, 2020, and the thermocline was at a depth of 20–30 m. However, as there are no profile data for August 26, it is difficult to know the situation when the TC was passing over the float. On September 1–2 and 7–8, the upper layer water temperature was almost homogeneous. However, the temperature at a depth of 20–30 m slightly increased due to the impact of the TC. The salinity profile in the bottom panel of Figure 5 shows evidence of upper layer mixing above a depth of 20 m, which resulted in a vertical homogenization process—for example, on August 27, September 2, and 8 September 2020. In summary, although the impacts of TCs moving fast over the sea were not severe, these results provide evidence of vertical mixing, such as thermocline and halocline fluctuations and homogenizing processes in the upper layer.
Seawater Volume and Steric Sea Level
The previous Vertical Temperature and Salinity Changes dealt with water temperature and salinity distribution changes caused by TCs during the summer and fall of 2018 and 2020. Based on the temperature and salinity profiles obtained by two Argo floats, the specific volume of water was integrated from the surface and a depth of 60 m using Eq. 1. There are two reasons that we choose 60 m as the bottom. First, most profiles covered from the surface to this depth in common since the parking depth of float was 60 m, and second is that the water depth was deep enough to show almost constant temperature and salinity. And Figures 6, 7 show the specific volume distribution and SSL of each profile in 2018 and 2020. The SSL values during the study period were calculated as the heights relative to the values obtained from specific dates. The reference date was selected just to see the relative sea level changes before and after the TC events during the study period. So it was chosen under this rule arbitrarily to compare the first TC event of each period, i.e. on 31 July 2018 and 19 August 2020.
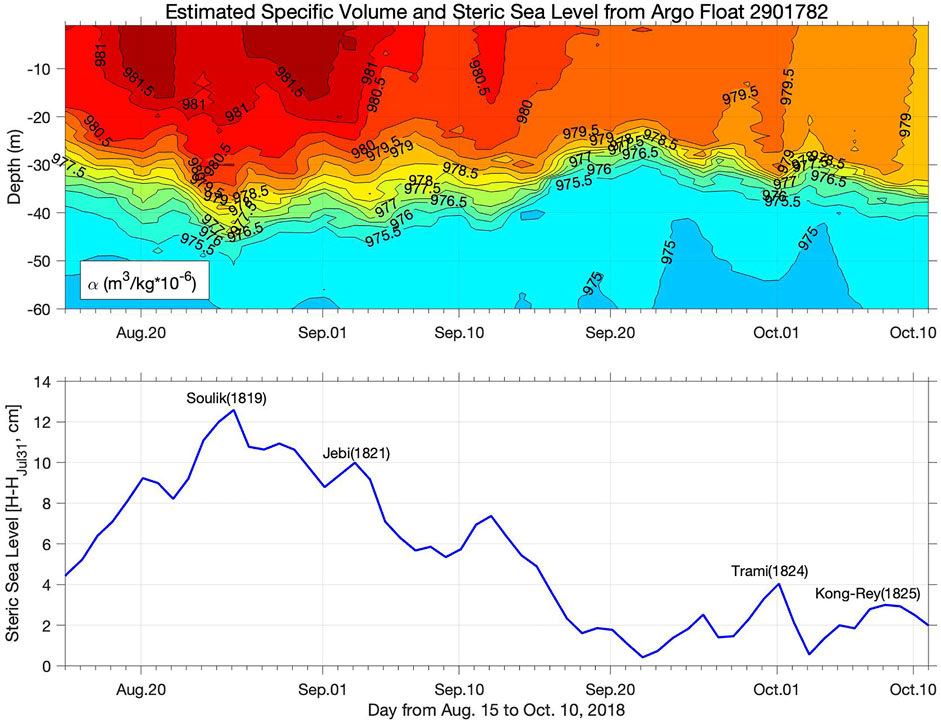
FIGURE 6. Calculated specific volume of sea water and the steric sea level change from August 15 to October 10, 2018. The steric sea level was calculated as the height relative to the value of 31 July 2018.
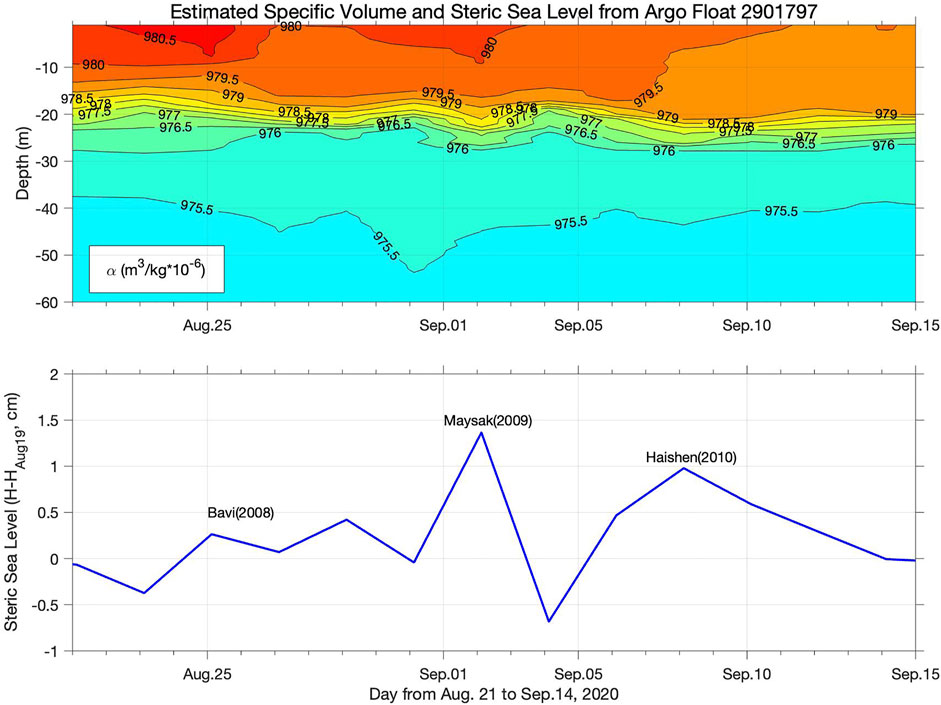
FIGURE 7. Calculated specific volume of sea water and the steric sea level change from August 21 to September 14, 2020. The steric sea level was calculated as the height relative to the value of 19 August 2020.
An examination of the specific volume distribution between August 15 and 14 October 2018 (top panel of Figure 6) shows that two layers were separated from the thermocline, with a high value in the upper layer (0.9780–0.9815 × 10⁻³ m3/kg) and a low value in the lower layer (0.9755–0.9760 × 10⁻³ m3/kg). As shown in the temperature profile in Figure 4, the barrier layer depth fluctuated with a linearly deepening trend from summer to fall. When the TC-influenced mixed layer depth started to be deepened, as on August 23, September 2, September 28, and 5 October 2018, the high-volume layer thickened and was directly linked to the increase in sea surface height. The bottom panel of Figure 6 shows a sudden rise in sea surface as the TC passed over the sea. Assuming that the water temperature and salinity changes during the TC impact period mainly depended on TC-induced mixing, the SSL increased by more than 3 cm between August 23 and 26, 2018. September 3, October 1, and October 8 also showed peak SSL values, with increases of about 1–2 cm. A comparison between TC Soulik (1819) and Kong-Rey (1825) shows that although their wind speeds and wave heights recorded at the same buoy were similar, the SSL change differed. This might be because the warm layer depth increase in the water column was considerably larger in the Soulik (1819) case. In addition, it should be noted that salinity could play a big role in the SSL changes. For example, on Sept. 12, 2018, there were no high waves, TC or strong wind, the SSL showed a peak value. Even this is out of our scope, it could be another topic for the future study.
Figure 7 shows the specific volume distribution and SSL variation in the central area of the Yellow Sea between August 21 and 14 September 2020. There were also two layers separated at a depth of 20 m, and the specific volume in the barrier layer was about 0.9770–0.9780 × 10⁻³ m3/kg. The depth of the barrier layer was increased under the TC’s influence and decreased after the TC impact period. This process was evident, for example, on September 2 and 8 September 2020. The SSL (bottom panel of Figure 7) peaked during the TC impact period, and the sea level rose by about 0.5–1 cm. In the Bavi (2008) case, since it moved very fast over the Argo float area (at over 50 km/h) and there was no float data on September 26, the SSL did not show a peak value on August 25–27, 2020. Considering the analysis results of specific volume changes in 2018 and 2020, it may be concluded that sea surface height changes depend on TCs’ intensity and the length of time during which they remain over the sea, as well as water characteristics such as stratification.
Conclusion
It is well known that the ocean is affected by interannual and decadal climate variabilities such as El Niño-Southern Oscillation and Pacific Decadal Oscillation ENSO (Varotsos, 2013; Varotsos et al., 2014; Varotsos et al., 2016), as well as short-time scale fluctuations due to air-ocean interactions during the passage of TCs. It is well known that the ocean is greatly impacted by TCs due to air–sea interactions during their passage. In this study, we investigated sea surface height changes due to TC-induced water mixing phenomena in the Yellow Sea using temperature and salinity profile data from August 15 to 14 October 2018 (Argo float 2901782) and from August 21 to 14 September 2020 (Argo float 2901797). We also used data from the Chilbaldo and Seohae170 buoy stations to investigate phenomena at the air–sea boundary layer, such as sea-level pressure, wind, waves, and water surface temperature.
During the study period, a total of 7 TCs directly or indirectly influenced the study area: four in August–October 2018, and three in August–September 2020. We can directly recognize TCs approaching and moving away in the sea-level pressure, wind, wave, and water temperature data obtained by the buoys. TCs Soulik (1819) on August 23–24 and Kong-Rey (1825) on 6 October 2018 passed near the buoy. Compared to the other 2 TCs, which passed far from the observation point, these TCs were associated with a greater decrease in sea-level pressure, stronger winds (17–19 m/s), and higher waves (6–7 m). However, the water temperature decrease associated with these TCs depended on their intensity and impact period and on the vertical water temperature distribution. The 2020 TC cases showed similar characteristics. Bavi (2008) passed very near the observation location, showing a rapid and sharp drop in sea-level pressure, a maximum wind speed of 25 m/s, and a water surface temperature drop of over 3°C. Here we also found that the surface water was cooled a lot, however total volume of water column was a bit increased after the TC passed. To summarize the TC impact on water temperature variation obtained from buoy observations in the central and coastal areas of the Yellow Sea, TC activity played a role in accelerating the water cooling process during the summer–fall season.
Even though the Argo float–obtained water temperature and salinity profiles could not capture the exact sudden drop of temperature like the buoy record due to one or two day-cycle observation, they could reflected the internal differences in seawater properties before and after the passage of TCs (Figures 4, 5). Under TC influence, the thermocline and halocline deepened due to vertical water mixing, especially in the boundary layer between the upper and lower layers. For example, on August 23–26, 2018, the thermocline moved from 30 to 45 m in depth, and the water temperature difference before and after water mixing was over 8°C at a depth of 40 m. Although the variation in temperature and salinity depended on external, TC-related conditions, such as wind speed, central pressure, and moving speed, thermocline and halocline deepening and shallowing processes were observed in this area during TC impact periods, such as September 3–5, September 28–October 2, and October 5–6, 2018, and September 1–2 and 7–8, 2020. Notably, the thermocline started to deepen when a TC was approaching, reached its maximum depth within one or 2 days, and returned to its previous position after the TC had passed.
The specific volume of water and SSL were calculated to investigate sea surface height changes due to TC-induced water mixing (Figures 6, 7). There were two layers, one with a high specific volume and one with a low specific volume, from August 15 to 14 October 2018. The layer with a high specific volume thickened as the TC impact started and was directly linked to the sea surface height increase. The SSL increased by more than 3 cm between August 23 and 26, 2018, and by about 1–2 cm on September 3, October 1, and 8 October 2018. In the period August 21–14 September 2020, the basic specific volume distribution pattern was similar to that of 2018, showing two layers separated at a depth of 20 m, and the SSL increased by about 0.5–1 cm during the TC impact period. To summarize the analysis result of the specific volume and SSL changes, it can be said that sea surface height change eventually depends on the TC-induced water mixing and volume change resulting from the effect of temperature and salinity variations.
Finally, while most studies on TC–ocean interactions have focused on the ocean’s response to TC conditions, this study focused on post-TC processes. Thus, the results provide valuable insights into changes in oceanic environments after TCs.
Data Availability Statement
The data that support the findings of this study are available on request from the corresponding authors.
Author Contributions
Conceptualization, methodology, resources, calculation, writing and editing, KK; formal analysis, validation and review, IM. All authors have read and agreed to the published version of the manuscript.
Funding
This research was funded by the National Institute of Meteorological Sciences of the Korea Meteorological Administration project titled “Development of Marine Meteorology Monitoring and next-generation Ocean Forecasting System (KMA 2018-00420)”.
Conflict of Interest
The authors declare that the research was conducted in the absence of any commercial or financial relationships that could be construed as a potential conflict of interest.
Publisher’s Note
All claims expressed in this article are solely those of the authors and do not necessarily represent those of their affiliated organizations, or those of the publisher, the editors, and the reviewers. Any product that may be evaluated in this article, or claim that may be made by its manufacturer, is not guaranteed or endorsed by the publisher.
Acknowledgments
The authors would like to thank reviewers for their constructive comments to make the high quality research.
References
Baranowski, D. B., Flatau, P. J., and Malinowski, S. P. (2011). Tropical Cyclone Turbulent Mixing as Observed by Autonomous Oceanic Profilers with the High Repetition Rate. J. Phys. Conf. Ser. 318 (section 7), 072001. doi:10.1088/1742-6596/318/7/072001
Cho, Y. K., Choi, B. H., and Chung, H. W. (1995). Variation of Tidal Front in the Southwestern Sea of Korea. JJ. Korean Soc. of Coast Ocean Eng. 7, 170–175. (in Korean with English abstract).
D'Asaro, E., Black, P., Centurioni, L., Harr, P., Jayne, S., Lin, I. I., et al. (2011). Typhoon-ocean Interaction in the Western North Pacific: Part 1. Oceanog. 24 (4), 24–31. doi:10.5670/oceanog.2011.91
Ginis, I. (2002). “Atmosphere-Ocean Interaction,” in Advances in Fluid Mechanics Series (Southampton: WIT Press), 83–114. No. 33.
Harris, D. L. (1963). Characteristics of the Hurricane Storm Surge. Washington, D.C.: U.S. Dept. of Commerce, Weather Bureau, 1–39. Technical Paper, No. 48.
Jansen, M. F., Ferrari, R., and Mooring, T. A. (2010). Seasonal versus Permanent Thermocline Warming by Tropical Cyclones. Geophys. Res. Lett. 37 (3), a–n. doi:10.1029/2009GL041808
Kang, K., Jo, H. J., and Kim, Y. (2020). Ocean Responses to Typhoon Soulik (1819) Around Korea. Ocean Sci. J. 55, 445–457. doi:10.1007/s12601-020-0030-x
Kang, K., and Lee, S.-R. (2014). Variation of the Summer Low SST Area in the Southwestern Coast of Korea. Geosci. J. 18 (2), 231–239. doi:10.1007/s12303-013-0055-6
Korty, R. L., Emanuel, K. A., and Scott, J. R. (2008). Tropical Cyclone-Induced Upper-Ocean Mixing and Climate: Application to Equable Climates. J. Clim. 21 (4), 638–654. doi:10.1175/2007jcli1659.1
Lie, H.-J. (1989). Tidal Fronts in the southeastern Hwanghae (Yellow Sea). Continental Shelf Res. 9, 527–546. doi:10.1016/0278-4343(89)90019-8
Lin, I.-I., Wu, C.-C., Emanuel, K. A., Lee, I.-H., Wu, C.-R., and Pun, I.-F. (2005). The Interaction of Supertyphoon Maemi (2003) with a Warm Ocean Eddy. Monthly Weather Rev. 133, 2635–2649. doi:10.1175/mwr3005.1
Lin, I.-I., Wu, C.-C., Pun, I.-F., and Ko, D.-S. (2008). Upper-Ocean Thermal Structure and the Western North Pacific Category 5 Typhoons. Part I: Ocean Features and the Category 5 Typhoons' Intensification. Monthly Weather Rev. 136, 3288–3306. doi:10.1175/2008mwr2277.1
Lu, Z., Wang, G., and Shang, X. (2016). Response of a Preexisting Cyclonic Ocean Eddy to a Typhoon. J. Phys. Oceanogr. 46, 2403–2410. doi:10.1175/JPO-D-16-0040.1
Mao, Q., Chang, S. W., and Pfeffer, R. L. (2000). Influence of Large-Scale Initial Oceanic Mixed Layer Depth on Tropical Cyclones*. Mon. Wea. Rev. 128, 4058–4070. doi:10.1175/1520-0493(2000)129<4058:iolsio>2.0.co;2
Mei, W., Primeau, F., McWilliams, J. C., and Pasquero, C. (2013). Sea Surface Height Evidence for Long-Term Warming Effects of Tropical Cyclones on the Ocean. Proc. Natl. Acad. Sci. 110 (38), 15207–15210. Available from: www.pnas.org/cgi/doi/10.1073/pnas.1306753110. doi:10.1073/pnas.1306753110
Pasquero, C., and Emanuel, K. (2008). Tropical Cyclones and Transient Upper-Ocean Warming. J. Clim. 21 (1), 149–162. doi:10.1175/2007jcli1550.1
Pei, Y., Zhang, R., and Chen, D. (2015). Upper Ocean Response to Tropical Cyclone Wind Forcing: A Case Study of Typhoon Rammasun (2008). Sci. China Earth Sci. 58, 1623–1632. doi:10.1007/s11430-015-5127-1
Pei, Y., Zhang, R.-H., and Chen, D. (2019). Roles of Different Physical Processes in Upper Ocean Responses to Typhoon Rammasun (2008)-induced Wind Forcing. Sci. China Earth Sci. 62, 684–692. doi:10.1007/s11430-018-9313-8
Pun, I., Chang, Y.-T., Lin, I. I., Tang, T. Y., and Lien, R.-C. (2011). Typhoon-ocean Interaction in the Western North Pacific: Part 2. Oceanog. 24 (4), 32–41. doi:10.5670/oceanog.2011.92
Unesco, (1981). Tenth Report of the Joint Panel on Oceanographic Tables and Standards. UNESCO Tech. Paper Mar. Sci. 36, 25.
Varotsos, C. A., Franzke, C. L. E., Efstathiou, M. N., and Degermendzhi, A. G. (2014). Evidence for Two Abrupt Warming Events of SST in the Last century. Theor. Appl. Climatol. 116, 51–60. doi:10.1007/s00704-013-0935-8
Varotsos, C. A. (2013). The Global Signature of the ENSO and SST-like fields. Theor. Appl. Climatol. 113, 197–204. doi:10.1007/s00704-012-0773-0
Varotsos, C. A., Tzanis, C. G., and Sarlis, N. V. (2016). On the Progress of the 2015-2016 El Niño Event. Atmos. Chem. Phys. 16, 2007–2011. doi:10.5194/acp-16-2007-2016
Vincent, E. M., Lengaigne, M., Madec, G., Vialard, J., Samson, G., Jourdain, N. C., et al. (2012). Processes Setting the Characteristics of Sea Surface Cooling Induced by Tropical Cyclones. J. Geophys. Res. 117, a–n. doi:10.1029/2011JC007396
Keywords: tropical cyclone, Yellow Sea, Argo floats, water mixing, specific volume change, steric sea level
Citation: Kang K and Moon I-J (2022) Sea Surface Height Changes due to the Tropical Cyclone-Induced Water Mixing in the Yellow Sea, Korea. Front. Earth Sci. 10:826582. doi: 10.3389/feart.2022.826582
Received: 01 December 2021; Accepted: 01 March 2022;
Published: 07 April 2022.
Edited by:
Hui Yu, China Meteorological Administration, ChinaReviewed by:
Ricardo de Camargo, University of São Paulo, BrazilCostas A Varotsos, National and Kapodistrian University of Athens, Greece
Copyright © 2022 Kang and Moon. This is an open-access article distributed under the terms of the Creative Commons Attribution License (CC BY). The use, distribution or reproduction in other forums is permitted, provided the original author(s) and the copyright owner(s) are credited and that the original publication in this journal is cited, in accordance with accepted academic practice. No use, distribution or reproduction is permitted which does not comply with these terms.
*Correspondence: KiRyong Kang, a3JrYW5nQGtvcmVhLmty; Il-Ju Moon, aWptb29uQGplanVudS5hYy5rcg==
 KiRyong Kang
 Il-Ju Moon2*