 Liang Yu1,2
 Maodu Yan1*
 Chong Guan3
 Bingshuai Li4
 Qiang Fu1,2
 Wanlong Xu1,2
 Zhantao Feng5
 Dawen Zhang6
 Miaomiao Shen1
 Zunbo Xu1,2
 Zhichao Niu1,2
- 1State Key Laboratory of Tibetan Plateau Earth System, Resources and Environment (TPESRE), Institute of Tibetan Plateau Research, Chinese Academy of Sciences, Beijing, China
- 2University of Chinese Academy of Sciences, Beijing, China
- 3Xi’an Center of Geological Survey (Northwest China Center of Geoscience Innovation), China Geological Survey, Xi’an, China
- 4School of Earth Sciences, East China University of Technology, Nanchang, China
- 5MOE Key Laboratory of Western China’s Environmental Systems and College of Earth and Environmental Sciences, Lanzhou University, Lanzhou, China
- 6College of Tourism and Environmental Resource, Zaozhuang University, Zaozhuang, China
Robust paleomagnetic results through geological time are one of the keys to understand the drift history of the eastern Qiangtang terrane (EQT). Here, we presented comprehensive petrographic observations and rock magnetic and paleomagnetic analyses of the early Carboniferous Upper Zaduo (ZD) limestone Formation (C1z2) from the Sulucun (SLC) section in the Zaduo area, EQT, to investigate its magnetic originality and geological significance. A total of 12 sites (131 samples) were collected. Photomicrograph observations indicate that the limestone samples were characterized by widespread carbonate veinlets. Electron microprobe and energy dispersive spectrometry analyses confirm that authigenic magnetite formed after pyrite. Rock magnetic analyses reveal the dominant magnetic minerals of pyrite and magnetite, with ‘wasp-waisted’ hysteresis loops and close to the “remagnetization trend” hysteresis parameters. Based on both thermal and alternating field demagnetizations, the characteristic remanent magnetization directions for most samples were isolated: Dg = 6.3°, Ig = 50.1°, kg = 54.9, α95 = 6.2° in-situ, and Ds = 330.2°, Is = 58.9°, ks = 5.9, and α95 = 20.5° after 2-step tilt correction. The κ (α95) value decreases (increases) after tilt-correction, and the ChRM directions failed both the McFadden (1990), Watson and Enkin (1993) fold tests, indicating post-folding magnetizations. The 11 site-mean directions yield a mean in-situ paleopole of 84.4°N, 200.3°E, and A95 = 6.8°, which is coincident with the post ∼53 Myr (especially around 40 Ma) paleopoles of the region. We therefore interpreted that these early Carboniferous limestone samples contain remagnetized magnetizations and that they were obtained after 53 Ma, most likely around 40 Ma, due to the far-field effect of the India–Eurasia collision.
Introduction
The Tibetan Plateau is composed of a series of continental terranes, such as from north to south, the Songpan-Ganzi terrane, the Qiangtang terrane (QT), the Lhasa terrane, and the Himalaya terrane (Figure 1A). These terranes drifted northward, and subsequent assemblages to Eurasia since the Late Paleozoic (Dewey et al., 1988; Yin and Harrison, 2000; Tapponnier et al., 2001; Metcalfe, 2013; Zhang et al., 2013; Zhu et al., 2013; Yan et al., 2016; Huang et al., 2018; Zhao et al., 2018; Song et al., 2020), which was accompanied by opening and closure of the Paleo-, Meso-, and Neo-Tethys oceans, have resulted in the formation and subsequent deformation of abundant marine carbonates preserved around the Tibetan Plateau (e.g., Yan et al., 2016; Guan et al., 2021). The QT, one of the major terranes in the central Tibetan Plateau (Figure 1A), is further divided into the eastern Qiangtang and western Qiangtang (alternatively called the “North Qiangtang terrane” and “southern Qiangtang terrane” in the literature, respectively) terrane by the so-called Longmo Co-Shuanghu suture zone (Figure 1A) (e.g., BGMRXAR, 1993; Yin and Harrison, 2000; Pan et al., 2004; Li et al., 2009; Zhu et al., 2013). Given that the EQT is immediately south of the Jinshajiang suture zone (Figure 1A), its drift history is important to understand the evolution and closure of the Paleo-Tethys Jinshajiang Ocean (Guan et al., 2021; Yu et al., 2022), as well as the tectonic history of the “Proto-Tibet”.
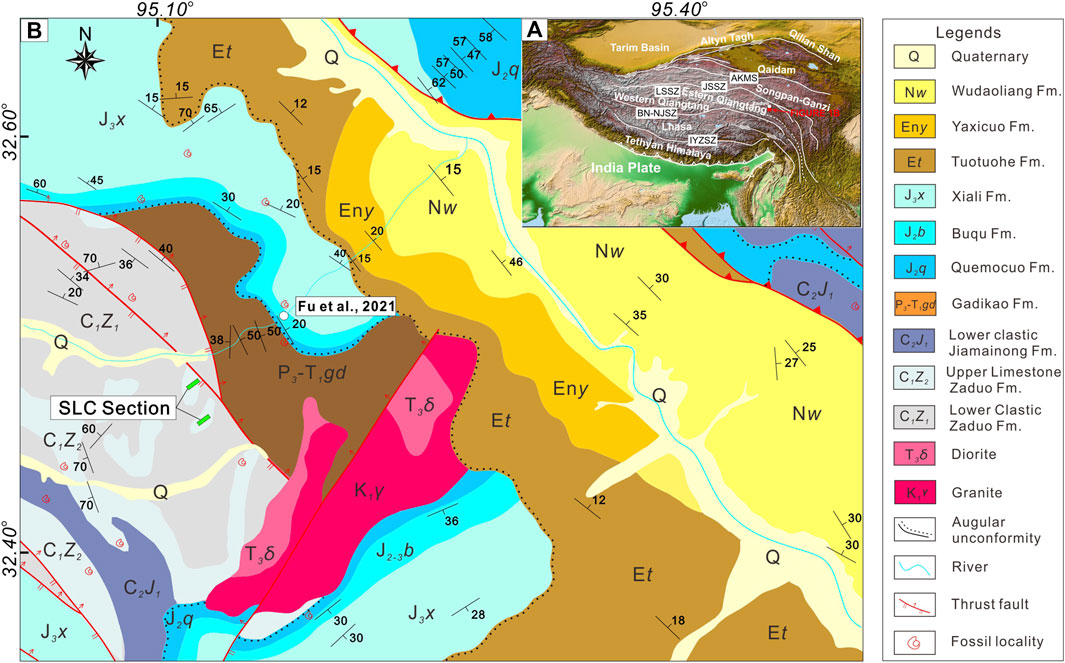
FIGURE 1. (A) Simplified tectonic map of the Tibetan Plateau and its adjacent regions, showing the location of Zaduo (B) Detailed geologic map of the Zaduo area showing the location of the sampled Sulucun section in the green square (modified from the 1:250,000 Zaduo County regional geological map (I46C004004) by the Qinghai Geological Survey Institute (QGSI), 2005b). Abbreviations in (A): AKMS, Ayimaqing–Kunlun–Muztagh suture zone; BG-NJSZ, Bangong–Nujiang suture zone; IYZSZ, Indus–Yarlung Zangbo suture zone; JSSZ, Jinshajiang suture zone; LSSZ, Longmu Tso–Shuanghu suture zone. The circles in (B) represent the previous remagnetization study from Fu et al. (2021).
However, the Paleozoic affiliation and drift history of the EQT are still poorly constrained. For example, the presence of Carboniferous cool-water biotic assemblages and Carboniferous/Permian moraines of the Gondwana affinity suggests that the EQT was part of Gondwana during the period (Metcalfe, 2006; Metcalfe, 2013; Kent and Muttoni, 2020), while the presence of the Cathaysian fossils in the Permian limestone implies that the EQT had Cathaysian affinity and was away from Gondwana during the Carboniferous–Early Permian period (Liu and Sun, 2008; Zhang et al., 2013). In addition, some studies argued that the EQT originated from Laurasia, based on different geological and geophysical characteristics on both sides of the Bangong–Nujiang suture zone (Pan et al., 2004, 2012).
The large-scale latitudinal motions of terranes have made paleomagnetism one of the most important methods to decipher the opening and closure processes of the Tethys Ocean. The widely distributed limestone on the EQT has been one of the main targets for paleomagnetic studies to constrain its drift history. Many paleomagnetic studies have been carried out on limestone of the EQT, including rocks of the late Paleozoic (Cheng et al., 2012, Cheng et al., 2013; Yang et al., 2017) and the Mesozoic (Lin and Watts, 1988; Cheng et al., 2012; Ren et al., 2013; Yan et al., 2016; Ran et al., 2017; Cao et al., 2019; Zhou et al., 2019; Fu et al., 2021, 2022). Nevertheless, due to the complexity of limestone, some discordant results existed. For example, Cheng et al. (2012), Ren et al. (2013), and Yan et al. (2016) suggested primary magnetizations that yield similar paleomagnetic directions (paleolatitudes of ∼20–25°N) for the Middle-Upper Jurassic Yanshiping Group from the Yanshiping area, while Ran et al. (2017) argued for remagnetization directions; Cao et al. (2019) reported primary Middle Jurassic magnetizations of a different direction (paleolatitude of ∼35°N) from Shuanghu, whereas Fu et al. (2021) reported an Eocene remagnetization direction of the Middle-Upper Jurassic limestone from the Zaduo area. It is obvious that remagnetizations are common in the EQT that might have hindered our understanding on the drift history of the EQT and hence the evolution of the Paleo-Tethys Jinshajiang Ocean. Therefore, with more and more reported remagnetization results in the Qiangtang region, detailed analysis on the possibility of remagnetization is extremely important, especially for limestone.
In this study, we reported a detailed paleomagnetic study on the early Carboniferous limestone of the EQT, trying to provide a reliable Carboniferous paleomagnetic result. Unfortunately, based on detailed petrographic observations, rock magnetic experiments, and demagnetization analyses, this early Carboniferous limestone seems to have been remagnetized. We then discussed the possible acquisition mechanisms of remagnetization and its geological implication.
Geological Setting and Sampling
The EQT in the central Tibetan Plateau is separated from the Songpan-Ganzi terrane by the Jinshajiang suture zone to the north and from the western Qiangtang terrane by the Longmo Co-Shuanghu suture zone to the south. (Figure 1A) (e.g., BGMRXAR, 1993; Yin and Harrison, 2000; Zhu et al., 2013). Our study section is located ∼30 km south of Zaduo in the EQT (Figure 1A). In this area, the lithologic units mainly comprise the Lower Carboniferous Zaduo Group (limestone), the Upper Carboniferous Jiamainong Group (clastic rocks), the Triassic–Permian Gadikao Formation (tuff, rhyolite dacite, limestone, and siltstone), and the Middle-Upper Jurassic Yanshiping Group (cycles of clastic rock and limestone), above which overlie some Cenozoic deposits (QGSI, 2005a) (Figure 1B). The Zaduo Group can be further divided into two formations: the Lower Clastic and the Upper limestone ZD formations, with a conformable contact relationship (QGSI, 2014). Abundant fossils, including brachiopods (e.g., Gigantoproductus cf. giganteus (Sowerby)-Striatifera and Gigantoproductus edelburgensis-Sermiplanus Latssimlls), corals (Lithotrotion irregulare-Yuanophyllum sp., Yuanophyllum-Hxaphyllum, Lithotrotion irregulare Phillps, and Yuanophyllum sp.), and trilobites (Cummingella sp.), have been observed within the Zaduo Group, yielding the early Carboniferous (Tournaisian–Visean) age (QGSI, 2014). The Upper limestone ZD Formation is well exposed in the Zaduo area and extends more than 2,300 km2 laterally, with a thickness up to 1,000 m. It formed in a shallow sea reef platform environment and mainly consists of bioclastic dolomitic limestone, cataclastic bioclastic dolomitic limestone, and bioclastic argillaceous limestone, intercalated with some siltstone and mudstone layers (QGSI, 2014).
We collected paleomagnetic samples from the Upper limestone ZD Formation at the Sulucun section (32.5°N, 95.1°E) along an anticline (part of the larger Siguo Syncline, Figures 2A,B,L) in the Zaduo area (QGSI, 2014). In this section, the formation mostly comprises bioclastic dolomitic/argillaceous limestone (Figure 2). The anticline has a NW-SE–trending axis plunging west (plunging direction = 275.8° and plunge angle = 20.3°), with its northeast limb dipping ∼49° and the southwest limb dipping ∼41–43° (Figure 2L). Given the presence of many faults and folds and some apparent deformation and absence of early Permian sediments in the study area (Figures 1B, Figure 2B), the exact time of folding is not precisely constrained. However, the Upper limestone ZD Formation is unconformably overlain by the folded Middle Jurassic Yanshiping Group. The fold axis of the Upper Carboniferous limestone is similar to that of the Middle Jurassic one (Figure 1B), likely indicating a post-Middle Jurassic folding. Our paleomagnetic sampling was carried out on both limbs along the Sulucun section, covering a range over 100 m. Ten to thirteen core samples were collected at each site by a portable gasoline-powered drill. The paleomagnetic samples were oriented with a magnetic compass and also a sun compass when weather allowed. The average difference between the magnetic and sun compass readings was 2.17° (n = 36, Supplementary Table S1); therefore, the magnetic compass can be used to constrain the direction of samples in this area. A total of 131 core samples were collected from 12 sampling sites (i.e., sites one to eight from the south limb and sites nine to twelve from the north limb) (Figure 2L). Most of the samples were collected from fresh rock away from apparent cracks and veins (Figure 2C).
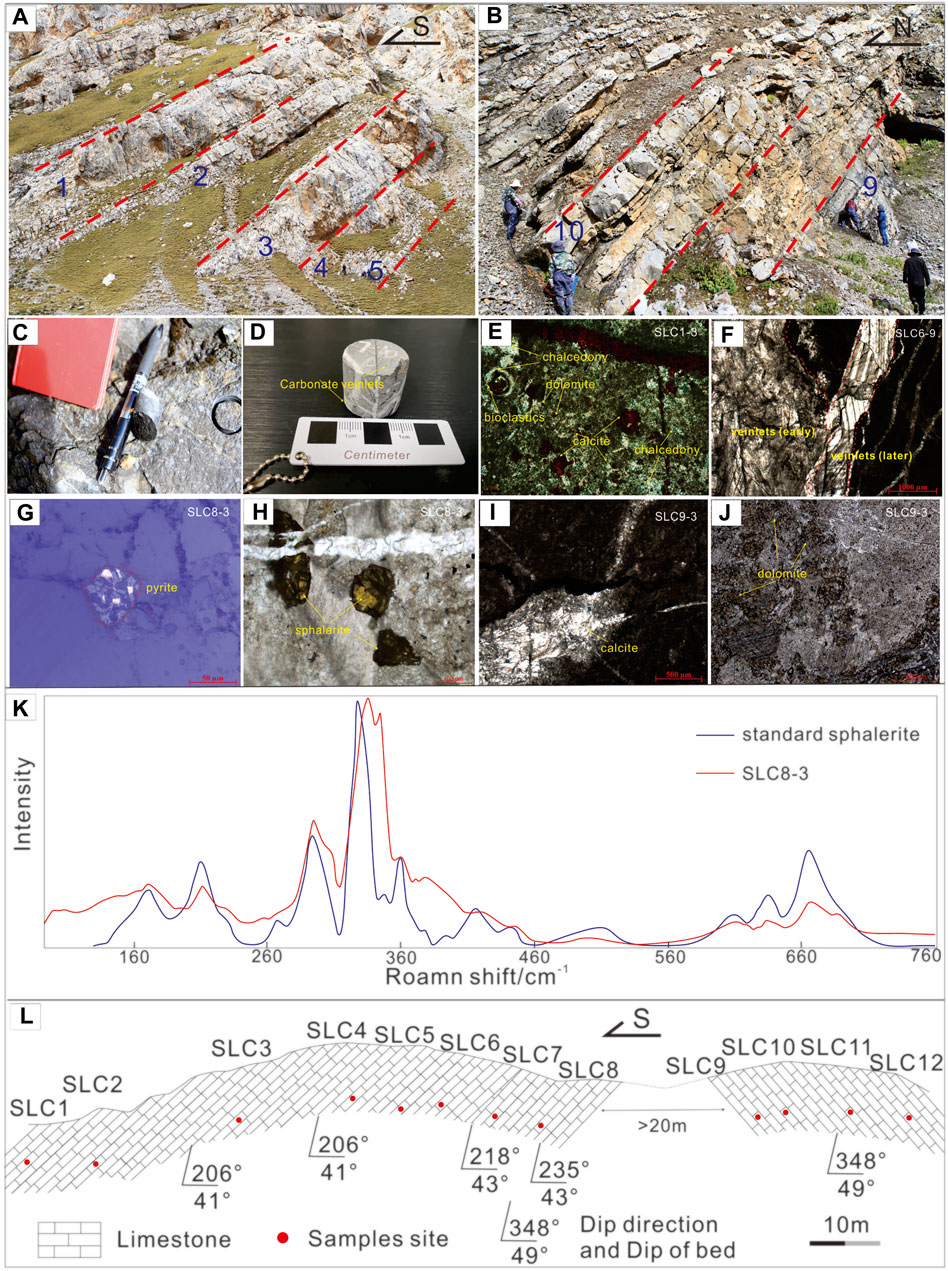
FIGURE 2. Study section (A–D) Field photographs of the Upper limestone ZD Formation (E–J) Photomicrograph (e: cross-polarized light; g: reflected light; f, h, i, and j: single-polarized light and plane-polarized light) of the representative samples from the Upper limestone ZD Formation (K) Raman spectrum of sample SLC8-3 (L) Cross section showing the paleomagnetic sampling sites (red dots) in the Sulucun section.
Petrography
To better understand the texture, mineral composition, and potential alteration during burial, four representative samples (SLC1-3, 6-9, 8-3, and 9-3) from different parts of the limbs were microscopically observed by using a Zeiss Stemi 5,180 polarizing microscope and an electron microprobe analyzer (JXA-8230, JEOL, Japan) and were further analyzed by energy dispersive spectrometry analysis. These experiments were carried out in the State Key Laboratory of Tibetan Plateau Earth System, Resources and Environment, Beijing, China. In order to further determine the types of minerals, samples of SLC8-3 were analyzed by laser Raman spectroscopy on a Raman spectrometer (Renishaw inVia Qontor) in the Sichuan Keyuan Testing Center of Engineering Technology, Chengdu, China.
Photomicrographs in transmitted polarizing light reveal that two different microtextures are present in these four samples (Figures 2E–J). One is the bioclastic dolomitic limestone, with a granular structure, which consists mainly of bioclastic (account for 60%) and interstitial materials (40%). The bioclastics (e.g., ostracod, trilobite, foraminifera, brachiopod debris, algae, and moss) are almost completely altered by calcite, with a grain size of ∼0.10–1.80 mm (Figure 2E). The interstitial materials include calcite, dolomite, and terrigenous argillaceous with grain sizes of ∼0.01–0.1 mm. The other is the cataclastic bioclastic dolomitic limestone, which mainly consists of porphyroclasts (account for 45%) and interstitial materials (55%). The shape of the porphyroclast is irregular, and the grain size is mainly larger than 2.00 mm. Considering the shallow-water carbonate platform depositional environment, detrital inputs could therefore potentially contribute to the presence of porphyroclasts. The main component of interstitial materials is calcite, which has an irregular granular structure and a grain size of ∼0.1–1.60 mm. Two-stage carbonate veinlets are visible in two representative samples (SLC6-9 and SLC8-3, Figure 2F), indicating the presence of a diagenetic feature. Chalcedony, sphalerite, and a minor portion of oxidized pyrite were observed in SLC1-3 and SLC8-3 (Figures 2E,G,H). The presence of chalcedony and sphalerite may indicate a hydrothermal origin of the carbonate veinlets (Jiang et al., 2006; Yi et al., 2016), where the oxidization of pyrite may suggest a late diagenesis process. Partial dissolution and recrystallization are observed in all the four samples (e.g., Figures 2I,J). All these features may suggest the presence of hydrothermal events with the likelihood of remagnetization in the Upper limestone ZD Formation. In addition, the peak of sphalerite from sample SLC8-3 is very similar to that of standard sphalerite in the Raman spectrum (Figure 2K), which further indicates that the mineral is sphalerite.
Magnetite is the common mineral in the four representative samples. Two different morphologies of magnetic minerals are present (Figure 3). One phase is framboidal with individual framboid sizes ranging from only a few micrometers to >20 um (Figures 3H,M). Authigenic growth-zoning and rims are observed in some magnetite grains (Figure 3H). Another phase is subeuhedral to euhedral with small crystal sizes (<10 um); this population is usually distributed in the calcite matrix (Figure 3O). Meanwhile, pyrite (bright in backscattered electron images) is also present (Figures 3A–E,G–N,P). The pyrite grains are usually present as framboids (Figures 3G,I–K,N) or occur as the cores of subeuhedral to euhedral magnetite crystals (Figures 3A–E,L,M,P). Thus, the magnetite grains formed after pyrite are probably an oxidation product of pyrite during later diagenetic events (Suk et al., 1990). In addition, rutile grains also presented in two samples (SLC6-9 and SLC9-3, Figures 3F,N). They are usually the diagenetic alteration product of detrital titanomagnetite with iron completely leached from the particles (Huang et al., 2017). Therefore, the magnetite grains are authigenic that likely formed as an oxidation product of pyrite or other iron sulfides and are hence apparently secondary.
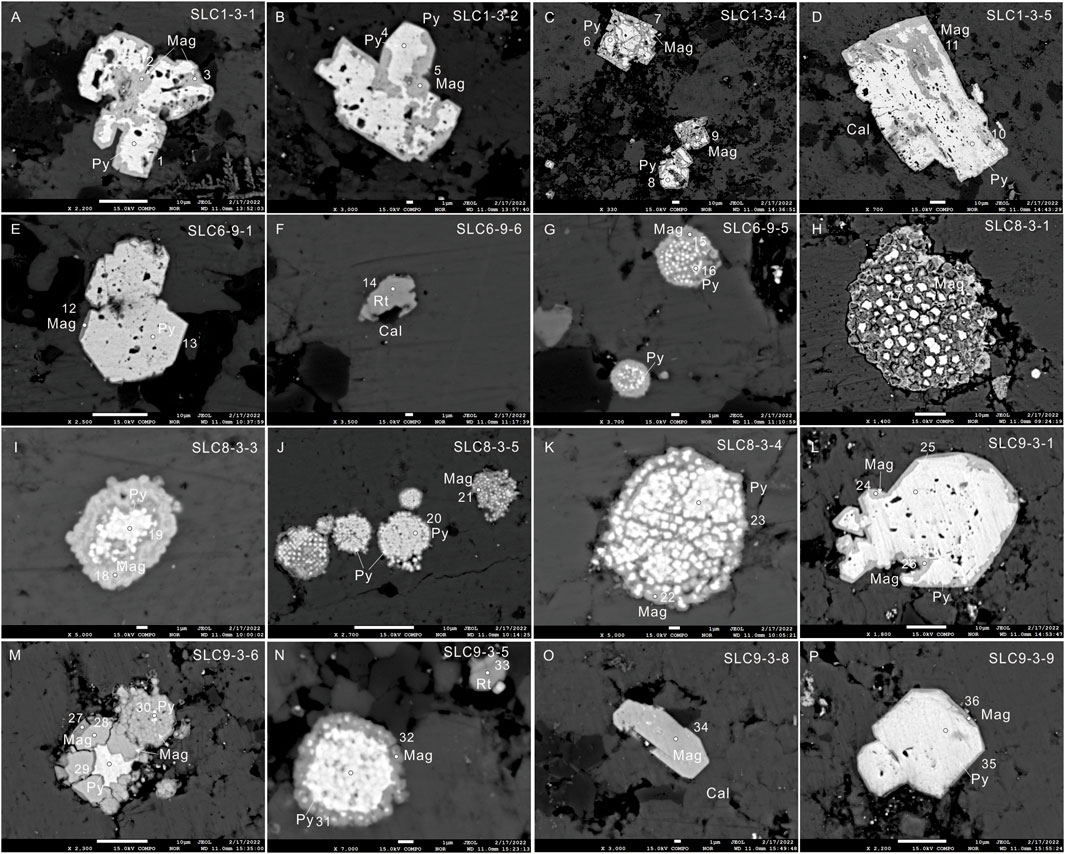
FIGURE 3. Backscatter electron images of representative samples. White dots and numbers are the energy dispersive spectrometry analysis spots with the results shown in Figure 4. Abbreviations: Mag: magnetite, Py: pyrite, Cal: calcite, and Rt: rutile.
Energy dispersive spectrometry analysis indicates the main mineral composition of iron, oxygen, sulfur, and titanium (Figure 4). This further supports the aforementioned observations in the presence of magnetite, pyrite, and rutile.
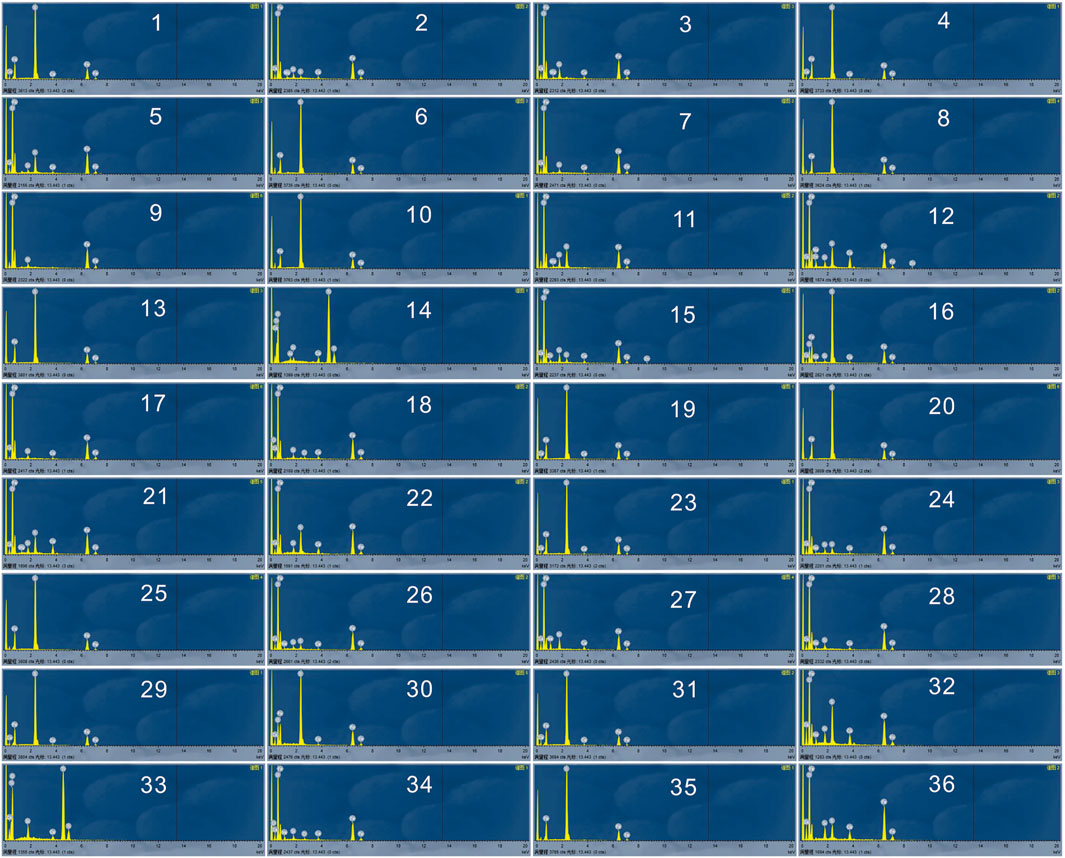
FIGURE 4. Energy dispersive spectroscopy images of representative samples.
Paleomagnetic Measurements and Results
Measurement Methods
To characterize the magnetic properties of the samples, a series of rock magnetic experiments were conducted. High-temperature magnetic susceptibility measurements were performed on six representative samples by using a MFK1-FA Kappabridge with a CS-4 high-temperature furnace. Seven cycles of successive heating to 250, 350, 400, 450, 550, 620, and 700°C with intervening cooling to room temperature were carried out on each sample in an argon atmosphere. Hysteresis loop, IRM acquisition, and reverse field demagnetization curve measurements of 69 samples (five to seven representative samples/site) were measured on a Lakeshore 8600 vibrating sample magnetometer at room temperature. After using an ASC IM-10-30 pulse magnetizer with a maximum applied field of ∼100 mT, IRM acquisition curves for eight representative samples were measured by using a Minispin magnetometer. Most of the samples from the Upper limestone ZD Formation were first thermally demagnetized and then followed by alternating field demagnetization to isolate the ChRM directions. Some samples were only subjected to progressive thermal or alternating field demagnetizations. Additionally, both demagnetizations were carried out on pared sister specimens (Supplementary Table S2). Thermal demagnetization was carried out in an ASC TD-48 furnace (with a residual field <10nT). Alternating field demagnetization was performed up to 140mT by a degausser attached to the 2G Enterprises Model 755 cryogenic magnetometer (RAPID system). Most of the samples were progressively demagnetized in 24 steps (i.e., NRM, 80, 120, 150, 180, 200°C, 2.5mT, 5mT, 7.5mT, 10mT, 12mT, 15mT, 20mT, 25mT, 30mT, 40mT, 50mT, 60mT, 70mT, 80mT, 90mT, 100mT, 120mT, and 140mT), and the sister specimens were either progressively thermal demagnetized in 24 steps (NRM, 130, 170, 210, 250, 290, 320, 340, 360, 380, 400, 410, 415, 420, 425, 430, 435, 440, 445, 450, 455, 460, 465, and 470°C) or alternating field demagnetized in 19 steps (NRM, 2.5mT, 5mT, 7.5mT, 10mT, 12mT, 15mT, 20mT, 25mT, 30mT, 40mT, 50mT, 60mT, 70mT, 80mT, 90mT, 100mT, 120mT, and 140mT). All measurements were carried out in a magnetically shielded room that has an average field of less than 170 nT in the paleomagnetic laboratory in the State Key Laboratory of Tibetan Plateau Earth System, Resources and Environment, Beijing, China.
Rock Magnetism
High-Temperature Susceptibility
Stepwise thermomagnetic runs of magnetic susceptibility were carried out (Figure 5). All of the 250°C and some of the 400°C (Figure 5A,D–F) heating–cooling cycles are reversible, which may suggest no mineral transformation. Some curves are characterized by an increase in susceptibility after 420–550°C (Figure 5D–F), implying formation of new ferrimagnetic minerals during heating (e.g., pyrite, Deng et al., 2001; Zan et al., 2017). Some samples show a decrease in the susceptibility at ∼580°C and are followed by a slow decrease up to ∼680°C (Figure 5C,D), suggesting the presence of both magnetite and hematite. Meanwhile, most of the heating–cooling cycles are quasi-reversible during a higher temperature interval (i.e., 700°C) (Figure 5B, D–F), with a distinct hump at ∼450–550°C, which is likely the Hopkinson peak (Figure5D–F).
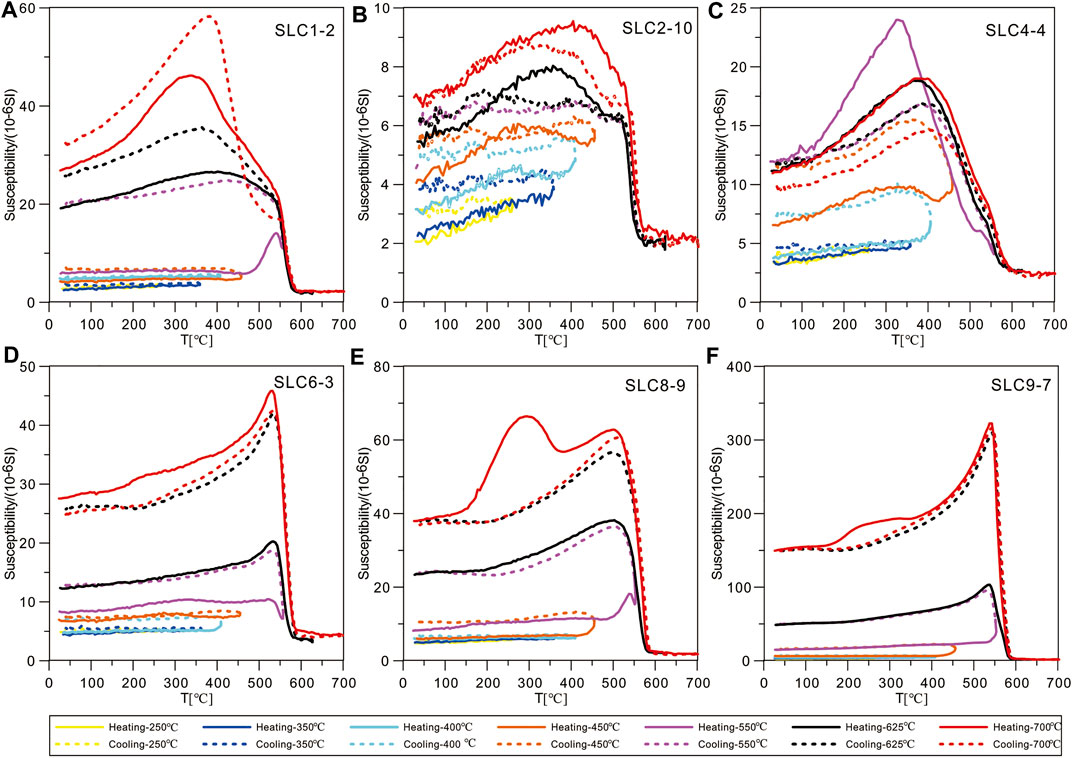
FIGURE 5. (A-F) Multicycle high-temperature magnetic susceptibility curves of the representative samples.
Hysteresis Loop, IRM Acquisition, and IRM Component Analyses
Hysteresis loops show a typical ‘wasp-waisted’ feature for most samples (Figures 6A,C–F), which is also indicated by quantitative analysis of that of Fabian (2003) that Ehys is larger than 4MsBc. This feature indicates the existence of multiple magnetic components with distinct coercivities, which may correspond to the mixtures of different coercivity magnetic minerals or different size fractions of a single mineral (Tauxe et al., 1996; Jackson and Swanson-Hysell, 2012). Most of the specimens (except SLC9-7, remanent coercivities: 83mT, Figure 6F) were saturated below 0.5 T, together with low coercive forces (Bc, 4.02–7.87mT) and remanent coercivities (Bcr, 34–46mT), indicating that the dominant magnetic carrier is probably magnetite (some samples also with hematite). The IRM acquisition curves reveal that their remanences are ∼64–72% saturated by 0.1T and almost fully saturated (∼92–96%) at 0.3T (Figures 6G–I), implying the major remanent carrier of the “soft” magnetic phase, such as magnetite. This is further supported by the relatively narrow hysteresis loops (Figures 6A–F). Decomposition of the IRM acquisition data of three representative samples reveals a similar four-component model (Maxbauer et al., 2016) fit (Figures 6J–L). The low-coercivity component (components 1 and 2) has Bh (the mean coercivity of an individual grain population) values of ∼0.69–1.34 log10 units (∼5–22mT) and DP (dispersion parameter) values of ∼0.2–0.3, ∼6–22% contribution. Component 3 has Bh values of ∼1.78–1.85 log10 units (∼60–70mT) and DP values of ∼0.3, >62% contribution, indicating the dominance of magnetite. Component 4 has B1/2 values of ∼2.48–2.58 log10 units (∼300–380mT) and DP values of ∼0.2, ∼2–4% contribution, implying the presence of very fine-grained magnetite that is close to the threshold size of SP, or residual iron sulfide after oxidizing to authigenic magnetite (Figures 4J–L).
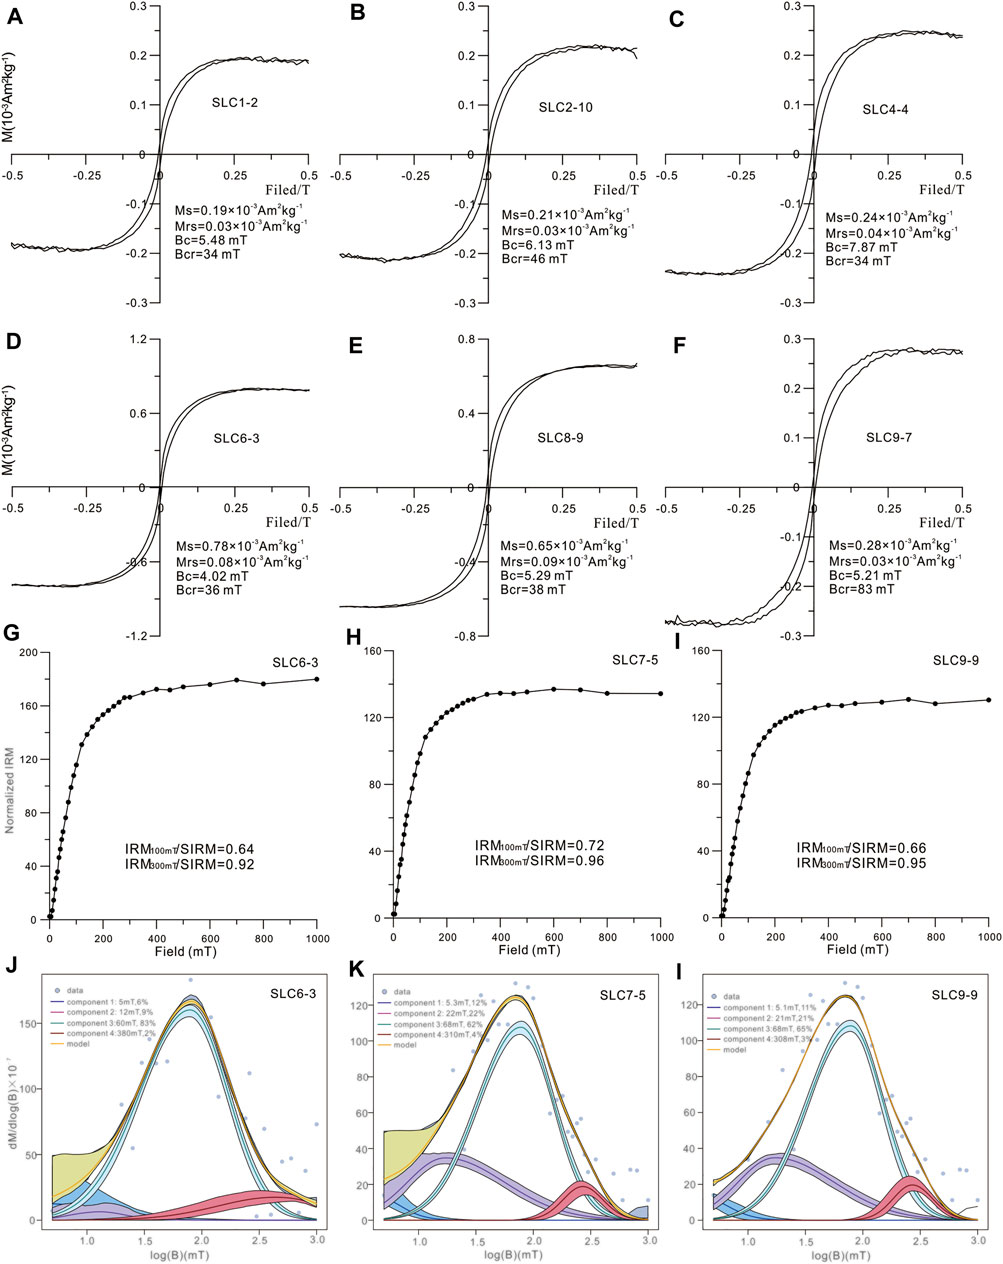
FIGURE 6. Hysteresis loop, IRM curves, and IRM component analyses for the representative samples (A–F) Hysteresis loops (G–I) IRM curves (J–L) IRM component analysis. Abbreviations: Ms, saturation magnetization; Mrs, saturation remanence; Bc, coercivity; and Bcr, remanent coercivity.
Day Plot
Although non-definitive, the Day plot provides an indicative means of discriminating secondary from primary magnetite in limestone (Meng et al., 2020). In Figure 7, the hysteresis parameters of 69 samples are displayed in the Dunlop (2002)’s mixture zone of the pseudosingle domain (PSD), superparamagnetic (SP) to single domain (SD) magnetite. They differ from the range of primary magnetization carbonates but are rather close to the range of widespread remagnetized carbonates (Jackson and Swanson-Hysell, 2012; Fu et al., 2021), where the Bcr/Bc ratios range from 2 to 18 and Mrs/Ms ratios range from 0.08 to 0.2 (Supplementary Table S3, Figure 7). The low Bc and Bcr values indicate that these ‘wasp-waisted’ loops likely represent a mixture result of SD/PSD and SP magnetite, or in some cases possibly also a mixture of both hard and soft magnetic minerals. Although, most natural sedimentary samples that fall within the PSD domain make the interpretation more complicated (e.g., Qin et al., 2008; Cao et al., 2019; Fu et al., 2021; Guan et al., 2021), some still pertain to the Day plot that remagnetization may be diagnosed (Roberts et al., 2018).
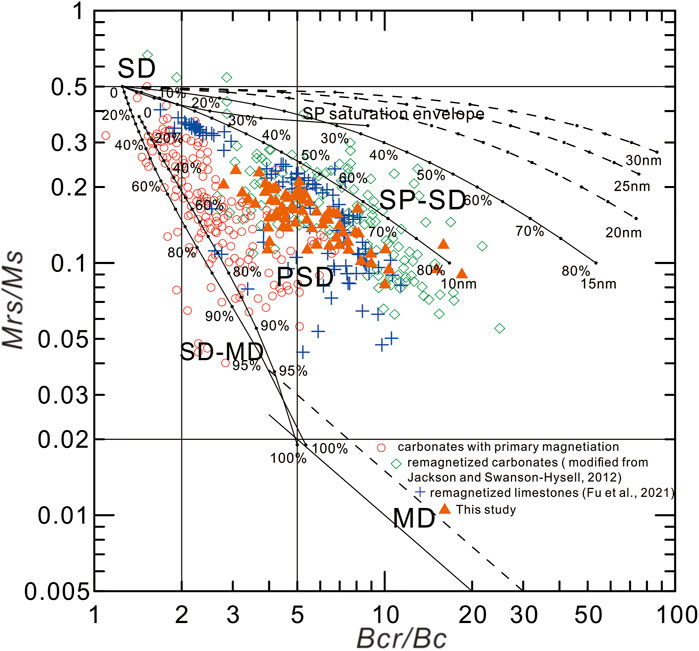
FIGURE 7. Day plot of 69 limestone samples. Also, published hysteresis parameters are plotted for remagnetized and non-remagnetized carbonate rocks summarized by Jackson and Swanson-Hysell (2012) and Fu et al. (2021). Green diamonds and blue cross (red circles) denote remagnetized (non-remagnetized) carbonates.
Paleomagnetic Directions
Principal component analysis involving at least four successive steps was employed to determine the magnetization directions by PaleoMag software (v. 3.1d40) of Jones (2002). Specimens with maximum angular deviation (MAD) > 15° and sites with sample number <5 and/or α95 > 16° were rejected for further analysis. Site-mean directions were calculated by standard Fisher statistics (Fisher, 1953). Most of the specimens exhibited a single component that linearly decays to the origin. This component can generally be isolated below 470°C or 140mT. In addition, both the thermal and alternating field demagnetization results of a same sample share a similar direction (Figure 8, Supplementary Table S2). Hence, a Fisherian site mean is calculated by both the thermal and alternating field demagnetization specimens.
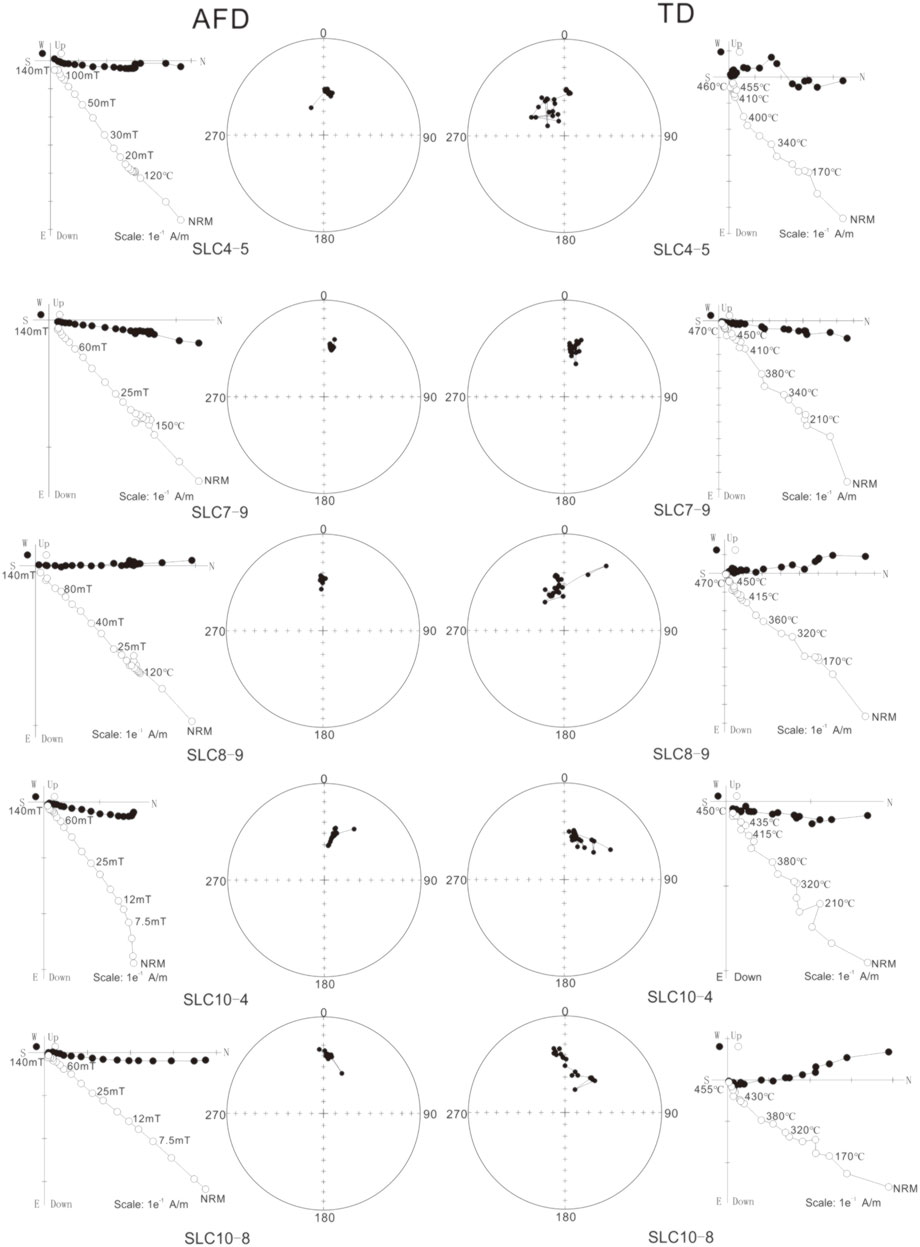
FIGURE 8. Representative orthogonal vector plots and equal-area projections of the Upper limestone ZD Formation in geographic coordinates. Thermal/alternating field demagnetization (TD/AFD) steps are in °C/mT. Open/solid circles represent vertical/horizontal plane projections in the orthogonal diagrams and upward/downward inclinations in the stereonet diagrams.
A total of 104 out of 131 samples (11 out of the 12 sites) have stable ChRM directions. The obtained overall mean direction is Dg = 6.3°, Ig = 50.1°, kg = 54.9, α95 = 6.2° in-situ, and Ds = 330.2°, Is = 58.9°, ks = 5.9, and α95 = 20.5° after the 2-step tilt correction (Stewart and Jackson, 1995) (Figures 9A,B). The κ (α95) value decreases (increases) after the tilt correction. These ChRM directions fail both the Watson and Enkin (1993) progressive unfolding test (unfolding kmax = 66.54 at 12.4%, with 95% uncertainties ranging from 5.6 to 18.8%) (Figure 9C) and McFadden (1990) fold test (ξ1 = 3.3 before and ξ1 = 7.8 after tilt correction, with critical values of ξ = 3.87 at 95% and ξ = 5.38 at 99% confidence levels), indicating post-folding magnetizations. The 11 in-situ site-means, when converted to virtual geomagnetic poles, yield a mean in situ paleopole of 84.4N, 200.3°E, and A95 = 6.8°, corresponding to a paleolatitude of 30.9°N for the sampling area (Table 1, 2).
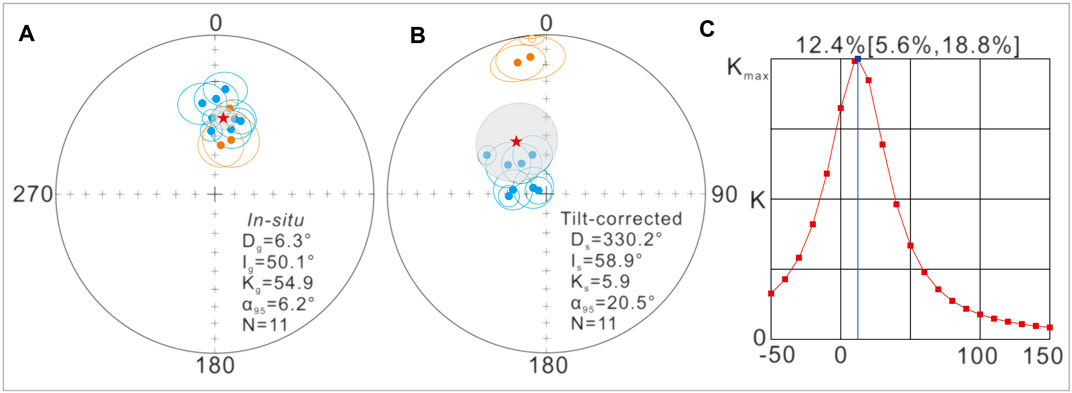
FIGURE 9. Equal-area projections of the characteristic remnant magnetization directions and their Watson and Enkin (1993) progressive unfolding analysis (C) of the Upper limestone ZD Formation (A) in situ (B) tilt-corrected. Open/solid circles represent upward/downward inclinations in a and b; blue/orange symbols represent sites from the south/north limb in a and b.
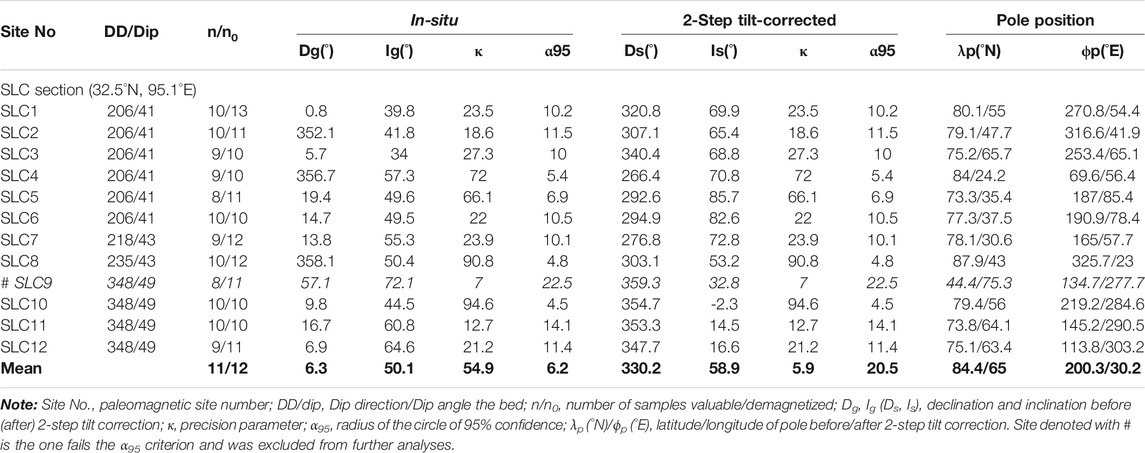
TABLE 1. Characteristic remanent magnetization (ChRM) direction of the SLC site.

TABLE 2. Paleomagnetic poles for the eastern Qiangtang terrane.
Discussion
Evidence for Remagnetizations
In the study area, as mentioned earlier, carbonate veinlets are widespread in the Upper limestone ZD Formation, such as a few to a dozen millimeters wide on the surface of some samples and a few to tens of microns wide under a microscope (Figures 2D–F,H). These carbonate veinlets are mainly composed of calcite, commonly believed as an indicator of diagenetic fluid migration (Gustavson et al., 1994; Phillip, 2008; Bons et al., 2012; Gale et al., 2014), yielding likelihood of remagnetization in the strata. Energy dispersive spectrometry and electron microprobe observations of the representative samples show that the magnetite grains have authigenic growth-zoning and rims, where the pyrite grains usually occur as framboids or the cores of magnetite crystals, with the presence of some rutile grains (Figures 3, 4). It suggested that the magnetite grains are authigenic that likely formed as an oxidation product of pyrite or other iron sulfides.
Authigenic magnetite (dominantly SP and SSD) is rather commonly used to be indicative of the occurrence of remagnetization (McCabe and Channell, 1994; Jackson and Swanson-Hysell, 2012). Our rock magnetic results show that the dominant magnetic carriers in the Upper limestone ZD Formation are pyrite and magnetite (some samples also with hematite) (Figures 5, 6). The hysteresis loops indicate the ‘wasp-waisted’ feature in most samples (Figures 6A,C–F). It is worth noting that the alternating field demagnetization and some rock magnetism results (Figures 5, 6) indicate the presence of high coercivity magnetic minerals, e.g., hematite. However, they have a relatively low content, as indicated by low unblocking temperatures in thermal demagnetization processes and no presence of hematite in all representative samples in petrographic observations (Figures 3, 8). Anyway, the presence of ‘wasp-waisted’ loops is most likely due to the mixture of SP and SSD grains of magnetite (e.g., Dekkers and Pietersen, 1991; Tauxe et al., 1996; Gong et al., 2009), or only a few cases with the mixture of hard and soft magnetic minerals (e.g., hematite and magnetite), or a combination of both situations in few cases. In addition, the unblocking temperature depends on many factors (e.g., the type, volume, shape, and element content of magnetic minerals), and the low unblocking temperature (400–500°C) may indicate the presence of fine-grained magnetite or titanomagnetite (O'Reilly, 1984; Liu et al., 2007) (Figure 8, Supplementary Table S2). Meanwhile, the coercivity (Bcr/Bc) and remanence (Mrs/Ms) ratios are rather close to the “remagnetization trend” on the Day plot; a zone was previously interpreted to be the characteristic of chemical remagnetization, which is distinct from the primary limestone magnetization region (e.g., Jackson 1990; McCabe and Channel, 1994; Jackson and Swanson-Hysell, 2012; Fu et al., 2021) (Figure 7). Furthermore, our result shows a similar trendline with the empirically derived equation Mrs/Ms = 0.89(Bcr/Bc)−0.6 (Jackson, 1990; Jackson et al., 1993) of the uncommon magnetic properties of remagnetized carbonates, except for the lower Mrs/Ms value, which can be attributed to the partial oxidation of magnetite, particle shape, or uncertain mixtures of magnetic minerals (Roberts et al., 2018). The result fits well when changing the equation to Mrs/Ms = 0.89(Bcr/Bc)−l or Mrs/Ms = 0.5(Bcr/Bc)−0.6, where the best fit equation of our data is Mrs/Ms = 0.37(Bcr/Bc)−0.5 (Figure 10).
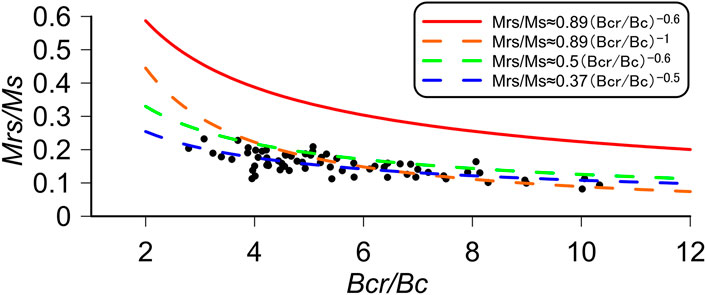
FIGURE 10. Hysteresis parameters for the Upper limestone ZD Formation in the SLC section and empirically derived model of remagnetized carbonates. The red line represents the equation from Jackson and Rochette (1993); the orange and green dotted lines represent the modified equations of Jackson and Rochette (1993); the blue dotted line represents the best fit equation of our data.
In addition, the obtained ChRMs of the Upper limestone ZD Formation yield a negative fold test, suggesting post-folding magnetizations, which likely occurred after the Middle Jurassic. Meanwhile, the 11 2-step tilt-corrected site-means provide a mean paleopole of 65°N, 30.2°E, and A95 = 26.4° that corresponds to a paleolatitude of 39.7°N for the sampling area (Table 2). This is discordant to the available geological and paleomagnetic results that the EQT was located in the southern hemisphere during the late Paleozoic (Zhao et al., 1996; Li et al., 1999; Song et al., 2017; Huang et al., 2018; Zhao et al., 2018; Guan et al., 2021), rather than at such middle latitude in the northern hemisphere.
In summary, the aforementioned petrographic observations and rock magnetic and paleomagnetic measurements suggest that these early Carboniferous limestone samples most likely contain remagnetized magnetizations. Authigenic SP and SSD magnetite and/or a mixture of hematite and magnetite are responsible for the secondary magnetizations.
Timing and Mechanism of Remagnetization
In principle, remagnetization can occur at any time during the geological history, yet it is generally related to major tectonic events (e.g., orogeny and metamorphism). There are four major tectonic events reported in the Tibetan Plateau region after the early Carboniferous, such as the collisions of the EQT with the Tarim/Songpan-Ganzi/Yidun terranes, the western Qiangtang terrane with the EQT, the Lhasa with the western Qiangtang terrane, and India with Eurasia plates. Our negative fold test of the obtained ChRMs indicates post-folding magnetizations, which extensively occurred after the Middle Jurassic. Thus, the remanence was likely obtained after the Middle Jurassic. However, the time of folding is rather extensive without robust geological evidence, and the post-Middle Jurassic is a relatively long period; further analyses are essential to constrain the time of remagnetization.
The shortest distance from a remagnetization paleopole to the reliable reference poles is commonly used to estimate the time of the remagnetization event in paleomagnetism (Van der Voo and Torsvik, 2012). We collected all the available post Carboniferous paleopoles of the EQT and filled with the quality criteria (Van der Voo, 1990; Meert et al., 2020), as shown in Figure 11 and Table 2. Paleopoles are relatively concordant at each period, such as during the Permian (Song et al., 2017; Ma et al., 2019; Guan et al., 2021), the Triassic (Song et al., 2015, 2020; Yu et al., 2022), the Jurassic (Cheng et al., 2012; Yan et al., 2016), and the Cretaceous (Huang et al., 1992; Tong et al., 2015; Meng et al., 2018), except that the Cenozoic poles are rather scattered (Figure 11), which are likely due to widespread local rotations during the Lhasa–Qiangtang terrane and India–Eurasia collisions (Tong et al., 2015; Chen et al., 2017). Our obtained in-situ paleopole of 84.4°N, 200.3°E with A95 = 6.8° is far away from these known Paleozoic and Mesozoic poles but rather close to ∼53–38.6 Ma poles (especially around 40 Ma, Zhang et al., 2020; Lippert et al., 2011) and the present day pole (Figure 11; Table 2), while given that the remagnetization time of the Middle-Upper Jurassic limestone was proposed to be Eocene in the adjacent area of only ∼8 km away (Figure 1B) (Fu et al., 2021). Hence, both of the two strata likely had experienced similar Eocene remagnetizations. We therefore interpreted the episode of remagnetization of the early Carboniferous limestone (the Upper limestone ZD Formation) to be after 53 Ma, most likely around 40 Ma, during the early stage of the India–Eurasia collision, although any post 53-Myr remagnetization still cannot be ruled out.
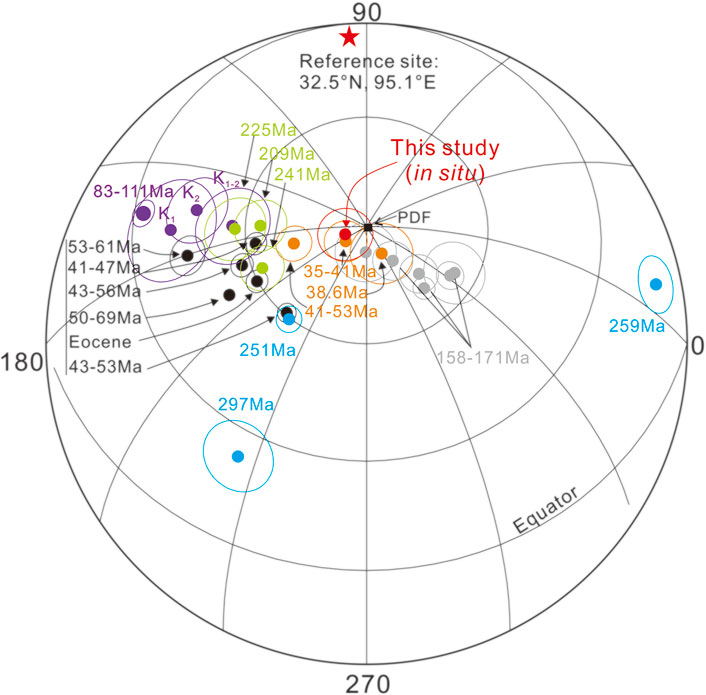
FIGURE 11. Equal-area projection of the paleomagnetic poles of the EQT since the Late Paleozoic. Small-circle fitting passing through paleopoles (colored circle) and centered on the reference point (red star). Paleomagnetic data from Permian (1. Song et al., 2017; 2. Ma et al., 2019; 3. Guan et al., 2021), Triassic (4-5. Song et al., 2015, 2020; 6. Yu et al., 2022), Jurassic (7. Cheng et al., 2012; 8. Yan et al., 2016; 9. Fu et al., 2021), Cretaceous (10. Huang et al., 1992; 11. Tong et al., 2015; 12. Meng et al., 2018), and Cenozoic (13. Lippert et al., 2011; 14. Tong et al., 2017; 15-16. Zhang et al., 2018, 2020; 17. Li et al., 2020; 18. Xiao et al., 2021). PDF represent the direction of the present-day geomagnetic field.
A further question is how were these limestones remagnetized? The most common mechanisms to explain remagnetization include the thermoviscous resetting of existing magnetic minerals (Kent, 1985) and chemical remanent magnetization through magnetic mineral growth associated with orogenic fluids (e.g., Jackson, 1990; Elmore et al., 2012; Huang et al., 2015). Given that only the Late Triassic and Early Cretaceous intrusive rocks are found near the section (Figure 1B), they are deemed a less likely mechanism for the remagnetization as 1) the obtained pole is most likely of the Early Cenozoic one; 2) The nearby Permo-Triassic volcanic rocks and Early Cretaceous intrusive rocks both contain primary magnetizations (Guan et al., 2021; Fu et al., 2022). In general, limestone perhaps has not been heated for a sufficient amount of time at such a temperature to make the thermal resetting feasible by the intrusive rocks (Dekkers, 2012); and 3) The nearby Middle Jurassic limestone was remagnetized during the Eocene (Fu et al., 2021).
The Upper limestone ZD Formation was deposited in a littoral and shallow sea carbonate platform environment (QGSI, 2014). The appearance of massive bioclastic limestone indicates a warm climate at that time, which was conducive to biological growth (QGSI, 2014). Previous studies suggested that when organic carbon fluxes were high, oxygen would be used up and form an anoxic sulphidic diagenetic environment, where paramagnetic pyrite would have to be replaced with detrital magnetite and hematite (Froelich et al., 1979; Roberts, 2015; Huang et al., 2019; Fu et al., 2021). Thus, the Upper limestone ZD Formation tended to contain plenty of iron sulphides during its burial and diagenesis process. Late, the Qamdo region has been uplifted to a fairly high elevation during the early stage of the India–Eurasia collision around the Paleogene (Xu et al., 2013; Tang et al., 2017; Xiong et al., 2020). The environment might have turned to suboxic and/or oxic during the period, resulting in iron sulphide oxidation to authigenic magnetite and the acquisition of chemical remanent magnetizations (Brothers et al., 1996). Meanwhile, the process might have caused migration of orogenic fluids (e.g., hydrothermal, Figure 2), resulting in the occurrence of widespread carbonate veinlets in the Upper limestone ZD Formation and the nearby Middle-Upper Jurassic limestone (Fu et al., 2021), leading to the chemical remanent magnetizations of the previous Upper Carboniferous and Middle-Upper Jurassic limestones.
Therefore, the obtained paleomagnetic direction of the Upper limestone ZD Formation is a remagnetized direction. Given both the well-observed primary and secondary directions in limestone samples elsewhere around the Tibetan Plateau (e.g., Lin and Watts, 1988; Yan et al., 2016; Huang et al., 2017; Ran et al., 2017; Zhao et al., 2021), paleomagnetic directions recorded in the limestone are extremely complicated around the region. It is necessary to carry out detailed rock magnetic and petrographic analyses to obtain robust paleopoles in the Tibetan Plateau.
Conclusion
Petrographic observations of the Upper limestone ZD Formation demonstrate the magnetic minerals of pyrite and authigenic magnetite. The presence of chalcedony and sphalerite suggests that these representative samples have more likely been affected by hydrothermal activities. High-temperature susceptibility and hysteresis loop analyses reveal the dominant magnetic minerals of pyrite and fine-grained magnetite; the coercivity (Bcr/Bc) and remanence (Mrs/Ms) ratios are rather close to the ‘remagnetization trend’. Paleomagnetic demagnetization analyses obtained 11 sites of 104 ChRM directions, which failed the fold test, indicating post-folding magnetizations. These ChRMs yield an in-situ paleopole of 84.4N, 200.3°E, and A95 = 6.8°, which is coincident with the post ∼53 Myr (especially around 40 Ma) paleopoles of the region. We ascertained that these early Carboniferous limestones contain remagnetized magnetizations that were obtained after 53 Ma, most likely around 40 Ma, due to the far-field effect of the India–Eurasia collision.
Data Availability Statement
The datasets presented in this study can be found in online repositories. The names of the repository/repositories and accession number(s) can be found below: http://dx.doi.org/10.6084/m9.figshare.17098844.
Author Contributions
LY: conceptualization, investigation, methodology, writing–original draft, and visualization. MY: conceptualization, methodology, writing–reviewing and editing, validation, and supervision. CG, BL, QF, WX, ZF, DZ, MS, ZX, and ZN: resources and writing–reviewing and editing.
Funding
This research was supported by the Natural Science Foundation of China (Grants 41988101-01,41974080, 42164005, and 42104074), the Second Tibetan Plateau Scientific Expedition Program (Grant 2019QZKK0707), the Strategic Priority Research Program of Chinese Academy of Sciences (XDA20070201), and the State Scholarship Fund, CSC, China (202004910721).
Conflict of Interest
The authors declare that the research was conducted in the absence of any commercial or financial relationships that could be construed as a potential conflict of interest.
Publisher’s Note
All claims expressed in this article are solely those of the authors and do not necessarily represent those of their affiliated organizations, or those of the publisher, the editors, and the reviewers. Any product that may be evaluated in this article, or claim that may be made by its manufacturer, is not guaranteed or endorsed by the publisher.
Acknowledgments
We thank Jinbo Zan, Yibo Yang, Jiang Pang, and Weijie Zhang for their suggestions and thank Jing Xie, Wenxiao Ning, and Tao Li for their laboratory assistance. We are grateful to the Handling editor Yunfa Miao, reviewers Mark J. Dekkers, Jun Meng and Bin Wang for their detailed and constructive comments.
Supplementary Material
The Supplementary Material for this article can be found online at: https://www.frontiersin.org/articles/10.3389/feart.2022.825943/full#supplementary-material
References
Bons, P. D., Elburg, M. A., and Gomez-Rivas, E. (2012). A Review of the Formation of Tectonic Veins and Their Microstructures. J. Struct. Geology. 43, 33–62. doi:10.1016/j.jsg.2012.07.005
Brothers, L., Engel, M., and Elmore, R. (1996). The Late Diagenetic Conversion of Pyrite to Magnetite by Organically Complexed Ferric Iron. Chem. Geol. 130, 1–14.
Bureau of Geology Mineral Resources of Xizang Autonomous Region (Bgmrxar), (1993). Regional Geology of Xizang (Tibet) Autonomous Region. Beijing, China: Geological Publishing House, 1–450. (In Chinese).
Cao, Y., Sun, Z., Li, H., Pei, J., Liu, D., Zhang, L., et al. (2019). New Paleomagnetic Results from Middle Jurassic Limestones of the Qiangtang Terrane, Tibet: Constraints on the Evolution of the Bangong-Nujiang Ocean. Tectonics 38, 215–232. doi:10.1029/2017tc004842
Chen, W., Zhang, S., Ding, J., Zhang, J., Zhao, X., Zhu, L., et al. (2017). Combined Paleomagnetic and Geochronological Study on Cretaceous Strata of the Qiangtang Terrane, central Tibet. Gondwana Res. 41, 373–389. doi:10.1016/j.gr.2015.07.004
Cheng, X., Wu, H., Diao, Z., Wang, H., Ma, L., Zhang, X., et al. (2013). Paleomagnetic Data from the Late Carboniferous-Late Permian Rocks in Eastern Tibet and Their Implications for Tectonic Evolution of the Northern Qiangtang-Qamdo Block. Sci. China Earth Sci. 56, 1209–1220. doi:10.1007/s11430-012-4558-1
Cheng, X., Wu, H., Guo, Q., Hou, B., Xia, L., Wang, H., et al. (2012). Paleomagnetic Results of Late Paleozoic Rocks from Northern Qiangtang Block in Qinghai-Tibet Plateau, China. Sci. China Earth Sci. 55, 67–75. doi:10.1007/s11430-011-4287-x
Dekkers, M. J. (2012). End-member Modelling as an Aid to Diagnose Remagnetization: A Brief Review. Geol. Soc. Lond. Spec. Publications 371 (1), 253–269. doi:10.1144/sp371.12
Dekkers, M. J., and Pietersen, H. S. (1991). Magnetic Properties of Low-Ca Fly Ash: A Rapid Tool for Fe-Assessment and a Survey for Potentially Hazardous Elements. MRS Proc. 245, 37–47. doi:10.1557/proc-245-37
Deng, C., Zhu, R., Jackson, M. J., Verosub, K. L., and Singer, M. J. (2001). Variability of the Temperature-dependent Susceptibility of the Holocene Eolian Deposits in the Chinese Loess Plateau: a Pedogenesis Indicator. Phys. Chem. Earth, A: Solid Earth Geodesy 26, 873–878. doi:10.1016/s1464-1895(01)00135-1
Dewey, J. F., Shackleton, R. M., Chengfa, C., and Yiyin, S. (1988). “The Tectonic Evolution of the Tibetan Plateau,” in Philosophical Transactions of the Royal Society of London A Mathematical Physical & Engineering Sciences, 327, 379–413.
Dunlop, D. J. (2002). Theory and Application of the Day Plot (Mrs/Ms versus Hcr/Hc) 2. Application to Data for Rocks, Sediments, and Soils. J. Geophys. Res. 107, 2057. doi:10.1029/2001JB000487
Elmore, R. D., Muxworthy, A. R., and Aldana, M. (2012). Remagnetization and Chemical Alteration of Sedimentary Rocks. Geol. Soc. Lond. Spec. Publications 371, 1–21. doi:10.1144/sp371.15
Fabian, K. (2003). Some Additional Parameters to Estimate Domain State from Isothermal Magnetization Measurements. Earth Planet. Sci. Lett. 213 (3–4), 337–345. doi:10.1016/S0012-821X(03)00329-7
Fisher, R. (1953). Dispersion on a Sphere. Proc. R. Soc. A: Math. Phys. Eng. Sci. 217, 295–305. doi:10.1098/rspa.1953.0064
Froelich, P. N., Klinkhammer, G. P., Bender, M. L., Luedtke, N. A., Heath, G. R., Cullen, D., et al. (1979). Early Oxidation of Organic Matter in Pelagic Sediments of the Eastern Equatorial Atlantic: Suboxic Diagenesis. Geochim. Cosmochim. Acta. 43, 1075–1090.
Fu, Q., Yan, M. D., Dekkers, J. M., Guan, C., Boer, R. A., Yu, L., et al. (2022). The Early Cretaceous Zaduo Granite, Eastern Qiangtang Terrane (China) – an Attempt to Constraint its Paleolatitude and Tectonic Implications. Front. Earth Sci. 10, 1–22. doi:10.3389/feart.2022.829593
Fu, Q., Yan, M. D., Dekkers, J. M., Guan, C., Yu, L., Xu, W. L., et al. (2021). Remagnetization of the Jurassic Limestones in the Zaduo Area, Eastern Qiangtang Terrane (Tibetan Plateau, China): Implications for the India–Eurasia Collision. Geophys. J. Int. 0, 1–19.
Gale, J. F. W., Laubach, S. E., Olson, J. E., Eichhuble, P., and Fall, A. (2014). Natural Fractures in Shale: A Review and New Observations. Bulletin 98, 2165–2216. doi:10.1306/08121413151
Gong, Z., Dekkers, M. J., Heslop, D., and Mullender, T. A. T. (2009). End-member Modelling of Isothermal Remanent Magnetization (IRM) Acquisition Curves: a Novel Approach to Diagnose Remagnetization. Geophys. J. Int. 178, 693–701. doi:10.1111/j.1365-246x.2009.04220.x
Guan, C., Yan, M. D., Zhang, W. L., Zhang, D. W., Fu, Q., Yu, L., et al. (2021). Paleomagnetic and Chronologic Data Bearing on the Permian/Triassic Boundary Position of Qamdo in the Eastern Qiantang Terrane: Implications for the Closure of the Paleo-Tethys. Geophys. Res. Lett. 48, e2020GL092059. doi:10.1029/2020gl092059
Gustavson, T. C., Hovorka, S. D., and Dutton, A. R. (1994). Origin of Satin Spar Veins in Evaporite Basins. J. Sediment. Res. 64, 88–94. doi:10.1306/d4267d1b-2b26-11d7-8648000102c1865d
Huang, B., Yan, Y., Piper, J. D. A., Zhang, D., Yi, Z., Yu, S., et al. (2018). Paleomagnetic Constraints on the Paleogeography of the East Asian Blocks during Late Paleozoic and Early Mesozoic Times. Earth-Science Rev. 186, 8–36. doi:10.1016/j.earscirev.2018.02.004
Huang, W., Jackson, M. J., Dekkers, M. J., Zhang, Y., Zhang, B., Guo, Z., et al. (2019). Challenges in Isolating Primary Remanent Magnetization from Tethyan Carbonate Rocks on the Tibetan Plateau: Insight from Remagnetized Upper Triassic Limestones in the Eastern Qiangtang Block. Earth Planet. Sci. Lett. 523, 115695. doi:10.1016/j.epsl.2019.06.035
Huang, W., Lippert, P. C., Jackson, M. J., Dekkers, M. J., Zhang, Y., Li, J., et al. (2017). Remagnetization of the Paleogene Tibetan Himalayan Carbonate Rocks in the Gamba Area: Implications for Reconstructing the Lower Plate in the India-Asia Collision. J. Geophys. Res. Solid Earth 122, 808–825. doi:10.1002/2016jb013662
Huang, W., van Hinsbergen, D. J. J., Dekkers, M. J., Garzanti, E., Dupont-Nivet, G., Lippert, P. C., et al. (2015). Paleolatitudes of the Tibetan Himalaya from Primary and Secondary Magnetizations of Jurassic to Lower Cretaceous Sedimentary Rocks. Geochem. Geophys. Geosyst. 16, 77–100. doi:10.1002/2014gc005624
Jackson, M. (1990). Diagenetic Sources of Stable Remanence in Remagnetized Paleozoic Cratonic Carbonates: a Rock Magnetic Study. J. Geophys. Res. 95, 2753–2761. doi:10.1029/jb095ib03p02753
Jackson, M., Rochette, P., Fillion, G., Banerjee, S., and Marvin, J. (1993). Rock Magnetism of Remagnetized Paleozoic Carbonates: Low-Temperature Behavior and Susceptibility Characteristics. J. Geophys. Res. 98, 6217–6225.
Jackson, M., and Swanson-Hysell, N. L. (2012). Rock Magnetism of Remagnetized Carbonate Rocks: Another Look. Geol. Soc. Lond. Spec. Publications 371, 229–251. doi:10.1144/sp371.3
Jiang, Y. D., Qiu, H. N., and Xiao, H. J. (2006). Preliminary Investigation of Sphalerite "Ar-Ar Dating by Crushing in Vacuum: a Case Study from the Fankou Pb-Zn deposit, Guangdong Province. Acta Petrologica Sinica 22 (10), 2425–2430. (In Chinese).
Jones, C. H. (2002). User-driven Integrated Software Lives: "Paleomag" Paleomagnetics Analysis on the Macintosh. Comput. Geosciences 28 (10), 1145–1151. doi:10.1016/s0098-3004(02)00032-8
Kainian Huang, K. N., Opdyke, N. D., Xingjie Peng, X. J., and Jiguang Li, J. G. (1992). Paleomagnetic Results from the Upper Permian of the Eastern Qiangtang Terrane of Tibet and Their Tectonic Implications. Earth Planet. Sci. Lett. 111 (1), 1–10. doi:10.1016/0012-821x(92)90164-q
Kent, D. V., and Muttoni, G. (2020). Pangea B and the Late Paleozoic Ice Age. Palaeogeogr. Palaeoclimatol. Palaeoecol. 553 (109753), 1–20. doi:10.1016/j.palaeo.2020.109753
Kent, D. V. (1985). Thermoviscous Remagnetization in Some Appalachian Limestones. Geophys. Res. Lett. 12, 805–808. doi:10.1029/gl012i012p00805
Li, C., Zhai, G. Y., Wang, L. Q., Yin, F. G., and Mao, X. C. (2009). An Important Window for Understanding the Qinghai-Tibet Plateau: a Review on Research Progress in Recent Years of Qiangtang Area. Tibet. Geol. Bul. China. 28, 1169–1177. (In Chinese).
Li, S., van Hinsbergen, D. J. J., Najman, Y., Liu-Zeng, J., Deng, C., and Zhu, R. (2020). Does Pulsed Tibetan Deformation Correlate with Indian Plate Motion Changes? Earth Planet. Sci. Lett. 536, 116144. doi:10.1016/j.epsl.2020.116144
Li, X. Z., Liu, W. J., Wang, Y. Z., Zhu, Q. W., Du, D. X., Shen, G. F., et al. (1999). The Tectonic Evolution and Metallogenesis in the Tethys of the Nujiang–Lancangjiang–Jinshajiang Area, Southwestern China. Beijing, China: Beijing Geological Publishing House, 1–276. (In Chinese).
Lin, J. L., and Watts, D. (1988). Palaeomagnetic Results from the Tibetan Plateau. Philos. Trans. R. Soc. A, Math. Phys. Eng. Sci. 327, 239–262. doi:10.1098/rsta.1988.0128
Lippert, P. C., Zhao, X., Coe, R. S., and Lo, C.-H. (2011). Palaeomagnetism and 40Ar/39Ar Geochronology of Upper Palaeogene Volcanic Rocks from Central Tibet: Implications for the Central Asia Inclination Anomaly, the Palaeolatitude of Tibet and post-50 Ma Shortening within Asia. Geophys. J. Int. 184, 131–161. doi:10.1111/j.1365-246x.2010.04833.x
Liu, Q. S., Deng, C. L., and Pan, Y. X. (2007). Temperature-dependency and Frequency-Dependency of Magnetic Susceptibility of Magnetite and Maghemite and Their Significance for Environmental Magnetism. Quat. Sci. 27 (6), 955–962. (In Chinese).
Liu, Y., and Sun, K. Q. (2008). Study on the Permian Paleophytogeographical Provinces in Xizang (Tibet). Geol. Rev. 54 (3), 289–295. (In Chinese).
Ma, Y., Wang, Q., Wang, J., Yang, T., Tan, X., Dan, W., et al. (2019). Paleomagnetic Constraints on the Origin and Drift History of the North Qiangtang Terrane in the Late Paleozoic. Geophys. Res. Lett. 46, 689–697. doi:10.1029/2018gl080964
Maxbauer, D. P., Feinberg, J. M., and Fox, D. L. (2016). MAX UnMix: A Web Application for Unmixing Magnetic Coercivity Distributions. Comput. Geosciences 95, 140–145. doi:10.1016/j.cageo.2016.07.009
McCabe, C., and Channell, J. E. T. (1994). Late Paleozoic Remagnetization in Limestones of the Craven Basin (Northern England) and the Rock Magnetic Fingerprint of Remagnetized Sedimentary Carbonates. J. Geophys. Res. 99, 4603–4612. doi:10.1029/93jb02802
McFadden, P. L. (1990). A New Fold Test for Palaeomagnetic Studies. Geophys. J. Int. 103, 163–169. doi:10.1111/j.1365-246x.1990.tb01761.x
Meert, J. G., Pivarunas, A. F., Evans, D. A. D., Pisarevsky, S. A., Pesonen, L. J., Li, Z.-X., et al. (2020). The Magnificent Seven: A Proposal for Modest Revision of the Quality index. Tectonophysics 790, 228549. doi:10.1016/j.tecto.2020.228549
Meng, J., Gilder, S. A., Li, Y., Wang, C., and Liu, T. (2020). Expanse of Greater India in the Late Cretaceous. Earth Planet. Sci. Lett. 542, 116330. doi:10.1016/j.epsl.2020.116330
Meng, J., Zhao, X., Wang, C., Liu, H., Li, Y., Han, Z., et al. (2018). Palaeomagnetism and Detrital Zircon U-Pb Geochronology of Cretaceous Redbeds from central Tibet and Tectonic Implications. Geol. J. 53 (5), 2315–2333. doi:10.1002/gj.3070
Metcalfe, I. (2013). Gondwana Dispersion and Asian Accretion: Tectonic and Palaeogeographic Evolution of Eastern Tethys. J. Asian Earth Sci. 66, 1–33. doi:10.1016/j.jseaes.2012.12.020
Metcalfe, I. (2006). Palaeozoic and Mesozoic Tectonic Evolution and Palaeogeography of East Asian Crustal Fragments: The Korean Peninsula in Context. Gondwana Res. 9, 24–46. doi:10.1016/j.gr.2005.04.002
Pan, G. T., Zhu, D. C., Wang, L. C., Liao, Z. L., Geng, Q. R., and Jiang, X. S. (2004). Bangong Lake-Nu River Suture Zone—The Northern Boundary of Gondwanaland: Evidence from Geology and Geophysics. Earth Sci. Front. 11, 371–382. (In Chinese).
Pan, G., Wang, L., Li, R., Yuan, S., Ji, W., Yin, F., et al. (2012). Tectonic Evolution of the Qinghai-Tibet Plateau. J. Asian Earth Sci. 53, 3–14. doi:10.1016/j.jseaes.2011.12.018
Phillip, S. L. (2008). Geometry and Formation of gypsum Veins in Mudstones at Watchet, Somerset, SW England. Geol. Mag. 145, 831–844. doi:10.1017/s0016756808005451
Qin, H. F., Liu, Q. S., and Pan, Y. X. (2008). The First-Order Reversal Curve (FORC) Diagram: Theory and Case Study. Chin. J. Geophys. 51, 743–751. (In Chinese).
Qinghai Geological Survey Institute (QGSI) (2014). 1:250000 Geological Survey Report of the People’s Republic of China-Zaduo County Sheet. Wuhan, China: China University of Geosciences Press. 9787562533832. (In Chinese).
Qinghai Geological Survey Institute (QGSI) (2005b). Geological Map (1:250000) of the People’s Republic of China-Jiduo County Sheet. Wuhan, China: China University of Geosciences Press. (In Chinese).
Qinghai Geological Survey Institute (QGSI) (2005a). Geological Map (1:250000) of the People’s Republic of China-Zaduo County Sheet. Wuhan, China: China University of Geosciences Press. (In Chinese).
Ran, B., Deng, B., Wang, C., Zhao, X., Li, Y., Zhang, Y., et al. (2017). Kinematics of the Crust Around the Tanggula Shan in North-Central Tibet: Constraints from Paleomagnetic Data. Gondwana Res. 48, 124–133. doi:10.1016/j.gr.2017.04.017
Ren, H. D., Yan, M. D., Meng, Q. Q., Song, C. H., and Fang, X. M. (2013). E/I” Corrected Paleomagnetic Inclination Indicates 910-1188 Km N–S Shortening of the Qiangtang Terrane since the Middle Jurassic. Chin. J. Geophys. 48 (2), 1–14. (In Chinese).
Roberts, A. P. (2015). Magnetic mineral Diagenesis. Earth-Science Rev. 151, 1–47. doi:10.1016/j.earscirev.2015.09.010
Roberts, A. P., Tauxe, L., Heslop, D., Zhao, X., and Jiang, Z. (2018). A Critical Appraisal of the “Day” Diagram. J. Geophys. Res. Solid Earth 123, 2618–2644. doi:10.1002/2017jb015247
Song, P., Ding, L., Li, Z., Lippert, P. C., Yang, T., Zhao, X., et al. (2015). Late Triassic Paleolatitude of the Qiangtang Block: Implications for the Closure of the Paleo-Tethys Ocean. Earth Planet. Sci. Lett. 424, 69–83. doi:10.1016/j.epsl.2015.05.020
Song, P., Ding, L., Li, Z., Lippert, P. C., and Yue, Y. (2017). An Early Bird from Gondwana: Paleomagnetism of Lower Permian Lavas from Northern Qiangtang (Tibet) and the Geography of the Paleo-Tethys. Earth Planet. Sci. Lett. 475, 119–133. doi:10.1016/j.epsl.2017.07.023
Song, P. P., Ding, L., Lippert, P. C., Li, Z. Y., Zhang, L. Y., and Xie, J. (2020). Paleomagnetism of Middle Triassic Lavas from Northern Qiangtang (Tibet): Constraints on the Closure of the Paleo-Tethys Ocean. J. Geophys. Res. Solid Earth 125, e2019JB017804. doi:10.1029/2019jb017804
Stewart, S. A., and Jackson, K. C. (1995). Palaeomagnetic Analysis of Fold Closure Growth and Volumetrics. Geol. Soc. Lond. Spec. Publications 98 (1), 283–295. doi:10.1144/gsl.sp.1995.098.01.19
Suk, D., Peacor, D. R., and der Voo, R. V. (1990). Replacement of Pyrite Framboids by Magnetite in limestone and Implications for Palaeomagnetism. Nature 345, 611–613. doi:10.1038/345611a0
Tang, M., Liu-Zeng, J., Hoke, G. D., Xu, Q., Wang, W., Li, Z., et al. (2017). Paleoelevation Reconstruction of the Paleocene-Eocene Gonjo basin, SE-central Tibet. Tectonophysics 712-713, 170–181. doi:10.1016/j.tecto.2017.05.018
Tapponnier, P., Zhiqin, X., Roger, F., Meyer, B., Arnaud, N., Wittlinger, G., et al. (2001). Oblique Stepwise Rise and Growth of the Tibet Plateau. Science 294, 1671–1677. doi:10.1126/science.105978
Tauxe, L., Mullender, T. A. T., and Pick, T. (1996). Potbellies, Wasp-Waists, and Superparamagnetism in Magnetic Hysteresis. J. Geophys. Res. 101, 571–583. doi:10.1029/95jb03041
Tong, Y.-B., Yang, Z., Gao, L., Wang, H., Zhang, X.-D., An, C.-Z., et al. (2015). Paleomagnetism of Upper Cretaceous Red-Beds from the Eastern Qiangtang Block: Clockwise Rotations and Latitudinal Translation during the India-Asia Collision. J. Asian Earth Sci. 114, 732–749. doi:10.1016/j.jseaes.2015.08.016
Tong, Y., Yang, Z., Mao, C., Pei, J., Pu, Z., and Xu, Y. (2017). Paleomagnetism of Eocene Red-Beds in the Eastern Part of the Qiangtang Terrane and its Implications for Uplift and Southward Crustal Extrusion in the southeastern Edge of the Tibetan Plateau. Earth Planet. Sci. Lett. 475, 1–14. doi:10.1016/j.epsl.2017.07.026
Van der Voo, R. (1990). The Reliability of Paleomagnetic Data. Tectonophysics 184, 1–9. doi:10.1016/0040-1951(90)90116-p
Van der Voo, R., and Torsvik, T. H. (2012). The History of Remagnetization of Sedimentary Rocks: Deceptions, Developments and Discoveries. Geol. Soc. Lond. Spec. Publications 371, 23–53. doi:10.1144/sp371.2
Watson, G. S., and Enkin, R. J. (1993). The Fold Test in Paleomagnetism as a Parameter Estimation Problem. Geophys. Res. Lett. 20 (19), 2135–2137. doi:10.1029/93GL01901
Xiao, R., Zheng, Y., Liu, X., Yang, Q., Liu, G., Xia, L., et al. (2021). Synchronous Sedimentation in Gonjo basin, Southeast Tibet in Response to india-asia Collision Constrained by Magnetostratigraphy. Geochem. Geophys. Geosyst 22 (3). doi:10.1029/2020GC009411
Xiong, Z., Ding, L., Spicer, R. A., Farnsworth, A., Wang, X., Valdes, P. J., et al. (2020). The Early Eocene Rise of the Gonjo Basin, SE Tibet: from Low Desert to High forest. Earth Planet. Sci. Lett. 543, 116312. doi:10.1016/j.epsl.2020.116312
Xu, Q., Ding, L., Zhang, L., Cai, F., Lai, Q., Yang, D., et al. (2013). Paleogene High Elevations in the Qiangtang Terrane, central Tibetan Plateau. Earth Planet. Sci. Lett. 362, 31–42. doi:10.1016/j.epsl.2012.11.058
Yan, M., Zhang, D., Fang, X., Ren, H., Zhang, W., Zan, J., et al. (2016). Paleomagnetic Data Bearing on the Mesozoic Deformation of the Qiangtang Block: Implications for the Evolution of the Paleo- and Meso-Tethys. Gondwana Res. 39, 292–316. doi:10.1016/j.gr.2016.01.012
Yang, X., Cheng, X., Zhou, Y., Ma, L., Zhang, X., Yan, Z., et al. (2017). Paleomagnetic Results from Late Carboniferous to Early Permian Rocks in the Northern Qiangtang Terrane, Tibet, China, and Their Tectonic implicationsGeologic Evolution of the Himalayan-Tibetan Orogen. Sci. China Earth Sci. 60 (1), 124211–134280. doi:10.1007/s11430-015-5462-7
Yi, L. S., Fan, H. R., Zhai, M. G., Li, Y. X., Ma, H. F., Tian, J. J., et al. (2016). Fluorite Sm-Nd Isochron and Pitchblende U-Pb Dating in the Baiyanghe Be-U deposit, Xinjiang and Their Geological Significances. Acta Petrologica Sinica 32 (7), 2099–2110. (In Chinese).
Yin, A., and Harrison, T. M. (2000). Geologic Evolution of the Himalayan-Tibetan Orogen. Annu. Rev. Earth Planet. Sci. 28 (1), 211–280. doi:10.1146/annurev.earth.28.1.211
Yu, L., Yan, M. D., Domeier, M., Guan, C., Shen, M. M., Fu, Q., et al. (2022). New Paleomagnetic and Chronological Constraints on the Late Triassic Position of the Eastern Qiangtang Terrane: Implications for the Closure of the Eastern Paleo-Tethys. Geophys. Res. Lett. 49, e2021GL096902. doi:10.1029/2021GL096902
Zan, J., Fang, X., Yan, M., and Li, B. (2017). New Insights into the Palaeoclimatic Interpretation of the Temperature Dependence of the Magnetic Susceptibility and Magnetization of Mid-late Pleistocene Loess/palaeosols in Central Asia and the Chinese Loess Plateau. Geophys. J. Int. 208, 663–673. doi:10.1093/gji/ggw419
Zhang, W. L., Fang, X. M., Zhang, T., Song, C. H., and Yan, M. D. (2020). Eocene Rotation of the Northeastern central Tibetan Plateau Indicating Stepwise Compressions and Eastward Extrusions. Geophys. Res. Lett. 47 (17), e2020GL088989. doi:10.1029/2020gl088989
Zhang, Y.-c., Shi, G. R., and Shen, S.-z. (2013). A Review of Permian Stratigraphy, Palaeobiogeography and Palaeogeography of the Qinghai-Tibet Plateau. Gondwana Res. 24, 55–76. doi:10.1016/j.gr.2012.06.010
Zhang, Y., Huang, W., Huang, B., Hinsbergen, D. J. J., Yang, T., Dupont-Nivet, G., et al. (2018). 53-43 Ma Deformation of Eastern Tibet Revealed by Three Stages of Tectonic Rotation in the Gongjue Basin. J. Geophys. Res. Solid Earth 123, 3320–3338. doi:10.1002/2018jb015443
Zhao, G., Wang, Y., Huang, B., Dong, Y., Li, S., Zhang, G., et al. (2018). Geological Reconstructions of the East Asian Blocks: From the Breakup of Rodinia to the Assembly of Pangea. Earth-Science Rev. 186, 262–286. doi:10.1016/j.earscirev.2018.10.003
Zhao, Q., Huang, B., Yi, Z., and Xue, P. (2021). High-resolution Petrographic Evidence Confirming Detrital and Biogenic Magnetites as Remanence Carriers for Zongpu Carbonates in the Gamba Area, South Tibet. Front. Earth Sci. 9, 713469. doi:10.3389/feart.2021.713469
Zhao, X., Coe, R. S., Gilder, S. A., and Frost, G. M. (1996). Palaeomagnetic Constraints on the Palaeogeography of China: Implications for Gondwanaland∗. Aust. J. Earth Sci. 43 (6), 643–672. doi:10.1080/08120099608728285
Zhou, Y., Cheng, X., Wu, Y., Kravchinsky, V., Shao, R., Zhang, W., et al. (2019). The Northern Qiangtang Block Rapid Drift during the Triassic Period: Paleomagnetic Evidence. Geosci. Front. 10, 2313–2327. doi:10.1016/j.gsf.2019.05.003
Keywords: paleomagnetism, eastern Qiangtang terrane, carboniferous limestone, remagnetization, India–Eurasia collision
Citation: Yu L, Yan M, Guan C, Li B, Fu Q, Xu W, Feng Z, Zhang D, Shen M, Xu Z and Niu Z (2022) Remagnetization of Carboniferous Limestone in the Zaduo Area, Eastern Qiangtang Terrane, and Its Tectonic Implications. Front. Earth Sci. 10:825943. doi: 10.3389/feart.2022.825943
Received: 30 November 2021; Accepted: 02 March 2022;
Published: 24 March 2022.
Edited by:
Yunfa Miao, Northwest Institute of Eco-Environment and Resources, (CAS), ChinaReviewed by:
Bin Wang, Northwest University, ChinaCopyright © 2022 Yu, Yan, Guan, Li, Fu, Xu, Feng, Zhang, Shen, Xu and Niu. This is an open-access article distributed under the terms of the Creative Commons Attribution License (CC BY). The use, distribution or reproduction in other forums is permitted, provided the original author(s) and the copyright owner(s) are credited and that the original publication in this journal is cited, in accordance with accepted academic practice. No use, distribution or reproduction is permitted which does not comply with these terms.
*Correspondence: Maodu Yan, bWFvZHV5YW5AaXRwY2FzLmFjLmNu