 Yige Li
 Wenjun Zheng
 Jingjun Yang
 Dongli Zhang
 Haoyu Zhou1,2,3
94% of researchers rate our articles as excellent or good
Learn more about the work of our research integrity team to safeguard the quality of each article we publish.
Find out more
ORIGINAL RESEARCH article
Front. Earth Sci., 14 February 2022
Sec. Structural Geology and Tectonics
Volume 10 - 2022 | https://doi.org/10.3389/feart.2022.825849
This article is part of the Research TopicContinental Basin and Orogenic Processes: Tectonic Deformation and Associated Landscape and Environmental EvolutionView all 15 articles
The Helan Shan is located on the front edge of the expanding Tibetan Plateau. However, how the topography here responds to this propagation and its precise time constraints remain unknown. Based on the response process of fluvial landforms and tectonic evolution, we conducted a quantitative landform analysis of the Helan Shan region. Here, the spatial distribution features of various geomorphic indices were coupled, demonstrating that the mountain is tilting toward the west and north. The steeper downstream and gentle upper reaches indicate that the fluvial landforms have experienced an accelerated incision event, which can be attributed to the tectonic activity along the East Helan Shan Fault. Furthermore, the response time of the tectonic knickpoints ranges from 0.1 to 1.4 Ma based on the paleochannel reconstruction method. Combined with previous studies on low temperature thermochronology and active tectonics, we proposed a tectonic transformation model where the Helan Shan shifted the tilting model from the southwest to the northwest, as induced by the northeast expansion of the Tibetan Plateau from 0.1 to 1.4 Ma.
The uplift of the Tibetan Plateau is one of the most significant tectonic processes that occurred in the Cenozoic: a formation that shaped the tectonic and climatic framework of Eurasia (Molnar and Tapponnier, 1975; Yin and Harrison, 2000; Royden et al., 2008) and has continued to expand since its establishment (Tapponnier et al., 2001; Zheng et al., 2006; Yin et al., 2008; Clark et al., 2010; Duvall et al., 2011; Rohrmann et al., 2012). Although its dynamic mechanism remains controversial, the scientific community widely accepts the view that the northeastern Tibetan Plateau is the outermost component of accretion and uplift (Liu et al., 2010; Zheng et al., 2010; Wang et al., 2011; Lei et al., 2016; Zheng et al., 2016). Recent studies on active tectonics suggest that the current active boundary of the Tibetan Plateau is the South Heli Shan Fault, North Longshou Shan Fault, and Sanguankou–Niushou Shan Fault, which developed during the Late Cenozoic (2–3 Ma) (Lei et al., 2016; Zheng et al., 2021). The geomorphological response to this tectonic event has been observed in the Niushou Shan area (Liang et al., 2013). The West Helan Shan Fault is generally regarded as the continuation of the arc-shaped tectonic belt periphery (Sanguankou–Niushou Shan Fault) on the northeastern margin of the Tibetan Plateau to the north. However, how the Helan Shan responded to this plateau propagation event in the Late Cenozoic, and precise constraints on the corresponding timing remain unclear. Hence, the evolution of active orogenic belts located along the current boundary of the northeastern Tibetan Plateau is significant for understanding the expansion process of the Tibetan Plateau.
The fluvial landscapes in the active orogenic belt result from the combined effects of surface processes, tectonics, and climate, thus recording the tectonic-climate evolutional history across geological periods (Hack, 1957; Whipple, 2004; Kirby and Whipple, 2012). Rapid progress in quantitative research on fluvial landscapes in the past 10 years has allowed us to extract tectonic information from the many factors that control the evolution of fluvial landforms (Schwanghart and Kuhn, 2010; Schwanghart and Scherler, 2014; Willett et al., 2014; Forte and Whipple, 2019). Previous studies on quantitative geomorphology have shown that the Yumu Shan and Heli Shan began uplift at 4 and 0.6–2.1 Ma, respectively (Wang et al., 2018; Yang et al., 2020). Therefore, examining the interaction between fluvial landforms and active orogenies provides a practical approach for revealing the regional spatial–temporal tectonic patterns.
In this study, we utilized bedrock river profile analysis and paleochannel reconstruction to decipher the tectonic patterns of the Helan Shan. We first extracted the geomorphic index, for example, the normalized channel steepness index, and χ of the Helan Shan to quantify the spatial variation in the rock uplift rates and direction of divide migration. We then calculated the response time of the knickpoints confined within a range. Finally, we combined multiple lines of evidence to suggest that the tectonic transformation of the Helan Shan may have occurred in the Pleistocene as a result of Tibetan Plateau expansion.
The Helan Shan extends from the NE to the SW for approximately 100 km, surrounded by tectonically stable blocks, with the Alashan block to the west and the Ordos block to the east. To the southwest, numerous active strike-slip and thrust faults constitute the northeastern margin of the Tibetan Plateau (Figure 1A) (Yang and Dong, 2018). A variety of dynamic factors have restricted the special composite junction, which has experienced a long-term intracontinental deformation process (Darby and Ritts, 2002; Liu et al., 2010). As a result, the area is characterized by complex tectonic phenomena, accompanied by the development of folds, faults, and strong active tectonics since the Quaternary (Zhang et al., 1990; Deng and Liao, 1996; Deng et al., 2003).
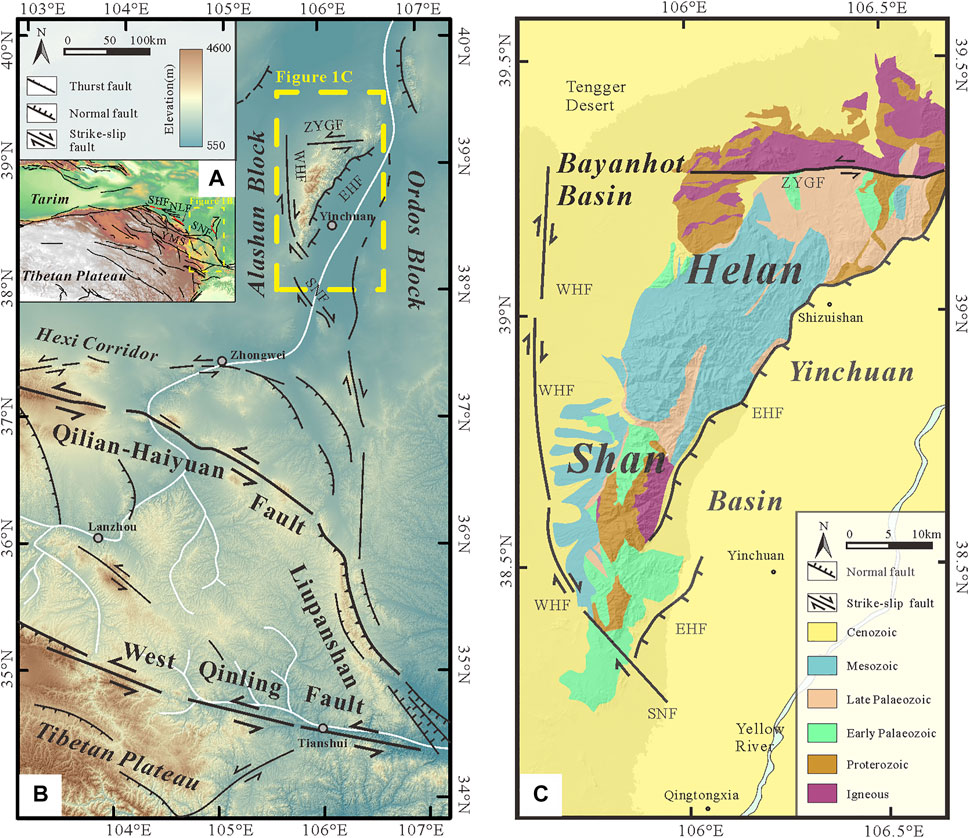
FIGURE 1. (A) Tectonic location of the study area. (B) Active tectonic features of the northeastern margin of the Tibetan Plateau, modified from Zheng et al. (2016) and Yu et al. (2016). (C) Geological map of the Helan Shan area, modified from Geological Map of Ningxia Hui Autonomous Region, the People’s Republic of China (2014). Fault names: SHP, South Heli Shan Fault; NLP, North Longshou Shan Fault; WHF, West Helan Shan Fault; EHF, East Helan Shan Fault; SNF, Sanguankou-Niushoushan Fault; ZYGF, Zhengyiguan Fault.
The main component of the Helan Shan is under the clamping control of the East and West Helan Shan faults on both sides. The East Helan Shan Fault is a normal fault with a northeast–southwest strike and an eastward dip, whose hanging wall is the Yinchuan Basin and footwall is the Helan Shan (Yang and Dong, 2018). All methods used by previous studies, such as thermoluminescence, cosmogenic radionuclide dating, trenches, and sedimentology, among others, have shown that without exception, the vertical slip rate of the southern section of the East Helan Shan Fault is higher than that of the northern section (Du, 2010; Zhang et al., 2010; Lei et al., 2016). The currently active West Helan Shan Fault is a Holocene right lateral strike-slip fault with horizontal and vertical sliding rates of approximately 0.28 and 0.64 mm/a, respectively (Du, 2010; Lei et al., 2016). The West Helan Shan Fault is the northern extension of the Sanguankou–Niushoushan Fault. They have the same structural deformation process and tectonic properties, i.e., the leading edge of plateau extension are toward the northeast. The Yinchuan Basin is mirror-symmetrical to the Helan Shan in terms of its tectonic attributes, tending to be synchronized with respect to important tectonic deformation events (Zhang et al., 2010). During the 12–10 Ma active tectonic period, fault depression and shrinkage in the Yinchuan Basin accompanied the rapid uplift of the Helan Shan (Liu et al., 2010). The traditional view is that the Alashan block is stable with weak tectonic activity (Yu et al., 2016; Zheng et al., 2016). However, recent results show that the northeastward propagation of the Tibetan Plateau intersected the Hexi Corridor and reached the southern edge of the Alashan Block at 3–2 Ma, gradually becoming the newest part of the northeastern edge of the Tibetan Plateau (Zheng et al., 2013, 2021; Lei et al., 2016).
The Helan Shan mainly exposes Paleozoic–Mesozoic strata, accompanied by a series of intrusive rocks. Proterozoic strata include high-grade metamorphic rocks in the north and carbonate rocks in the south. The high-grade metamorphic rocks and igneous rock are referred to as the khondalite belts (Zhao et al., 2005; Zhou and Geng, 2009), which contain mélange, S-type granite, schist, and gneiss, among others. The early Paleozoic strata of Helan Shan are mainly exposed in the south, where the main lithology comprises limestone and dolomite. The upper Paleozoic and Mesozoic strata are exposed in the middle of the Helan Shan, where the lithology is dominated by clastic rocks. Additionally, a large number of alluvial fan groups contained in the Cenozoic strata developed at the front of the mountain (Figure 1C).
In terms of the topography, the west is relatively flat, the east is steeper, the north is wider, and the south is narrower. The highest peak is 3,556 m above sea level, with an average elevation of 1,800 m, which is significantly higher than the Bayanhot and Yinchuan basins on both sides, with a height difference of >2,200 m. The rivers in the Helan Shan generally have a narrow width, limited runoff, and poor tributary development. As the climate of the Helan Shan is characterized by its location in the transitional zone of the monsoon and non-monsoon climate, the rivers in the area have relatively limited runoff and relatively rapid flow. The Helan Shan is at a transitional position between the desert-grassland and desert areas. This region mainly depends on summer precipitation for water supply. The main rainfall occurs in June, July, and August. Therefore, the surface runoff that develops at the two foothills of the Helan Shan is seasonal (Liu et al., 2004). Rivers at the western foot of the Helan Shan flow westward into the Tengger Desert. Rivers at the eastern foot of the Helan Shan flow into the Yinchuan Basin and then merge into the Yellow River. We considered the rivers along the eastern and western slopes of the Helan Shan for quantitative analysis of the fluvial landscapes.
The stream power law (Stock and Montgomery, 1999; Whipple, 2001; Kirby and Whipple, 2012) assumes that the incision progress of detachment-limited stream (longitudinal profiles) can be approximated as follows (Whipple and Tucker, 1999; Whipple, 2004; Wang et al., 2017):
where K is the fluvial erodibility of the bedrock channel affected by climatic conditions, rock properties, and channel geometry; A is the contributing drainage area; S is the local channel gradient; and m and n are positive parameters.
However, the vertical evolution of a detachment-limited bedrock channel is determined by the rock uplift (U) and stream trenching (E) rates (England and Molnar, 1990):
When the fluvial landform reaches a steady state, the topographic elevation is no longer a function of time. Eq. 2 reduces to the following expression (Perron and Royden, 2013):
For a single river channel, the regional uplift rate (U) basically does not change in space, such that we obtained the following:
The channel steepness index, ks (or the normalized steepness index, i.e., ksn), can be used to simplify Eq. (4a) and directly express the uplift rate:
where θ is the concavity of the river channel and S is the slope of the river channel. The steepness index, ks, has a notable power–law relationship with the bedrock uplift rate (U). Therefore, both ks and ksn can be used to obtain the uplift rate (Kirby and Whipple, 2012).
The χ-analysis method is widely used to obtain the steepness index of the channel. We integrated both sides of Eq. (4b) to obtain (Royden and Perron, 2013) the following:
Taking the position of xb as the initial definite integral and simplifying, we obtained the following:
We set parameter A0 as the reference area, which is usually 1 m2 to facilitate a simplified calculation. Parameter χ was introduced to represent topological information on the river:
Eq. 7 can be rewritten as follows:
where χ is the abscissa, the river elevation, z, is the ordinate, and the slope is ks. Compared with the traditional logarithmic method, this method avoids repeated errors caused by the elevation differential. At the same time, the slope of the straight line directly represents the steepness index (Royden and Perron, 2013). Therefore, we used the χ-plot method to calculate the ks value and examine the river profile.
Additionally, recent research indicates that the χ value can be used to analyze the evolution of water systems in active orogenic belts (Willett et al., 2014). Here, the model assumes that runoff from both sides of the active orogen flows into the same datum. Therefore, the elevations of the watersheds should be equal. The watershed with a large χ value has a relatively small erosion rate, E, and the channel steepness index, ks, is often relatively small owing to the equilibrium of the channel. Numerical simulation studies have shown that the erosion rate of the watershed gradually becomes lower, which has also been confirmed by field observations (Willett, 1999). Therefore, the χ values of the basins can be used to identify the direction of watershed migration (Yang et al., 2015).
When bedrock channels reach steady state, the longitudinal fluvial profile of the steady channel shows a smooth concave shape (Hack, 1973; Whipple, 2004). However, differences in the lithology, climate, and tectonic activity may alter the original balance between river erosion and the regional tectonic uplift rate, leading to discontinuities in the river, that is, knickpoints (Whipple and Tucker, 1999; Berlin and Anderson, 2007). As discussed by Kirby and Whipple (2012), knickpoints can be grouped into two end-member morphologies: vertical-step knickpoints and slope-break knickpoints. The reasons for the formation of these two knickpoint types are divergent; there are significant differences in the shape of the river longitudinal profile (Figure 2).
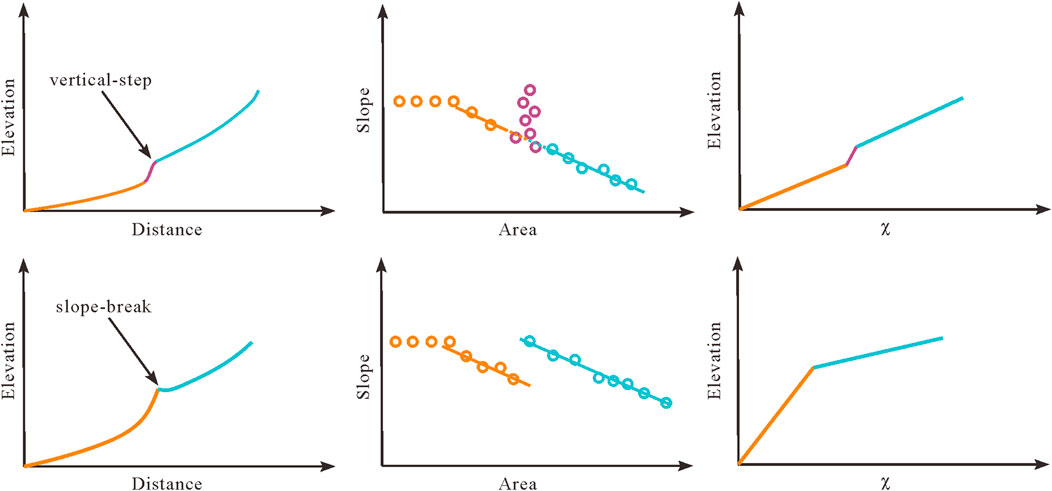
FIGURE 2. Channel profile differences between the two types of knickpoints (blue indicates the upstream channel of the crack; orange indicates the channel downstream of the crack; purple indicates the knickpoints) [modified from Kirby and Whipple, (2012)].
A vertical-step knickpoint is characterized by a sharply increasing slope near the knickpoint area, but there is no change in the steepness index of the river course upstream or downstream of the knickpoint. In contrast, there is a notable difference in the steepness index near a slope-break knickpoint. We mainly distinguished the knickpoint type based on the longitudinal river profile and analyzed its genesis and tectonic indications in combination with geological and geomorphological data.
A slope-break of tectonic origin is the most common in an active orogenic belt. At present, research and applications of the unsteady water erosion equation have mostly focused on this type of knickpoints. The paleochannel projection is the most basic application (Kirby and Whipple, 2012; Kent et al., 2017; Zhang et al., 2017). This method assumes that the original vertical slip rate of active faults in the orogenic belt is U2, the channel is in equilibrium at this time, and its erosion rate, E2, is equivalent to U2. After tectonic movement occurs, the regional uplift rate increases from U2 to U1, knickpoints are generated, and the downstream attains an equilibrium state. At this time, the downstream erosion rate, E2, is equal to the new fault activity rate, U1. Therefore, the upstream and downstream channels of the knickpoints are in equilibrium with the original, U2, and current, U1, uplift rates, respectively. The upstream channel of the knickpoints refers to the previous channel before acceleration of the regional uplift rate (Goren et al., 2014a; Fox et al., 2014).
The elevation of the knickpoint is Z, and the distance from the knickpoints to the mountain pass is χ (Figure 3). On the χ-elevation map or the distance–elevation map, the river channel upstream of the knickpoint was fitted and extended to the water outlet position to obtain the previous channel projection. The height difference between the elevation projected on the outlet and the elevation, Z, of the knickpoint is z'. The only difference (∆Z) with respect to the elevation of the outlet is the quantity of erosion owing to the knickpoint; the undercut depth (∆Z) of the knickpoint can be expressed as follows (Kirby and Whipple, 2012):
where τ is the response time of the split point, which can be expressed as follows (Yang et al., 2020):
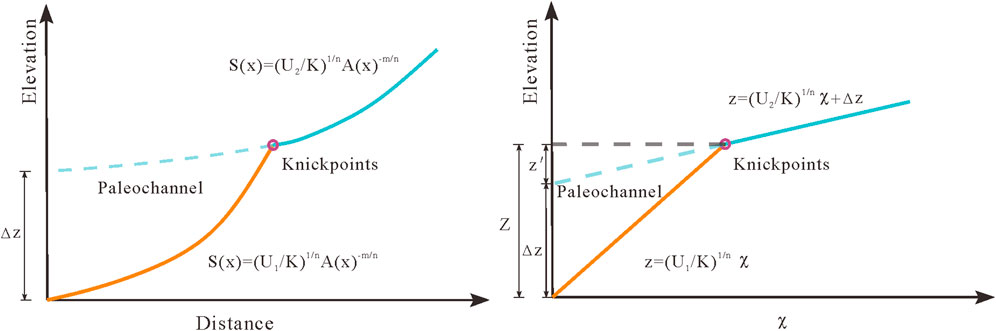
FIGURE 3. Paleochannel reconstruction in two coordinate systems [modified from Kirby and Whipple, (2012)].
We used the 90 m resolution digital elevation model (DEM) provided by the Shuttle Radar Topography Mission (SRTM) to extract 43 rivers in the Helan Shan, of which 1–26 and 27–43 are located at the eastern and western piedmont of the Helan Shan, respectively (Figure 4A). Most rivers flow through a single lithological area: only seven rivers (7–12 and 26) flow through two different lithological areas.
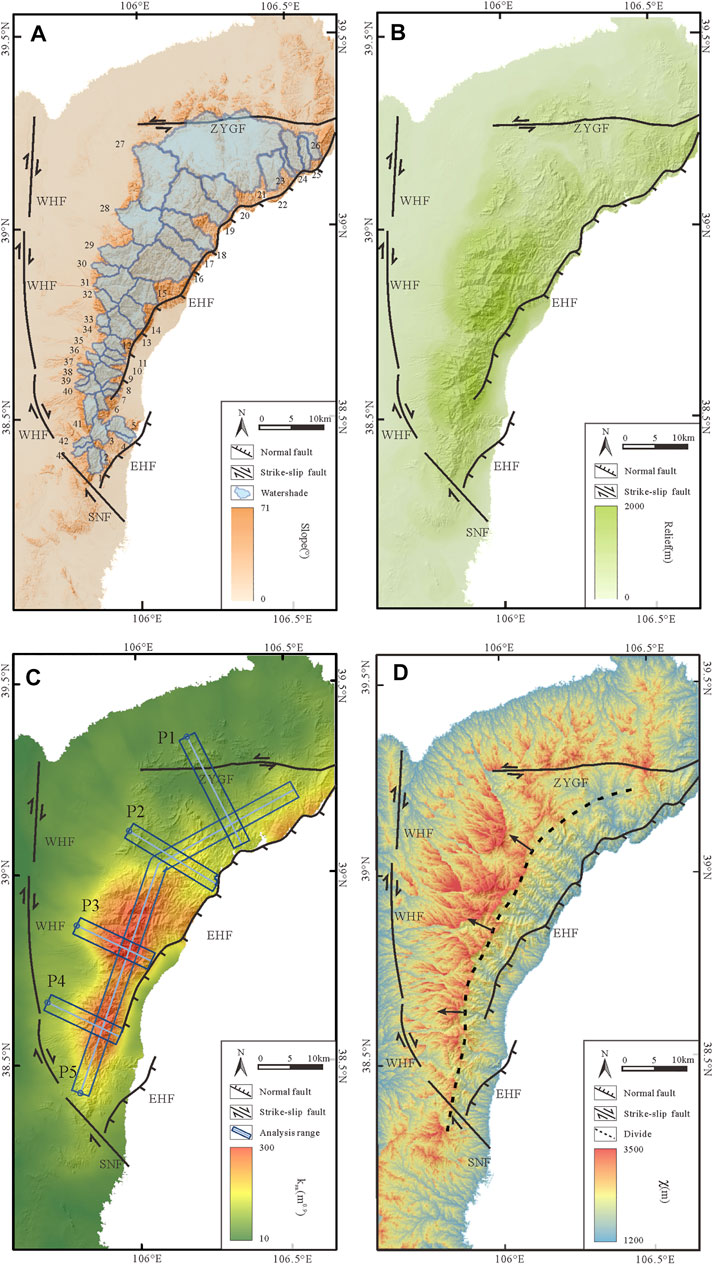
FIGURE 4. (A) Slope map showing the locations of the studied drainage areas. 1–26 are located at the eastern foot of the Helan Shan, and 27–43 are located at the western foot of the Helan Shan. (B) Relief map obtained by calculating the difference between the maximum and minimum elevation values within a radius of 5 km. (C) Normalized steepness index map. The dark blue frame, the blue circle, and the light blue line represent the sampling range starting point and the centerline of the strip, respectively. (D) χ map of the Helan Shan with the active faults. The black lines represent the active faults, black-dotted line represents the divide position, and black arrows represent the divide migration direction.
We extracted and interpolated the χ value of the river channel using the χ-analysis method, obtaining the spatial distribution characteristics of the χ value for the Helan Shan watershed (Figure 4D). The difference in the χ value between both sides of the main divide (N-S direction) showed that the χ value on the western side was notably higher than that on the eastern side.
The relief, ksn, and slope of the Helan Shan were calculated. We generated five combined swath profiles with a width of 10 km, one of which was parallel to the mountain range while the others were perpendicular (Figure 4C). The spatial distribution of geomorphic indices showed that the ksn in the southern Helan Shan was >150 m0.9 and there were two peaks at approximately 8 and 12 km along the mountain range, which is close to the northern side. The strip analysis profiles showed that the ksn in the western Helan Shan was slightly less than that in the eastern Helan Shan. The local relief was also higher along the southern side of the Helan Shan, which was maintained at > 1,200 m, while it ranged from 800 to 1,000 m on the northern side. The slope generally ranged from 15 to 25°, whose distribution was coupled to the topography, local relief, and normalized steepness index (Figure 5).
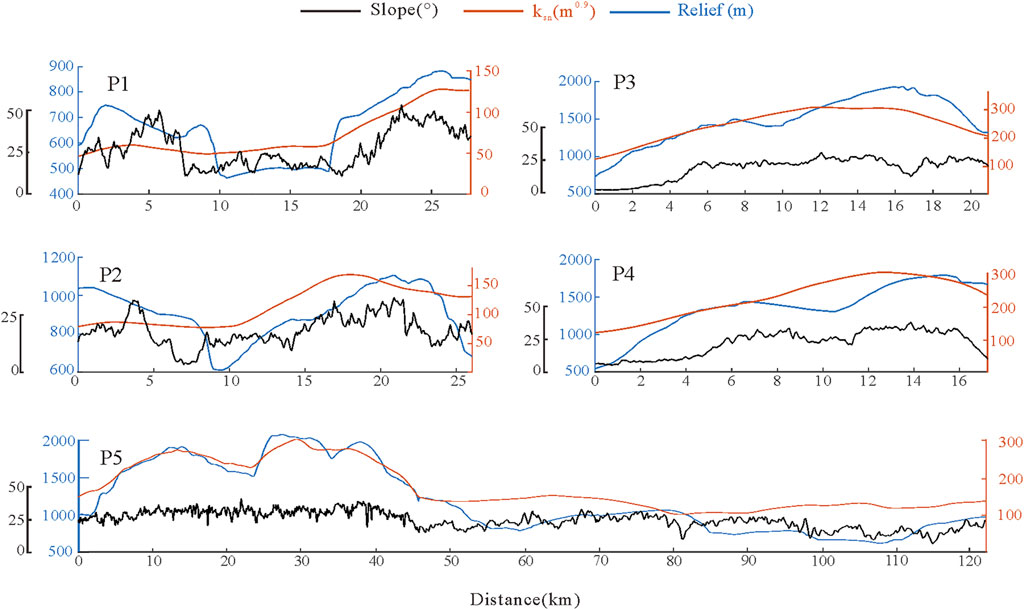
FIGURE 5. Five strip analysis profiles. Strip analysis profiles include the relief, ksn, and slope. Black, orange, and blue present the slope, ksn, and relief, respectively.
Trunk streams within each watershed were analyzed using the χ-z methodology with a reference concavity of 0.45 (Whipple and Tucker, 1999; Wobus et al., 2006; Kirby and Whipple, 2012; Perron and Royden, 2013) (Figures 6C–H). Some bedrock channels (streams 42 and 43 in the western Helan Shan; streams 4 and 5 in the eastern Helan Shan) were stable and had no notable knickpoints; these channels had continuous and concave-up longitudinal profiles. Channels with knickpoints occurred in lower reaches with a high steepness index of ∼120 m0.9 in the eastern Helan Shan and ∼109 m0.9 in the western Helan Shan. The upper reaches had lower steepness index values of ∼67 m0.9 in the eastern Helan Shan and ∼68 m0.9 in the western Helan Shan, approximately half of that of downstream areas. The similar ksn values in the upper reaches may indicate an equal rate of tectonic uplift in terms of the latitude before tectonic activity. The spatial distribution of the knickpoints showed that no knickpoint was located on lithological contacts or along faults, indicating that knickpoint formation had no relationship with lithology.
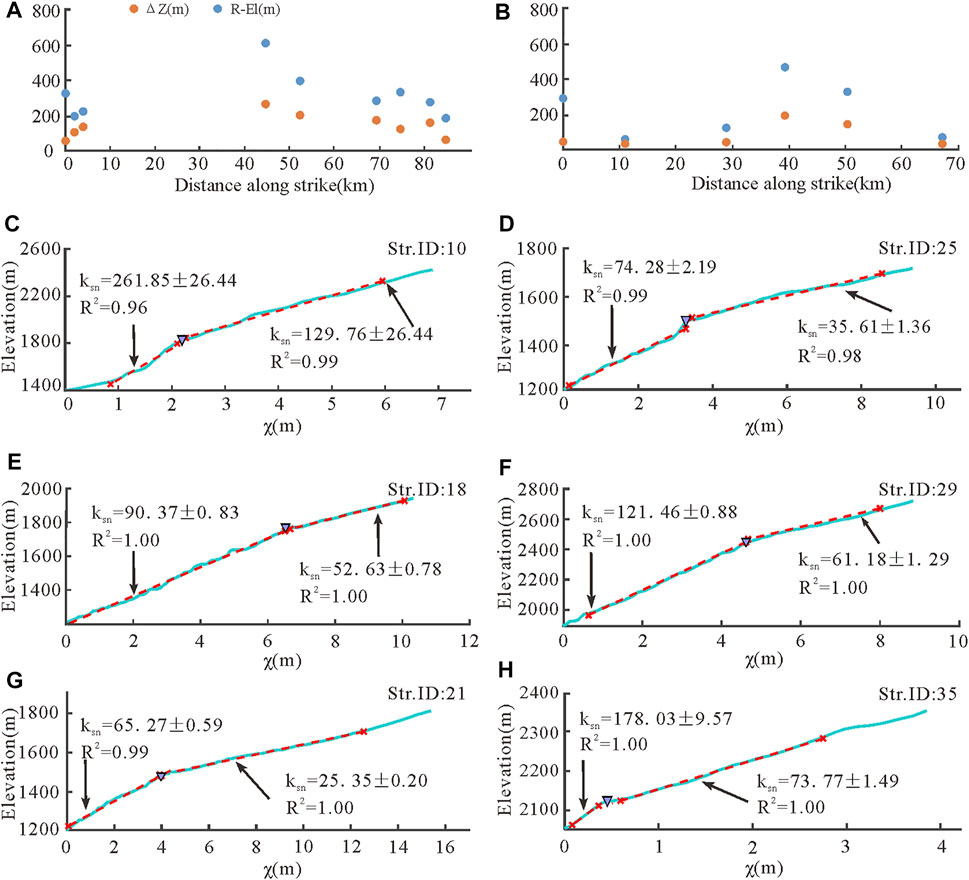
FIGURE 6. (A–B) ΔZ and R–El along the direction of the scatter point distribution map. R–El indicates the relative knickpoint elevation. The abscissa represents the projection distance of the streams along strike from the southernmost stream to the northernmost stream. Here, A represents the eastern Helan Shan, using stream 10 as the starting point; B represents the western Helan Shan, using stream 40 as the starting point. (C–H) Analysis results of the fluvial longitudinal profiles. Typical river longitudinal profiles in different parts of the study area are shown in the figure. The Str. ID is the stream number shown in Figure 4A. Blue lines indicate the original χ-z profiles, red-dashed lines indicate the regressed χ-z profiles, and the red cross represents the start and end of the fitting. Abrupt changes in the slope were classified as knickpoints denoted by dark blue triangles.
We extracted and analyzed a large number of knickpoint parameters (Table 1). The average relative elevation of the knickpoints was approximately 317 m in the eastern Helan Shan and approximately 230 m in the western Helan Shan. Here, ΔZ was calculated based on the ksn and relative elevation, with an average of approximately 143 m in the eastern Helan Shan and approximately 74 m in the western Helan Shan. Both parameters showed a downward trend from the south to the north. The χ-analysis yielded a good linear relationship between χ and elevation, with a mean R2 of ∼0.99.
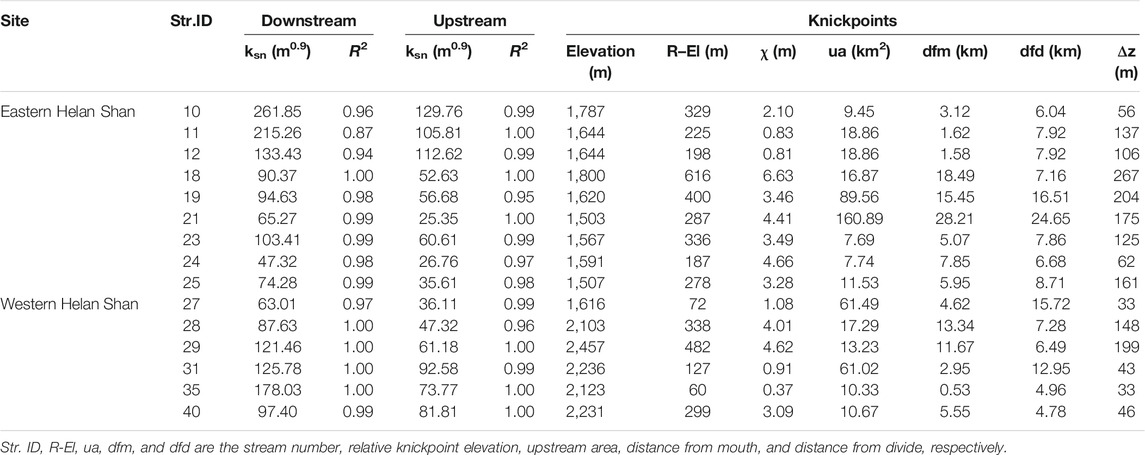
TABLE 1. Results of the stream profile analysis in the Helan Shan.
The normalized steepness index is proportional to the strength of tectonic activity. The result of the normalized steepness index distribution may indicate that the tectonic uplift rate in the southern and eastern Helan Shan was higher than that in the northern and western Helan Shan, which is consistent with the current topography, local relief, and slope. However, lithology also had an influence on the slope index, n, and erosion coefficient, K, thereby controlling the river incision process, which consequently affected the channel shape and steepness index (Di Biase, 2018; Forte et al., 2016). Precipitation can affect the erosion coefficient, K, and concavity, θ; increased precipitation often results in a decrease in topographic undulations and the steepness coefficient (Zaprowski, 2005; Whipple 2009; Chen et al., 2019). As the precipitation was mainly concentrated in mountainous areas with small changes (Figure 7B), this had a limited effect on divide migration. The relative arid climatic conditions in the Helan Shan (i.e., the annual precipitation is relatively uniform and <330 mm/yr), where carbonate rocks have stronger erosion resistance than clastic rocks, reduce the steepness index. The carbonate rocks of the Helan Shan are mainly distributed in the south (Figure 7A); therefore, the increased steepness index in the south than that in the north is not due to differences in the lithology. As the normalized steepness is a reflection of the tectonic strength, we suggest that the eastern piedmont normal fault has mainly controlled the tectonic activity in the Helan Shan. The mountain range has tilted toward the north and west, which has been induced by the spatial differences in the uplift rate. Moreover, previous studies on active tectonics in the Helan Shan have revealed the spatial distribution of the tectonic intensity, whose results are also consistent with those presented here.
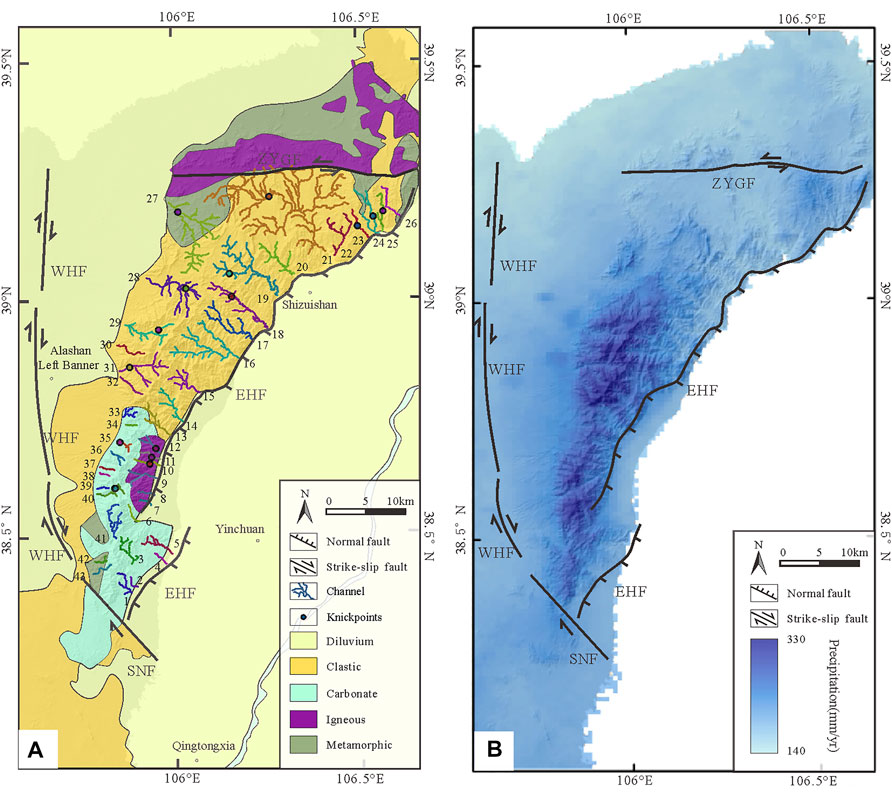
FIGURE 7. (A) The lithology and knickpoints distribution map. The distribution of lithology is modified from Geological Map of Ningxia Hui Autonomous Region, the People’s Republic of China (2014). The knickpoints were identified from the χ-analysis of each stream. No knickpoints were located on lithological contacts or faults. (B) Mean annual rainfall shown over hillshade. Data comes from http://climatedataguide.ucar.edu/.
Furthermore, χ values are widely used to determine the stability of the drainage divide; therefore, the variance on different sides of the main divide indicates that the divide tended to migrate westward. The stability of the watershed of the basin may be affected by many factors, such as differences in precipitation or lithology (Willett, 1999; Goren et al., 2014b; Forte and Whipple, 2018), changes in erosion base levels (Goren et al., 2014b; Forte and Whipple, 2018), and asymmetric tectonic uplift (Goren et al., 2014b; Willett et al., 2014; Whipple et al., 2017). The lithology and precipitation of the Helan Shan is basically symmetrically distributed along the divide (Figures 7A,B), and rivers in the two foothills have the Yellow River as the same erosion base level. These factors are difficult to explain the divide migration in the Helan Shan. Given that the Helan Shan is bound by the western and eastern piedmont fault, we suggest that the difference in the tectonic intensity of the two boundary faults influenced the divide migration (i.e., the tectonic strength of the eastern piedmont fault was higher than that of the western piedmont fault); the eastern piedmont fault dominantly shaped the fluvial landform. The χ-map was also coupled to the result of the ksn distribution characteristics.
Knickpoints on the channel profiles in the 46 watersheds were associated with an abrupt change in the slope of the χ-elevation plots. The normalized steepness index downstream of the knickpoints was approximately twice as high as that upstream; the longitudinal profiles of these channels had a notable broken line with steep downward and gentle upward characteristics, implying the occurrence of a river incision-accelerated event. Most of the rivers in the Helan Shan flow through a single lithological unit; almost all of the knickpoints are distributed at non-lithological boundaries, which eliminates lithological differences as a potential cause (Figure 7A). Moreover, the dryer and colder climate based on δ18O records from the strata causes difficulties when attempting to interpret the origin of the knickpoints (Zachos et al., 2001; Zhang et al., 2010; Peng et al., 2016). Therefore, climatic factors and lithology cannot explain the accelerated incision of the bedrock channels in this area. Knickpoint origination is a response to tectonic acceleration events.
Additionally, we calculated the response time of the Helan Shan knickpoints based on the paleochannel reconstruction method. The results showed that the average response time of the knickpoints was 0.38 Ma in the eastern Helan Shan and 0.33 Ma in western Helan Shan when the slope index n, was set to/predefined as 1. However, as various conditions, such as lithology and climate, affect the slope index n, its value may not be 1 under ideal conditions. Here, we changed the slope index, n, from 0.5 to 1.5 at steps of 0.1 based on previous studies (Figure 8). Finally, the response time of the knickpoint was limited to 0.1–1.4 Ma (Figure 8). The response time of the bedrock channel located at the northern side of the Helan Shan was later than that located at the southern side, which may suggest that the acceleration of Helan tectonic activity was not simultaneous, that is, tectonic activity first affected the southern area and then propagated northward.
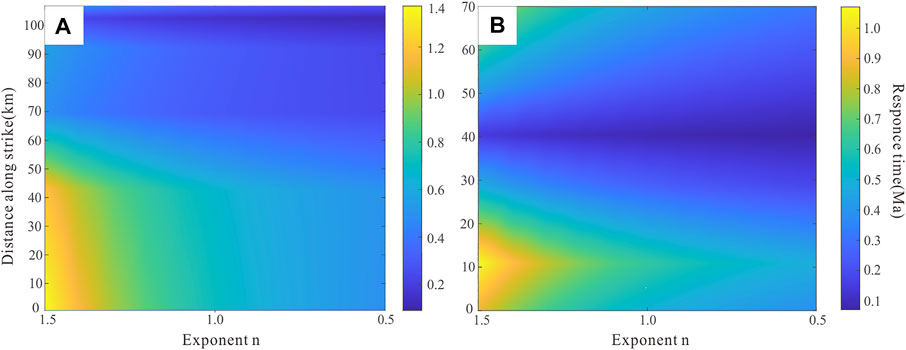
FIGURE 8. Calculated response time along the direction of the Helan Shan. Yellow represents a larger response time while blue represents a smaller response time. The ordinate represents the projection distance of the streams along strike from the southernmost stream to the northernmost stream. (A) represents the eastern Helan Shan, using stream 10 as the starting point and (B) represents the western Helan Shan, using stream 40 as the starting point.
Previous studies on neotectonics indicate that the Helan Shan experienced a rapid southwest tilting tectonic pattern from 10 to 20 Ma (Liu et al., 2010) (Figure 9). However, the active tectonics and ksn index show that the uplift rate of the southern part of the Helan Shan is currently faster than that of the northern part, which indicates that the spatial pattern of the tectonic activity has experienced at least one transformation. Moreover, the northeastward propagation of the Tibetan Plateau has controlled the tectonic deformation and evolution along the northeastern margin of the plateau, inducing a series of tectonic events in chronological order. Current research has shown that northeast extension reached the Niushou Shan fault at approximately the end of the Pliocene (∼2.7 Ma). Additionally, the Yellow River in the Niushou Shan area also responded to this event in the early Pleistocene (Liang et al., 2013). The knickpoints in the Helan Shan formed in the Pleistocene, which demonstrates that they most likely occurred during tectonic pattern transformation in the Helan Shan and when the Tibetan Plateau reached the Helan Shan (Figure 9). We suggest that the tectonic transformation of the Helan Shan may have occurred in the Pleistocene as a result of Tibetan Plateau expansion.
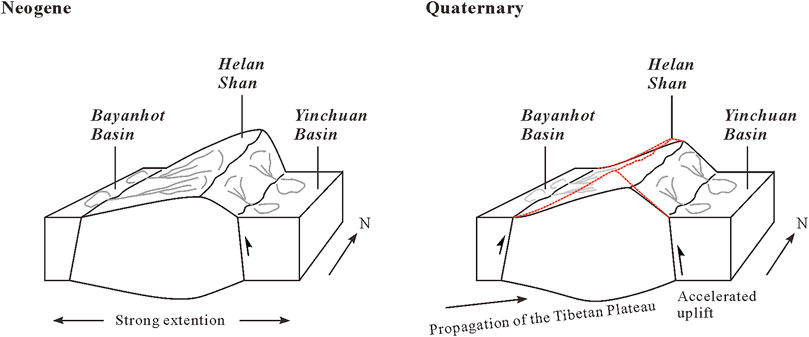
FIGURE 9. Tectonic transformation model of the Helan Shan. The orange-dashed lines indicate the future topography. The embryo of the Helan Shan formed via a strong extension of the Ordos Block in the late Neogene, which appeared as a tilting tectonic model in the southwest direction (Liu et al., 2010). In the early Quaternary, expansion of the Tibetan Plateau affected the Helan Shan; the uplift rate of its southern end increased and the pattern of tectonic uplift changed to a northwest tilt. The Helan Shan will likely form topography characterized by a high in the south and a low in the north in the future.
In this study, we investigated the various geomorphic indices and the response of channels based on quantitative geomorphology analysis. We draw the following conclusions:
1. The bedrock channel of the Helan Shan is segmented, which indicates that the channel has experienced an accelerated incision event. Based on the influence of lithology and climate, we suggest that this is the result of accelerated tectonic uplift.
2. The development and evolution characteristics of the Helan Shan drainage basin show that the main divide tended to migrate toward the western Helan Shan, which demonstrates that the EHF was the main controlling fault with respect to tectonic uplift and deformation.
3. The spatial variance in the geomorphic index of the Helan Shan reflects the occurrence of at least one tectonic transformation event that shifted the tilting tectonic model from the southwest to the northwest during the Pleistocene (0.1–1.4 Ma), which may have been caused by the outward expansion of the northeastern Tibetan Plateau.
The raw data supporting the conclusion of this article will be made available by the authors, without undue reservation.
WZ and YL contributed to the conception of this study. WZ and DZ provided funding for the study. YJ provided the basic code and polished the study. YL completed the experiment with the help of HZ and TL. YL and WZ wrote the manuscript. All authors contributed to manuscript revision and discussion and approved the submitted version.
This work was supported by the National Key Research and Development Program of China (2017YFC1500101), the National Science Foundation of China (42174062, 41774049, 41872204), the second Tibetan Plateau Scientific Expedition and Research program (STEP) (2019QZKK0901), and Guangdong Province Introduced Innovative R&D Team of Geological Processes and Natural Disasters around the South China Sea (2016ZT06N331).
The authors declare that the research was conducted in the absence of any commercial or financial relationships that could be construed as a potential conflict of interest.
All claims expressed in this article are solely those of the authors and do not necessarily represent those of their affiliated organizations, or those of the publisher, the editors, and the reviewers. Any product that may be evaluated in this article, or claim that may be made by its manufacturer, is not guaranteed or endorsed by the publisher.
Berlin, M., and Anderson, R. (2007). Modeling of Knickpoint Retreat on the Roan Plateau, Western Colorado. J. Geophys. Res. Earth Surf. 112 (3), 1–16. doi:10.1029/2006jf000553
Chen, S.-A., Michaelides, K., Grieve, S. W. D., and Singer, M. B. (2019). Aridity Is Expressed in River Topography Globally. Nature 573 (7775), 573–577. doi:10.1038/s41586-019-1558-8
Clark, M., Farley, K., Zheng, D., Wang, Z., and Duvall, A. (2010). Early Cenozoic Faulting of the Northern Tibetan Plateau Margin from Apatite (U-Th)/He Ages. Earth Planet. Sci. Lett. 296 (1–2), 78–88. doi:10.1016/j.epsl.2010.04.051
Darby, B., and Ritts, B. (2002). Mesozoic Contractional Deformation in the Middle of the Asian Tectonic Collage: the Intraplate Western Ordos Fold–Thrust belt, China. Earth Planet. Sci. Lett. 205 (1), 13–24. doi:10.1016/s0012-821x(02)01026-9
Deng, Q., and Liao, Y. (1996). Paleoseismology along the Range-Front Fault of Helan Mountains, north central China. J. Geophys. Res. 101 (B3), 5873–5893. doi:10.1029/95jb01814
Deng, Q., Zhang, P., Ran, Y., Yang, X., Min, W., and Chu, Q. (2003). Basic Characteristics of Active Tectonics of China. Sci. China, Ser. D: Earth Sci. 46 (4), 356–372. doi:10.1360/03ys9030
DiBiase, R. A. (2018). Short Communication: Increasing Vertical Attenuation Length of Cosmogenic Nuclide Production on Steep Slopes Negates Topographic Shielding Corrections for Catchment Erosion Rates. Earth Surf. Dynam. 6 (4), 923–931. doi:10.5194/esurf-6-923-2018
Du, P. (2010). Studying on the Active Characteristics and Paleoearthquake of the Eastern piedmont Fault of Helan Mountain in the Late Quaternary. Beijing: China University of Geosciences. [dissertation/master’s thesis].
Duvall, A., Clark, M., Pluijm, B., and Li, C. (2011). Direct Dating of Eocene Reverse Faulting in Northeastern Tibet Using Ar-Dating of Fault Clays and Low-Temperature Thermochronometry. Earth Planet. Sci. Lett. 304 (3–4), 520–526. doi:10.1016/j.epsl.2011.02.028
England, P., and Molnar, P. (1990). Surface Uplift, Uplift of Rocks, and Exhumation of Rocks. Geol 18 (12), 1173–1177. doi:10.1130/0091-7613(1990)018<1173:suuora>2.3.co;2
Forte, A. M., and Whipple, K. X. (2018). Criteria and Tools for Determining Drainage divide Stability. Earth Planet. Sci. Lett. 493, 102–117. doi:10.1016/j.epsl.2018.04.026
Forte, A. M., and Whipple, K. X. (2019). Short Communication: The Topographic Analysis Kit (TAK) for TopoToolbox. Earth Surf. Dynam. 7 (1), 87–95. doi:10.5194/esurf-7-87-2019
Forte, A. M., Yanites, B. J., and Whipple, K. X. (2016). Complexities of Landscape Evolution during Incision through Layered Stratigraphy with Contrasts in Rock Strength. Earth Surf. Process. Landforms 41, 1736–1757. doi:10.1002/esp.3947
Fox, M., Goren, L., May, D. A., and Willett, S. D. (2014). Inversion of Fluvial Channels for Paleorock Uplift Rates in Taiwan. J. Geophys. Res. Earth Surf. 119 (9), 1853–1875. doi:10.1002/2014jf003196
Goren, L., Fox, M., and Willett, S. D. (2014a). Tectonics from Fluvial Topography Using Formal Linear Inversion: Theory and Applications to the Inyo Mountains, California. J. Geophys. Res. Earth Surf. 119 (8), 1651–1681. doi:10.1002/2014jf003079
Goren, L., Willett, S. D., Herman, F., and Braun, J. (2014b). Coupled Numerical-Analytical Approach to Landscape Evolution Modeling. Earth Surf. Process. Landforms 39 (4), 522–545. doi:10.1002/esp.3514
Hack, J. (1957). Studies of Longitudinal Profiles in Virginia and Maryland. J. Res. US Geol. Surv. 294, 208–209.
Hack, J. (1973). Stream-Profile Analysis and Stream-Gradient Index. J. Res. US Geol. Surv. 1 (04), 421–429.
Kent, E., Boulton, S. J., Whittaker, A. C., Stewart, I. S., and Cihat Alçiçek, M. (2017). Normal Fault Growth and Linkage in the Gediz (Alaşehir) Graben, Western Turkey, Revealed by Transient River Long-Profiles and Slope-Break Knickpoints. Earth Surf. Process. Landforms 42, 836–852. doi:10.1002/esp.4049
Kirby, E., and Whipple, K. X. (2012). Expression of Active Tectonics in Erosional Landscapes. J. Struct. Geol. 44, 54–75. doi:10.1016/j.jsg.2012.07.009
Lei, Q., Zhang, P., Zheng, W., Chai, C., Wang, W., Du, P., et al. (2016). Dextral Strike-Slip of Sanguankou-Niushoushan Fault Zone and Extension of Arc Tectonic belt in the Northeastern Margin of the Tibet Plateau. Sci. China Earth Sci. 59 (5), 1025–1040. doi:10.1007/s11430-016-5272-1
Liang, H., Zhang, K., and Fu, J. (2013). The Neotctonics in the Niushou Mountains, the Northeastern Margin of the Tibetan Plateau, China and its Impact on the Evolution of the Yellow River. Earth Sci. Front. 20 (4), 182–189.
Liu, Y., Shishov, T., Shi, J., Vaganov, E., Sun, J., Cai, Q., et al. (2004). Prediction of Precipitation Trend in Helan Mountain in Western Inner Mongolia and Baiyin Obao in Eastern Inner Mongolia in the Next 20 Years. Chin. Sci. Bull. 49 (3), 270–274. doi:10.1007/bf02900326
Liu, J., Zhang, P., Zheng, D., Wan, J., Wang, W., Du, P., et al. (2010). Pattern and Timing of Late Cenozoic Rapid Exhumation and Uplift of the Helan Mountain, China. Sci. China Earth Sci. 53 (3), 345–355. doi:10.1007/s11430-010-0016-0
Molnar, P., and Tapponnier, P. (1975). Cenozoic Tectonics of Asia: Effects of a Continental Collision: Features of Recent continental Tectonics in Asia Can Be Interpreted as Results of the India-Eurasia Collision. Science 189 (4201), 419–426. doi:10.1126/science.189.4201.419
Peng, T., Li, J., Song, C., Guo, B., Liu, J., Zhao, Z., et al. (2016). An Integrated Biomarker Perspective on Neogene-Quaternary Climatic Evolution in NE Tibetan Plateau: Implications for the Asian Aridification. Quat. Int. 399, 174–182. doi:10.1016/j.quaint.2015.04.020
Perron, J. T., and Royden, L. (2013). An Integral Approach to Bedrock River Profile Analysis. Earth Surf. Process. Landforms 38 (6), 570–576. doi:10.1002/esp.3302
Rohrmann, A., Kapp, P., Carrapa, B., Reiners, P. W., Guynn, J., Ding, L., et al. (2012). Thermochronologic Evidence for Plateau Formation in central Tibet by 45 Ma. Geology 40 (2), 187–190. doi:10.1130/g32530.1
Royden, L., and Taylor Perron, J. (2013). Solutions of the Stream Power Equation and Application to the Evolution of River Longitudinal Profiles. J. Geophys. Res. Earth Surf. 118 (2), 497–518. doi:10.1002/jgrf.20031
Royden, L. H., Burchfiel, B. C., and van der Hilst, R. D. (2008). The Geological Evolution of the Tibetan Plateau. Science 321 (5892), 1054–1058. doi:10.1126/science.1155371
Schwanghart, W., and Kuhn, N. J. (2010). TopoToolbox: A Set of Matlab Functions for Topographic Analysis. Environ. Model. Softw. 25, 770–781. doi:10.1016/j.envsoft.2009.12.002
Schwanghart, W., and Scherler, D. (2014). Short Communication: TopoToolbox 2 - MATLAB-Based Software for Topographic Analysis and Modeling in Earth Surface Sciences. Earth Surf. Dynam. 2 (1), 1–7. doi:10.5194/esurf-2-1-2014
Stock, J. D., and Montgomery, D. R. (1999). Geologic Constraints on Bedrock River Incision Using the Stream Power Law. J. Geophys. Res. 104 (B3), 4983–4993. doi:10.1029/98jb02139
Tapponnier, P., Xu, Z., Roger, F., Meyer, B., Arnaud, N., Wittlinger, G., et al. (2001). Oblique Stepwise Rise and Growth of the Tibet Plateau. Science 294 (5547), 1671–1677. doi:10.1126/science.105978
Wang, W., Zhang, P., Kirby, E., Wang, L., Zhang, G., Zheng, D., et al. (2011). A Revised Chronology for Tertiary Sedimentation in the Sikouzi basin: Implications for the Tectonic Evolution of the Northeastern Corner of the Tibetan Plateau. Tectonophysics 505 (1), 100–114. doi:10.1016/j.tecto.2011.04.006
Wang, Y., Schoenbohm, L. M., Zhang, B., Granger, D. E., Zhou, R., Zhang, J., et al. (2017). Late Cenozoic Landscape Evolution along the Ailao Shan Shear Zone, SE Tibetan Plateau: Evidence from Fluvial Longitudinal Profiles and Cosmogenic Erosion Rates. Earth Planet. Sci. Lett. 472, 323–333. doi:10.1016/j.epsl.2017.05.030
Wang, Y., Zheng, D., Pang, J., Zhang, H., Wang, W., Yu, J., et al. (2018). Using Slope-Area and Apatite Fission Track Analysis to Decipher the Rock Uplift Pattern of the Yumu Shan: New Insights into the Growth of the NE Tibetan Plateau. Geomorphology 308, 118–128. doi:10.1016/j.geomorph.2018.02.006
Whipple, K. X., and Tucker, G. E. (1999). Dynamics of the Stream-Power River Incision Model: Implications for Height Limits of Mountain Ranges, Landscape Response Timescales, and Research Needs. J. Geophys. Res. 104 (B8), 17661–17674. doi:10.1029/1999jb900120
Whipple, K. X., Forte, A. M., Dibiase, R. A., Gasparini, N. M., and Ouimet, W. B. (2017). Timescales of Landscape Response to divide Migration and Drainage Capture: Implications for the Role of divide Mobility in Landscape Evolution. J. Geophys. Res. Earth Surf. 122 (1), 248–273. doi:10.1002/2016jf003973
Whipple, K. X. (2001). Fluvial Landscape Response Time: How Plausible Is Steady-State Denudation? Am. J. Sci. 301 (4–5), 313–325. doi:10.2475/ajs.301.4-5.313
Whipple, K. X. (2004). Bedrock Rivers and the Geomorphology of Active Orogens. Annu. Rev. Earth Planet. Sci. 32, 151–185. doi:10.1146/annurev.earth.32.101802.120356
Whipple, K. X. (2009). The Influence of Climate on the Tectonic Evolution of Mountain Belts. Nat. Geosci. 2, 97–104. doi:10.1038/ngeo413
Willett, S. D., McCoy, S. W., Perron, J. T., Goren, L., and Chen, C. Y. (2014). Dynamic Reorganization of River Basins. Science 343 (6175), 1248765. doi:10.1126/science.1248765
Willett, S. D. (1999). Orogeny and Orography: The Effects of Erosion on the Structure of Mountain Belts. J. Geophys. Res. 104 (B12), 28957–28981. doi:10.1029/1999jb900248
Wobus, C., Whipple, K., Kirby, E., Snyder, N., Johnson, J., Spyropolou, K., et al. (2006). Tectonics from Topography: Procedures, Promise, and Pitfalls. Spec. Paper Geol. Soc. Am. 398, 55–74. doi:10.1130/2006.2398(04)
Yang, X., and Dong, Y. (2018). Mesozoic and Cenozoic Multiple Deformations in the Helanshan Tectonic Belt, Northern China. Gondwana Res. 60, 34–53. doi:10.1016/j.gr.2018.03.020
Yang, R., Willett, S. D., and Goren, L. (2015). In Situ low-relief Landscape Formation as a Result of River Network Disruption. Nature 520 (7548), 526–529. doi:10.1038/nature14354
Yang, J., Zheng, W., Wang, Y., Bi, H., Zhang, D., Zhang, P., et al. (2020). Quantitative Geomorphological Constraints on the Landform Evolution of the Current Active Boundary of the Northeastern Tibetan Plateau. Geomorphology 358, 107120. doi:10.1016/j.geomorph.2020.107120
Yin, A., and Harrison, T. M. (2000). Geologic Evolution of the Himalayan-Tibetan Orogen. Annu. Rev. Earth Planet. Sci. 28, 211–280. doi:10.1146/annurev.earth.28.1.211
Yin, A., Dang, Y., Wang, L., Jiang, W., Zhou, S., Chen, X., et al. (2008). Cenozoic Tectonic Evolution of Qaidam basin and its Surrounding Regions (Part 1): The Southern Qilian Shan-Nan Shan Thrust belt and Northern Qaidam basin. Bull. Geol. Soc. Am. 120 (7–8), 813–846. doi:10.1130/b26180.1
Yu, J., Zheng, W., Kirby, E., Zhang, P., Lei, Q., Ge, W., et al. (2016). Kinematics of Late Quaternary Slip along the Yabrai Fault: Implications for Cenozoic Tectonics across the Gobi Alashan Block, China. Lithosphere 8 (3), 199–218. doi:10.1130/l509.1
Zachos, J., Pagani, M., Sloan, L., Thomas, E., and Billups, K. (2001). Trends, Rhythms, and Aberrations in Global Climate 65 Ma to Present. Science 292 (5517), 686–693. doi:10.1126/science.1059412
Zaprowski, B. J. (2005). Climatic Influences on Profile Concavity and River Incision. J. Geophys. Res. 110 (F3), 1–21. doi:10.1029/2004jf000138
Zhang, P., Burchfiel, B., Molnar, P., Zhang, W., Jiao, D., Deng, Q., et al. (1990). Late Cenozoic Tectonic Evolution of the Ningxia-Hui Autonomous Region, China. GSA Bull. 102 (11), 1484–1498. doi:10.1130/0016-7606(1990)102<1484:lcteot>2.3.co;2
Zhang, J., Dickson, C., and Chen, H. (2010). Sedimentary Characteristics of Cenozoic Strata in central-southern Ningxia, NW China: Implications for the Evolution of the NE Qinghai–Tibetan Plateau. J. Asian Earth Sci. 39 (6), 740–759. doi:10.1016/j.jseaes.2010.05.008
Zhang, H., Kirby, E., Pitlick, J., Anderson, R. S., and Zhang, P. (2017). Characterizing the Transient Geomorphic Response to Base‐level Fall in the Northeastern Tibetan Plateau. J. Geophys. Res. Earth Surf. 122 (2), 546–572. doi:10.1002/2015jf003715
Zhao, G., Sun, M., Wilde, S. A., and Sanzhong, L. (2005). Late Archean to Paleoproterozoic Evolution of the North China Craton: Key Issues Revisited. Precambrian Res. 136 (2), 177–202. doi:10.1016/j.precamres.2004.10.002
Zheng, D., Zhang, P., Wan, J., Yuan, D., Li, C., Yin, G., et al. (2006). Rapid Exhumation at ∼8 Ma on the Liupan Shan Thrust Fault from Apatite Fission-Track Thermochronology: Implications for Growth of the Northeastern Tibetan Plateau Margin. Earth Planet. Sci. Lett. 248 (1), 198–208. doi:10.1016/j.epsl.2006.05.023
Zheng, D., Clark, M. K., Zhang, P., Zheng, W., and Farley, K. A. (2010). Erosion, Fault Initiation and Topographic Growth of the North Qilian Shan (Northern Tibetan Plateau). Geosphere 6 (6), 937–941. doi:10.1130/ges00523.1
Zheng, W., Zhang, P., He, W., Yuan, D., Shao, Y., Zheng, D., et al. (2013). Transformation of Displacement between Strike-Slip and Crustal Shortening in the Northern Margin of the Tibetan Plateau: Evidence from Decadal GPS Measurements and Late Quaternary Slip Rates on Faults. Tectonophysics 584, 267–280. doi:10.1016/j.tecto.2012.01.006
Zheng, W., Yuan, D., Zhang, P., Yu, J., Lei, Q., Wang, W., et al. (2016). Tectonic Geometry and Kinematic Dissipation of the Active Faults in the Northeastern Tibetan Plateau and Their Implications for Understanding Northeastward Growth of the Plateau. Quat. Sci. 36 (4), 775–788. doi:10.11928/j.issn.1001-7410.2016.04.01
Zheng, W., Zhang, B., Yuan, D., Chen, G., Zhang, Y., Yu, J., et al. (2021). Tectonic Activity in the Southern Alashan Block and the Latest Boundary of Outward Expansion on the Northeastern Tibetan Plateau,China. J. Earth Sci. Environ. 43 (2), 224–236. doi:10.19814/j.jese.2021.01039
Keywords: Helan Shan, tectonic transformation, fluvial landforms, tectonic geomorphology, Tibetan Plateau
Citation: Li Y, Zheng W, Yang J, Zhang D, Zhou H and Liu T (2022) Early Quaternary Tectonic Transformation of the Helan Shan: Constraints Due To Quantitative Geomorphology. Front. Earth Sci. 10:825849. doi: 10.3389/feart.2022.825849
Received: 30 November 2021; Accepted: 20 January 2022;
Published: 14 February 2022.
Edited by:
Xuhua Shi, Zhejiang University, ChinaReviewed by:
Xiaohui Shi, Northwest University, ChinaCopyright © 2022 Li, Zheng, Yang, Zhang, Zhou and Liu. This is an open-access article distributed under the terms of the Creative Commons Attribution License (CC BY). The use, distribution or reproduction in other forums is permitted, provided the original author(s) and the copyright owner(s) are credited and that the original publication in this journal is cited, in accordance with accepted academic practice. No use, distribution or reproduction is permitted which does not comply with these terms.
*Correspondence: Wenjun Zheng, emhlbmd3ZW5qdW5AbWFpbC5zeXN1LmVkdS5jbg==
Disclaimer: All claims expressed in this article are solely those of the authors and do not necessarily represent those of their affiliated organizations, or those of the publisher, the editors and the reviewers. Any product that may be evaluated in this article or claim that may be made by its manufacturer is not guaranteed or endorsed by the publisher.
Research integrity at Frontiers
Learn more about the work of our research integrity team to safeguard the quality of each article we publish.