
95% of researchers rate our articles as excellent or good
Learn more about the work of our research integrity team to safeguard the quality of each article we publish.
Find out more
ORIGINAL RESEARCH article
Front. Earth Sci. , 27 April 2022
Sec. Structural Geology and Tectonics
Volume 10 - 2022 | https://doi.org/10.3389/feart.2022.825548
This article is part of the Research Topic Effects of Deep Fluids in Hydrocarbon Accumulations in Sedimentary Basins View all 26 articles
 Shanghua Si1,2,3
 Junhao He1Ping Liu4Jiexin Liu4Gongjie Yan4Qingtong Yao5Yong Yang6Xu Chen7Chao Liu1,2,3*
A thermodynamic and hydrocarbon composition model based on VTFlinc software was conducted based on the homogenization temperature of fluid inclusions and gas-to-liquid ratio, and the fluid inclusions’ trapped pressure was calculated. This software does not require the determination of individual inclusions, the composition of the simulation procedure is simple, and the simulation result has certain reliability. The VTFlinc software was used to calculate the trapped pressure of oil inclusions in the Fuyu tight reservoir of the Sanzhao area in the Songliao Basin. The results show the existence of two phases of oil charge. The first phase occurred at the end of the Nenjiang Formation at 79–74 Ma with an oil entrapped pressure of 16.922–19.068 MPa, and pressure coefficient of 1.18–1.26. During the second period in the Sifangtai Mingshui group at 69–64 Ma, the oil entrapped pressure was 20.216–28.830 MPa, and the pressure coefficient was 1.21–1.33. During the two periods, the pressure of the trapped oil inclusions is abnormal, and the pressure coefficient is above 1.2. Abnormal high pressure is the main driving force of hydrocarbon source rock and oil in the Fuyu Formation, as well as an important driving force for the lateral migration of oil in the tight reservoir. The reservoir formation model of the Fuyu tight oil reservoir in the Sanzhao area is a direct high-pressure charging and multi-channel migration accumulation model. The Q-1 source rock and Fuyu oil layer has a direct contact relationship between the source rock and the reservoir.
The Sanzhao area is located in the east of Daqing Changyuan in the northern part of the Songliao Basin, with an area of 6,500 km2. This area deposits thick Mesozoic strata and is a large source sag. Under the control of the basement fault, the area formed seven tertiary tectonic units, such as Shang Jia, Sheng Ping, Northern Song Fangtun, Southern-Zhao Zhou Song Fangtun nose structure, Western Sheng Ping oblique, and Xujiaweizi oblique, which shows a “four nose and three concave” tectonic pattern. Since the 1990s, the study of the geological conditions in the area showed that the Songliao Basin is in a stable stage in the depression period, and the subsequent tectonic activity is relatively weak. In the Qingshankou period, a large-scale river-delta sedimentary system was developed. In the lower part of the Qingshankou Formation with high-quality source rocks, a large area of tight reservoirs of the Fuyu reservoir was developed. The hydrocarbon source rocks of the Qingshankou Formation and near-source charging into the Fuyu tight reservoir formed a wide range of quasi-continuous or continuous oil accumulation (Meng et al., 2014). With further study on tight sandstone reservoirs, many scholars have studied the power of its accumulation. Generally, the abnormally high pressure of the source rocks is the main driving force of oil charging (Zhang and Guan, 1982; Chi et al., 2000; Fu and Wang, 2008; Wang and Wang, 2009; Fu et al., 2009; Yang, 2009; Zhang et al., 2010a). At present, the accumulation power is mainly analyzed through the acoustic logging data, which can only reflect the pressure characteristics of the maximum depth of the source rock and lacks direct research on the oil charging power. The fluid inclusions captured by diagenetic minerals record rich information such as ancient temperature, ancient pressure, and fluid composition. In recent years, the use of inclusion thermodynamic simulations to restore oil and gas accumulation into the ancient temperature and pressure state has become a simple and widely used method.
The PIT simulation method based on different hydrocarbon fluid models is preferred over the other methods (Coveney et al., 1987; Thiéry et al., 2000; Lu et al., 2004; Liu et al., 2007). However, the single hydrocarbon inclusions required by the simulation method are estimated using α (heavy hydrocarbon) and ß (light hydrocarbon) parameters, and their application has some limitations. Previous researchers (Aplin et al., 1999) proposed another inclusion thermodynamic simulation method by using VTFlinc. It has been embedded in the Denmark Calsep company as a module in PVT sim software. The method does not need to determine the composition of hydrocarbon inclusions, making it easy to use and reliable for capture pressure calculation.
Therefore, we used the VTFlinc simulation method to analyze the capture pressure of Fuyu oil inclusions in the Sanzhao area of the Songliao Basin. We then discussed the ancient pressure characteristics of oil charging in the Fuyu oil layer and its significance to oil charging of low-permeability and tight sandstone.
In the present study, the fluid inclusion PVTx simulation method was used to obtain the fluid pressure, and VTFlinc simulation software was used. The basic principle is that the two isomeric lines of the same P-T phase diagram are based on the coherent lines of the immiscible inclusions in the same temperature–pressure coordinate system. These lines must intersect at the capture point known as the isomeric line intersection method.
The following methods were employed: (Meng et al., 2014): The gas-to-liquid ratio of a single hydrocarbon inclusion was accurately measured using a confocal laser scanning microscope; (Zhang et al., 2010a); with the VTFlinc software fluid inclusion component module, the “average composition” of the measured inclusions in each period was obtained as an approximate representation of the constituent of the hydrocarbon inclusions with the salt inclusions in a certain period; and (Chi et al., 2000) the homogenization temperature of the hydrocarbon inclusions and their inter growth aqueous inclusions determined using the above method was approximately the same as that of the saline inclusions at the time of organic inclusion catching. (Wang and Wang, 2009) The temperature of the chemical system was determined by containing hydrocarbons or hydrocarbon inclusions in the PT space of the isochoric line intersection to determine the minimum captured pressure of hydrocarbon fluid inclusions. In Figure 1, the ABC line shows the hydrocarbon or hydrocarbon-containing inclusions. The AB section indicates gas-liquid two-phase coexistence, and point B shows the liquid phase. Point C is approximated by the assumption of the capture temperature of the inclusions; (Fu and Wang, 2008); it corresponds to the capacity of the hydrocarbon or hydrocarbon-containing inclusions known as the minimum trapping pressure (Fu et al., 2009)
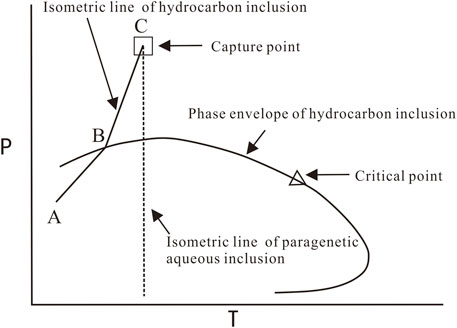
FIGURE 1. Schematic diagram of PVTx thermodynamic simulation.
A total of 20 samples and 17 wells of the Fuyu oil layer in the Sanzhao area were selected (Figure 2), (Zhang and Guan, 1982) and the inclusions in the samples were first identified with a transmission light and fluorescence microscope. The lithology of the sample was mainly silt-stone and calcic silt-stone. The oil inclusions were mainly distributed in the secondary cracks of the quartz, the quartz double edge, dissolve hole charging, sparing crystal calcite, and calcite cement. (Yang, 2009) The occurrence of oil inclusions was mostly in beaded groups with a size of 4–20 μm, and most of them had irregular shapes and similar gas–to-liquid ratios. (Thiéry et al., 2000) The oil inclusions were colorless or light brown under transmitted light, they issued a strong different color under fluorescent light. The four-color fluorescence included yellow, yellow-green, blue-green, and blue-white (Figure 3). (Lu et al., 2004) The oil inclusions in the samples of the Fuyu reservoir in the Zhao-48 well, Sheng-554 well, and the Fang-182 well in the Sanzhao area were well developed. Asphalt charging hole could be seen in Tai 34 well samples (Liu et al., 2007)
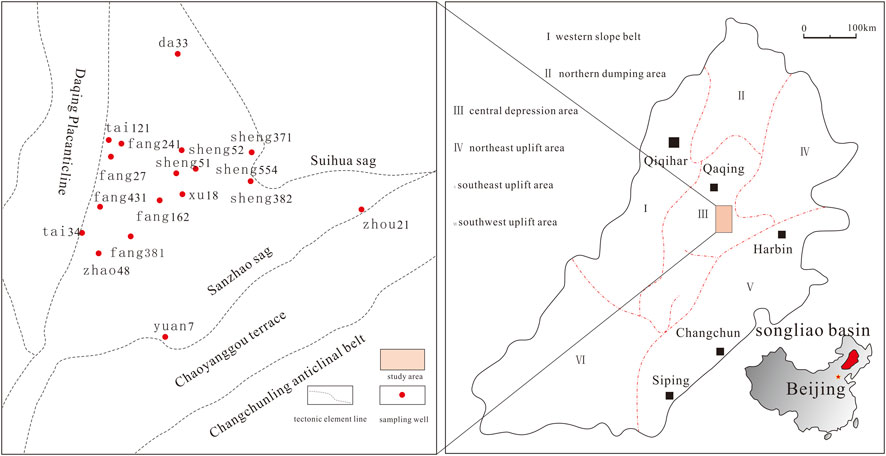
FIGURE 2. Location of the study area and the distribution of the fluid inclusion sampling well.
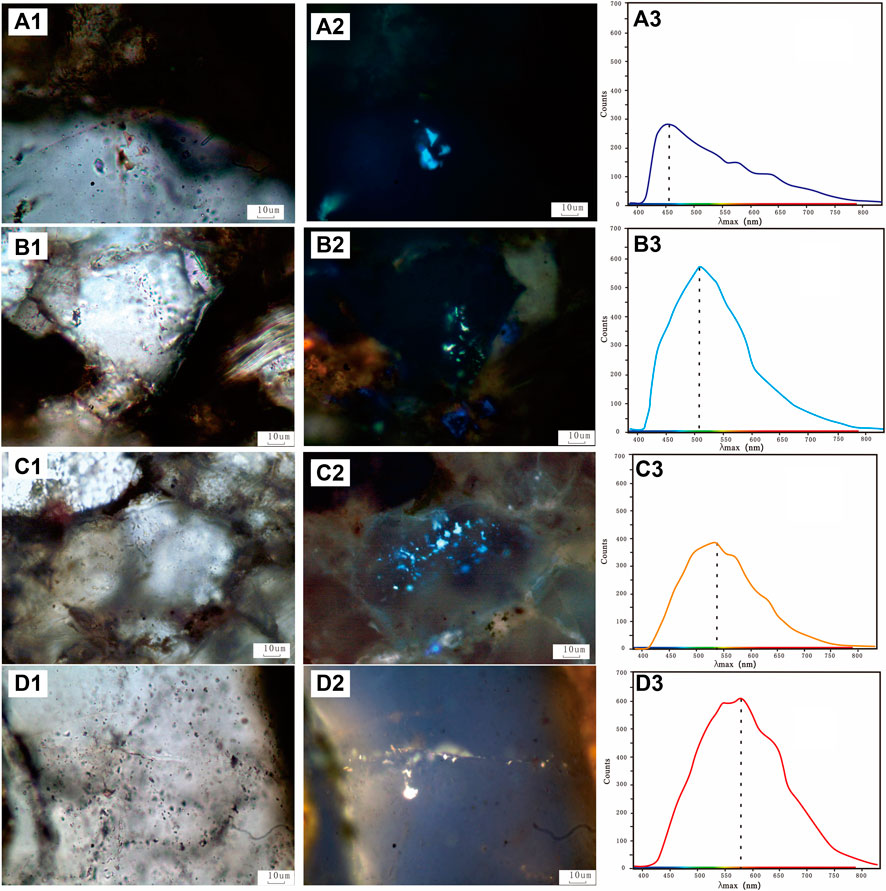
FIGURE 3. Fluorescent color and microscopic fluorescence spectra of oil inclusions in the Fuyu oil reservoir of the Sanzhao area.
A1 and A2: Tai-34 well, 1,903.2 m, siltstone, a large number of blue-white fluorescent oil inclusions could be seen in calcite cement.
B1 and B2: Sheng-554 well, 2,012.58 m, siltstone, a small amount of blue-green fluorescent oil inclusions could be seen in wear quartz particle cracks.
C1 and C2: Zhao-48 well, 1,948.53 m, siltstone, a large number of yellow-green oil inclusions could be seen in quartz particle cracks.
D1 and D2: Fang-182 well, 1,952.68 m, siltstone, a large number of yellow fluorescent oil inclusions could be seen in wear quartz particle cracks.
(A3, B3, C3, and D3 were the microscopic fluorescence spectra).
To measure the composition of the hydrocarbon and brine water in the inclusions and their phase transitions, (Coveney et al., 1987), we used the Linkam MDS600 automatic hot and cold station. According to the characteristics of the inclusions in the samples, the distribution characteristics, and the measurement results of the homogenous temperature, the stages of the fluid activities in the Sanzhao area were analyzed. Four major fluids were captured in the Fuyu reservoir of the Sanzhao area (Aplin et al., 1999)
Stage one: The homogenization temperature of aqueous inclusions ranged from 73.8 to 99.2°C, and that of associated oil inclusions ranged from 51.2 to 79.6°C. Stage two: The homogenization temperature of aqueous inclusions ranged from 100.2 to 119.6°C, and that of oil inclusions ranged from 81.5 to 99.3°C. Stage three: the homogenization temperature of aqueous inclusions ranged from 120.5 to 129.8°C, and that of oil inclusions ranged from 100.8 to 109.4°C. Stage four: (Zhang et al., 2010b): the homogenization temperature of aqueous inclusions ranged from 130.4 to 149.4°C, and that of oil inclusions ranged from 110.8 to 126.2°C (Figure 4).

FIGURE 4. Homogenization temperatures of oil inclusions (left) and their coeval aqueous inclusions (right) in the Fuyu oil reservoir of the Sanzhao area.
The selected hydrocarbon inclusions were performed using the LEICA laser confocal scanning microscope. (Zou et al., 2012) Finally, the three-dimensional images were superimposed and measured (Figure 5) to calculate the gas–to-liquid ratio (Table 1).
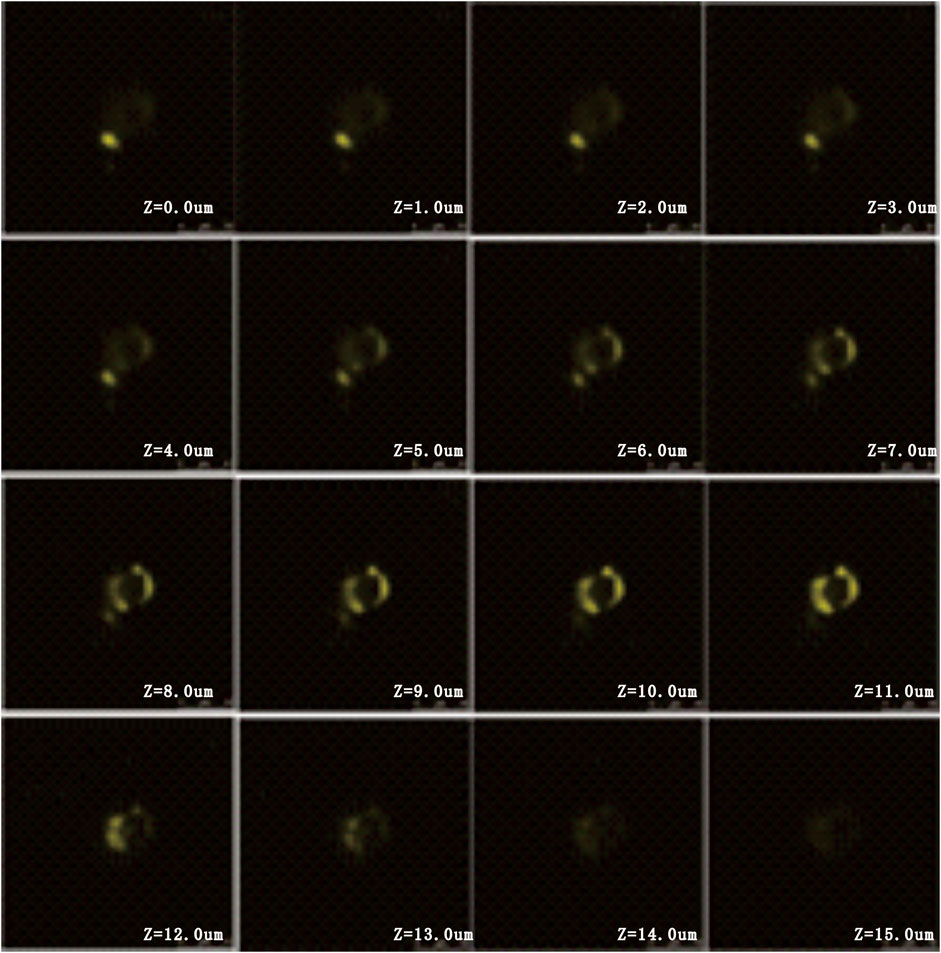
FIGURE 5. Two-dimensional slices of continuous scanning of oil inclusions in the Fang-182 well in the Fuyu oil reservoir by CLSM.
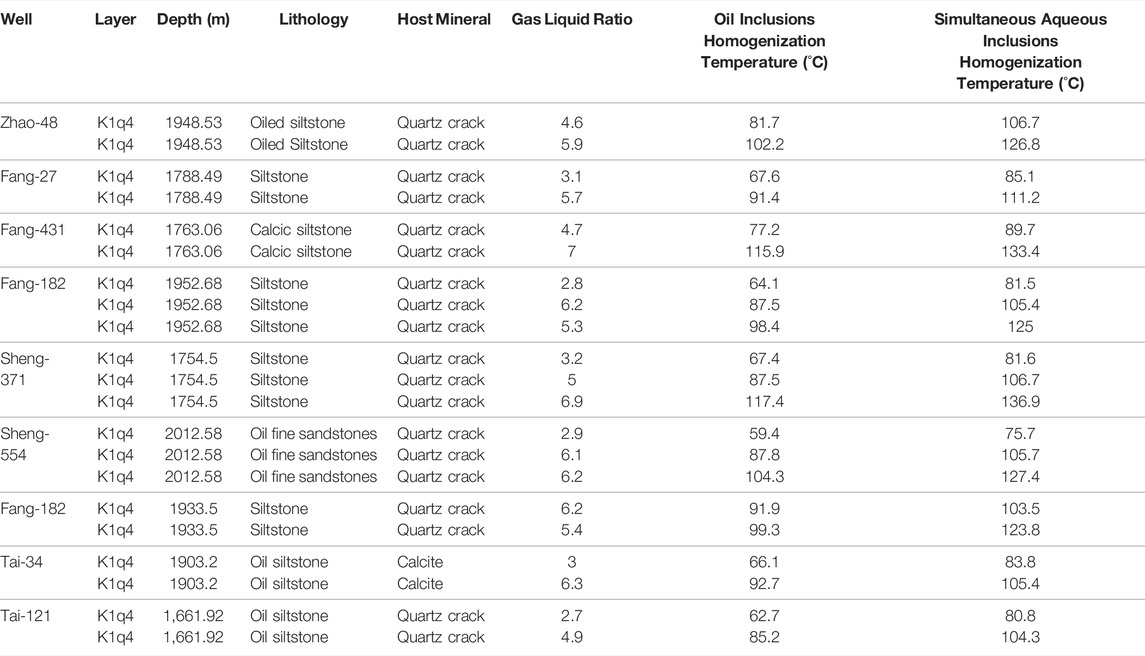
TABLE 1. Gas-to-liquid ratio of oil inclusion by CLSM.
VTFlinc software is used to simulate the capture pressure of oil inclusions. (Bhatti et al., 2020) First, the “data pairs” of the homogenization temperature of the oil inclusions and symbiotic saline inclusion were selected. The homogenization temperature of the oil and aqueous inclusions, the gas-to-liquid ratio of the oil inclusions, and the mole fraction of the components of the fluid inclusions were obtained from the VTFlinc software. (Bloch et al., 2002) Thereafter, the software could calculate the molar volume, saturation pressure, and density of the homogenization temperature of the hydrocarbon inclusions and calculate the saturation pressure at room temperature. (Jiang et al., 2016) The saturated pressure at room temperature was higher than the true internal pressure of the inclusions, and the molar volume at the saturated pressure was lower than the true molar volume in the inclusions, (Jiang et al., 2006), because hydrocarbon inclusions at room temperature are composed of liquid and gas. The actual internal pressure of the inclusions at room temperature could be calculated by alliteratively adjusting the pressure value to calculate the molar volume of the total contents of the inclusions until they matched the molar volume of the material at saturation temperature and pressure. (Yang et al., 2017) Upon heating, the hydrocarbon inclusions changed along the isotropy line on the P–T diagram to the phase line of the relevant composition, with the intersection of the corresponding homogeneous phase. (Zeng et al., 2003) In the simulation process, the initial components adopted the results of medium crude oil sample component analysis of the module of fluid inclusions component in the software as shown in Table 2. The content of C1 was 26.57%, the content of middle molecule hydrocarbons (C2–C6) was 30.47%, (Huang et al., 2001), the content of C7+ was 38.82%, the crude oil density was 0.800 g/cm3, and the viscosity was 15.4 m Pas. (Huang et al., 2019) The simulation results are shown in Table 3.
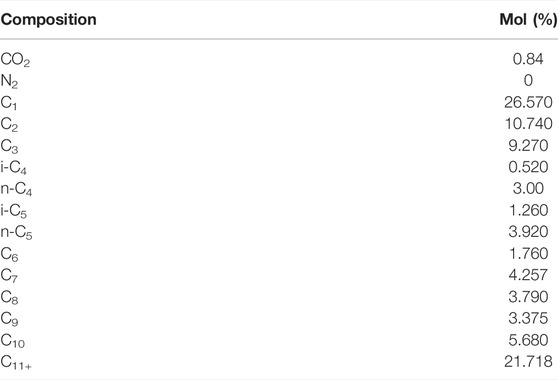
TABLE 2. Composition of crude oil samples in the simulation.
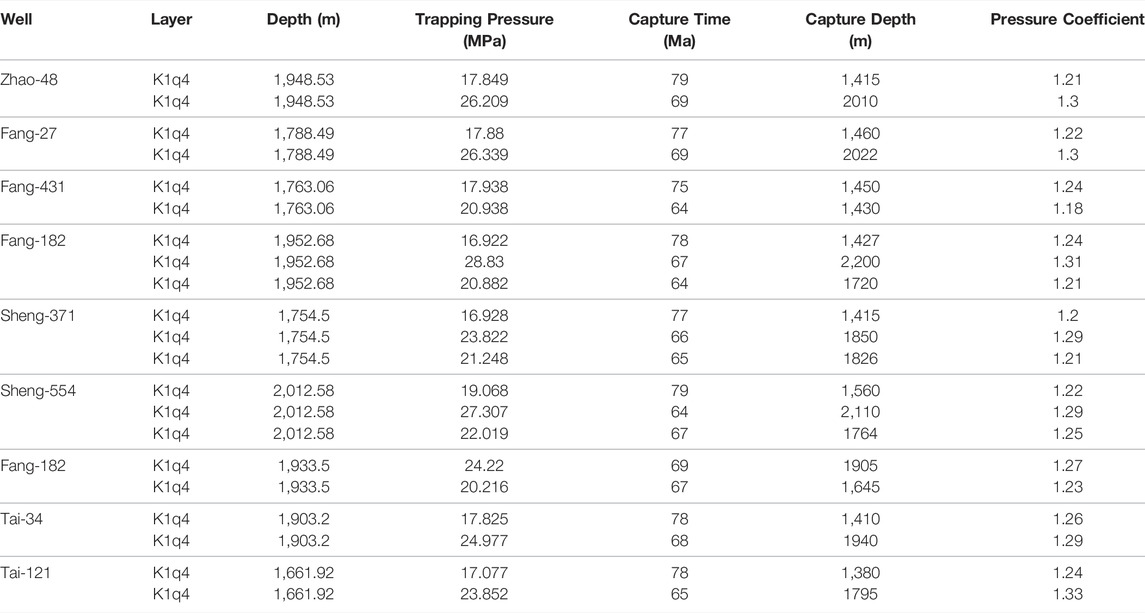
TABLE 3. Reservoir formation period and paleo-pressure in the Fuyu oil reservoir of the Sanzhao area.
By using the Fang-431 well and Zhao-48 well as examples, their paleo-formation-pressure simulation results are as follows:
In the Fuyu oil layer of the Fang 431 well (1,763.06 m), the homogenization temperature in the first stage of aqueous inclusions was 89.7°C, the homogenization temperature of the same stage of oil inclusions was 77.2°C, and the minimum trap pressure was 17.938 MPa. The homogenization temperature in the fourth stage of aqueous inclusions was 133.4°C. (Shi et al., 2004) The homogenization temperature of the same stage of oil inclusions was 115.9°C, and the minimum pressure was 20.938 MPa (Figure 6).
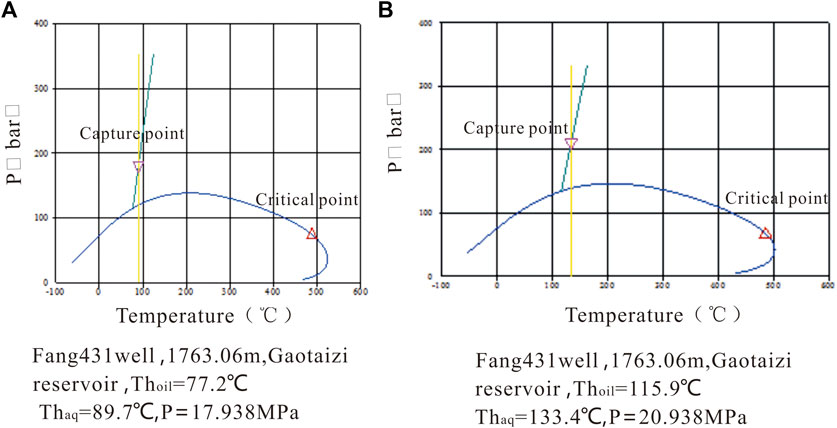
FIGURE 6. PVTx simulation results and P–T diagram of fluid inclusion assemblages in the Fang-431 well in the Fuyu oil reservoir.
In the Zhao-48 well (1,948.53 m) of the Fuyu oil reservoir, the homogenization temperature of the second aqueous inclusions was 106.7°C, while that of the same stage of oil inclusions was 81.7°C, and the minimum capture pressure was 26.209 MPa. The homogenization temperature at the third stage of aqueous inclusions was 126.8°C, the homogenization temperature of the oil inclusions in the same horizon was 102.2°C, and the minimum capture pressure was 21.849 MPa.
Based on the analysis of the paleo-pressure values obtained from the tight reservoirs in the Fuyu Sanzhao area, the pressure coefficient and capture time of tight reservoir inclusions in this area could be obtained on the basis of the ancient burial depth at the time of fluid recovery (Table 3 and Figure 7).
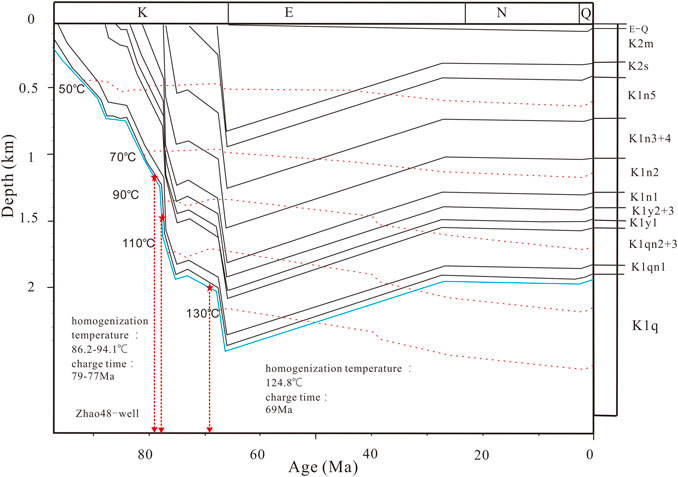
FIGURE 7. Charging stages of hydrocarbon in the Fuyu oil reservoir of the Sanzhao area.
The reservoir formation involved two periods. During the period of 79–74 Ma at the end of the Nenjiang Formation, the first period corresponded to the first stage of charging with capture pressure of 16.922–19.068 MPa and pressure coefficient of 1.18–1.26. The second period occurred in the 69–64 Ma period of Sifangtai–Mingshui Formation, corresponding to the second, third, and fourth stages of oil and gas charging, with capture pressure of 20.216–28.830 MPa and pressure coefficient of 1.21–1.33 (Table 3). The pressure coefficient was above 1.2 based on the characteristics of inclusion capturing. Hence, an abnormal pressure system existed in the capture of the two-phase crude oil inclusions in the Sanzhao area.
Based on the statistics of more than 50 formations in the Fuyu oil layer in the Sanzhao area, the present strati-graphic pressure coefficient of the Fuyu oil layer in this area ranged from 0.9 to 1.29 with an average of 1.06 (Table 4). Based on the pressure data obtained from the formation test, the present formation pressure in some areas of the Fuyu oil layer in the Sanzhao area showed overpressure, but the remaining wells were characterized by normal pressure, (Shi et al., 2003), indicating that the reservoir has undergone overpressure transfer.
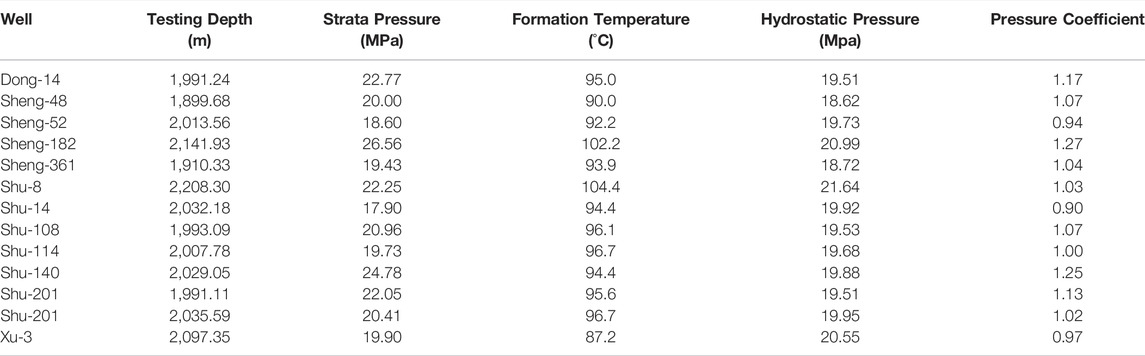
TABLE 4. Formation test data in the Fuyu oil reservoir of the Sanzhao area.
The paleo-pressure of the reservoirs during the reservoir formation of the Fuyu oil layer in the Sanzhao area was restored using the thermodynamic simulation of inclusions in this study. Nine wells were included for testing, and 21 pressure data points were obtained in the Sanzhao area. The results showed two periods of major oil charging in the Fuyu reservoir in the Sanzhao area, corresponding to the deposition period of the Nenjiang Formation, the end of the sediments of Sifangtai-Mingshui Formation, and at the end of the second phase, the distribution of oil inclusions mainly at the end of the second phase. The pressure test results showed that the Fuyu oil layer was mainly dominated by overpressure (Table 3).
The paleo-pressure of the inclusions showed that the tight reservoirs in the study area generally had high pressure anomalies (Table 3), indicating that petroleum enters the tight reservoirs under overpressure. The main driving forces for oil migration are buoyancy, abnormally high pressures caused by hydrocarbon generation and pressurization, under-compaction, and dehydration of clay minerals, hydrodynamic forces, and tectonic stresses. The buoyancy of the Fuyu reservoir in the Sanzhao area was opposite to the direction of the oil migration, thus hindering the initial migration. Hence, buoyancy was not the power of the initial migration of tight oil. Considering that tight oil is mostly formed after being tight, the flow of fluid in the oil involved a non-Darcy flow, and the water in it could not flow freely. Hence, the hydrodynamic force was not the force of tight oil accumulation. The structural movement of the Songliao Basin in the main reservoir formation was mainly the subsidence of the depression, which was not subjected to strong tectonic compression and could not form overpressure. Therefore, tectonic stress was not the driving force of tight oil accumulation. Therefore, both the overpressure of genetic compaction and hydrocarbon generation may constitute the initial migration force of the Fuyu reservoir in the Sanzhao area.
The accumulation period of the Fuyu reservoir in the Sanzhao area was mainly the end of the Nenjiang Formation and the Sifangtai-Mingshui Formation, and the Sifangtai-Mingshui sedimentary period was the most important oil migration period. The characteristics and patterns of hydrocarbon accumulation in the study area are discussed in terms of hydrocarbon generation intensity, pore evolution curve, and residual pressure of the two key periods.
After Nenjiang Formation, the depth of the bottom of Qing-1 was between 1,300 and 1,700 m, with an average of 1,500 m, and a very small part of the source rock Ro was greater than 0.5%. (Sun et al., 2013) Most of them were in the immature stage, and the residual pressure could reach 2–8 MPa. According to the relationship between porosity and depth, the porosity was mainly distributed at 16.3%–12.8%, and the reservoir was not tight. The petroleum generated during the Qing stage mainly migrated laterally and downward along fractures and faults and had a short migration distance.
After the Sifangtai-Mingshui Formation, the buried depth of the bottom was 2,000–2,400 m, with an average of 2,200 m. Most of the source rock Ro was greater than 0.7%, and the maximum value was close to 1.3%. At the peak of hydrocarbon generation, the maximum residual pressure could reach 16 Mpa. According to the relationship between porosity and depth, the porosity was mainly distributed at 11.7%–6.4%, and the reservoir was tight. The oil from the source rocks of Qing-1 migrated laterally and vertically along the cracks, faults, and sand bodies, which formed a large area of tight reservoirs.
The reservoir model of tight oil accumulation in the Fuyu reservoir of the Sanzhao area is a multi-channel migration type accumulation model under source direct high-pressure injection. The source–reservoir relationship between the source rocks of Qing-1 and the Fuyu reservoir involved direct contact. The Sifangtai-Mingshui Formation was the main charging period of tight oil. The reservoir was tight. The residual pressure generated by hydrocarbon generation and pressurization could reverse the oil flow back into the Fuyu oil layer. The generated oil flowed along the fractures, faults, and sand bodies such as vertical or lateral transport channels to form a tight reservoir (Figure 8).
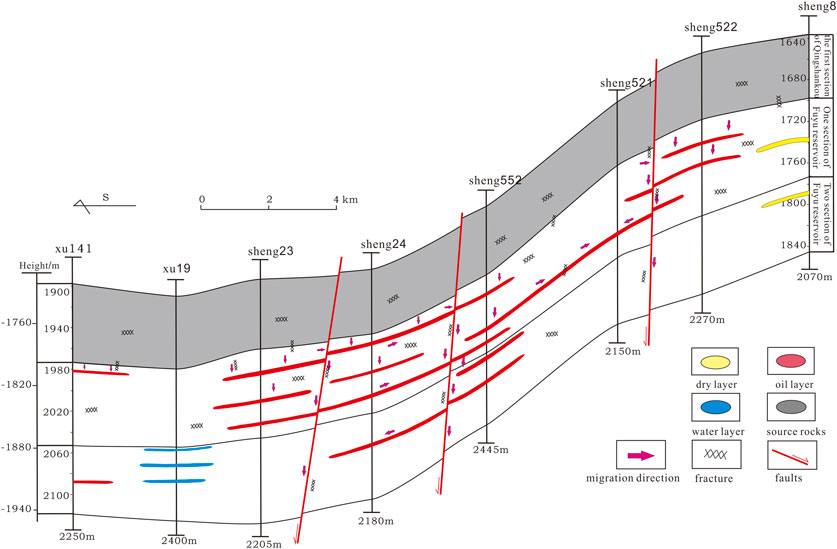
FIGURE 8. Hydrocarbon charging and accumulation model in the Fang141-Sheng8 well in the Fuyu oil reservoir of the Sanzhao area.
The oil flowed downward into the Fuyu reservoir, and the resulting oil formed a tight reservoir by vertical or lateral migration along the cracks, faults, sand, and other transport channels (Figure 8).
The paleo-pressure simulation showed two stages of reservoir formation in the Sanzhao area. At the first stage, the paleo fluid pressure was 16.992–19.068 MPa, and the pressure coefficient was 1.18–1.26. At the second stage, the palaeo fluid pressure was 20.216–28.830 MPa, and the pressure coefficient was 1.21–1.33. The two stages were characterized by abnormally high pressure. This finding supports the below-source high-pressure charging accumulation model in this paper and introduces different views on lower product and upside reservoir migration (Zhang et al., 2010b). Fu et al. (2009) argued that in the accumulation process of the Fuyu oil layer in the Sanzhao area, tight oil began charging and forming in the Sifangtai-Mingshui Formation. The remaining pressure generated by the hydrocarbon generation pressurizes the oil generated in the upper formation to infiltrate the Fuyu oil layer. The resulting oil is lost along cracks, faults, and sand bodies. The generated oil descends along the transmission channels such as cracks, faults, and sand bodies and forms an upper and lower reservoir tight reservoir. However, some scholars such as Fu Guang did not explain fluid pressure characteristics in oil and gas down-charging. The present study shows that paleo-pressure is a major driving force for the downward migration of oil and gas. This paper mainly includes the following innovations: (Meng et al., 2014): Paleo-pressure of multi-stage hydrocarbon charging was described; (Zhang et al., 2010a); paleo and present pressures were contrasted in the study area; and (Chi et al., 2000) an overpressure hydrocarbon charging model was proposed.
The homogenization temperature of saline over the same period and the charging degree of oil inclusions in the Fuyu oil layer of the Sanzhao area were measured accurately by microscopic fluorescence analysis, microscopic temperature measurement, and confocal laser scanning microscopy. With the burial history of the strata and inclusion PVTx simulation, our comprehensive views are as follows:
1) The fluorescence colors of oil inclusions in the Fuyu reservoir are yellow, yellow-green, blue-green, and blue-white, indicating the charging of crude oil with different maturity. Among them, yellow oil inclusions have the lowest maturity, blue-white oil inclusions have the highest maturity, and yellow-green and blue-green oil inclusions have medium maturity.
2) Oil and gas charging in the Fuyu oil layer in the area involves two phases. The first period occurred during the period at 79–74 Ma at the end of the Nenjiang Formation, corresponding to the inclusions of the first oil inclusions charging, with trapping pressure of 16.992–19.068 MPa and pressure coefficient of 1.18–1.26. The second period occurred in the Sifangtai-Mingshui Formation at 69–64 Ma, corresponding to the second, third, and fourth curtain oil inclusions charging, with capture pressure of 20.216–28.830 MPa and pressure coefficient of 1.21–1.33. Based on the characteristics of oil and gas capture pressure coefficient, the capture pressure of crude oil inclusions in the two phases of the Sanzhao area is abnormally high.
3) The reservoir formation model of the Fuyu tight oil reservoir in the Sanzhao area is a direct high-pressure charging and multi-channel migration accumulation model. The Q-1 source rock and Fuyu oil layer have a direct contact relationship between the source rock and the reservoir.
The original contributions presented in the study are included in the article/Supplementary Material, further inquiries can be directed to the corresponding author.
SS: Conceptualization, Methodology, Writing-Review and Editing. JH: Formal analysis, Writing-Original Draft. PL: Formal analysis, Investigation, Visualization, Conceptualization. JL: Formal analysis, Investigation, Visualization, Conceptualization. GY: Formal analysis, Investigation, Visualization. QY: Formal analysis, Investigation, Visualization. YY: Formal analysis, Investigation, Visualization. XC: Formal analysis, Investigation. CL: Methodology, Project administration.
This project is jointly supported by the National Natural Science Foundation of China (Nos. 42002159, 41202088), the Foundation of State Key Laboratory of Petroleum Resources and Prospecting, China University of Petroleum, Beijing (No. PRP/open-2103), and the Natural Science Foundation of Shaanxi Province (No. 2019JQ-234).
PL, JL and GY were employed by No. 5 Oil Production Plant of Huabei Oilfield Company, PetroChina; QY was employed by Exploration and Production (E&P) Company of Huabei Oilfield, PetroChina.
The remaining authors declare that the research was conducted in the absence of any commercial or financial relationships that could be construed as a potential conflict of interest.
All claims expressed in this article are solely those of the authors and do not necessarily represent those of their affiliated organizations, or those of the publisher, the editors and the reviewers. Any product that may be evaluated in this article, or claim that may be made by its manufacturer, is not guaranteed or endorsed by the publisher.
Aplin, A. C., Macleod, G., and Larter, S. R. (1999). Combined Use of Confocal Laser Scanning Microscopyand PVT Simulation for Estimating the Composition Andphysical Properties of Petroleum in Fluid Inclusions. Mar. Pet. Geology. 16 (2), 97–110.
Bhatti, A., Ismail, A., Raza, A., Gholami, R., Rezaee, R., Nagarajan, R., et al. (2020). Permeability Prediction Using Hydraulic Flow Units and Electrofacies Analysis. Energ. Geosci. 1 (1–2), 81–91. doi:10.1016/j.engeos.2020.04.003
Bloch, S., Lander, R. H., and Bonnell, L. (2002). Anomalously High Porosity and Permeability in Deeply Buried sandstone Reservoirs: Origin and Predictability. AAPG Bull. 86 (2), 301–328. doi:10.1306/61eedabc-173e-11d7-8645000102c1865d
Chi, Y., Xiao, D., and Yin, J. (2000). The Injection Pattern of Oil and Gas Migration and Accumulation in the Sanzhao Area of Songliao basin. Acta Geologica Sinica 74 (4), 371–377.
Coveney, R. M., Goebel, E. D., and Ragan, V. M. (1987). Pressures and Temperatures from Aqueous Fluid Inclusions in Sphalerite from Midcontinent Country Rocks. Econ. Geology. 82 (3), 740–751. doi:10.2113/gsecongeo.82.3.740
Fu, G., and Wang, Y. (2008). Migration Horizons Downward of Oil from K1qn Source Rock of F, Y Oil Layer in Sanzhao Depression and its Significance. Acta Sedimentologica Sinica 26 (2), 355–360.
Fu, X., Ping, G., Fan, R., and Liu, Z. B. (2009). Research on Migration and Accumulation Mechanism of Hydrocarbon“Reversed Migration” in Fuyu and Yangdachengzi Formation in Sanzhao Depression. Acta Sedimentologica Sinica 27 (3), 558–566.
Huang, S. J., Liu, J., Shen, L. C., and Wu, W. H. (2001). Thermodynamic Interpretation for the Conditions of the Formation of Laumontite Related to Clastic Diagenesis. Geol. Rev. 47 (3), 301–308.
Huang, X., Li, A., Li, X., and Liu, Y. (2019). Influence of Typical Core Minerals on Tight Oil Recovery during CO2 Flooding Using the Nuclear Magnetic Resonance Technique. Energy Fuels 33 (8), 7147–7154. doi:10.1021/acs.energyfuels.9b01220
Jiang, H. Q., Yao, J., and Jiang, R. Z. (2006). Reservoir Engineering Principles and Methods. Dongying: China University of Petroleum Press, 1–298.
Jiang, L., Sainoki, A., Mitri, H. S., Ma, N., Liu, H., and Hao, Z. (2016). Influence of Fracture-Induced Weakening on Coal Mine Gateroad Stability. Int. J. Rock Mech. Mining Sci. 88, 307–317. doi:10.1016/j.ijrmms.2016.04.017
Liu, D., Lu, H. Z., and Xiao, X. (2007). Oil and Gas Fluid Inclusion and its Application in the Hydrocarbon Exploration and Exploitation. Guangzhou: Scientific and technologic press, 135–150.
Meng, Q., Bai, X., Liang, J., Tang, Z., Xue, T., Peng, J., et al. (2014). Fuyu Tight Oil Characteristics and Exploration Countermeasures in north Songliao basin. Petroleum Geology. Oilfield Development Daqing 33 (5), 23–29.
Shi, Y. M., Huo, J., and Zhang, Y. G. (2004). Fine Description of Reservoirs in Middle and Late Stage of continental Oilfield Development. Beijing: Petroleum Industry Press, 1–267.
Shi, Z., Han, Y., Zhao, J., Yang, Y., and Jin, X. (2003). Depositional System and Paleogeographic Evolution of the Middle Jurassic Yan’anian Stage in the Central and Southern Ordos Basin. Acta Geosciences 24 (1), 49–54.
Sun, T. B., Lin, C. Y., and Tian, M. (2013). Reservoir Configuration Features of Narrow Thin Sand Body and its Influence in Remining Oil Distribution. Mineralogy Pet. 33 (2), 94–101.
Thiéry, R., Pironon, J., Walgenwitz, F., and Montel, F. (2000). PIT(petroleum Inclusion Thermodynamic): A New Modeling Tool for the Characterization of Hydrocarbon Fluid Inclusions from Volumetric and Microthermometric Measurements. J. Geochemical Exploration 69, 701–704. doi:10.1016/S0375-6742(00)00085-6
Wang, Y., and Wang, S. (2009). Controlling of the Match of Source Rock,Overpressure and Fault on Oil Accumulation of Fu-Yang Oil Layer in Sanzhao Depression. J. Jilin Univ. Earth Sci. Edition 39 (4), 656–661.
Yang, R., Jin, Z., Van Loon, A., Han, Z., and Fan, A. (2017). Climatic and Tectonic Controls of Lacustrine Hyperpycnite Origination in the Late Triassic Ordos Basin, Central China: Implications for Unconventional Petroleum Development. AAPG Bull. 101 (1), 95–117. doi:10.1306/06101615095
Yang, Y. (2009). Oil Distribution Law and its Influence Factors in Combination of Generation Upper and Reservoir Lower of Depression— a Example of FY Oil Layer in Sanzhao Depression. J. Daqing Pet. Inst. 33 (2), 1–5.
Zeng, D. Q., Zhang, S. M., and Lu, L. Z. (2003). Types and Characteristics of Fractures in Tight sandstone Gas Reservoirs with Low Permeability. Acta Petrolei Sinica 24 (4), 36–39.
Zhang, J., and Guan, D. (1982). Some Opinions on the Hydrocarbon Accumulation and Controlling Factors in Sanzhao Depression. J. Daqing Pet. Inst. 6 (3), 61–70.
Zhang, L., Lu, S., and Zhang, X. (2010). Controlling Factors and Accumulation Model of Hydrocarbon Accumulation of the Fuyang Oil Units in Sanzhao Region of the Songliao Basin. J. Jilin Univ. Earth Sci. Edition 40 (3), 491–502.
Zhang, X., Feng, Q., Sun, P., and Li, W. (2010). Characteristics of High Gamma ray Reservoir of Yanchang Formation in Ordos Basin. Chin. J. Geophys. 53 (1), 205–213. doi:10.1002/cjg2.1482
Keywords: oil inclusions, paleo-formation-pressure simulation, abnormal pressure, fuyu oil layer, sanzhao area
Citation: Si S, He J, Liu P, Liu J, Yan G, Yao Q, Yang Y, Chen X and Liu C (2022) Oil Charging Power Simulation and Tight Oil Formation of Fuyu Oil Layer in Sanzhao Area, Songliao Basin. Front. Earth Sci. 10:825548. doi: 10.3389/feart.2022.825548
Received: 30 November 2021; Accepted: 15 March 2022;
Published: 27 April 2022.
Edited by:
Junhui Wang, China University of Petroleum, ChinaReviewed by:
Wei Yang, Southwest Petroleum University, ChinaCopyright © 2022 Si, He, Liu, Liu, Yan, Yao, Yang, Chen and Liu. This is an open-access article distributed under the terms of the Creative Commons Attribution License (CC BY). The use, distribution or reproduction in other forums is permitted, provided the original author(s) and the copyright owner(s) are credited and that the original publication in this journal is cited, in accordance with accepted academic practice. No use, distribution or reproduction is permitted which does not comply with these terms.
*Correspondence: Chao Liu, bGl1Y2hhb194c3l1QDE2My5jb20=
Disclaimer: All claims expressed in this article are solely those of the authors and do not necessarily represent those of their affiliated organizations, or those of the publisher, the editors and the reviewers. Any product that may be evaluated in this article or claim that may be made by its manufacturer is not guaranteed or endorsed by the publisher.
Research integrity at Frontiers
Learn more about the work of our research integrity team to safeguard the quality of each article we publish.