 Zhichao Tian
 Chunan Tang2,3
 Chaoyun Yu
- 1School of Civil Engineering, Inner Mongolia University of Science and Technology, Baotou, China
- 2School of Resources and Civil Engineering, Northeastern University, Shenyang, China
- 3Dalian University of Technology, Dalian, China
- 4College of Mining and Coal, Inner Mongolia University of Science and Technology, Baotou, China
At present, a large number of physical tests and numerical simulations have been carried out to study the effect of confining pressure on rock deformation mechanism, and some achievements have been achieved; however, the mechanism of rock deformation in actual mine engineering needs to be further studied, for example, rock-burst is actually a unilateral unloading process of rock mass, and this process can not be completed by physical test. RFPA3D was used to simulate the brittle–ductility transformation mechanical properties of rock under different confining pressures in this paper. The damage constitutive equation of rock was derived from continuum damage mechanics; the damage coefficients of different rocks were determined based on the numerical results of stress acoustic emission, so the correctness of rock damage constitutive equation was verified. According to the derived brittle–ductility damage equation and the fitting results of ductility cumulative damage data, it was found that the development trend of rock brittleness stage was almost the same, and the extended separation occurred after entering ductility stage. The larger the Poisson’s ratio was, the longer the ductility stage was. The smaller the Poisson’s ratio was, the shorter the ductility stage was, but the larger the bearing capacity was. At the late loading stage, the ductility cumulative damage of rock showed a linear upward trend, the bearing capacity sharply decreased, the rock stability failure occurred, and the ductility damage coefficient increased gradually. The study on the brittle–ductile mechanical properties of rocks can help to deep mine’s rock-burst prediction and prevention and has significant engineering significance.
Introduction
With the increase in the mining depth, many scholars have conducted a large number of physical tests and numerical simulation studies on the influence of confining pressure on the rock deformation mechanism, especially on the influence of the unloading rate on rock mechanical properties, and many meaningful results have been obtained. For example, Xie et al. (2021) studied the brittleness and ductility of different rocks (Liang and Song, 2021 and Tang et al., 2020). Some scholars conducted numerical simulation analysis on the failure characteristics of rock under unloading rate, and some scholars (Li et al., 2021a and Tian et al., 2021) also conducted physical tests and numerical theoretical studies on the failure of rock under various conditions (Gabriel et al., 2021). Qiu et al. (2010) analyzed the deformation law of JIN PING deep-buried marble under different confining pressure unloading rates and found that the axial deformation and dilatancy of marble were significantly affected by confining pressure unloading rates. Huang and Huang (2010) found through the indoor triaxial unloading test of rock that higher the unloading rate and initial confining pressure, the more obvious the brittle and tensile fracture characteristics of rock. Zhang et al. (2010) conducted the confining pressure unloading test of marble and concluded that higher the confining pressure unloading rate is, the higher the strength of rock sample is. Zhao et al. (2015) from Central South University studied the mechanical properties and strength criterion of rock triaxial unloading under different stress paths. Xiao et al. (2017) used a triaxial rheometer to analyze the deformation characteristics of red sandstone rocks during the triaxial compression process under the action of osmotic pressure and studied the variation rules of the axial strain, radial strain, and deformation modulus of rocks in the process of deviational stress loading under the action of osmotic pressure. In addition, many scholars (Tian et al., 2020, Shen et al., 2017, and Jiang et al., 2017) have studied and analyzed the mechanical properties of rock, such as crack propagation and failure criterion, by means of physical tests, and many meaningful results have been obtained (Kang et al., 2017 and Wang et al., 2017).
However, the abovementioned studies are based on rocks in triaxial confining pressure unloading under the action of physical experiments and numerical research, and rocks under triaxial confining pressure will occur brittle plastic and brittle—the change of mechanical properties such as ductility, and having the effect that cannot be ignored in the process of rock failure, so there are some articles (Li et al., 2021b and Zhang et al., 2020) on rock brittle—ductile analyzed and studied. For example, Cao et al. (2004) studied the brittleness and ductility of rocks by the statistical damage method and determined the brittleness and ductility transformation condition of rock according to the stress–strain curve. Chen et al. (2016) conducted physical test research on the brittleness and ductility transformation of deep rock and determined the influence of critical surrounding rock on the brittleness and ductility transformation through physical test. Wu et al., 2015 conducted physical experimental research on brittle–ductility transformation characteristics of rocks by using the acoustic emission ringing times of rocks and confirmed the coupling relationship between rock damage and brittle–ductility transformation through the acoustic emission ringing times of rocks.
There are many factors influencing the brittle–ductility transformation of rock under the action of stress, such as the difference in rock sample, stress-loading mode, loading speed, and confining pressure, that is, the brittle–ductility transformation of rock is the result of the joint action of many factors. In addition, all the abovementioned scholars analyzed the mechanical properties of brittle–ductility transformation of rock under different conditions from the perspective of physical tests, which had certain limitations. Therefore, this study used RFPA3D numerical test software to study the mechanical properties of brittle–ductility transformation of rock under different confining pressures. Different confining pressures are selected as the main influencing factors of brittle–ductility transformation among many factors affecting brittle–ductility transformation of rock. First, the three-dimensional numerical test of uniaxial loading failure is carried out on the square numerical specimen, and then the numerical experimental study on the mechanical properties of brittle ductility of the square specimen under different confining pressures is carried out to preliminarily explore the mechanical mechanism of brittle–ductile transformation of rock under confining pressure. The change in the bearing capacity of rocks after brittle–ductile transformation is compared and analyzed.
2 Damage Constitutive Equation for Brittle–Ductility Transformation of Rocks
2.1 Based on the Rock Damage Constitutive Equation in Thermodynamics
According to the principle of conservation of energy, the damage constitutive model of brittle–ductility transformation was studied without considering the effect of motion (quasi-static process) and temperature (isothermal process or adiabatic process).
For a thermodynamically closed system, the sum of the internal energy increment
Considering the change rate per unit time, Eq. 1 can be written as follows:
Since the motion effect (quasi-static process) and temperature effect (isothermal process or adiabatic process) are not considered, the following results can be obtained:
By replacing Eq. 2 we obtain the following:
Time change rate of internal energy of the system (let
Formula (7) can be written in the tensor form as follows:
Substituting Eq. 8 into Eq. 6, we can get the following:
Since this state is a quasi-static process, that is, the acceleration A is zero
From the rock point of view, Eq. 10 is the modification of the thermodynamically closed system without considering the motion effect (quasi-static process) and temperature effect (isothermal process or adiabatic process), where the increment of each state variable is a differentiable infinitesimal function of time.
In the theory of internal variables, internal variables describe irreversible processes and are dissipative variables. For the irreversible dissipation process of damage, the following assumptions are proposed:
1) Rock damage can be described by the second-order tensor D of damage variable.
2) Other dissipative variables are described by
3) The second-order strain tensor
Eq. 10 and hypothesis 3) are jointly solved to obtain
where
By introducing two variables
where
Combined with the aforementioned conditions, under the basic assumption of strain residual energy efficiency, the effective elastic modulus of isotropic-damaged materials is
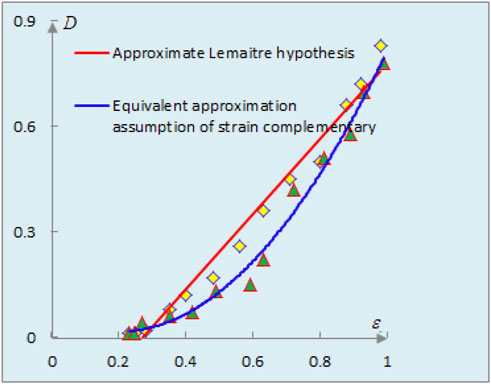
FIGURE 1. Comparison of damage development under the two assumptions.
The rock material is brittle material, but under the condition of triaxial confining pressure, with the change of confining pressure and the loading rate, the rock will appear brittle–ductility transformation phenomenon. In the process of the aforementioned formula, the ductility of the rock can be changed as the plastic problem, so the damage evolution of rock constitutive equation can be available by type (Liu and Jin, 2011). Set the boundary conditions and the loading mode of the model:
For ductile damage, Y et al. proposed a microvoid damage model based on thermodynamics. This model assumes that the damage is isotropic; so the invariants of the damage dual force tensor and the damage dual force tensor are, respectively:
By solving Eqs. 14–(16) simultaneously, the dissipative residual brittle–ductile damage constitutive equation can be obtained:
The brittle–ductile damage evolution equation of materials can be obtained by combining Eqs 17 and 19:
For proportional loading,
In the complex stress state of
Material constants
According to Formulas 19, 20, the ductility change in the elastic modulus after damage was obtained by taking coarse sandstone as an example, as shown in Figure 2.
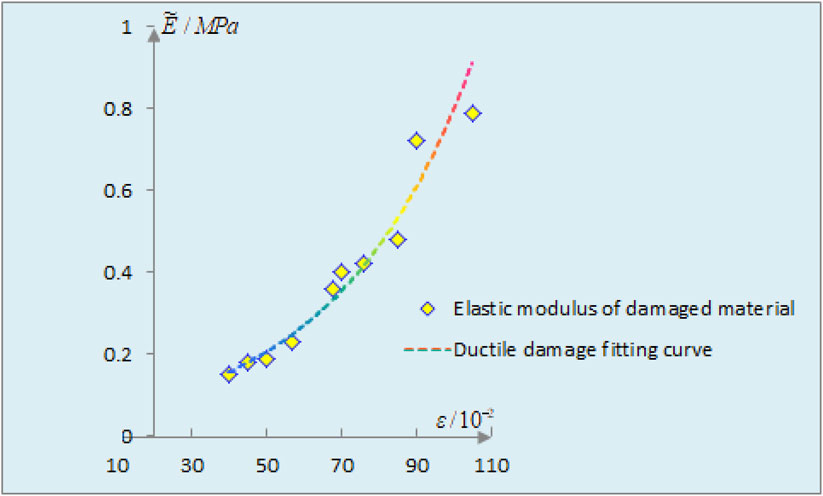
FIGURE 2. Change in the elastic model of coarse sandstone after damage.
2.2 Analysis of the Advantages of RFPA3D
In order to discuss the mechanical mechanism of brittle–ductility transformation of rock, rock failure process analysis software (RFPA3D) was used to analyze the brittle–ductility of rock, and the failure process of rock specimen under triaxial confining pressure was also reproduced (Tang et al., 2003). Eqs 17 and 18 are the brittle–ductile damage constitutive equations of rock derived from the perspective of tensor, while the constitutive equations calculated by numerical test software can adapt to each other in theory.
In 1995, Professor Chunan Tang put forward a new numerical simulation method — Realistic Failure Process Analysis based on the finite element theory, which fully considered the nonlinear, non-homogeneous and anisotropic characteristics of rock fracture. At the same time, the corresponding RFPA series numerical calculation software is developed.
Professor Chunan Tang analyzed the relationship between acoustic emission and rock damage through statistical theory and continuous damage mechanics theory.
Assuming that the cross section of rock material is
If the stress increases to
At this point, the cumulative amount of acoustic emission is as follows:
It can be concluded from Eqs. 21, 22, and 23that:
Therefore, the acoustic emission accumulation is directly proportional to the damage degree of rock materials, and stronger the damage degree of rock, the more intense the AE.
In addition, according to statistical theory and continuous damage mechanics theory, Weibull distribution function is introduced to describe the heterogeneity of rock material medium, namely:
In conclusion, the damage parameter is a measure of the damage degree of materials, and the damage degree is related to the defects contained in each primitive body, which directly affect the strength of the primitive body. Therefore, the relationship between the damage parameter and the statistical distribution density of the failure of the primitive body is as follows:
In summary, damage parameter
If the initial damage parameter
The formula is the rock damage parameter expressed by the strength statistical distribution of the rock primitive.
Lemaitre et al. proposed the concept of continuous damage mechanics and established a one-dimensional damage model by considering the damage process of materials from the perspective of damage mechanics of materials:
Substituting Eq. 28 into Eq. 27, we can get the following:
Eq. 28 is the stress–strain relationship of rock material under uniaxial compression when the statistical distribution of elemental strength is Weibull distribution, which is also the constitutive equation of rock.
By substituting Eq. 29 into Eq. 28, the damage expression of AE cumulate E can be obtained:
Eq. 30 indicates that AE accumulation is a direct reflection of rock damage degree. In other words, the degree of rock failure evolution can be inferred by monitoring different acoustic emission characteristics.
The damage variable equation, namely, type 36) with type 37) and analysis of the constitutive equation of rock damage tensor, is similar in theory and can play a guiding role; RFPA3D is adopted for different confining pressure rock specimens under the condition of true triaxial numerical experiment research and summarizes the analysis of rock under different confining pressures of mechanical properties of brittle–ductile transformation and critical judgment standard.
3 Numerical Simulation Test Analysis of Rock Brittleness and Ductility
According to the abovementioned damage constitutive equation of rock and the introduction of software RFPA3D, numerical test software RFPA3D was used to carry out numerical tests on rock, and the mechanical properties and critical discrimination conditions of brittle–ductility transformation of rock were analyzed from the perspectives of stress–strain curve, acoustic emission, and energy.
3.1 Model Size, Meshing, and Mechanical Parameters
The model adopts specimens of the same size as the physical test, which are cuboids of 50*50*100 mm in size and divided into two million free units. The basic parameters of rock mechanics are obtained by uniaxial test of physical test. In addition, this numerical test mainly considers the influence of confining pressure on the brittle–ductility transformation of specimens; so, the axial pressure is kept constant during the numerical test and the loading rate of confining pressure is changed to achieve different conditions of confining pressure.
In addition, in order to eliminate the size effect of the end face, the end face was rigidized. The thickness of the specimen was ten-mm up and down, and the total height of the specimen was 120 mm. At the same time, the elastic modulus and strength of the alloy were increased to be rigidized in the model, as shown in Figure 3.
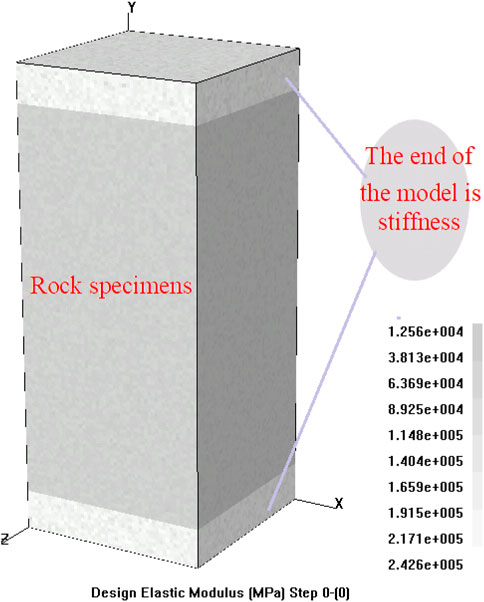
FIGURE 3. Calculation model of the numerical test.
In order to reflect the superiority of the software, the accuracy of the numerical test, and the universal applicability, the common rock in the mining area, namely, coarse sandstone (fine sandstone and siltstone), is used for the setting of rock mechanical parameters. Mechanical parameters have certain universality and are very common in mining areas. The control parameters of phase change criteria and basic mechanical parameters of rock specimens are shown in Table 1. The loading rate of the model is shown in Table 2 and Table 3.
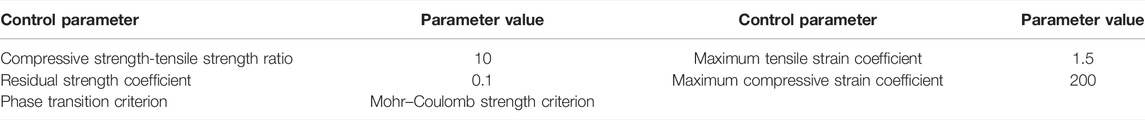
TABLE 1. Phase change criterion control parameters.
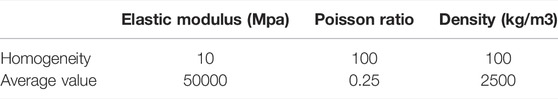
TABLE 2. Rock material properties.
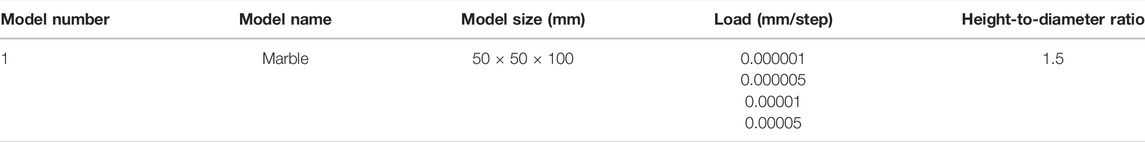
TABLE 3. Size effect model information.
3.2 Setting of Model Boundary Conditions and Control Conditions
1) Set the boundary conditions and the loading mode of the model.
In order to ensure the consistency with the boundary conditions of real physical tests, the bottom of the rock specimen was fixed, that is, the bottom surface of the specimen was rigidized in fixed face (fixed boundary), as shown in Figure 4. In addition, other combination methods could also be used to rigidize according to different numerical calculation models.
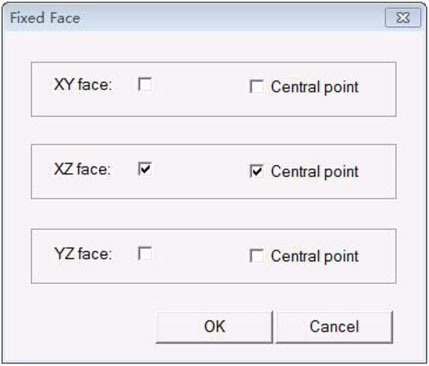
FIGURE 4. Constraints at the bottom of the rock specimen model.
In order to ensure the consistency with physical test loading, rock specimens in X, Y, and Z directions were loaded separately. Since the physical test adopts the true triaxial failure process of rock specimens by keeping the axial pressure unchanged and changing the confining pressure rate, the numerical test also adopts the method of keeping the axial pressure constant and loading the confining pressure at different rates, as shown in Figure 5. Since there are four loading modes in each direction, displacement loading, stress loading, gradient stress loading, or no loading, there can be different combinations in the X, Y, and Z directions; so there are 64 loading modes in total.
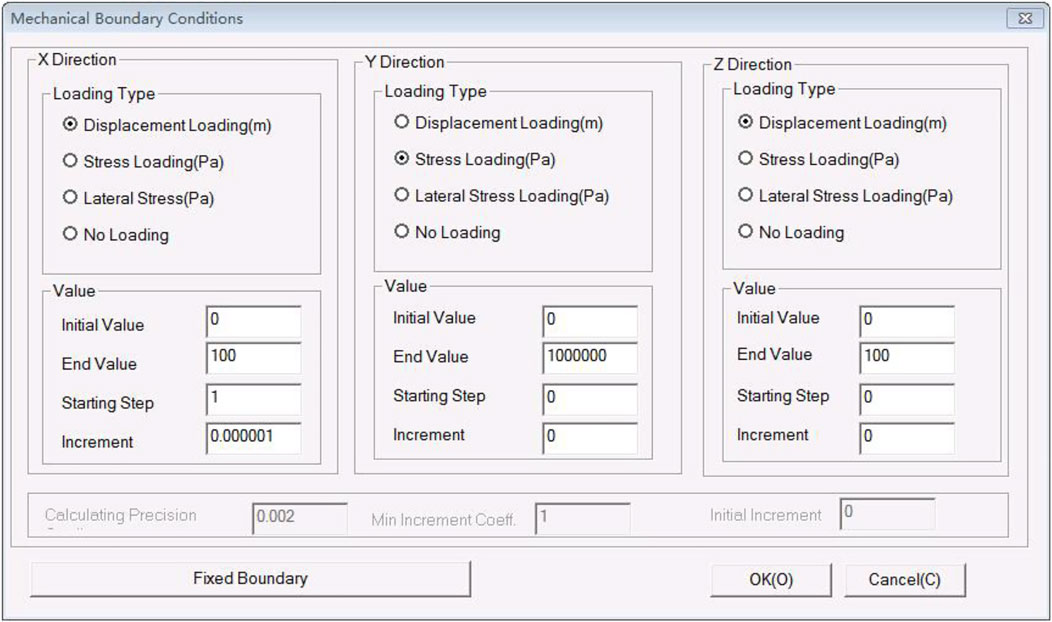
FIGURE 5. Loading method of the specimen.
Since there are many ways of confining pressure loading on rock specimens in physical tests, such as stress and displacement loading, this numerical test adopts four different rates of confining pressure loading to load rock specimen models. In other words, 0.000001 mm/s, 0.000005 mm/s, 0.00001 mm/s, and 0.00005 mm/s, and the confining pressure rate gradually increases. In Figure 3, Y-direction is axial pressure loading and remains unchanged; end value is set as 150 Pa; X and Z directions are confining pressure displacement loadings; four different displacement loading speeds are set for confining pressure. That is, increment is set to 0.000001, 0.000005, 0.00001, and 0.00005, respectively.
In addition, the loading control information needs to be set before calculation. Control conditions include the setting of loading steps and the selection of special methods related to loading steps, as shown in Figure 6. Auto adaptive loading is to judge the amount of load to be loaded in the next step according to the number of failure units. According to the damage degree of the rock specimen, the crack propagation of the rock specimen can be more clearly observed. Therefore, the loading step of this numerical test is set as 10000 steps.
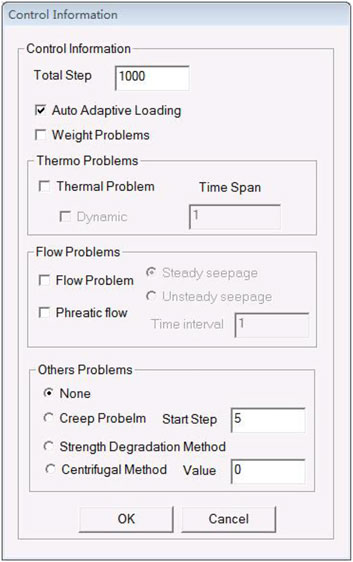
FIGURE 6. Numerical calculation of control conditions.
3.3 Analysis of Numerical Test Results
Therefore, the rock failure process is a dynamic change process. Some calculation steps are selected to show the crack propagation and acoustic emission of rock under triaxial confining pressure in numerical test engineering by RFPA3D software superiority and limited space.
3.3.1 Comparison of Macroscopic Failure Modes of Specimens.
Failure patterns of specimens under different confining pressures are shown in Figure 7 and Figure 8.
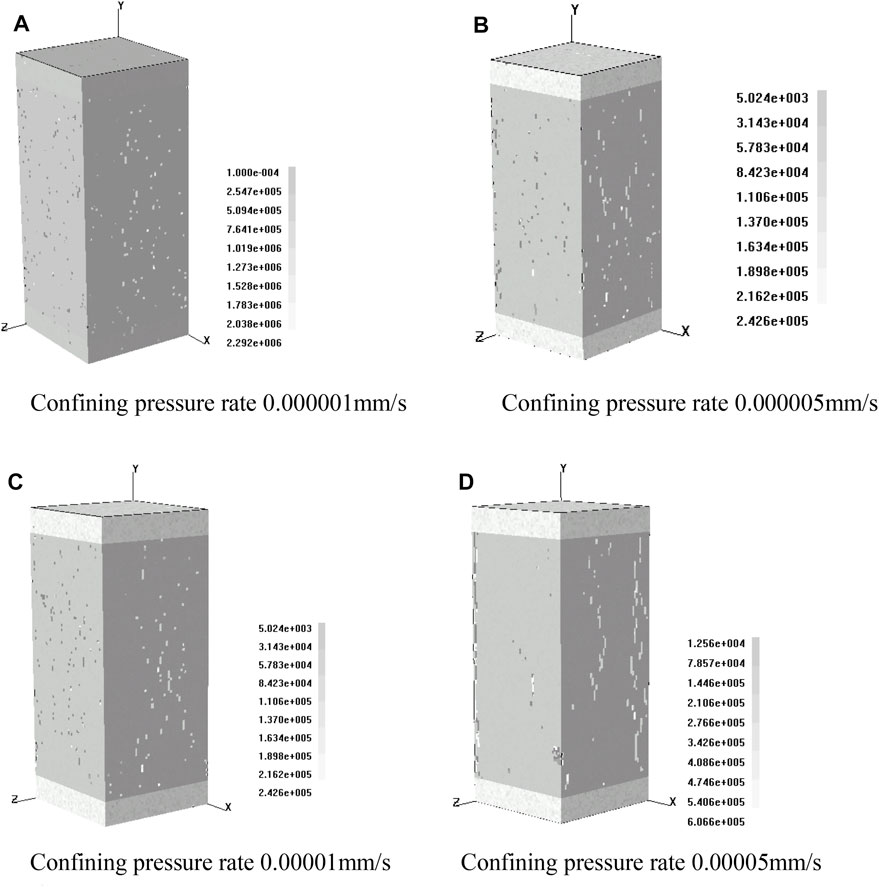
FIGURE 7. Failure modes of rock specimens under different confining pressures at 400 calculation steps. (A) is the calculation result of 400 steps on the model when the confining pressure rate is 0.000001 mm/s. (B) is the calculation result of 400 steps on the model when the confining pressure rate is 0.000005 mm/s. (C) is the calculation result of 400 steps on the model when the confining pressure rate is 0.00001 mm/s. (D) is the calculation result of 400 steps on the model when the confining pressure rate is 0.00005 mm/s.
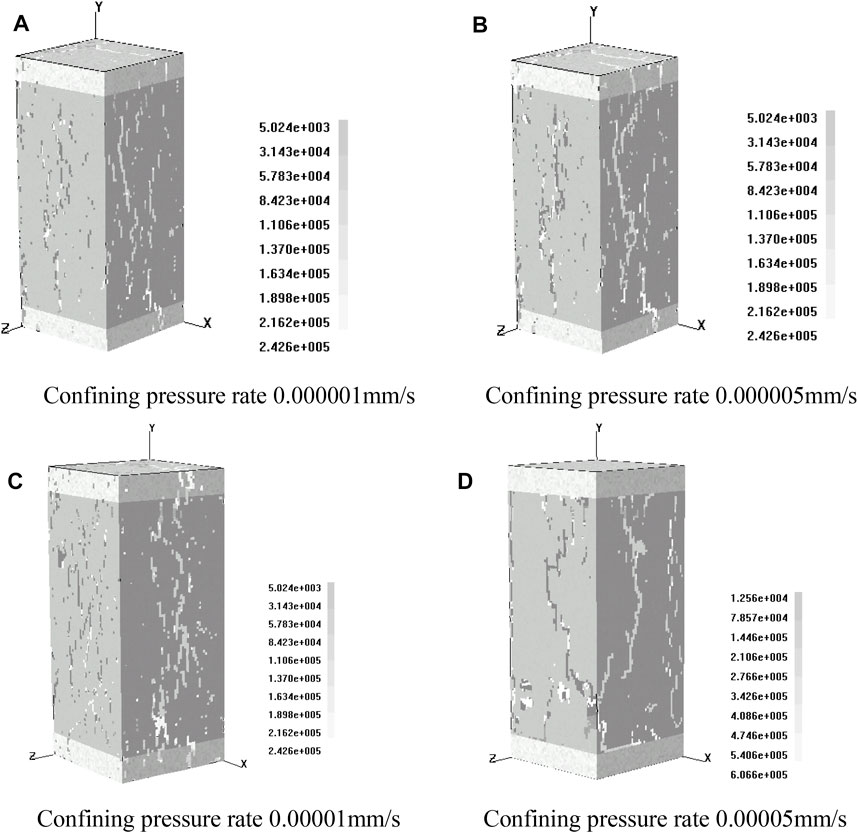
FIGURE 8. Final failure modes of rock specimens under different confining pressures. (A) is the final failure result of the model at the confining pressure rate of 0.000001 mm/s. (B) is the final failure result of the model at the confining pressure rate of 0.000005 mm/s. (C) is the final failure result of the model at the confining pressure rate of 0.00001 mm/s. (D) is the final failure result of the model at the confining pressure rate of 0.00005 mm/s.
In order to better observe the failure morphology of rock specimens in the loading process and due to the limitation of space, the failure morphology of rock specimens at 400 steps under the action of four kinds of confining pressures was selected. According to the four figures (a), (b), (c), and (d) in Figure 7, with the increase of confining pressure, the crack propagation degree of rock specimen becomes more and more serious. In other words, some macroscopic cracks are formed in the model rock specimen from the sporadic occurrence of initial unstable elements to interpenetration. This is most obvious in the numerical tests with confining pressures of 0.000001 mm/s and 0.00005 mm/s, respectively (Figure 7).
The four figures (a), (b), (c), and (d) in Figure 8 are the final instability failure diagrams under four confining pressures. It can be seen from the figures that split failure and shear failure occurred in the model rock specimen, in which the split failure occurred in the rock plays a leading role. In addition, with the increase of confining pressure, the probability of shear failure of model rock specimens is increasing. By comparing (a) and (d) in Figure7, it can be seen that in Figure (a), splitting failure plays a dominant role, while in Figure 7D, in addition to splitting failure, there are shear failures of varying degrees. It indicates that under the condition of a certain axial pressure, with the increase of confining pressure, the instability element of the model rock specimen gradually changes from the initial tensile failure to shear failure (Figure 8).
Figure 7 and Figure 8 show the initiation and propagation of crack and the failure and instability process of specimen in model rock. The macroscopic crack is formed by the interpenetration of the unstable elements, and the stress concentration at the crack tip leads to the continuous expansion of the crack, and finally the cracks converge to form the macroscopic crack, which leads to the failure and instability of the model rock specimen.
3.3.2 Comparison of Acoustic Emission of Failure Modes of Specimens.
The acoustic emission propagation patterns of specimens under different confining pressures are shown in Figure 9 and Figure 10.
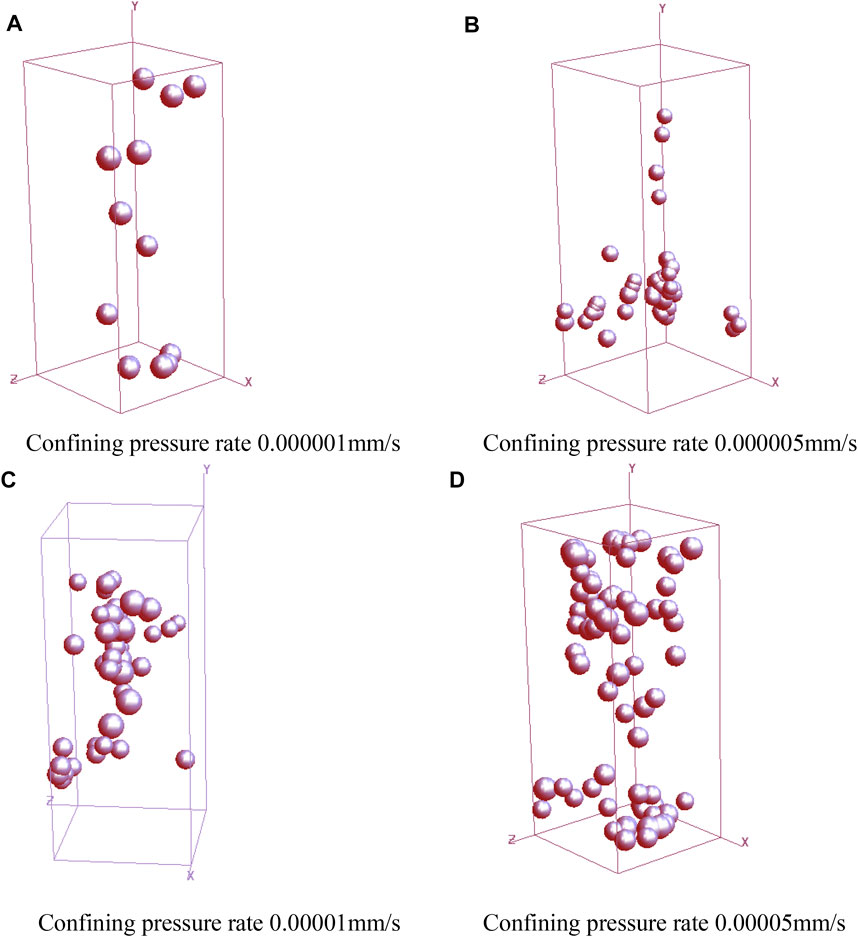
FIGURE 9. AE morphology of rock specimens under different confining pressures at 400 steps. (A) is the 400-step result of model acoustic emission at the confining pressure rate of 0.000001 mm/s. (B) is the 400-step result of model acoustic emission at the confining pressure rate of 0.000005 mm/s. (C) is the 400-step result of model acoustic emission at the confining pressure rate of 0.00001 mm/s. (D) is the 400-step result of model acoustic emission at the confining pressure rate of 0.00005 mm/s.
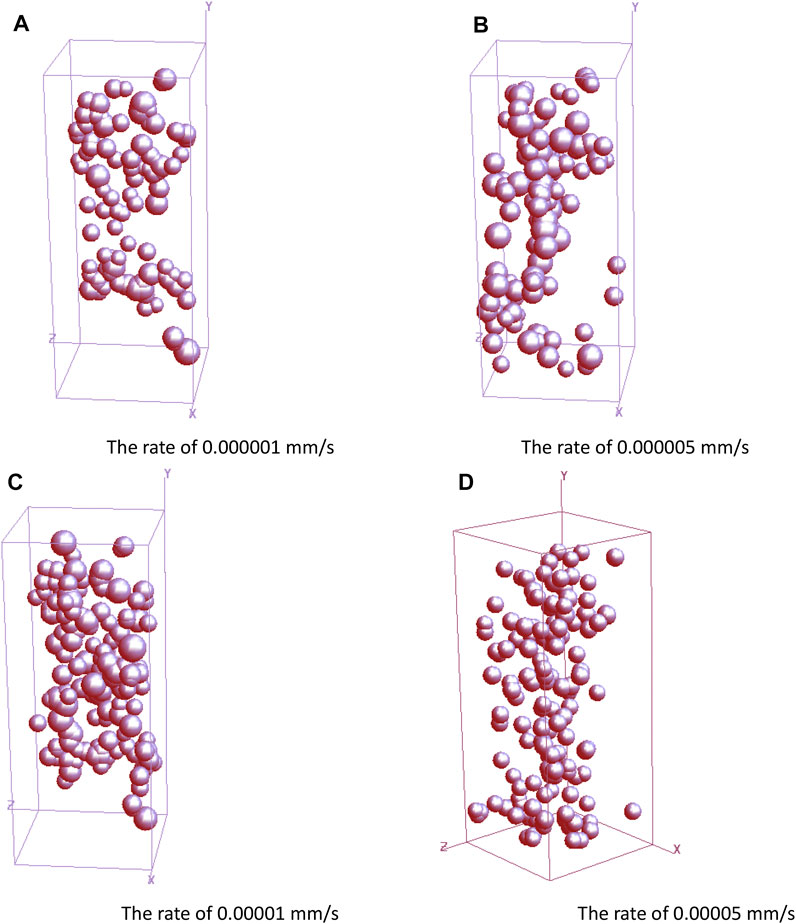
FIGURE 10. AE failure modes of rock specimens under different confining pressure rates. (A) is the final simulation result of model acoustic emission at the confining pressure rate of 0.000001 mm/s. (B) is the final simulation result of model acoustic emission at the confining pressure rate of 0.000005 mm/s. (C) is the final simulation result of model acoustic emission at the confining pressure rate of 0.00001 mm/s. (D) is the final simulation result of model acoustic emission at the confining pressure rate of 0.00005 mm/s.
The four graphs (a), (b), (c), and (d), respectively, represent the AE expansion morphology of the model rock specimen under the action of four kinds of confining pressures when the calculation step is 400(Figure 9). Fewer than four different confining pressures, the intensity of AE increases with the increase in the confining pressure rate. By comparing (a) and (d) in Figure 9, it is obvious that there is a relatively large difference in the AE of the model rock specimen, indicating that the confining pressure rate or confining pressure has a great influence on the damage and failure of the model rock specimen and the change of the mechanical properties of the model rock specimen.
The final AE (acoustic emission) of failure and instability of the model rock specimen is shown in Figure 10. Compared with Figure 9, Figure 10 shows the AE signals of the model rock specimen in the state of complete failure and instability, which are very dense with little morphological difference, indicating that the specimen has a consistent state during failure and instability. In addition, it can be seen from Figures 9,10 that the AE signals of the model rock specimen constantly radiate outward from the aggregation area, and eventually form an AE band consistent with the fracture surface of the specimen, which is called the failure surface of the model rock specimen.
Figures 7–10 show the fracture process of rock specimens and acoustic emission expansion process. The expansion of acoustic emission corresponds to the macroscopic fracture of rock. This is due to the formation of microcracks in the model rock specimen after the destruction of primiples. The other major through above is able to directly observe the rock specimens under different confining pressures of rock specimens under the action of the propagation of the crack, the crack from the crack at the destruction of the rock instability; it also embodies the superiority of RFPA3D software, but the images did not directly observe the change of the mechanical properties of rock specimen, such as the destruction of the rock strength, and strain. The process of brittleness and ductility of rock cannot be effectively reflected; so, the stress–strain curve of rock specimen must be displayed.
3.3.3 Changes in Rock Mass Stress in the Rock Model Section.
Due to space reasons, only the stress section graph of rock model under a loading rate of 0.00001 mm/s is introduced. As shown in Figure 11, the transformation process of rock model from brittleness to ductility can be visually seen, and the process is from (a) to (I):
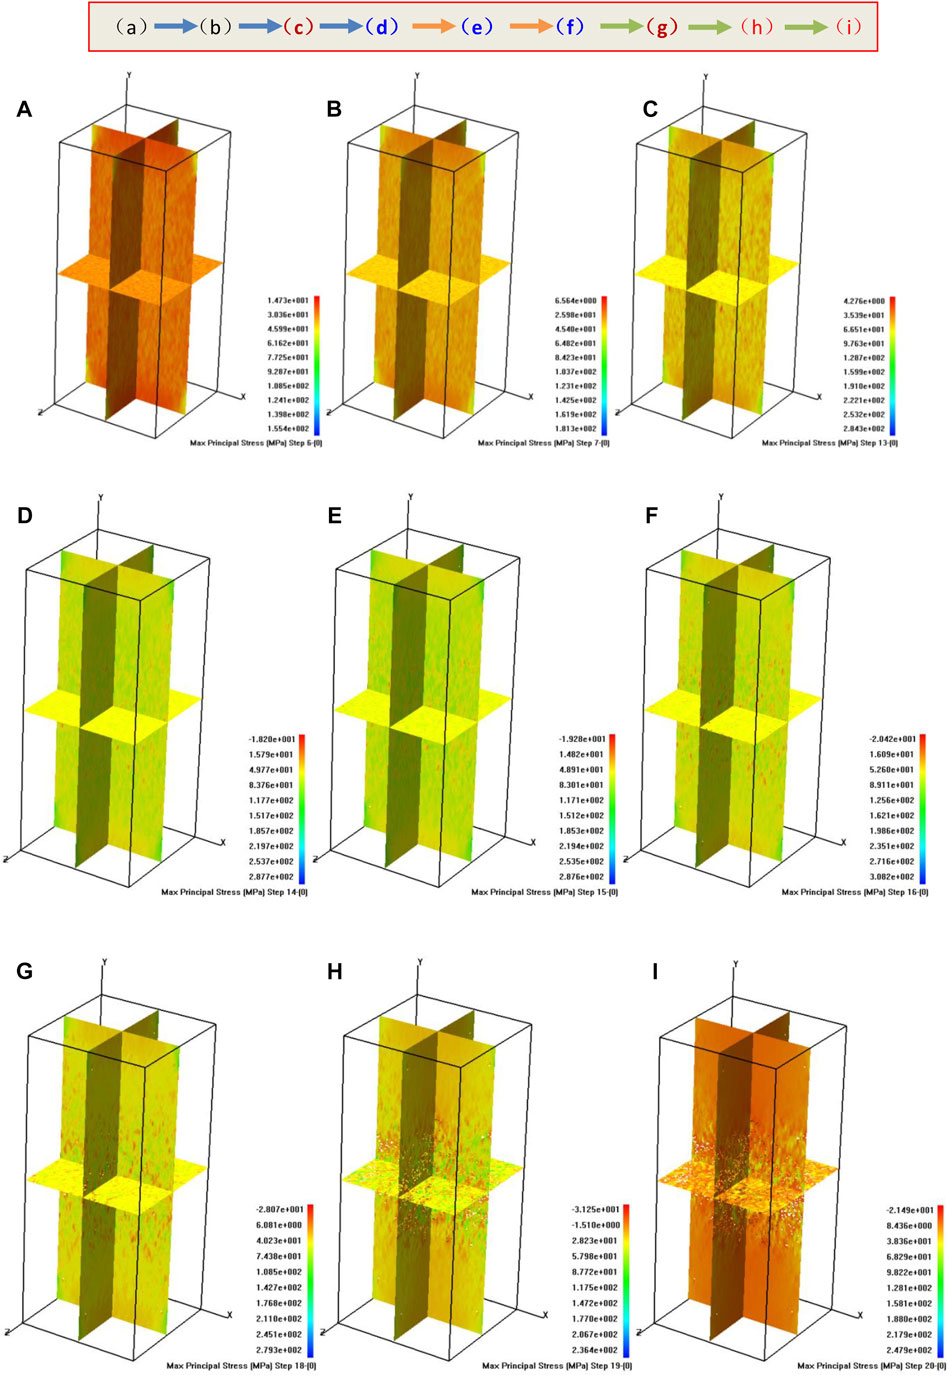
FIGURE 11. Stress section under the loading rate of 0.00001 mm/s.
Figure 11 shows the macroscopic failure sectioning process of the rock model under the loading rate of 0.0005 mm/s confining pressure. Among them by comparing (a) and (c) for the rock brittleness phase (elastic stage), combined with Figure 8 more intuitive, the state of stress and strain curve is linear, model in the elastic compression state, and with the increase in the calculation step, (c) the picture shows the limit of the elastic stage, rock and rock at the critical model by the rock brittleness phase (elastic stage) has entered into the phase of the ductile phase (plastic). Figure 4D–G is the ductility stage of the rock model and FIG. (d), (e), and (f) are the extension stages of ductility, and (g) is the critical state of ductility. By comparing figures (d) and (g), it can be seen that the bearing capacity of rock is still increasing at the ductility stage, but the state of rock is greatly changed. Similarly, with the increase of calculation steps, local rock failure occurs according to the Mohr–Coulomb failure criterion, which eventually leads to rock failure and instability. Compared with (d) in Figures 7 and 8, the failure process of rock can be seen more intuitively.
3.3.4 Comparative Analysis of Stress Curves of Rock Specimens
In order to facilitate the comparison of the influence of the four confining pressure rates on the brittle–ductility transformation of rock, the stress–strain curves are placed in a graph, as shown in Figure 12.
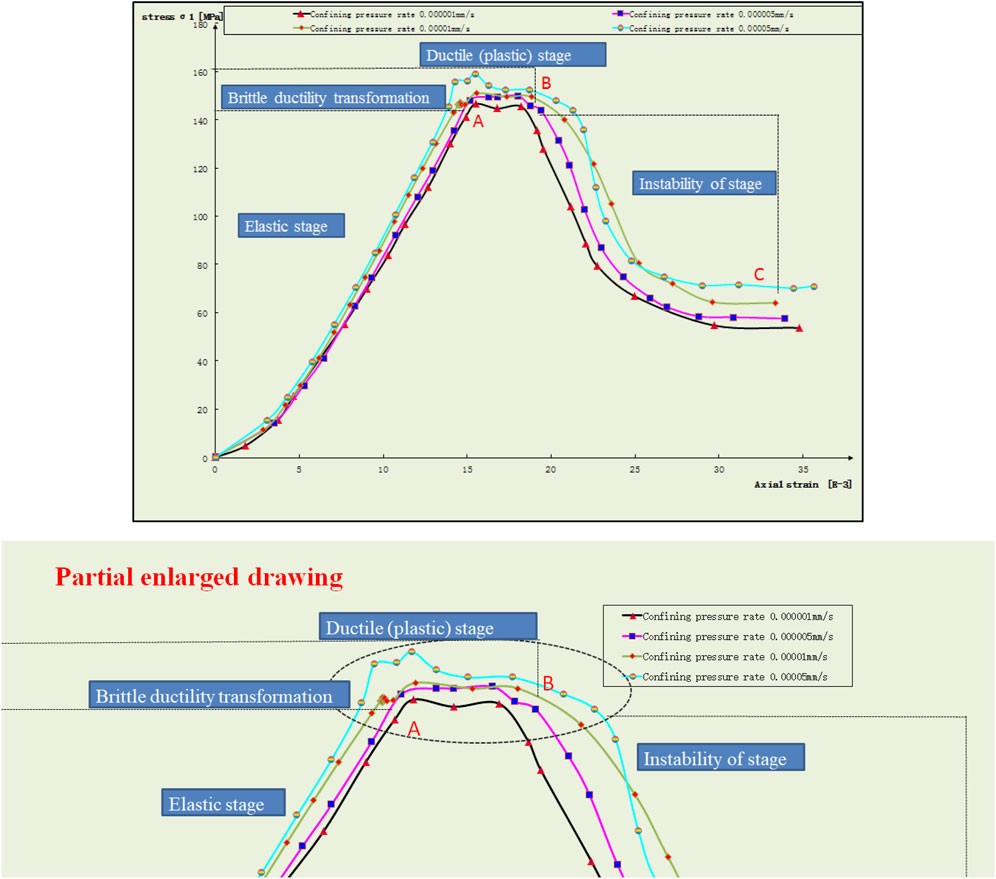
FIGURE 12. Stress–strain curves of rock under four kinds of confining pressures and partial enlarged.
Ductility is the ability of a material to withstand large plastic deformations without losing its bearing capacity. Figure 12 shows the stress–strain curves of rock model specimens under the action of four kinds of confining pressures. The variation trends of the four kinds of stress–strain curves have little difference. The stress–strain curves can still be divided into four stages, but they are different from the traditional four stages.
It can be seen intuitively that the OA section of the curve is a straight line, indicating that the stress–strain changes linearly at this stage and the stress–strain should become a proportional relationship, which conforms to Hooke’s law, namely, the OA section of the stress–strain curve is the elastic stage of rock. In the AB stage, the curve changes from a straight line to a curve, the stress–strain relationship is no longer linear proportional, and the slope value of the curve decreases gradually from large. In other words, the constant
In addition, it is found that the four confining pressure rates have different effects on the brittle–ductility transformation of model specimens through stress–strain curves. As the confining pressure rate increases, the ductility stage of the model specimen is more obvious, that is, the higher the confining pressure rate is, the longer the ductility stage is. Similar to the yield and strengthening stage of plastic materials, the stress increases slowly or in a state of fluctuation, while the strain increases all the time.
The Poisson’s ratio
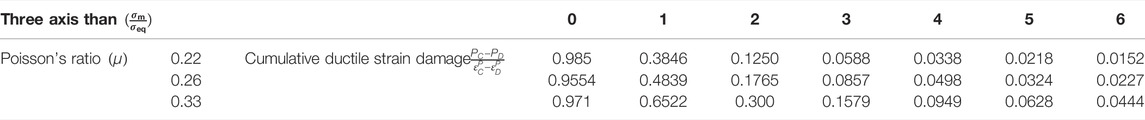
TABLE 4. Cumulative ductile damage of rock under different strain conditions.
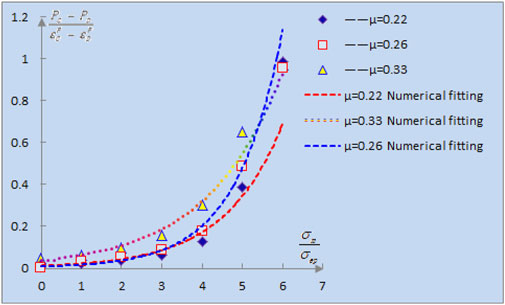
FIGURE 13. Ductile damage of rock under different loading rates and Poisson’s ratios.
Combined with Table 4 and Figure 13, ductility damage failure formulas of rocks with three Poisson ratios
When Poisson’s ratio
When Poisson’s ratio
When Poisson’s ratio
According to the data presented in Figure 13, it is found that the damage accumulation trend of rock is almost the same at the beginning of loading with three different Poisson’s ratios
4 Conclusion
1) With the help of continuum damage mechanics, the damage constitutive equation of rock was derived without considering the motion effect and temperature effect, and when compared with the constitutive equation of numerical test software RFPA3D, it was found that the derived damage constitutive equation could adapt to it; so, the numerical test software was used to calculate the numerical simulation test of rock. The numerical test results are very similar to the physical test results, and the failure modes and mechanical properties of the rock are very similar. The numerical test software can avoid the environmental factors and the sensitivity of the equipment in the physical experiment and can do a large number of numerical tests to fully study the various fracture forms and brittle–ductility transformation mechanical properties of rock.
2) Under different confining pressure rates, abnormal failure of rock models occurs with different confining pressure rates. It is found from the stress diagram that the loading rate has little effect on the rock stress at the initial stage of confining pressure loading. With the increase of confining pressure, the variation of rock stress is small after the rock enters the ductility stage, but the strain increases all the time, and the stress diagram of rock in ductility stage varies greatly under different rates. In addition, it can also be concluded from the macroscopic stress failure diagram that under different confining pressure rates, the failure forms of rock are greatly different. The higher the rate, the shorter is the failure time of rock, and the failure forms also expand from the initial splitting failure to shear failure.
3) The propagation of acoustic emission and the macroscopic fracture of rock can correspond to it. Through acoustic emission diagram, the crack propagation of rock under different confining pressure rates can be intuitively seen. At the initial stage of model calculation, the rock is in the compaction stage, and the acoustic emission is relatively concentrated. However, with the decrease of porosity, the intensity of acoustic emission decreases correspondingly, indicating that the rock is in the elastic to ductility stage. The brittle–ductility stage of rock decreases with the increase in confining pressure velocity. With the increase of confining pressure, the brittle–ductility transition stage is shortened and the ductility stage is gradually increased, which also reflects the superiority of RFPA3D software.
4) Combined with conclusions 2 and 3, the stress–strain curve is more intuitive and it can be seen that the rock model conforms to Hooke’s Law at the initial stage of calculation, but with the increase in loading rate,
5) Through the ductility cumulative damage data fitting almost unanimously found in the rock brittleness phase development tendency and according to the brittle ductility damage equation of rocks
Data Availability Statement
The original contributions presented in the study are included in the article/supplementary material; further inquiries can be directed to the corresponding author.
Author Contributions
The preparation of the initial version of the manuscript and figures was performed by ZT, CT, CY, and YL. SC and YJ are responsible for providing theoretical guidance and article revision. All authors discussed the results and conclusions and contributed to the final version of the manuscript.
Funding
This work was financially supported by the State Key Laboratory Construction Project Plan (No. GRMR202002), the National Natural Science Foundation of China (No. 42050201), and the Inner Mongolia Natural Science Foundation Project (Nos. 2020MS05041 and 2021MS05059).
Conflict of Interest
The authors declare that the research was conducted in the absence of any commercial or financial relationships that could be construed as a potential conflict of interest.
Publisher’s Note
All claims expressed in this article are solely those of the authors and do not necessarily represent those of their affiliated organizations, or those of the publisher, the editors, and the reviewers. Any product that may be evaluated in this article, or claim that may be made by its manufacturer, is not guaranteed or endorsed by the publisher.
References
Cao, W., Zhao, M., and Liu, C. (2004). Study on the Model and its Modifying Method for Rock Softening and Damage Based on Weibull Random Distribution. Chin. J. Rock Mech. Eng. 23 (19), 3226–3231. doi:10.1007/BF02911033
Chen, C., Zhuo, Y., Han, J., Wang, X., and Feng, X. (2016). Transformation Study on Brittle Ductile Properties of Deep Rock. Min. Res. Dev. 36, 90–93. doi:10.13827/j.cnki.kyyk.2016.04.022
Huang, R., and Huang, D. (2010). Experimental Research on Affection Laws of Unloading Rates on Mechanical Properties of Jinping Marble under High Geostress. Chin. J. Rock Mech. Eng. 29 (01), 21–33.
Jiang, X., Tian-yu, M. A., Okubo, S., Shou-jian, P., Tang, Y., Chen, C., et al. (2017). Experimental Study of Generalized Stress Relaxation Characteristics of Rock under Different Confining Pressures. Rock soil Mech. 38 (S2), 57–66. doi:10.16285/j.rsm.2017.S2.008
Kang, Y., Jia, Y., Luo, Y., and Chen, J. (2017). Research on the Theoretical and Experimental Value of Azimuth Angle of the Fracture Surface for the Rock Subjected to Triaxial Compression. J. Xi'an Univ. Archit. Technol. Sci. Ed. 49 (05), 665–670. doi:10.15986/j.1006-7930.2017.05.008
Li, G., Cheng, X., Hu, L., and Tang, C. (2021a). The Material-Structure Duality of Rock Mass: Insight from Numerical Modeling. Int. J. Rock Mech. Min. Sci. 144, 104821. doi:10.1016/J.IJRMMS.2021.104821
Li, G., Zhao, Y., Hu, L., Qi, S., and Tang, C. (2021b). Simulation of the Rock Meso-Fracturing Process Adopting Local Multiscale High-Resolution Modeling. Int. J. Rock Mech. Min. Sci. 142, 104753. doi:10.1016/J.IJRMMS.2021.104753
Liang, Z., and Song, W. (2021). Theoretical and Numerical Investigations of the Failure Characteristics of a Faulted Coal Mine Floor above a Confined Aquifer. Mine Water Environ. 40 (2), 456–465. doi:10.1007/S10230-021-00780-4
Liu, X., and Jin, J. (2011). Continuum Damage Mechanics. Arlington, Virginia: National Defense Industry Press.
Qiu, S., Feng, X., Zhang, C., Zhou, H., and Sun, F. (2010). Experimental Research on Mechanical Properties of Deep-Buried Marble under Different Unloading Rates of Confining Pressures. Chin. J. Rock Mech. Eng. 29 (09), 1807–1817.
Shen, S., Wu, J., Zhai, X., and Shi, W. (2017). Variation of Mechanical Properties of Coal and Rocks in the Deep Mine In-Situ Stress Field. J. Min. Saf. Eng. 34 (06), 1200–1206. doi:10.13545/j.cnki.jmse.2017.06.025
Tang, C., Wang, S., and Fu, Y. (2003). Numerical Test of Rock Fracture Process. Beijing, China: Science press.
Tang, S., Wang, J., and Tang, C. (2020). Identification of Microseismic Events in Rock Engineering by a Convolutional Neural Network Combined with an Attention Mechanism. Rock Mech. Rock Eng. 54 (1), 47–69. doi:10.1007/s00603-020-02259-0
Tian, Z., Tang, C. a., Liu, Y., and Tang, Y. (2020). Zonal Disintegration Test of Deep Tunnel under Plane Strain Conditions. Int. J. Coal Sci. Technol. 7 (2), 337–349. doi:10.1007/s40789-020-00319-y
Tian, Z., Tang, C., Li, H., Xing, H., and Ning, X. (2021). Numerical Simulation of Rock Uniaxial Compressive Strength and Deformation Failure Law under Different Size Conditions. Adv. Civ. Eng. 2021 (2), 1–11. doi:10.1155/2021/6643884
Walton, G., Gaines, S., and Alejano, L. R. (2021). Validity of Continuous-Failure-State Unloading Triaxial Tests as a Means to Estimate the Residual Strength of Rocks. J. Rock Mech. Geotechnical Eng. 13 (4), 717–726. doi:10.1016/J.JRMGE.2021.01.009
Wang, S., Xu, W., Wang, W., Wang, R., and Xiang, Z. (2017). The Statistical Damage Constitutive Model of Rocks and its Experiment. J. Hohai Univ. Nat. Sci. 45 (05), 464–470. doi:10.3876/j.issn.1000-1980.2017.05.014
Wu, X., Liu, J., Liu, X., Zhao, K., and Zhang, Y. (2015). Study on the Coupled Relationship between AE Accumulative Ring-Down Count and Damage Constitutive Model of Rock, J. Min. Saf. Eng. 32(01):28–34. doi:10.13545/j.cnki.jmse.2015.01.005
Xiao, W., Wang, X., Li, S., Yu, Z., Huang, G., and Qi, Y. (2017). Analysis on Deformation Characteristics of Rock in Triaxial Compression Process with Seepage Pressure. J. Saf. Sci. Technol. 13 (12), 38–42.
Xie, H., Gao, M., Fu, C., Lu, Y., Yang, M., Hu, J., et al. (2021). Mechanical Behavior of Brittle-Ductile Transition in Rocks at Different Depths. J. China Coal Soc. 46 (3), 701–715. doi:10.13225/j.cnki.jccs.yt21.0157
Zhang, C., Lei, Y., and Cao, W. (2020). Damage Constitutive Model of Brittle Rocks Considering Double Deformation Characteristics of Soft and Hard Materials. Chin. J. Appl. Mech. 37 (3), 1166–1398.
Zhang, K., Zhou, H., Pan, P., Shen, L., Feng, X., and Zhang, Y. (2010). Characteristics of Strength of Rocks under Different Unloading Rates. Rock soil Mech. 31 (07), 2072–2078. doi:10.16285/j.rsm.2010.07.043
Keywords: confining pressure, loading rate, brittle–ductility, RFPA3D, numerical simulation
Citation: Tian Z, Tang C, Yu C, Liu Y, Chen S and Jin Y (2022) Numerical Simulation Analysis of Mechanical Properties on Rock Brittle–Ductility Transformation Under Different Loading Rates. Front. Earth Sci. 10:825229. doi: 10.3389/feart.2022.825229
Received: 06 December 2021; Accepted: 10 June 2022;
Published: 22 July 2022.
Edited by:
Chaojun Jia, Central South University, ChinaReviewed by:
Shuisheng Yu, Zhongyuan University of Technology, ChinaWenhao Shi, Suzhou University of Science and Technology, China
Copyright © 2022 Tian, Tang, Yu, Liu, Chen and Jin. This is an open-access article distributed under the terms of the Creative Commons Attribution License (CC BY). The use, distribution or reproduction in other forums is permitted, provided the original author(s) and the copyright owner(s) are credited and that the original publication in this journal is cited, in accordance with accepted academic practice. No use, distribution or reproduction is permitted which does not comply with these terms.
*Correspondence: Zhichao Tian, YmFpbGV5MjgwQDE2My5jb20=