 Fujing Sun
 Jianmeng Sun1,2*
94% of researchers rate our articles as excellent or good
Learn more about the work of our research integrity team to safeguard the quality of each article we publish.
Find out more
ORIGINAL RESEARCH article
Front. Earth Sci. , 23 March 2022
Sec. Economic Geology
Volume 10 - 2022 | https://doi.org/10.3389/feart.2022.824352
This article is part of the Research Topic New Advances in Geology and Engineering Technology of Unconventional Oil and Gas View all 24 articles
Accurate gas saturation calculations are critical to evaluating the production of marine shale gas reservoirs. As a high-resolution exploration method, geophysical resistivity well-logging technology has been widely applied in almost all types of oil/gas reservoirs to evaluate formation fluid saturation. Although the calculated saturations are accurate for conventional reservoirs, it is a challenging task to acquire the gas saturation of shale gas reservoirs due to the presence of complex rock compositions and fluid types. It is necessary to analyze different influencing factors on electrical properties to establish a more applicable gas saturation model for marine shales. In this work, we make full use of geological data, well logging data, and rock experiment data to analyze the influencing factors of electrical properties in the Wufeng-Longmaxi Formation in the Sichuan Basin, China. Six conductive factors are studied, including stratigraphic structures, clay minerals, pyrite, organic matter, pore structures, and formation fluids. Then, a shale conductivity model is developed, in which high- and low-resistivity layers are connected in parallel. Based on the conductivity model, a new method for influencing factors of stepwise stripping conductivity is proposed to calculate shale gas saturation. Finally, by interpreting the well logging data of two shale gas wells, we compared the saturation calculation results of different methods to demonstrate the accuracy of the new method. The results show that thin, low-resistivity layers, clay minerals, pyrite and overmature carbonized organic matter reduce the resistivity of shale and weaken the contribution of fluids to the measured shale resistivity. Moreover, the calculation accuracy of this new method is better than that of Archie’s equation, Simandoux’s equation, and the neutron-density porosity overlay method. The findings of this paper will help gain insight into the mechanism of resistivity responses for marine shale reservoirs and improve the accuracy of the estimated gas saturation.
Due to the influence of the “peak oil” theory (Brandt et al., 2013), researchers have gradually focused on unconventional oil and gas resources for the advancement of technological breakthroughs in exploration and development (Yasin et al., 2019; Dong et al., 2020; Du et al., 2021; Golsanami et al., 2021). Among the unconventional resources, shale gas has become one of the most promising fossil resources since the advancement of multistage hydraulic technology and horizontal drilling processes (Soeder, 2018; Bakhshi et al., 2020; Wang et al., 2021). Compared with conventional sandstone gas, shale gas has unique characteristics, such as nanosized storage pore spaces (Wu et al., 2020a), unusual gas flow mechanisms (Li et al., 2019) and different existing states (free gas and adsorbed gas) (Zhu et al., 2021). In addition, a high content of organic matter exists in marine shales (Zhu et al., 2019). Because of the high cost of shale gas production, gas saturation must be accurately calculated in advance to determine whether a shale gas well is worthy of commercial production.
As a fine exploration method, geophysical resistivity well logging technology has been widely applied in almost all types of oil/gas reservoirs to evaluate the fluid saturation of formations (Golsanami et al., 2020). The most classical saturation model is Archie’s equation (Archie, 1942), which is expressed as follows:
where Sw represents the water saturation, decimal; Rt is the logging resistivity, Ω·m; Rw is the formation water resistivity, Ω·m; ϕ is porosity, decimal; m represents the cementation index; n represents the saturation index; and a and b are lithologic coefficients. Although Archie’s equation has been applied in conventional reservoirs for decades, it only considers the influence of the conductivity of water in pores. However, based on X-ray diffraction (XRD) analysis, it is known that marine shales usually contain quartz, feldspar, carbonate, clay and pyrite (Zhang et al., 2019). Pyrite and some clay minerals have an inherently high electrical conductivity, which affects rock resistivity (Hamada et al., 2001; Savage et al., 2008). It is a challenging task to acquire the gas saturation of shale gas reservoirs due to their complex rock compositions and fluid types. Therefore, a full understanding of the influences of different factors on shale resistivity is needed. Although there are many studies using laboratory electrical experiments to study shale resistivity (Zhong et al., 2021; Han et al., 2015; Senger et al., 2020), the resistivity index is still hard to determine due to difficulties associated with the drainage process. Recently, some scholars have used digital rock simulations to study the effects of different components on shale resistivity (Wu et al., 2020b), which provides a new description of the electrical mechanisms of shale. However, their conclusions are not entirely consistent. Nie et al. (2016) used the finite element method to simulate the resistivity of shale gas reservoir rock and found that the clay mineral content and pyrite content reduced the shale resistivity substantially, while organic matter had little influence on resistivity. Zhang et al. (2017a) fitted the gas saturation and density, neutron, apparent density porosity and apparent neutron porosity difference of rock samples respectively, and established the calculation formula of gas saturation by using non electric logging information. Wu et al. (2020c) verified the negative relationship between clay minerals and resistivity, but they believed that organic matter could reduce shale resistivity. There is still a lack of systematic analysis of the influencing factors on the electrical properties of marine shale.
Due to the many factors affecting shale resistivity and the complex conductivity mechanism, the effective resistivity-based marine shale gas saturation calculation method is seldom used. Most oil service companies in China use shaly sand models [e.g., Simandoux’s equation (Simandoux, 1963)] to calculate the gas saturation of shale, but the calculated saturation results have large errors associated with the core analysis values. Kadkhodaie and Rezaee (2016) proposed a new correlation method for water saturation calculations in gas shale reservoirs, but they did not take the effects of thin, low-resistivity layers and pyrite into consideration in the saturation model. Nonelectric logging data can also be used to calculate gas saturation. Zhao et al. (2020) constructed digital cores with different fracture widths and found that when the fracture width is narrow, the fracture has no significant effect on the resistance increase coefficient. When the fracture width is wide, there is a nonlinear relationship between resistance increase coefficient and water saturation in double logarithmic coordinates. Sun et al. (2018) studied the abnormal low resistance of the reservoir in the exploration and development of shale gas in the Yangtze region, and obtained six main factors causing the low resistance of shale reservoir: high clay content, over mature organic matter, high pyrite content, high water salinity, poor reservoir physical properties and excellent geological conditions. According to the relationships among the total water saturation, VP-to-VS ratio and total porosity, Liu et al. (2018) developed a method for calculating the water saturation of shale gas reservoirs. Zhang et al. (2017b) proposed the neutron-density porosity overlay method to calculate gas saturation, which worked well in their studied marine shale gas wells. However, to make full use of resistivity logging data, the conductive influencing factors need to be considered comprehensively before proposing a gas saturation model.
In this study, we took the Wufeng-Longmaxi Formation in the Sichuan Basin [the most promising shale gas plays in China (Chen et al., 2020)] as a typical example to analyze the influencing factors of electrical properties and develop a new resistivity-based gas saturation model. The resistivity logging results show that high-resistivity layers (> 100 Ω m), medium-resistivity layers (5–100 Ω m) and low-resistivity layers (< 5 Ω m) coexist in marine shale gas wells. We first utilized geological data, well logging data, and rock experiment data to analyze six influencing factors (stratigraphic structure, clay, pyrite, organic matter, pore structure, and formation fluid) of electrical properties in the Wufeng-Longmaxi Formation. Then, according to the formation types and conductive components, we proposed a new shale conductivity model. A procedure employing the stepwise stripping of conductivity influencing factors was also proposed to calculate the shale gas saturation. Finally, we applied different saturation models to two shale gas wells and verified the accuracy of the new method.
During the bottom deposition period of the Wufeng-Longmaxi Formation in the Sichuan Basin, several large-scale volcanic eruptions occurred, and tuff materials from the volcanic eruptions were deposited, formed and altered in a marine alkaline environment to form potassium bentonite (Chen et al., 2019). The coring report shows that there are more than 20 thin layers of potassium bentonite in the bottom strata of the Wufeng-Longmaxi Formation, with a single layer thickness of 1–2 cm, even reaching up to 30 cm in some locations. Figure 1A shows a thin layer in a full diameter core sample. Bentonite is a claystone whose main composition consists of smectite, illite and illite-smectite mixed layers (Wang et al., 2019). According to the literature, these clay minerals have high cation exchange capacity (CEC) values, which decrease the resistivity of the rock (Yan et al., 2018). Therefore, the potassium bentonite layers are thin, low-resistivity layers, which appear as dark bands on the image collected from the formation micro imager (FMI) logging tool, as shown in Figure 1B.
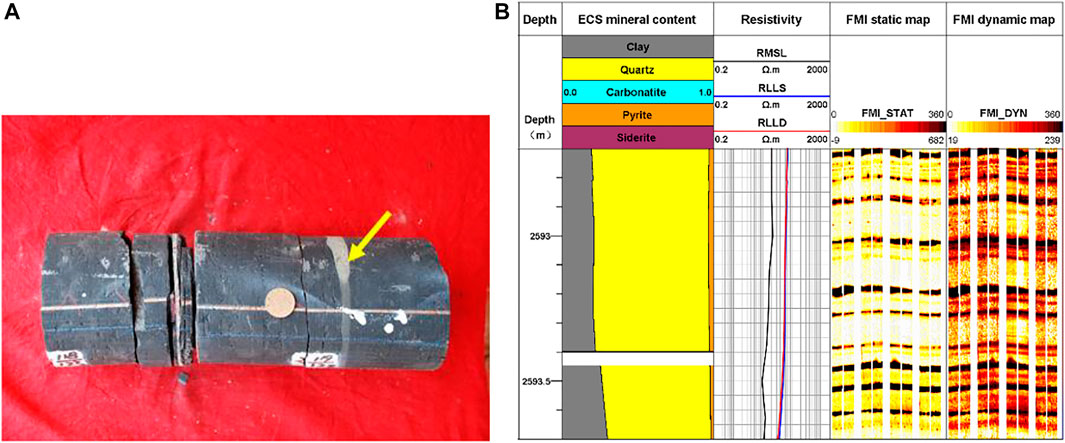
FIGURE 1. Core characteristics and FMI image of the thin, low-resistivity layer: (A) core sample; (B) FMI image.
The vertical resolution of the deep lateral resistivity (RLLD) logging tool is approximately 0.9 m, and the shale resistivity has high anisotropy in the range of vertical resolution affected by thin, low-resistivity layers. Controlled by a shield electrode and loop electrode, deep lateral logging currents flow horizontally into the layer, and the measured resistivity is more notably influenced by the horizontal resistivity. However, the horizontal resistivity is obviously smaller than the vertical resistivity (Klein and Martin, 1997). Therefore, the measured resistivity is too low, which leads to the underestimation of the actual gas saturation of marine shale reservoirs based on traditional fluid saturation calculation models. When the thin, low-resistivity layer is not developed and the FMI image shows bright blocky characteristics, the resistivity of shale is high due to the discontinuous conductive pathway.
In addition to the macroscopic characteristics of thin, low-resistivity layers, there are different types of microlaminations. By combining the thin section analysis and quantitative evaluation of minerals with SCANning electron microscopy (QEMSCAN) techniques, organic-rich lamination (Figure 2A), silt lamination (Figures 2B,F), clay lamination (Figures 2E, 3C) and pyrite lamination (Figure 2D) are observed. The lamination shows patchy, vein-like, lenticular or linear distribution shapes, with thicknesses of approximately 0.1–1 mm. The continuous microscopic distribution of clay lamination, pyrite lamination and organic lamination can provide a continuous conductive pathway for electric current, which reduces the resistivity of shale.
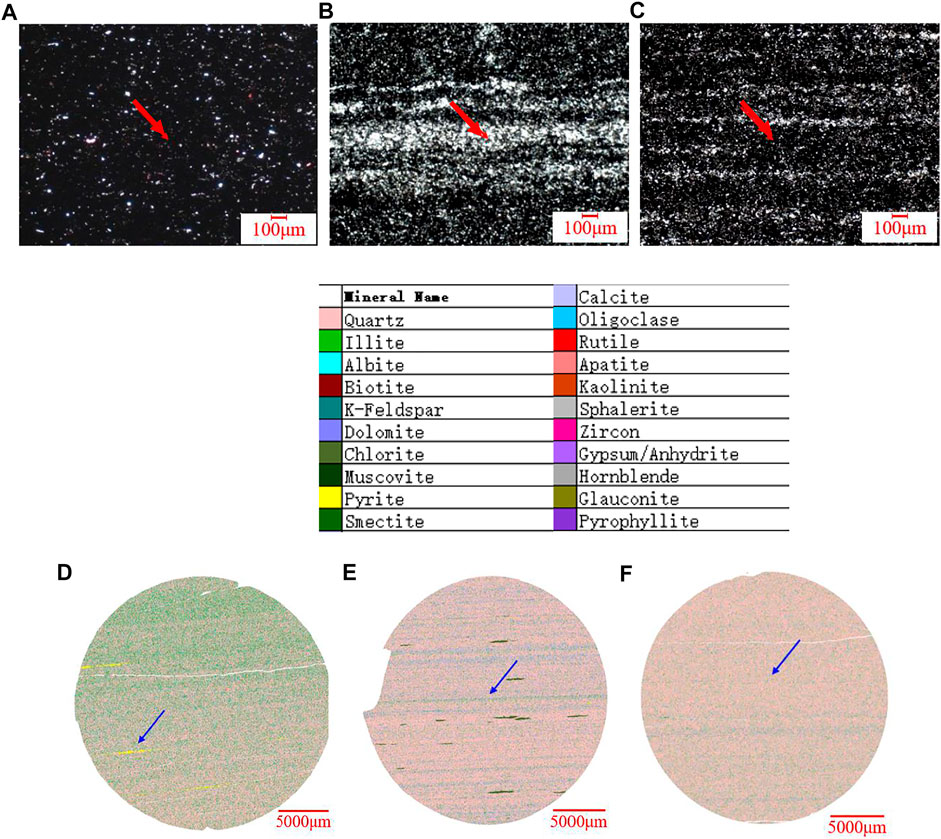
FIGURE 2. Microlamination characteristics of shale: (A–C) thin sections of organic-rich lamination, silt lamination and clay lamination; (D–F) QEMSCAN images of pyrite lamination, clay lamination and silt lamination.
Moreover, the marine organic-rich shale in the studied formation has unique depositional patterns, similar to those of stable ocean basins with low subsidence rates and low sedimentation rates (Zou et al., 2015). At the shale deposition stage, when periodic changes in energy, temperature and salinity exist, parallel shale beddings are readily developed. Shale bedding forms mechanically weak surfaces that usually alter under induced fracturing when encountering tectonic stress concentrations or excessive formation pressures. In addition, high silica contents, high organic matter contents and high hydrocarbon generation pressures can also cause shale bedding fractures. During the drilling process, these fractures are filled with highly saline mud filtrate, which decreases shale resistivity.
In our study, clay minerals refer to fine-grained (less than 2 μm in diameter) aqueous aluminosilicate minerals with a layered crystalline structure. The X-ray diffraction (XRD) results show that the total clay mineral content of shale samples taken from the Wufeng-Longmaxi Formation is between 16 and 63%, and the clay minerals are mainly composed of illite-smectite mixed layers, illite and chlorite. Clay minerals have obvious influences on the resistivity of shale for two reasons. First, some clay minerals have high cation exchange effects, which increase the electrical conductivity. Smectite has the strongest cation exchange capacity, with CEC values ranging from 0.4 to 1.5 meq/g. The average CEC value of illite is 0.25 meq/g, and the low CEC value of chlorite is close to 0.05 meq/g (Silva et al., 2018). When the content of mixed layer is high, the additional conductivity of montmorillonite and mixed layer is the most obvious, which leads to the significant reduction of reservoir resistivity (Xie et al., 2019). In addition, the negative charges present on clay surfaces can adsorb polar water molecules and form conductive water bounds. Smectite and illite adsorb a large number of water molecules due to their large specific surface area, which decreases the resistivity of rock.
Figure 3A shows the well logging data (gamma spectra, lithology curves, porosity curves and resistivity curves) of conventional logging tools and elemental capture spectroscopy (ECS) logging data of the Longmaxi (abbreviated as Long) Formation in marine gas well J1. The uranium curve (U) illustrates that both the total organic matter contents and the associated pyrite contents are low, which cannot have caused the resistivity difference between Long A New Shale Conductivity Model and Long Gas Saturation Calculation Procedure. However, the average shale resistivity of Long Gas Saturation Calculation Procedure is 35 Ω m, which is much smaller than that of the Long A New Shale Conductivity Model (50–1,000 Ω m). According to the interpreted clay content curve from the ECS data, the clay content of Long A New Shale Conductivity Model is higher than that of Long Gas Saturation Calculation Procedure, resulting in the resistivity difference observed between the two sections. Figure 3B shows the relationship between the measured resistivity (RLLD) and clay content. There is a strong negative correlation between the resistivity and the clay content, which is expressed as Eq. 2, indicating that clay is one of the main factors affecting resistivity.
where Rt is the deep lateral resistivity, Ω·m; and Vsh is the clay content, %.
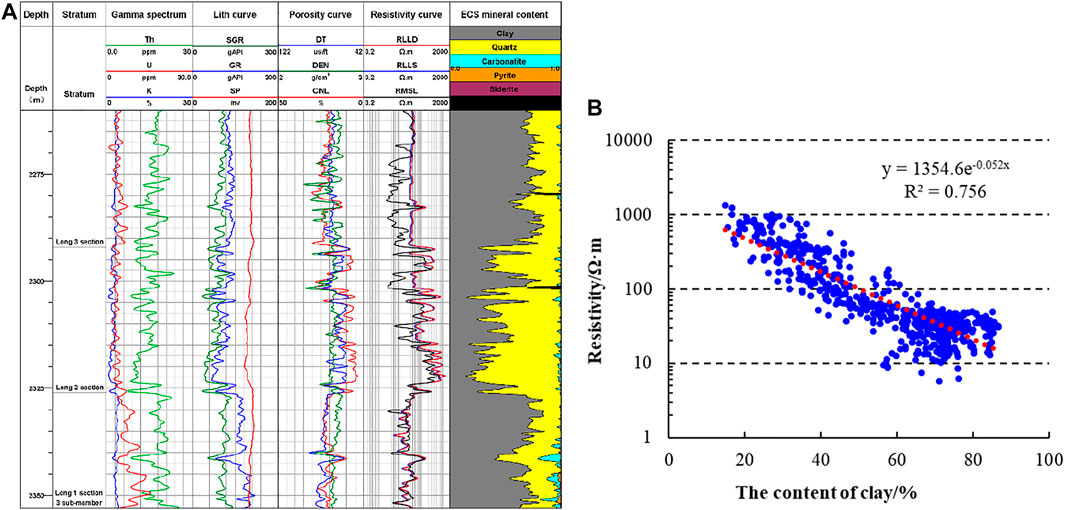
FIGURE 3. (A) Well logging data of the Longmaxi Formation in well J1; (B) the relationship between resistivity and clay content.
Pyrite is a metal sulfide (FeS2) with a high density (4.9–5.2 g/cm3) and a low resistivity (10−5∼1 Ω m) (Kennedy, 2004). Unlike the ionic conductivity of formation water, the charge carrier of pyrite is electrons. The regular arrangement of iron and sulfur atoms in the crystal structure explains the very high conductivity of pyrite. Clavier et al. (1976) found that when the pyrite content of a rock sample was greater than 7.0%, the conductivity of dry rock was also high. Especially when pyrite was distributed in strips to form a continuous conductive pathway, the resistivity decreased in a spike shape. Clavier et al. according to the experimental study on the influence ability of dispersed pyrite under the condition of resistivity measurement at different frequencies, it is found that the content of pyrite increases and the correction coefficient of electric logging increases (Sun et al., 2018). Marine shale in the Wufeng-Longmaxi Formation was deposited in deep water, and a stable and anoxic depositional environment assisted in the formation and preservation of pyrite. At the large-scale level, there are two main types of pyrites, including striped pyrite (Figure 4A) and patchy pyrite (Figure 4B). These pyrite aggregates can be identified in the FMI image. With scanning electron microscopy (SEM) analysis, we can see that pyrite usually forms in a strawberry shape on the microscale (Figure 4C).
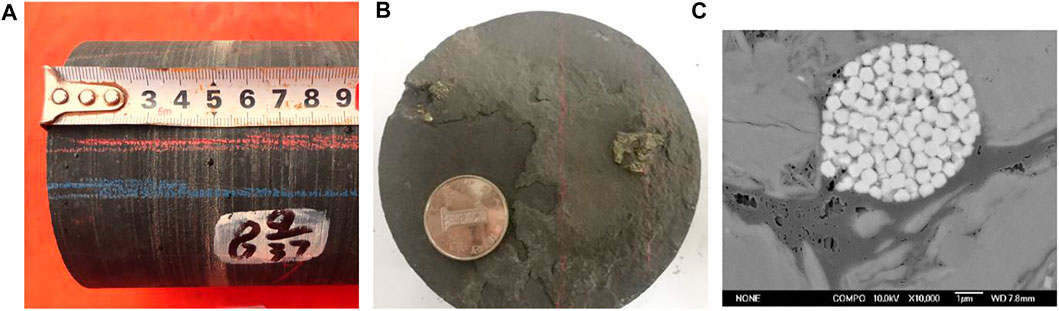
FIGURE 4. Different types of pyrites: (A) striped pyrite; (B) patchy pyrite; and (C) strawberry-shaped pyrite.
Figure 5 shows the relationship between the laboratory-measured pyrite content and the resistivity of the shale samples collected from several marine shale gas wells. It is concluded that when the pyrite content is less than 6.0%, there is no obvious correlation between the shale resistivity and pyrite content. However, when the pyrite content is greater than 6.0%, the shale resistivity decreases significantly.
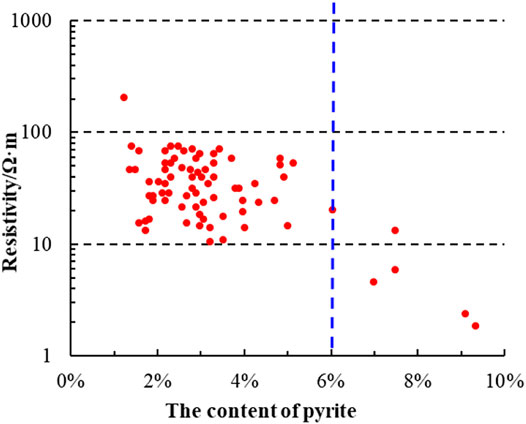
FIGURE 5. The relationship between shale resistivity and pyrite content.
As an important source rock, gas-bearing shale contains organic matter. During the early formation stage, the resistivity of immature shale is low (Hinds and Berg, 1990). With increasing thermal maturity, the amount of hydrocarbons generated from organic matter increases, and the low-resistivity water in the pore space is replaced by nonconductive oil and gas. Theoretically, the shale resistivity should be high in the highly mature or overmature stage. However, although the average vitrinite reflectance (Ro) of the studied shale is greater than 2.0%, the shale resistivity is not high. The main factor preventing the shale resistivity from rising is the carbonization of organic matter. With increasing thermal maturity, the H/C ratio decreases, and the aromaticity of organic matter increases (Mao et al., 2010). The structure of carbon-rich and aromatized organic matter is similar to that of graphite (resistivity ranges from 8 × 10⁻⁶ Ω m to 13 × 10−6 Ω m), which is a semiconductor or conductor. Wang et al. (2018) studied organic matter carbonization in Longmaxi Formation shale and found that the lower limit of Ro for carbonization was 3.5%. Shale with an Ro less than 3.4% does not show organic matter carbonization, while shale with an Ro between 3.4 and 3.5% may show weak organic matter carbonization. Xie et al. (2017) through the comparative analysis of coring data and logging curves of many wells pointed out that there is a good negative correlation between TOC content and density. With the decrease of density, TOC increases and maturity becomes higher. After the hydrocarbon with low hydrogen content turns into graphite, the conductivity increases, the resistivity decreases and the gas content becomes worse. Therefore, overmature carbonized organic matter reduces the resistivity of shale.
To analyze the effect of total organic carbon (TOC) on shale resistivity, we measured the TOC contents of shale samples from Long Analysis of Influencing Factors on Electrical Properties for Marine Shale in well J1 and established the relationship between resistivity and the TOC content (Figure 6A). The resistivities and TOC contents in well logging curves of well J1 are shown in Figure 6B. As shown in Figure 6A, the correlation between TOC content and resistivity is poor and the influence of organic matter content on shale resistivity is not obvious. Therefore, TOC content is not added to the model.
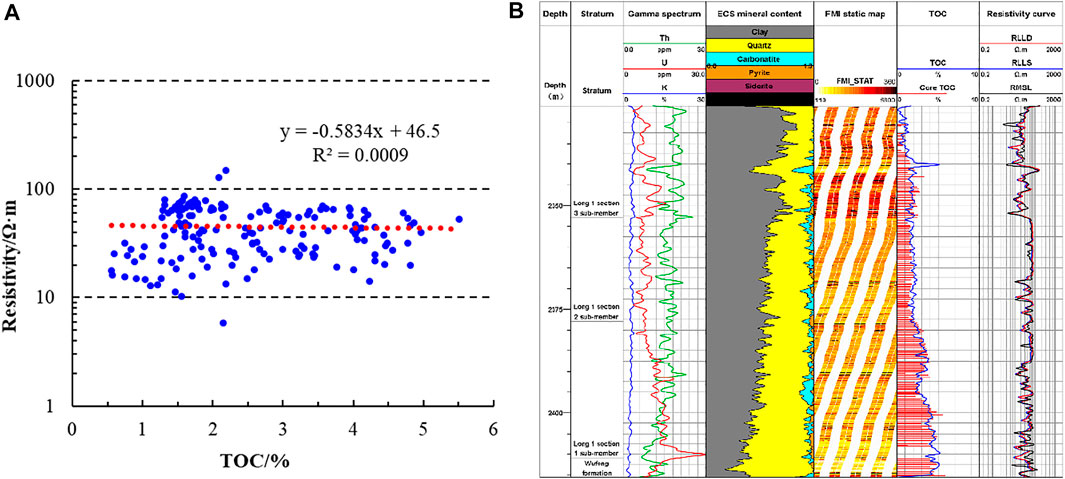
FIGURE 6. (A) Relationship between TOC content and resistivity; (B) well logging data in well J1.
In a previous study, we utilized SEM images to describe different types of pores in marine shale gas samples, including dissolved inorganic pores, pores between strawberry pyrite crystals, organic pores and microfractures (Zeng et al., 2020), but the effect of pore structure on shale resistivity was unclear. The porosity of shale in the Wufeng-Longmaxi Formation is generally less than 8.0%, and the permeability is less than 0.1 mD. To analyze the effect of porosity on shale resistivity, the relationship between the porosity and resistivity (RLLD) of the shale from well J1 is analyzed, as shown in Figure 7A. There is no correlation between the shale porosity and the measured resistivity and dry sample porosity can not effectively characterize the change of resistivity. The shale resistivity is measured by well logging tools, and nonconductive gas fills the pore space of shale. Therefore, there are many other factors controlling resistivity. To solve this problem, we performed resistivity experiments on 27 fully water saturated shales and then investigated the relationship between resistivity and porosity (Figure 7B). There is a weak negative correlation between the porosity and shale resistivity under the water-saturated state. The correlation is better when the porosity is greater than 3.0%, which indicates that water saturated porosity is also an influencing factor of electrical properties.
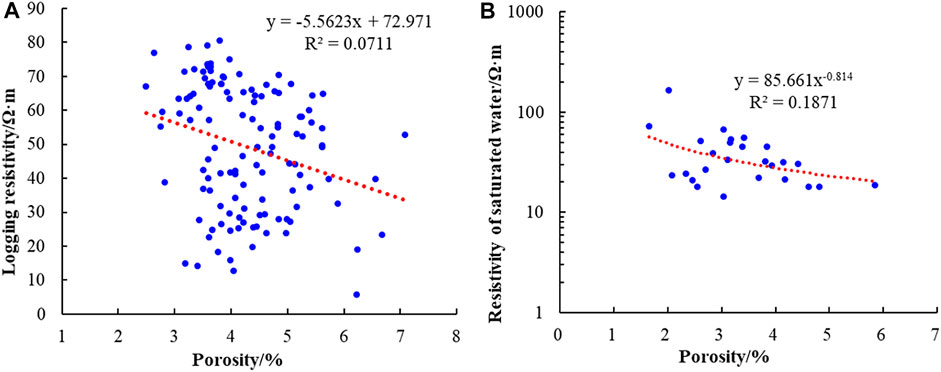
FIGURE 7. Relationship between porosity and resistivity: (A) porosity and logging resistivity (RLLD); (B) porosity and resistivity of shale in a water-saturated state.
Pore structure refers to the geometry and size of pores and throats in rocks and their configuration relationships, which has been demonstrated to be an important factor affecting resistivity (Wang et al., 2018). However, research on the relationship between the pore structure and resistivity of marine shale is still limited. As an advanced nondestructive technology, nuclear magnetic resonance (NMR) has been widely used in studying pore structures of both conventional (Golsanami et al., 2019; Li et al., 2017) and unconventional rocks (Yan et al., 2017; Yan et al., 2019; Dong et al., 2020). In this work, we applied NMR and resistivity measurements to water-saturated shale samples to study the influence of pore structure on electrical properties. The T2 spectra of shale samples with similar porosities are compared, as shown in Figure 8. The porosities of shale samples J7-1 and J7-2 are 2.34 and 2.46%, respectively, and their resistivities are 24.46 Ω m and 20.48 Ω m, respectively. Through the comparisons of T2 spectra (Figure 8A), we can see that shale J7-2 has a high first peak amplitude (short transverse relaxation time). Shale samples J5-3 and D3-5 have the same porosity of 3.16%, and their resistivities are 53.65 Ω m and 49.8 Ω m, respectively. Figure 8B shows that the T2 of the highest peak of shale D3-5 is longer than that of shale J5-3. For shale samples, Gao et al. (2018) verified that a long T2 represents large pores, and a short T2 represents small pores. Therefore, it is concluded that the larger the proportion of large pores is, the lower the resistivity of the shale.
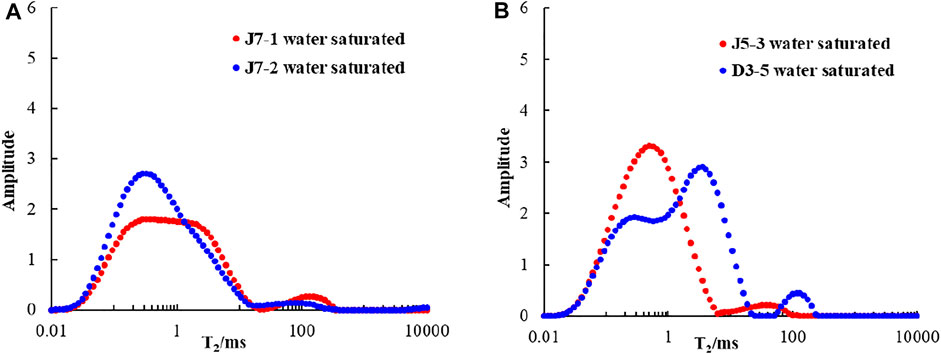
FIGURE 8. Comparisons of T2 spectra of different shale samples: (A) J7-1 and J7-2; (B) J5-3 and D3-5.
Highly saline formation water is considered to be one of the most important factors forming low-resistivity oil and gas layers (Pan et al., 2001). The marine shale in the study area was deposited in a marine environment with a seawater salinity of 35,000 mg/L. After deposition, compaction and hydrocarbon generation, the partial free formation water in shale is expelled or consumed, which increases the salinity of the remaining formation water. In the absence of original formation water data, the water analysis data of the adjacent Ordovician Baota Formation (O2b) are used as a reference for shale formation water. The formation water type of O2b is CaCl2 with an average equivalent NaCl salinity of 72,925 mg/L. According to the calculation of formation depth and temperature, the equivalent resistivity of formation water is 0.034–0.041 Ω m.
To analyze the effect of formation water salinity on shale resistivity, we first dried 26 shale samples by using a high-temperature oven instrument and then saturated them with 70,000 mg/L NaCl solution. Resistivity experiments were performed on shales with different fluid saturation states. Figure 9 shows that the resistivity of water-saturated shale is 1–2 orders of magnitude lower than that of dry shale, which also illustrates that high salinity formation water has an obvious effect on shale resistivity.
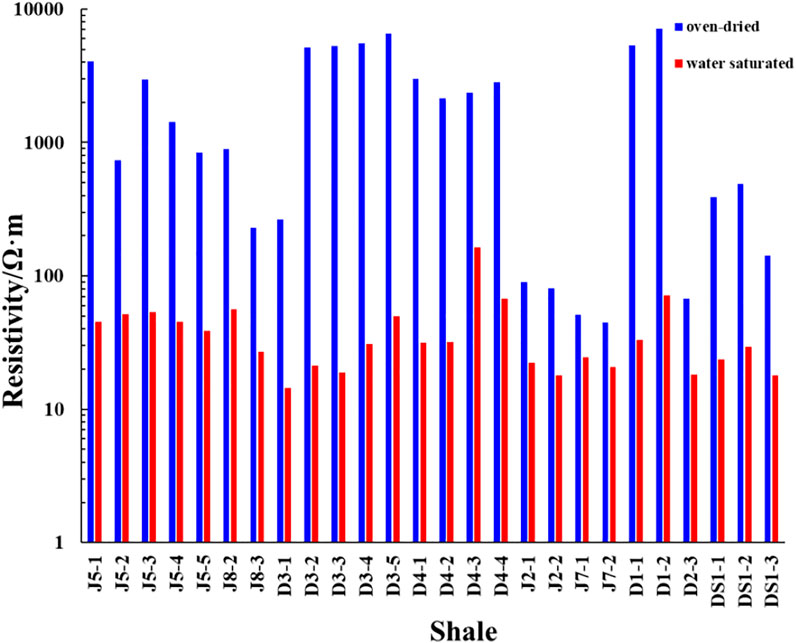
FIGURE 9. Resistivities of 26 shale samples in an oven-dried and water-saturated states.
Although shale resistivity is subject to the combined effects of multiple factors, natural gas still has a significant influence on shale resistivity. Based on the gas desorption volumes and resistivities of shales from 10 gas production wells, we made a cross-plot of gas content and logging resistivity, as shown in Figure 10.
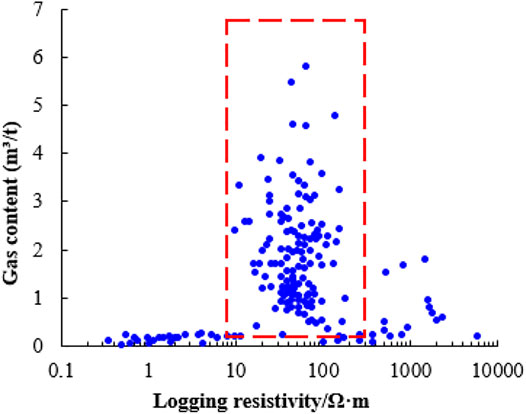
FIGURE 10. A cross-plot of shale gas content and logging resistivity, Blue dots are data points, within the red circle is medium-resistivity and high-production.
The above figure can be divided into three parts: low-resistivity and low-production, medium-resistivity and high-production, and high-resistivity and low-production.
1) Low-resistivity and low-production. When the shale resistivity is between 0.1 and 7 Ω m, the shale reservoir does not produce gas, or it produces a small amount of gas. The reason is that when the shale resistivity is low, regardless of whether it is caused by high water saturation or overmature carbonized organic matter, the shale contains little organic matter, which lacks sufficient conditions for gas production.
2) Medium-resistivity and high-production. When the shale resistivity is in the medium range (7–200 Ω m), the shale reservoir produces a large quantity of gas. Shale contains a high proportion of large size pores. Shale has sufficient and necessary conditions for encouraging gas production, which is referred to as the “resistivity window.”
3) High-resistivity and low-production. If shale develops with poor pore structures, the shale resistivity is over 200 Ω m, which lacks sufficient conditions for gas production.
In addition to free gas, there is adsorbed gas (accounting for more than 30% of the total porosity) in shale. Unlike free gas, which generally occupies the center of pores, adsorbed gas is adsorbed on the surface of shale pores and changes the fluid distribution (Memon et al., 2021). To analyze the effect of adsorbed gas on shale resistivity, a self-developed combined isothermal adsorption and resistivity measurement device (Figure 11A) was used to measure changes in shale resistivity by placing resistivity probes at both ends of the plunger sample while conducting isothermal adsorption experiments. We also compared the effects of methane and helium on shale resistivity. The experimental results show (Figure 11B) that the shale resistivity decreases with increasing pore gas pressure under a constant water saturation content. The shale resistivity decreases rapidly under low pressure and stabilizes under high pressure.
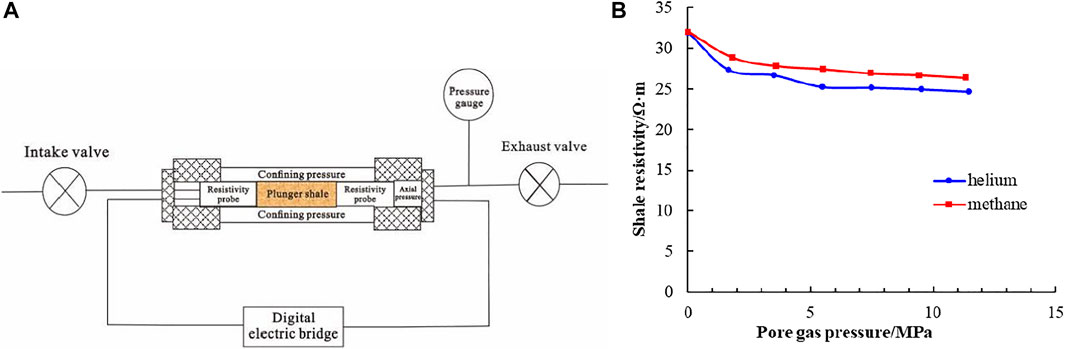
FIGURE 11. (A) A self-developed combined isothermal adsorption and resistivity measurement device; (B) the relationships between pore gas pressures and shale resistivities.
It is also concluded that shale resistivity with methane is greater than shale resistivity with helium under the same pore gas pressure. We use a schematic diagram of the pore fluid distribution in shale to explain it, as shown in Figure 12. The yellow, blue and red circles represent solid matrix molecules, helium molecules and methane molecules, respectively. Under a low electric field strength, gas is nonconductive, and only extremely weak currents pass through methane and helium. Therefore, the electrical properties of the shale depend mainly on the solid matrix and pore water distribution. When helium is injected, with increasing gas pressures, the effective stress on the shale decreases, and some microfractures and pore throats exist (Figure 12B). Adjacent pore water molecules enter the pore space, which decreases the shale resistivity. In addition, the free gas molecules squeeze the solid matrix particles, making the particles more tightly bound, which also enhances the electrical conductivity of shale. Compared with helium, methane has a stronger adsorption capacity. Partial methane molecules are adsorbed on organic matter and clay surfaces, and some conductive water molecules are replaced by nonconductive methane molecules. The continuity of the shale electric current is affected, which increases the shale resistivity.
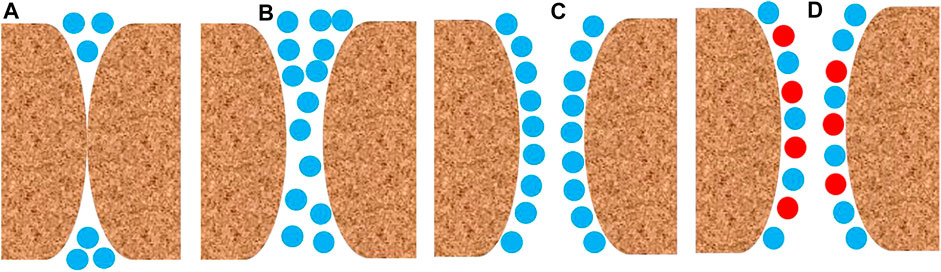
FIGURE 12. A schematic diagram of pore fluid distribution in shale: (A) before gas injection; (B) after gas injection; (C) helium injection; (D) methane injection.
The conductivity model is a comprehensive reflection of the conductive factors and conductive patterns. Before carrying out gas saturation evaluations, the shale conductivity model should be constructed. Based on the analysis of influencing factors on electrical properties, it is concluded that both high-resistivity and low-resistivity layers exist within the resistivity logging detection range (Figure 13A). In addition, pore water is continuously distributed, and pyrite, clay and organic matter are both continuously distributed in a dispersed manner (Figure 13B).
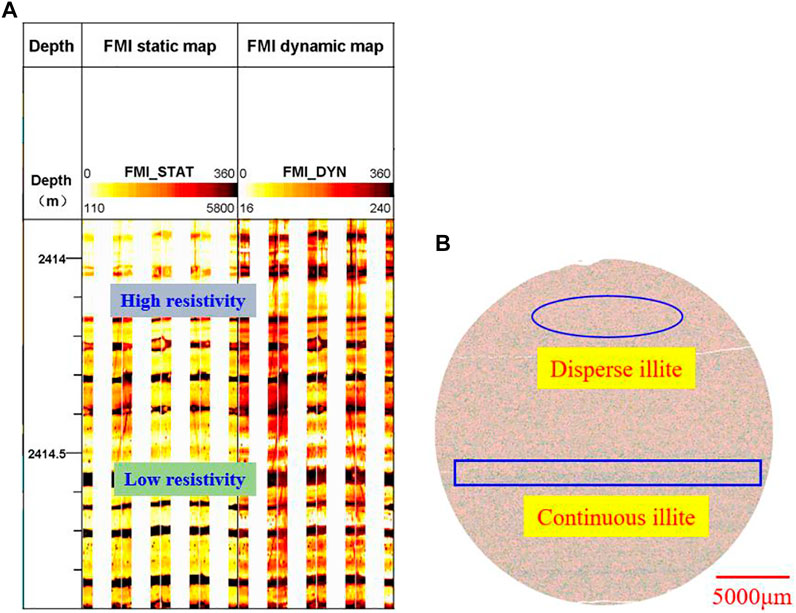
FIGURE 13. (A) High-resistivity and low-resistivity layers in the FMI image; (B) Mineral image.
The presence of thin, low-resistivity layers, overmature carbonized organic matter, clay minerals and pyrite crystals reduce the shale resistivity, which decreases the contribution of pore fluids to the resistivity but the correlation between TOC and resistivity is poor. The direct application of resistivity curves to calculate the gas saturation of shales may lead to large errors. Therefore, a suitable shale conductivity model needs to be developed to calculate the gas saturation. According to the formation types and conductive components, the shale conductivity model is constructed, as shown in Figure 14.
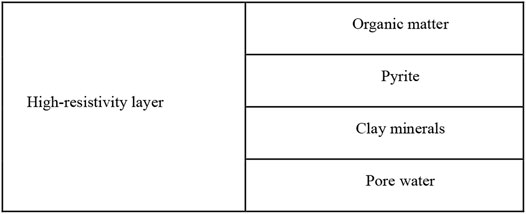
FIGURE 14. Shale conductivity model.
There are two types of shale layers, namely, a low-resistivity layer and a high-resistivity layer. Although organic matter, pyrite and clay may exist in a low-resistivity layer, the electric current is usually continuous. Therefore, we regard the low-resistivity layer as a large conductive component rather than a separation component. However, electric currents in a high-resistivity layer are not continuous, and we believe that organic matter, pyrite, clay and pore water have special influences on shale resistivity. The final shale resistivity is expressed as:
where RL is the resistivity of the low-resistivity layer, Ω·m; RH is the resistivity of the high-resistivity layer, Ω·m; fL represents the proportion of the low-resistivity layer in the resistivity logging detection range; Ri is the resistivity of the conductive component in the low-resistivity layer, Ω·m; Rcl is the clay resistivity, Ω·m; Rpy is the pyrite resistivity, Ω·m; Rk is the resistivity of organic matter, Ω·m; Vcl represents the clay volume content, decimal; Vpy represents the volume content of pyrite, decimal; Vk represents the volume content of organic matter, decimal; and α, β and γ are the mixing coefficients of clay, pyrite and organic matter, respectively. The mixing coefficient is generally less than one, which is related to the content and distribution of components. p1, p2, and p3 represent the influence coefficients of clay, pyrite and organic matter, respectively, which are generally between one and two.
Well logging resistivity is affected by many factors, but only clay conductivity and pore water conductivity are related to gas saturation. To accurately calculate the gas saturation of shale, it is necessary to remove the influence of organic matter, thin, low-resistivity layers and pyrite crystals on the resistivity. In this study, a new procedure with stepwise stripping of conductivity influencing factors is proposed for calculating gas saturation.
When the organic matter is overmaturely carbonized and conductive, the well logging resistivity of organic-rich shale shows an ultralow resistivity characteristic (Wang and Zhang, 2018), which is usually less than 2 Ω m. The hydrocarbon-generating ability of organic matter decays after carbonization, and the formation pressure coefficient is low under the condition of no gas source supply. Then, organic pores and intergranular pores are greatly reduced or even disappear. The pore radius and pore volume decrease, and the porosity is only 1/3–1/2 of the normal level (Wang et al., 2013). In addition, the desorption gas content is less than 1.0 m³/t. Therefore, we believe that shale reservoirs with carbonized organic matter have extremely limited gas production and storage capacities, and it is useless to evaluate gas saturation. If the organic matter is not carbonized, the organic matter has little influence on the logging resistivity, and it is unnecessary to strip the influence of organic matter on shale resistivity for calculating the gas saturation.
When a thin, low-resistance layer exists, the deep lateral resistivity shale is low. To improve the accuracy of logging interpretation, two methods are used to strip the influence of the thin, low-resistivity layer.
The first method is to use high-resolution resistivity logging data. Shale gas wells in the study area have produced FMI data, and the longitudinal resolution of the FMI logging tool reaches as high as 2.54 mm. The FMI image can clearly reflect the stratigraphic structures present around the well. A high-resolution resistivity curve, namely, the scaled synthetic resistivity curve (SRES), can be obtained by combining the shallow lateral resistivity with a high-resolution FMI image (Bastia and RadhaKrishna, 2012). The SRES curve not only has a high resolution (2.54 mm) but also reflects the true resistivity of the formation. Therefore, we can use SRES instead of RLLD data to calculate the water saturation, which reduces the influence of the low-resistivity layer on shale resistivity.
The second method is used to calculate the resistivity of the high-resistivity layer based on the horizontal resistivity model of the thin interlayer and then remove the influence of the thin, low-resistivity layer on the shale resistivity. We first counted the SRES resistivity distribution of the Wufeng-Longmaxi Formation and used a certain cutoff value Rcut as the resistivity limit of the high- and low-resistivity layers. Then, we used the longitudinal resolution of RLLD as the window length (0.9 m), and the number of data points countH for SRES curve values greater than Rcut and countL for data points less than Rcut within the window length were counted. The proportion of the low-resistivity layer in the window length (fL) and the resistivity of the high-resistivity layer can be expressed as:
When the pyrite content reaches a certain percentage, the log resistivity decreases sharply. The relationship between the pyrite content and the resistivity in Figure 5 shows that when the pyrite content is less than 6%, the effect of pyrite on shale resistivity is not obvious. Otherwise, the shale resistivity decreases significantly. It is worth mentioning that the pyrite content rarely exceeds 10%. Because of the irregular distribution of pyrite, its effect on the shale resistivity is not simply acting in series or parallel. Pyrite has a mixed effect on shale resistivity and should be stripped. Based on the shale conductivity model, the resistivity without the influence of pyrite (RF) is expressed by the following:
where δ is the pyrite mixing effect coefficient and p and q are parameters of the linear equation. Through digital rock simulations, we found that when the pyrite content is less than 5%, δ is near 0. When the pyrite content is greater than 5%, δ has a linear relationship with the pyrite content.
Clay minerals have various distribution forms in shale, such as striated and dispersed, and it is difficult to describe the influence of clay minerals on shale resistivity in a simple way. In muddy sandstone, Simandoux (1963) proposed a fluid saturation model without considering the specific clay distribution form; however, it worked well. In this paper, we used Simandoux’s equation by considering that the influences of pore water and clay on shale resistivity were both controlled by the water saturation, which can be expressed as:
where Sg represents for gas saturation, decimal.
The flow chart of the new procedure with stepwise stripping of conductivity influencing factors is shown in Figure 15. The first step is to determine whether the organic matter is overmaturely carbonized. If it is carbonized, then the shale is considered to have a poor gas potential, and it is unnecessary to carry out gas saturation calculations. Otherwise, there is no need to strip the effect of organic matter because of its small effect on shale resistivity. The next step is to combine high-resolution resistivity logging data and a horizontal resistivity model to strip the influence of thin, low-resistivity layers. Then, the pyrite content was calculated, and the effect of pyrite was stripped. Finally, the effects of water and clay on shale resistivity are considered to calculate the shale gas saturation. It should be noted that the gas saturation calculated based on the above processes is free gas saturation. To evaluate the total gas saturation of shale, adsorbed gas saturation needs to be calculated (Zeng et al., 2014).
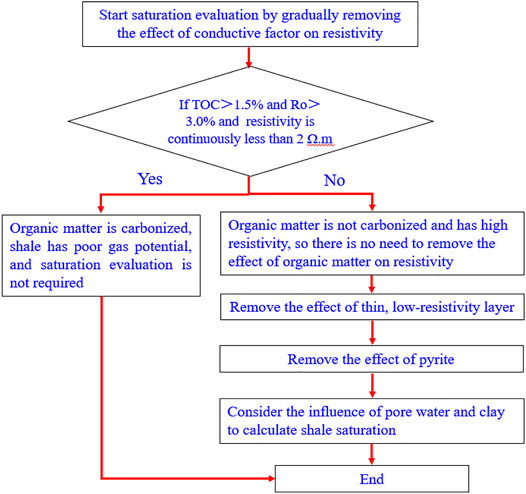
FIGURE 15. Flow chart of the new procedure with stepwise stripping of conductivity influencing factors.
This paper utilized the new procedure with stepwise stripping of conductivity influencing factors to calculate the shale gas saturation of marine shale gas wells. The gas saturation results calculated by the neutron-density porosity overlay method, Archie’s equation and Simandoux’s equation were also compared. Figures 16, 17 show the calculated water saturations in the Wufeng-Longmaxi Formation for wells J9 and D4, respectively. In these well logging interpretation figures, the first channel shows the depth; the second channel shows the stratum; the third channel shows the FMI static image; the fourth channel shows the original and corrected resistivities; the fifth channel shows the TOC content; the sixth channel shows the pyrite content; the seventh channel shows the clay content; the eighth channel shows the porosity; the ninth channel shows the water saturation calculated by the neutron-density porosity overlay method (SW1); the 10th channel shows the water saturation calculated by Archie’s equation (SW2); the 11th channel shows the water saturation calculated by Simandoux’s equation (SW3); the 12th channel shows the water saturation calculated by our new method (SW4); the 13th channel shows the calculated gas content, including the free gas content, the total gas content and the desorption gas contents of the shale samples. The TOC content, clay content and porosity calculated by conventional logging curves agree well with the core analysis results, which provides reliable parameters for calculating marine shale gas saturation.
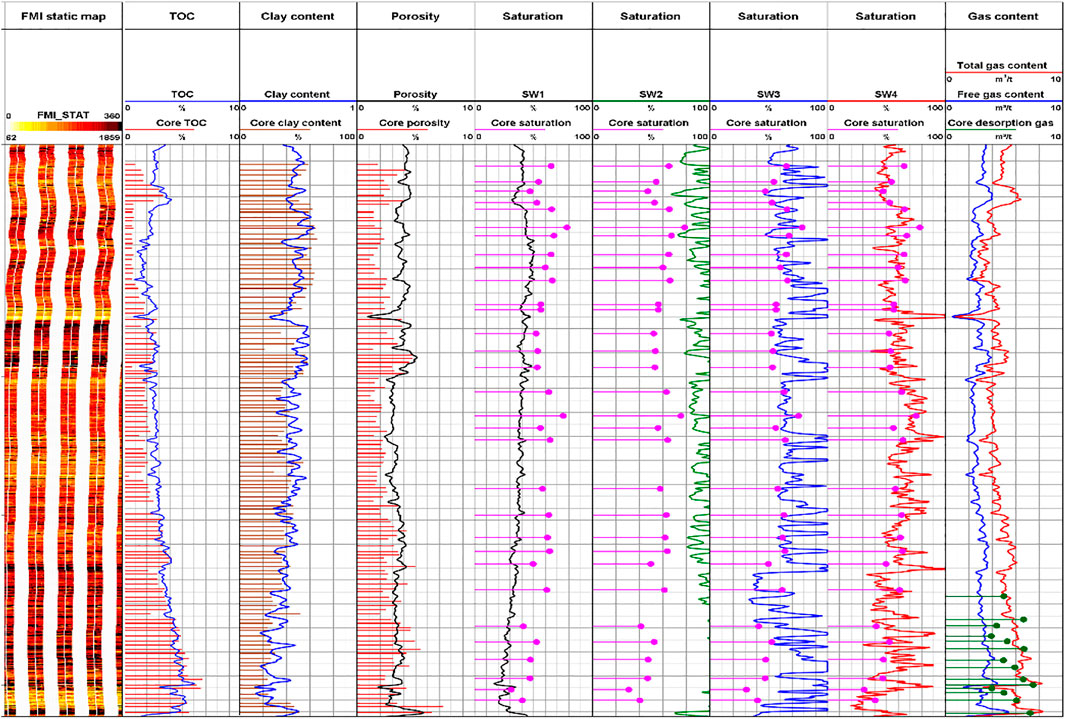
FIGURE 16. Well logging interpretations of marine shale gas well J9, Sw4 is new model, Sw1-Sw3 are old models.
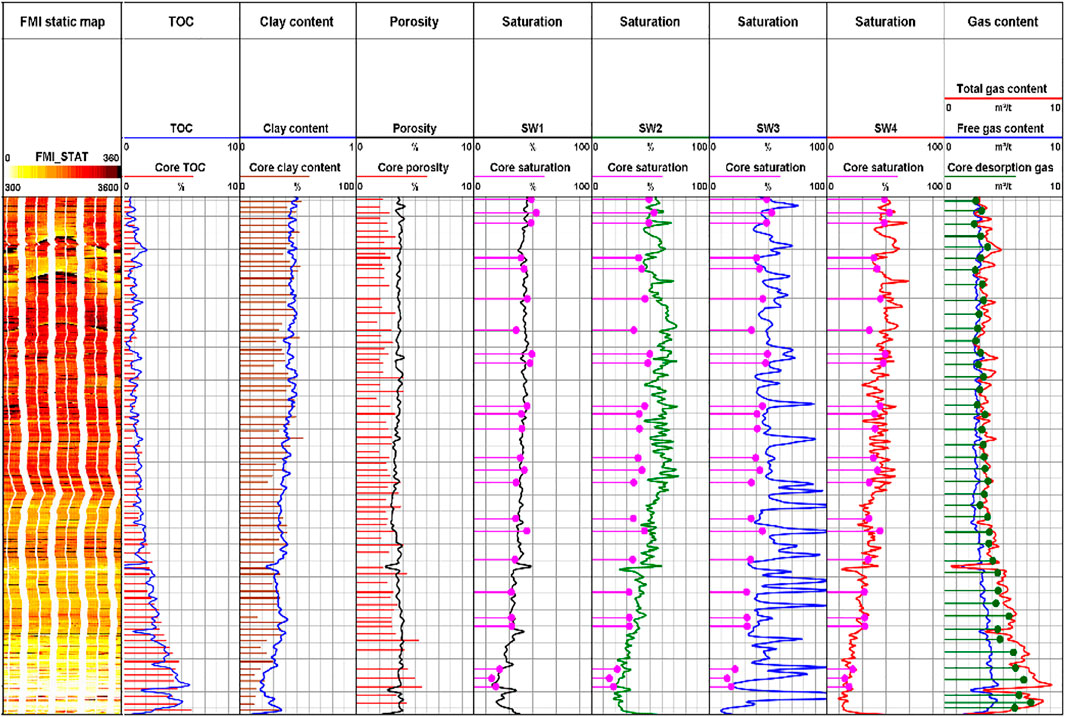
FIGURE 17. Well logging interpretations of marine shale gas well D4, Sw4 is new model, Sw1-Sw3 are old models.
Most of the TOC contents in well J9 are greater than 1.5%, and the vitrinite reflectance of each shale sample is smaller than 3.0%. In addition, the logging resistivity is approximately 20 Ω m. Therefore, organic matter is not carbonized, which does not necessarily strip the effect of organic matter on resistivity. From the FMI static image, we can see that the Wufeng-Longmaxi Formation develops many thin, low-resistivity layers, and their influences on resistivity should be removed. ECS logging data show that the vast majority of the pyrite content is less than 5.0%, and there is no spike-like low-resistivity characteristic where the pyrite content is high, which indicates that pyrite has little effect on resistivity for well J9. Therefore, the main conductivity influencing factors are the thin, low-resistivity layer, clay and pore water. After stripping the influence of the thin, low-resistivity layer, the resistivity increases.
By comparing the results of rock analysis, it can be seen that the accuracies of the four water saturation calculation methods are different. The water saturation results calculated by both the neutron-density porosity overlay method and Archie’s equation are higher than the actual water saturations, which means that these two methods are not applicable in this well. The water saturations calculated by Simandoux’s equation agree well with the core analysis results in some layers. However, the water saturations are inconsistent with the actual saturations in this, low-resistivity layers. Among the calculated water saturation results, our new method provides the most accurate results. In addition, the total gas content calculated from the well logging data is in good agreement with the core desorption gas content, which also illustrates the accuracy of our method.
The vitrinite reflectance of shale in well D4 is between 2.1 and 2.8%, and the logging resistivity is approximately 40 Ω m, which indicates that there is no need to strip the effect of organic matter on resistivity. Thin, low-resistivity layers are determined by analyzing the FMI static image. Comparing the original logging resistivity with the ECS pyrite content, we can see that pyrite has an effect on shale resistivity, which should be stripped when calculating the gas saturation. Therefore, the main conductive influencing factors of this well are the presence of thin, low-resistivity layers, pyrite crystals, clay particles and pore water volumes. The corrected resistivity is higher than the original resistivity. The water saturations calculated by Archie’s equation and Simandoux’s equation are greater than core saturations. Our new method and the neutron-density porosity overlay method have good application results in this well. The calculated total gas content agrees well with the core desorption gas content, which also proves the accuracy of our method. At the same time, in the process of calculation, different influencing factors are quantitatively calculated, and different influencing factors are reasonably selected according to the model, so that the model has higher accuracy.
This research utilized geological data, well logging data, and rock experiment data to analyze the influencing factors of electrical properties in the Wufeng-Longmaxi Formation in the Sichuan Basin, China. The effects of stratigraphic structure, clay, pyrite, organic matter, pore structure, and formation fluid on shale resistivity were investigated. In addition, we proposed a new procedure which utilizes the stepwise stripping of conductivity influencing factors to calculate the shale gas saturation (At present, the application scope is only applicable to the shale in the study area, and the shale in other areas has not been verified. At the same time, in order to use this model, there must be electrical imaging logging data). Based on the results, the following conclusions can be drawn:
1) The resistivity of marine shale is affected by multiple factors. Thin, low-resistivity layers, high clay contents, pyrite crystals, overmature carbonized organic matter, larger proportions of large pores and highly saline water volumes can reduce shale resistivity. Moreover, we summarized some upper and lower limit values. When the pyrite content is less than 6.0%, there is no obvious correlation between the shale resistivity and the pyrite content, and the shale resistivity decreases significantly after the pyrite content is greater than 6.0%. When Ro is greater than 3.5% and the shale resistivity is extremely low (less than 2 Ω m), the organic matter is over carbonized.
2) We made a cross-plot of gas content and logging resistivity, which could be divided into a low-resistivity (0.1–7 Ω m) and low-production part, a medium-resistivity (7–200 Ω m) and high-production part, and a high-resistivity (> 200 Ω m) and low-production part. By using a self-developed combined isothermal adsorption and resistivity measurement device, we found that the shale resistivity decreased with increasing pore gas pressures under a constant water saturation content. In addition, shale resistivity with methane was greater than shale resistivity with helium under the same pore gas pressure.
3) We developed a new shale conductivity application model for both low-resistivity layers and high-resistivity layers. Based on this model, a new procedure utilizing the stepwise stripping of conductivity influencing factors was proposed for calculating gas saturation. It is necessary to remove the influences of organic matter, thin, low-resistivity layers and pyrite on well logging resistivities to acquire the corrected resistivity, which only reflects clay and pore water.
4) By analyzing the well logging interpretations of two wells, the accuracies of different water saturation methods were compared. Archie’s equation is not applicable to marine shale reservoirs because it does not take some conductive influencing factors into the equation. Simandoux’s equation is suitable for shale only when there is no thin, low-resistivity layer. The application capability of the neutron-density porosity overlay method is unclear because it provides good calculation results for well D4, but the results of well J9 are poor. We will investigate the neutron-density porosity overlay method deeper in future studies. Among these methods, our new method shows the best water saturation calculation capability, and the calculated gas contents agree well with the core desorption gas contents.
The original contributions presented in the study are included in the article/Supplementary Material, further inquiries can be directed to the corresponding authors.`
FjS: Conceptualization, Data curation, Formal analysis, Methodology, Investigation, and Writing-original draft. XZ: Data curation, Formal analysis, Methodology, Investigation, Writing-original draft. JS: Supervision, Validation, Resources, Writing-review and editing. WgY: Methodology, and Investigation. JZ: Methodology, and Investigation. WY: Methodology, and Investigation. WcY: Methodology, and Investigation.
This work was supported in part by the National Science and Technology Major Project (No. 2017ZX05036-005-003), Natural Science Foundation of Shandong Province (No. ZR2020QD054), and Fundamental Research Funds for the Central Universities (No. 20 CX06026A).
Authors WgY and WY were employed by the Sinopec Exploration Company. Author JZ was employed by the Well Logging Company of Sinopec Shengli Oilfield Service Corporation.
The remaining authors declare that the research was conducted in the absence of any commercial or financial relationships that could be construed as a potential conflict of interest.
All claims expressed in this article are solely those of the authors and do not necessarily represent those of their affiliated organizations, or those of the publisher, the editors and the reviewers. Any product that may be evaluated in this article, or claim that may be made by its manufacturer, is not guaranteed or endorsed by the publisher.
Archie, G. E. (1942). The Electrical Resistivity Log as an Aid in Determining Some Reservoir Characteristics. Am. Inst. Mech. Eng. 146, 54–62. doi:10.2118/942054-g
Bakhshi, E., Golsanami, N., and Chen, L. (2020). Numerical Modeling and Lattice Method for Characterizing Hydraulic Fracture Propagation: A Review of the Numerical, Experimental, and Field Studies. Arch. Comput. Method. E 28 (5), 3329–3360. doi:10.1007/s11831-020-09501-6
Bastia, R., and Radhakrishna, M. (2012). Exploration in the Indian Offshore Basins-Some Challenging Issues Related to Imaging and Drilling. Dev. Pet. Sci. 59, 319–359. doi:10.1016/b978-0-444-53604-4.00007-7
Brandt, A. R., Millard-Ball, A., Ganser, M., and Gorelick, S. M. (2013). Peak Oil Demand: The Role of Fuel Efficiency and Alternative Fuels in a Global Oil Production Decline. Environ. Sci. Technol. 47 (14), 8031–8041. doi:10.1021/es401419t
Chen, L., Wang, G., Yang, Y., Jing, C., Chen, M., and Tan, X. (2019). Geochemical Characteristics of Bentonite and its Influence on Shale Reservoir Quality in Wufeng-Longmaxi Formation, South Sichuan Basin, China. Energy Fuels 33 (12), 12366–12373. doi:10.1021/acs.energyfuels.9b03510
Chen, Y., Xu, J., and Wang, P. (2020). Shale Gas Potential in China: A Production Forecast of the Wufeng-Longmaxi Formation and Implications for Future Development. Energy Policy 147, 111868. doi:10.1016/j.enpol.2020.111868
Clavier, C., Heim, A., and Scala, C. (1976). “Effect of Pyrite on Resistivity and Other Logging Measurements,” in SPWLA 17th Annual Logging Symposium.
Dong, H., Sun, J., Arif, M., Golsanami, N., Yan, W., and Zhang, Y. (2020). A Novel Hybrid Method for Gas Hydrate Filling Modes Identification via Digital Rock. Mar. Pet. Geology. 115, 104255. doi:10.1016/j.marpetgeo.2020.104255
Du, P., Cai, J., Liu, Q., Zhang, X., and Wang, J. (2021). A Comparative Study of Source Rocks and Soluble Organic Matter of Four Sags in the Jiyang Depression, Bohai Bay Basin, NE China. J. Asian Earth Sci. 216, 104822. doi:10.1016/j.jseaes.2021.104822
Gao, F., Song, Y., Li, Z., Xiong, F., Chen, L., Zhang, X., et al. (2018). Quantitative Characterization of Pore Connectivity Using NMR and MIP: A Case Study of the Wangyinpu and Guanyintang Shales in the Xiuwu basin, Southern China. Int. J. Coal Geology. 197, 53–65. doi:10.1016/j.coal.2018.07.007
Golsanami, N., Bakhshi, E., Yan, W., Dong, H., and Mahbaz, B. (2020). Relationships between the Geomechanical Parameters and Archie's Coefficients of Fractured Carbonate Reservoirs: a New Insight. Energ. Source. Part. A. (2). doi:10.1080/15567036.2020.1849463
Golsanami, N., Sun, J., Liu, Y., Yan, W., Lianjun, C., Jiang, L., et al. (2019). Distinguishing Fractures from Matrix Pores Based on the Practical Application of Rock Physics Inversion and NMR Data: A Case Study from an Unconventional Coal Reservoir in China. J. Nat. Gas Sci. Eng. 65, 145–167. doi:10.1016/j.jngse.2019.03.006
Golsanami, N., Zhang, X., Yan, W., Yu, L., Dong, H., Dong, X., et al. (2021). NMR-based Study of the Pore Types' Contribution to the Elastic Response of the Reservoir Rock. Energies 14 (5), 1513. doi:10.3390/en14051513
Hamada, G. M., Al-Blehed, M. S., Al-Awad, M. N., and Al-Saddique, M. A. (2001). Petrophysical Evaluation of Low-Resistivity sandstone Reservoirs with Nuclear Magnetic Resonance Log. J. Pet. Sci. Eng. 29 (2), 129–138. doi:10.1016/s0920-4105(01)00095-x
Han, T., Best, A. I., Sothcott, J., North, L. J., and MacGregor, L. M. (2015). Relationships Among Low Frequency (2Hz) Electrical Resistivity, Porosity, clay Content and Permeability in Reservoir Sandstones. J. Appl. Geophys. 112, 279–289. doi:10.1016/j.jappgeo.2014.12.006
Hinds, G. S., and Berg, R. R. (1990). Estimating Organic Maturity from Well Logs, Upper Cretaceous Austin Chalk, Texas Gulf Coast. Trans. Gulf. Coast. Assoc. Geol. Soc. 40, 295–300. doi:10.1306/20b230c5-170d-11d7-8645000102c1865d
Kadkhodaie, A., and Rezaee, R. (2016). A New Correlation for Water Saturation Calculation in Gas Shale Reservoirs Based on Compensation of Kerogen-clay Conductivity. J. Pet. Sci. Eng. 146, 932–939. doi:10.1016/j.petrol.2016.08.004
Kennedy, M. C. (2004). “Gold Fool's: Detecting, Quantifying and Accounting for the Effects of Pyrite on Modern Logs,” in SPWLA 45th Annual Logging Symposium.
Klein, J. D., and Martin, P. R. (1997). The Petrophysics of Electrically Anisotropic Reservoirs. The Log Analyst 38 (3), 25–36.
Li, M., Vashaee, S., Romero-Zerón, L., Marica, F., and Balcom, B. J. (2017). A Magnetic Resonance Study of Low Salinity Waterflooding for Enhanced Oil Recovery. Energy Fuels 31 (10), 10802–10811. doi:10.1021/acs.energyfuels.7b02166
Li, Z., Jun Yao, J., and Kou, J. (2019). Mixture Composition Effect on Hydrocarbon-Water Transport in Shale Organic Nanochannels. J. Phys. Chem. Lett. 10 (15), 4291–4296. doi:10.1021/acs.jpclett.9b01576
Liu, K., Sun, J., Zhang, H., Liu, H., and Chen, X. (2018). A New Method for Calculation of Water Saturation in Shale Gas Reservoirs Using VP-To-VS Ratio and Porosity. J. Geophys. Eng. 15, 153–163. doi:10.1088/1742-2140/aa83e5
Mao, J., Fang, X., Lan, Y., Schimmelmann, A., Mastalerz, M., Xu, L., et al. (2010). Chemical and Nanometer-Scale Structure of Kerogen and its Change during thermal Maturation Investigated by Advanced Solid-State 13C NMR Spectroscopy. Geochimica et Cosmochimica Acta 74, 2110–2127. doi:10.1016/j.gca.2009.12.029
Memon, A., Li, A., Memon, B. S., Muther, T., Han, W., Kashif, M., et al. (2021). Gas Adsorption and Controlling Factors of Shale: Review, Application, Comparison and Challenges. Nat. Resour. Res. 30, 827–848. doi:10.1007/s11053-020-09738-9
Nie, X., Zou, C., Li, Z., Meng, X., and Qi, X. (2016). Numerical Simulation of the Electrical Properties of Shale Gas Reservoir Rock Based on Digital Core. J. Geophys. Eng. 13, 481–490.
Pan, H., Wang, J., Fan, Z., Ma, Y., Liu, J., and Li, M. (2001). Low Resistivity Oil(gas)-Bearing Reservoir Conductive Model. Sci. China Ser. D-earth Sci. 44, 346–355. doi:10.1007/bf02907105
Savage, K. S., Stefan, D., and Lehner, S. W. (2008). Impurities and Heterogeneity in Pyrite: Influences on Electrical Properties and Oxidation Products. Appl. Geochem. 23 (2), 103–120. doi:10.1016/j.apgeochem.2007.10.010
Senger, K., Birchall, T., Betlem, P., Ogta, K., Ohm, S., Olaussen, S., et al. (2020). Resistivity of Reservoir Sandstones and Organic Rich Shales on the Barents Shelf: Implications for Interpreting CSEM Data. Geosci. Front., 101063.
Silva, M. L. d., Martins, J. L., Ramos, M. M., and Bijani, R. (2018). Estimation of clay Minerals from an Empirical Model for Cation Exchange Capacity: an Example in Namorado Oilfield, Campos basin, Brazil. Appl. Clay Sci. 158, 195–203. doi:10.1016/j.clay.2018.02.040
Simandoux, P. (1963). Dielectric Measurements of Porous media: Application to the Measurement of Water Saturations, Study of the Behavior of Argillaceous Formations. Rev. Fr. Petrol. 18 (S1), 193–215.
Soeder, D. J. (2018). The Successful Development of Gas and Oil Resources from Shales in North America. J. Pet. Sci. Eng. 163, 399–420. doi:10.1016/j.petrol.2017.12.084
Sun, J., Xiong, Z., Luo, H., Zhang, H., and Zhu, J. (2018). Mechanism Analysis and Logging Evaluation of Low Resistivity in Lower Paleozoic Shale Gas Reservoirs of Yangtze Region. J. China Univ. Pet. (Edition Nat. Science) 42 (5), 47–56.
Wang, D., Wang, Y., Dong, D., Wang, S., Huang, J., Huang, Y., et al. (2013). Quantitative Characterization of Reservoir Space in the Lower Cambrian Qiongzhusu Shale, Southern Sichuan Basin. Natur. Gas. Ind. 33 (7), 1–10.
Wang, J., and Zhang, S. (2018). Pore Structure Differences of the Extra-low Permeability sandstone Reservoirs and the Causes of Low Resistivity Oil Layers: a Case Study of Block Yanwumao in the Middle of Ordos Basin, NW China. Pet. Exploration Dev. 45, 273–280. doi:10.1016/s1876-3804(18)30030-2
Wang, T., Tian, S., Zhang, W., Ren, W., Li, G., and Li, G. (2021). Production Model of a Fractured Horizontal Well in Shale Gas Reservoirs. Energy Fuels 35 (1), 493–500. doi:10.1021/acs.energyfuels.0c03787
Wang, Y., Li, X., Chen, B., Wu, W., Dong, D., Zhang, J., et al. (2018). Lower Limit of thermal Maturity for the Carbonization of Organic Matter in marine Shale and its Exploration Risk. Pet. Exploration Dev. 45, 402–411. doi:10.1016/s1876-3804(18)30045-4
Wang, Y., Li, X., Wang, H., Jiang, S., Chen, B., Ma, J., et al. (2019). Developmental Characteristics and Geological Significance of the Bentonite in the Upper Ordovician Wufeng - Lower Silurian Longmaxi Formation in Eastern Sichuan Basin, SW China. Pet. Exploration Dev. 46 (4), 687–700. doi:10.1016/s1876-3804(19)60226-0
Wu, Y., Lin, C., Yan, W., Liu, Q., Zhao, P., and Ren, L. (2020b). Pore-scale Simulations of Electrical and Elastic Properties of Shale Samples Based on Multicomponent and Multiscale Digital Rocks. Mar. Pet. Geology. 117, 104369. doi:10.1016/j.marpetgeo.2020.104369
Wu, Y., Tahmasebi, P., Lin, C., and Dong, C. (2020c). A Comprehensive Investigation of the Effects of Organic-Matter Pores on Shale Properties: a Multicomponent and Multiscale Modeling. J. Nat. Gas Sci. Eng. 81, 103425. doi:10.1016/j.jngse.2020.103425
Wu, Y., Tahmasebi, P., Yu, H., Lin, C., Wu, H., and Dong, C. (2020a). Pore-scale 3D Dynamic Modeling and Characterization of Shale Samples: Considering the Effects of thermal Maturation. J. Geophys. Res-sol. Ea. 125 (1). doi:10.1029/2019jb018309
Xie, H., Li, H., Yuan, W., Feng, M., Yan, W., and Sun, J. (2019). Calculation Method of Gas Saturation in Low-Resistivity Shale Reservoirs of Longmaxi Formation. Well Logging Tech. 43 (02), 161–166.
Xie, X., Luo, B., Yin, L., Liang, H., and Li, Y. (2017). Influence Factors of Low Resistivity Shale Gas Reservoir. Acta Geologica Sichuan 37 (03), 433–437.
Yan, W., Sun, J., Cheng, Z., Li, J., Sun, Y., Shao, W., et al. (2017). Petrophysical Characterization of Tight Oil Formations Using 1D and 2D NMR. Fuel 206, 89–98. doi:10.1016/j.fuel.2017.05.098
Yan, W., Sun, J., Golsanami, N., Li, M., Cui, L., Dong, H., et al. (2019). Evaluation of Wettabilities and Pores in Tight Oil Reservoirs by a New Experimental Design. Fuel 252, 272–280. doi:10.1016/j.fuel.2019.04.130
Yan, W., Sun, J., Zhang, J., Yuan, W., Zhang, L., Cui, L., et al. (2018). Studies of Electrical Properties of Low-Resistivity Sandstones Based on Digital Rock Technology. J. Geophys. Eng. 15, 153–163. doi:10.1088/1742-2140/aa8715
Yasin, Q., Du, Q., Ismail, A., and Shaikh, A. (2019). A New Integrated Workflow for Improving Permeability Estimation in a Highly Heterogeneous Reservoir of Sawan Gas Field from Well Logs Data. Geomech. Geophys. Geo-energ. Geo-resour. 5, 121–142. doi:10.1007/s40948-018-0101-y
Zeng, X., Sun, J., and Cui, H. (2014). Shale Adsorbed Gas Volume Calculation Model under Varied Temperature. Well Log. Tech. 38 (3), 286–291.
Zeng, X., Sun, J., Yan, W., Cui, R., Yuan, W., Yan, W., et al. (2020). New Insight into the Petrophysical Characterization of Shales with Different Fluid Saturation States Based on Nuclear Magnetic Resonance Experiments. Energy Fuels 34 (5), 5599–5610. doi:10.1021/acs.energyfuels.0c00093
Zhang, J., Li, R., Wang, L., Chen, F., and Geng, B. (2017a). A New Method for Calculating Gas Saturation of Low-Resistivity Shale Gas Reservoirs. Nat. Gas Industry 37 (04), 34–41. doi:10.1016/j.ngib.2017.09.004
Zhang, J., Li, S., Wang, L., Chen, F., and Geng, B. (2017b). A New Method for Calculating Gas Saturation of Low-Resistivity Shale Gas Reservoirs. Nat. Gas Industry B 4 (5), 346–353. doi:10.1016/j.ngib.2017.09.004
Zhang, L., Xiao, D., Lu, S., Jiang, S., and Lu, S. (2019). Effect of Sedimentary Environment on the Formation of Organic-Rich marine Shale: Insights from Major/trace Elements and Shale Composition. Int. J. Coal Geology. 204, 34–50. doi:10.1016/j.coal.2019.01.014
Zhao, J., Cui, L., Chen, H., Li, N., Wang, Z., Ma, Y., et al. (2020). Quantitative Characterization of Rock Microstructure of Digital Core Based on CT Scanning. Geoscience 34 (06), 1205–1213.
Zhong, Z., Rezaee, R., Esteban, L., Josh, M., and Feng, R. (2021). Determination of Archie's Cementation Exponent for Shale Reservoirs; an Experimental Approach. J. Pet. Sci. Eng. 201, 108527. doi:10.1016/j.petrol.2021.108527
Zhu, L., Ma, Y., Zhang, C., Wu, S., and Zhou, X. (2021). New Parameters for Charactering the Gas-Bearing Properties of Shale Gas. J. Petrol. Sci. Eng. 201:108290. doi:10.1016/j.petrol.2020.108290
Zhu, L., Zhang, C., Zhang, Z., Zhou, X., and Liu, W. (2019). An Improved Method for Evaluating the TOC Content of a Shale Formation Using the Dual-Difference ΔlogR Method. Mar. Pet. Geology. 102, 800–816. doi:10.1016/j.marpetgeo.2019.01.031
Keywords: marine shale, resistivity, conductivity model, gas saturation, Sichuan Basin
Citation: Sun F, Sun J, Zeng X, Yuan W, Zhang J, Yan W and Yan W (2022) Analysis of the Influencing Factors on Electrical Properties and Evaluation of Gas Saturation in Marine Shales: A Case Study of the Wufeng-Longmaxi Formation in Sichuan Basin. Front. Earth Sci. 10:824352. doi: 10.3389/feart.2022.824352
Received: 29 November 2021; Accepted: 07 March 2022;
Published: 23 March 2022.
Edited by:
Yuwei Li, Liaoning University, ChinaReviewed by:
Qiang Guo, China Jiliang University, ChinaCopyright © 2022 Sun, Sun, Zeng, Yuan, Zhang, Yan and Yan. This is an open-access article distributed under the terms of the Creative Commons Attribution License (CC BY). The use, distribution or reproduction in other forums is permitted, provided the original author(s) and the copyright owner(s) are credited and that the original publication in this journal is cited, in accordance with accepted academic practice. No use, distribution or reproduction is permitted which does not comply with these terms.
*Correspondence: Xin Zeng, emVuZ3hpbnVwY0B0b20uY29t; Jianmeng Sun, c3Vuam1AdXBjLmVkdS5jbg==
Disclaimer: All claims expressed in this article are solely those of the authors and do not necessarily represent those of their affiliated organizations, or those of the publisher, the editors and the reviewers. Any product that may be evaluated in this article or claim that may be made by its manufacturer is not guaranteed or endorsed by the publisher.
Research integrity at Frontiers
Learn more about the work of our research integrity team to safeguard the quality of each article we publish.