
95% of researchers rate our articles as excellent or good
Learn more about the work of our research integrity team to safeguard the quality of each article we publish.
Find out more
ORIGINAL RESEARCH article
Front. Earth Sci. , 18 February 2022
Sec. Interdisciplinary Climate Studies
Volume 10 - 2022 | https://doi.org/10.3389/feart.2022.823286
This article is part of the Research Topic Weather and Climate Extremes in the Urban Environment: Modeling and Observations View all 10 articles
Extreme hot events have increased evidently under global warming, particularly in the urban areas. This study aims to explore the detailed features of future changes in summer heat waves (HWs) over three major urban agglomerations (Beijing Tianjin Hebei, BTH; Yangtze River Delta, YRD; Pearl River Delta, PRD) in eastern China under 1.5 and 2.0°C warming scenario by using the Weather Research and Forecasting model (WRF) with the updated land cover data for China (ChinaLC), which is also coupled with urban canopy model. Based on the future projection results from Community Earth System Model (CESM) under the Representative Concentration Pathway (RCP) 4.5, dynamic downscaling with high-resolution WRF has been performed to project the future changes in frequency, duration and intensity of summer HWs in urban agglomerations under 1.5 and 2.0°C warming scenarios respectively. Compared with the historical period, it is found that both the summer HWs indices and the HWs affected areas all increase significantly under 1.5 and 2.0°C warming scenarios. The increasing rates of the three HWs indices are above 50% under 1.5°C warming situation, and 70% for 2.0°C warming scenario, with the increasing rate of HWs intensity even exceeding 200%. It is noted that an additional 0.5°C warming from 1.5 to 2.0°C can produce much larger impact on the future HWs changes in YRD, with the HWs intensity increased by 75.5% from 1.5 to 2.0°C warming scenarios. It is further found that the changes of HWs indices in urban area is much higher than that of non-urban areas under 1.5 and 2.0°C warming, indicating that the urban areas will face higher risk of heat-related illness or environments than suburban or rural areas in the future. Our results can provide further scientific support for the mitigation and adaption strategy for the future HWs risk in mega-cities.
Heat waves are extreme events associated with particularly sustained high temperatures (Frich et al., 2002; Perkins 2015; Hua et al., 2021; Yu et al., 2021; Yang et al., 2021a), which can produce adverse impacts on human mortality, regional economies, and natural ecosystems (Kovats and Hajat 2008; McMichael and Lindgren 2011; Lesk et al., 2016). For instance, the long-lasting and widespread HWs in 2013 over eastern China brought 59 billion RMB direct economic losses (Sun et al., 2014). Observational data over the past few decades indicate that the frequency of HWs has increased all over the world (Seneviratne et al., 2014; Perkins 2015; Yang et al., 2021b). Under global warming, HWs are projected to become more intense, frequent and longer lasting over most land areas in the late 21st century (Meehl and Tebaldi 2004; Coumou and Robinson 2013; Su and Dong 2019a).
In urban areas, surface air temperatures are generally higher than those in rural areas due to the urban heat island (UHI) effect (Oke 1982). This indicates that the urban areas are more exposed to the risk from HWs (Stone et al., 2010; Ren and Zhou 2014). More than 55% of the world’s total population is currently living in urban areas, which is expected to increase in the future with the expansion of urbanization and the growth of population (http://world-statistics.org). These urban residents are directly affected by the combined influence of global warming caused by greenhouse gases and the UHI effect caused by urbanization, which makes them more vulnerable to the effect of heat extremes (IPCC, 2014; Sun et al., 2014; Yu et al., 2018).
Since the 1980s, urbanization has rapidly accelerated in China, especially in eastern China, where the economy develops apace with high population density (Wang et al., 2012; Gong et al., 2019). An evident increased trend in summer HWs over eastern China is found during the last decade (Chen and Li 2017; Su and Dong 2019b). Recent studies suggest that the increasing frequency of extreme summer heat wave in eastern China is attributable to the anthropogenic emission of greenhouse gases and the expansion of UHI due to rapid urbanization (e.g., Dian-Xiu et al., 2014; Sun et al., 2016). It is also found that most of the densely populated regions, such as eastern China, will expect to witness larger increases of extreme heat events than the other regions of East Asia under 1.5 and 2.0°C warming scenarios (Li et al., 2018). Yu et al. (2018) further suggested that the additional 0.5°C temperature rise from 1.5 to 2.0°C warming will lead to significantly increased extreme HWs in China’s urban agglomerations.
It is noted that most of the previous studies used datasets from Coupled Model Intercomparison Project Phase 5 (CMIP5) models under different RCP scenarios to investigate the changes of weather and climate extremes in response to global warming. However, due to the coarse resolution and imperfect parameterization scheme of urban land surface physical processes, most of the existing climate system models can not reasonably depict the differences between cities and their surrounding areas, which might lead to larger uncertainties in the simulation and projection of extreme weather and climate events in urban areas (Pachauri et al., 2014). To reduce regional-scale biases, dynamical downscaling with regional model driven by global climate system models’ output is widely adopted because of the higher spatial resolution and better representation of physical processes for regional climate models (Grossman-Clarke et al., 2017; Chen et al., 2018; Wu et al., 2020; Ge et al., 2021).
Therefore, this study aims to reasonably project the future changes of HWs in typical urban agglomerations in eastern China by dynamical downscaling using the high-resolution WRF model. To improve the representation of physical processes in urban areas, the WRF model coupled with urban canopy model (UCM) was employed. The global future climate projections were derived from the National Center for Atmospheric Research (NCAR) Community Earth System Model under the RCP4.5 scenario. Three major urban agglomerations in eastern China (Beijing-Tianjin-Hebei, BTH; Yangtze River Delta, YRD; Pearl River Delta, PRD) were selected as the research regions in this study. The structure of this paper is organized as follows, the details of the data and methodology are described in Section Data and Methods. the performance of the downscaled simulation of HWs over three urban agglomerations is systematically evaluated and the future changes in temperature and HWs are presented in Section Results. The discussion and conclusion are in Section Conclusion and Discussion.
In this study, the three urban agglomerations located in coastal Eastern China, i.e., Beijing-Tianjin-Hebei region (BTH), the Yangtze River Delta (YRD), and the Pearl River Delta (PRD), are selected as research areas. These three regions are the most mature and competitive urban agglomerations in China, with the largest population density and the highest level of national economic development, which is the inevitable outcome of China’s new industrialization processes (Fang 2015). More specifically, the three urban agglomerations have an area of 370 × 103 km2, with a population of 102.19 million and a GDP of CNY 30.82 trillion (Chou et al., 2021), and these suggest that the degree of exposure and vulnerability to climate disasters and potential economic losses in three urban agglomerations are much larger than that in other regions.
The regional model used for dynamic downscaling in this study is the WRF model version 3.9.1 (Skamarock and Klemp 2008), which is coupled with the Urban Canopy Model (UCM) (WRF/UCM; Kusaka et al., 2001; Kusaka and Kimura 2004). Two one-way nesting strategy has been configured for WRF, with 15 km spatial resolution for outer domain and 5 km resolution for inner domain. As shown in Figure 1, three urban agglomerations are all located in the innermost domain, with 78 × 90 grid cells for BTH region, 90 × 110 for YRD and 45 × 57 grid points for PRD respectively. The Lambert conformal map projection was adopted for the model’s horizontal coordinates. The vertical grid contained 37 terrain-following eta levels from the surface up to 50 hPa. The main physical schemes adopted in this study include the WRF Single-Moment 6-class microphysics scheme (Hong and Lim, 2006), the Kain-Fritsch cumulus scheme (Kain, 2004), the Rapid Radiative Transfer Model for GCM (RRTMG) longwave and shortwave radiation scheme (Iacono et al., 2008), the Yonsei University boundary layer scheme (Hong et al., 2006), and the Noah land surface model (Chen and Dudhia, 2001) which is coupled with the single-layer UCM.
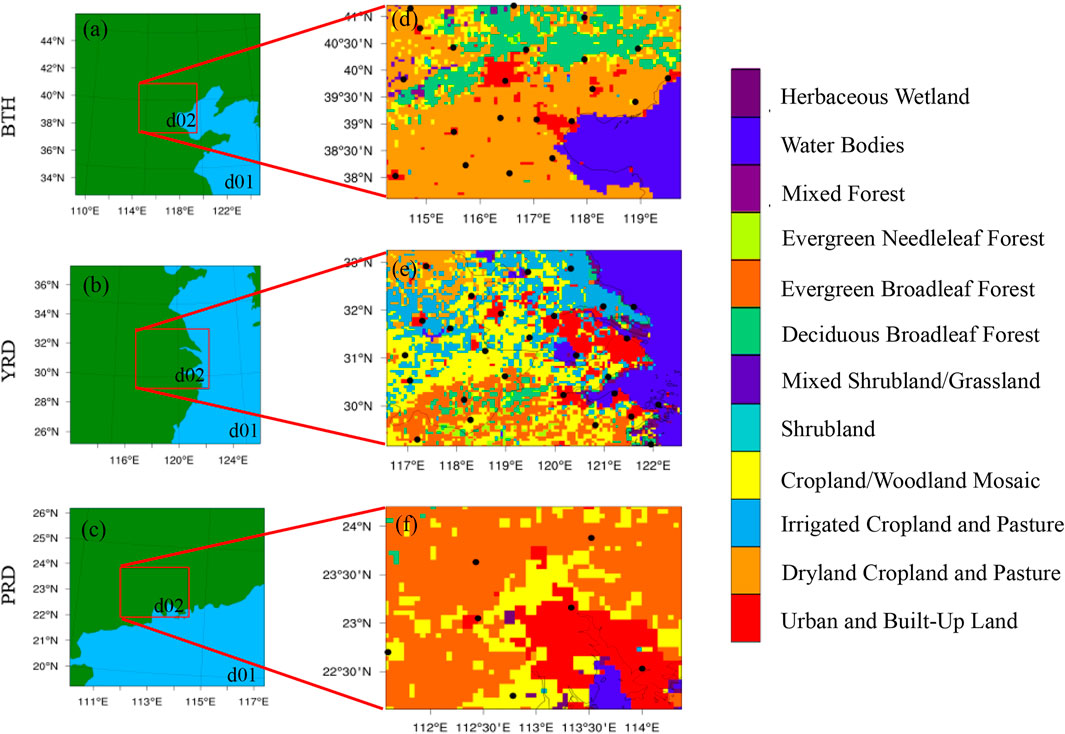
FIGURE 1. Double-nested model domains used in the study, with D01 as the outer domain and d02 being the innermost domain for (A) Beijing-Tianjin-Hebei region (BTH) (B) Yangtze River Delta (YRD) and (C) Peral River Delta (PRD) respectively. Land-use and land cover categories over BTH, YRD and PRD are shown in (D–F). The black spots in (D–F) denote the meteorological observation stations over the three urban agglomerations.
Atmospheric initial and lateral boundary conditions for driving the WRF model were taken from the bias-corrected CESM CMIP5 datasets (with a horizontal resolution of 0.9° × 1.25° in latitudinal and longitudinal directions) at 6-h intervals (https://rda.ucar.edu/datasets/ds316.1/). Compared with other CMIP5 models, CESM can reasonably reproduce the global temperature and precipitation distribution (Knutti and Sedlacek 2013), especially in China (Chen and Frauenfeld, 2014). For the future projection, a low-medium scenario (i.e., RCP45) was selected, which is corresponding to moderate emissions with a range of technologies and strategies for reducing GHG emissions (Thomson et al., 2011).
Moreover, the daily mean surface air temperature (SAT) retrieved from the Earth System Grid data portal was used to estimate the timing of 1.5 and 2°C global warming in the CESM projection under RCP4.5 scenario. Relative to the preindustrial period, the timing for 1.5 and 2°C warming is expected in year 2030 and 2047 respectively, based on the CESM CMIP5 projection under RCP4.5 scenario. To investigate future changes in summer HWs over urban agglomerations of eastern China under 1.5 and 2.0°C global warming, we take 1996–2005 as reference time period, 2025–2034 as 1.5°C warming time period, and 2042–2051 as 2°C warming time period in this study. Then three sets of 10-year dynamical downscaling experiments have been conducted, with WRF driven by the CESM simulation and projection results, i.e., 1) a historical downscaling run during 1996–2005 (Hereafter “Exp HIS-run”), with WRF driven by CESM historical simulation during the same period, 2) a scenario run under 1.5°C warming (Hereafter “Exp 1.5-run”), with WRF driven by CESM future projection results during 2025–2034, and 3) a scenario run under 2°C warming (Hereafter “Exp 2.0-run”), with WRF driven by CESM future projection results during 2042–2051. For each experiment, the model was initiated from 12:00 UTC 31 May and run until 00:00 UTC 1 September each year, with the first 12 h of each run being considered as the spin-up time.
The daily mean temperature (Tmean) and maximum temperature (Tmax) during 1996–2005, which is from the meteorological stations of the China Meteorological Administration (https://data.cma.cn), have been adopted for the evaluation and bias correction of WRF-based dynamical downscaling results. There are 21, 27, and 7 meteorological stations selected in BTH, YRD, and PRD, respectively. These stations include both urban stations and suburban stations in model domain d02 (Figures 1D–F).
The default land cover data (USGS 24-category) used in the WRF model are based on 1-km Advanced Very High Resolution Radiometer data obtained from 1992 to 1993, which cannot provide up-to-date information. In the present study, a 5-km resolution ChinaLC dataset from 1981 to 2010 was used to represent land cover in the model. Detailed information regarding the data sources and the classification approach can be found in Li et al. (2017) and Yang et al. (2017). When compared with other large-scale land cover datasets, the ChinaLC dataset shows an average overall accuracy of approximately 75%, which is much higher than its counterparts (Xiao et al., 2015; Li et al., 2017). As the resolution of the inner WRF domain was set to 5 km, which is the same as the spatial resolution of ChinaLC data, the land use data in the model can be replaced by the ChinaLC data in the WRF Preprocessing System.
The classification scheme of the ChinaLC dataset is developed based on the International Geosphere-Biosphere Programme (IGBP) land cover classification scheme, which is different from that of the USGS dataset in the WRF model. Before utilizing the ChinaLC dataset, the classification transformation was carried out based on the method used by Liang et al. (2019). A land cover case of the 2010s from the ChinaLC dataset was introduced into the WRF/UCM to represent the land cover over the urban agglomerations. The land cover classifications of the 2010s for the innermost model domains are shown in Figures 1D–F. We can see that the main types of land cover in the urban agglomerations present wide divergence in different latitudes, especially for the urban/built-up land (shaded areas in red). However, the urban/built-up land is not the dominant land cover type in urban agglomerations. In the historical scenario, the percentages of urbanized areas in BTH, YRD, and PRD are 4.89, 8.49, and 17.86%, respectively. Despite the varying percentages caused by the different area sizes of selected research regions, the climate characteristics of urban parts are usually very different from those of the suburbs in the regions. Therefore, the response of extreme cases in urban areas to global warming may have been underestimated in previous studies by using the regional average changes.
Generally, there are several HW definitions which are based on relative or absolute thresholds, but it is also noted that there is no single HW definition which could be universally accepted (You et al., 2017). Following the heatwave warning criteria used by the China Meteorological Administration (www.cma.gov.cn/en/WeatherWarnings/), we define extreme high temperature with a threshold of 35°C in this study, and the day with Tmax ≥ 35°C is defined as a high-temperature day. An HW event is then identified when there are three and more consecutive high-temperature days. Furthermore, three widely used HW indices are adopted for analysis in this study, i.e., the frequency index, which is the number of HWs in the study period; the duration index, which is the sum of the number of high temperature days during the HWs; the intensity index, which refers to the cumulative sum of the difference between the daily maximum temperature and the 35°C threshold for all HWs in study period. In this study, we focus on changes of HWs in summer season, so all above three HW indices are calculated for summer season, i.e., June, July and August.
To reduce the model uncertainty of WRF/UCM in simulating the daily mean and maximum temperature, bias correction (BC) for the WRF/UCM-based downscaled Tmax is needed. Based on the average difference between the observed and simulated Tmean and Tmax during the period 1996–2005, a climatology based bias correction method is applied in this study, just as mentioned in Li et al. (2018).
The bias-corrected temperature for the model (
Where
Using the bias corrected temperature results, the future changes of summer HWs in three urban agglomerations have been estimated, and the flow chart of analysis in this study is shown in Figure 2 as following.
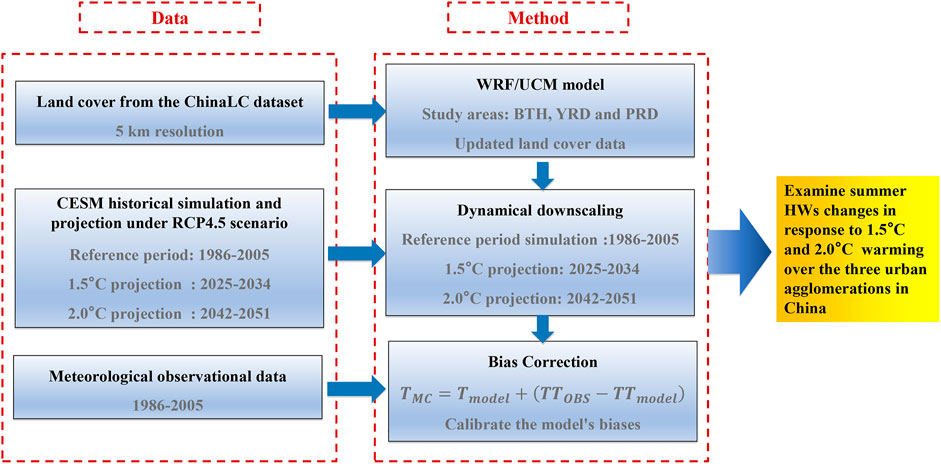
FIGURE 2. Flow chart for the examination of future changes of summer heat waves over the three urban agglomerations.
To examine the performance of the WRF/UCM modeling system, the frequency histograms of simulated results versus observed data for Tmean and Tmax are shown in Figure 3. All daily values during the entire analysis period (JJA of 1996–2005) from the meteorological stations were used. For BTH, YRD and PRD, the records are 18,900 (92 days × 10 years × 21 stations = 18,900), 24,300 (92 days × 10 years × 27stations = 18,900) and 6,300 (92 days × 10 years × 7 stations = 6,300), respectively. From the frequency of occurrence in different temperature sections, there are good temporal correlations between the bias-corrected model outputs and observations for Tmean and Tmax. The correlation coefficients are mostly greater than 0.6 for all three urban agglomerations. The mean bias ranges from 1.04 to 1.38 for Tmean and from 1.22 to 1.7 for Tmax. Furthermore, the spatial distributions of summer Tmean and Tmax in observations and bias-corrected model simulations are demonstrated in Figure 4. The HIS-run well replicates the observations in JJA with a spatial correlation coefficient of more than 0.6, which indicates that the bias-corrected model outputs capture the climatological features acceptably. The urban heat island effect can be seen, as Tmean and Tmax tend to be higher in the urban areas and lower in the surrounding areas.
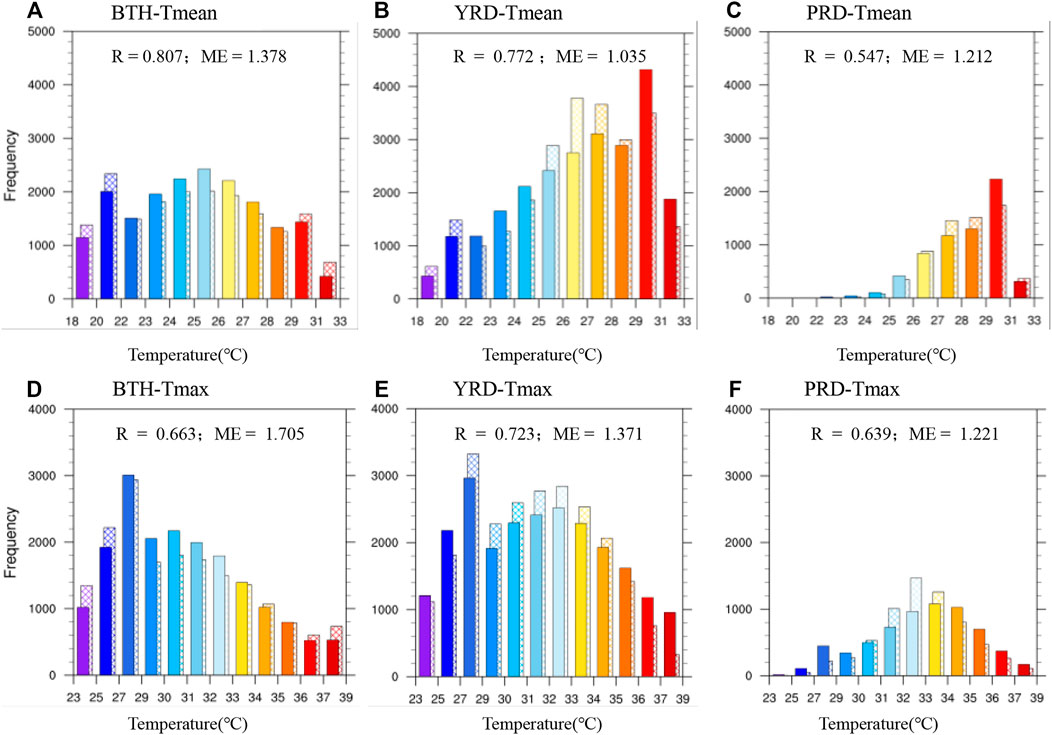
FIGURE 3. Frequency comparison histogram of Tmean and Tmax between observation data and WRF simulation results during the entire analysis period (JJA of 1996–2005) over (A,D) BTH, (B,E) YRD, and (C,F) PRD (solid color represents observation data, and grids represent WRF simulation results; R represents the correlation coefficients, and ME represents the mean bias).
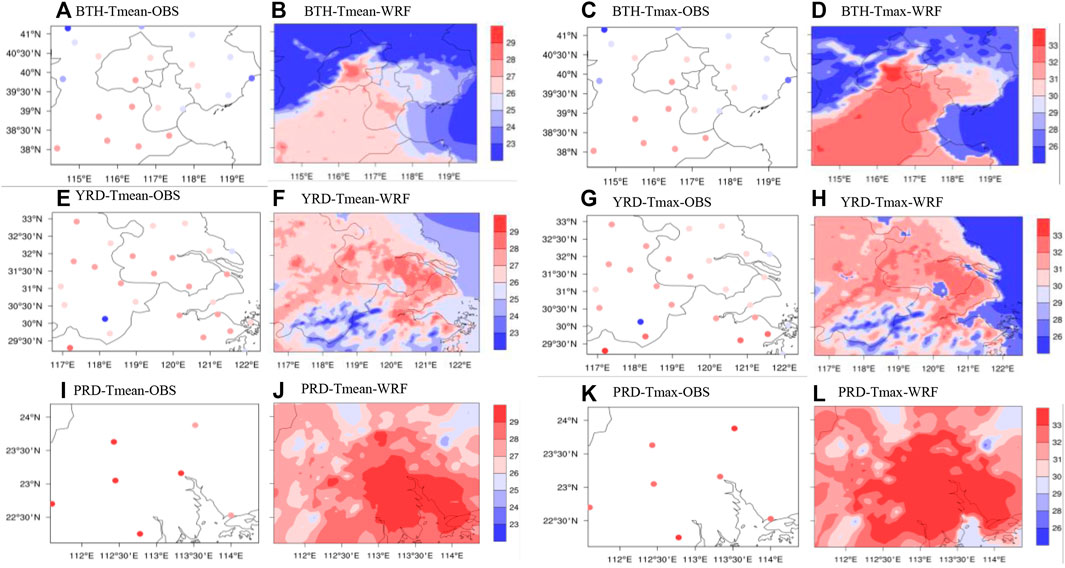
FIGURE 4. Spatial distributions of averaged Tmean and Tmax of observation data and WRF simulation results during the entire analysis period (JJA of 1996–2005) over (A–D) BTH, (E–H) YRD, and (I–L) PRD.
In summary, the bias-corrected model outputs can, to a great extent, generate the regional-scale characteristics of the summer temperatures realistically at each selected urban agglomeration faithfully, which suggests the reliability of using WRF downscaling for projecting the HW indices’ future changes. We note that a few efforts recently attempted to apply the WRF dynamic downscaling method to revisit the regional impacts of global warming (Yamamoto et al., 2018; Ge et al., 2021).
Figure 5 presents the WRF-projected changes in summer Tmean and Tmax over the three urban agglomerations under 1.5 and 2.0°C warming conditions relative to the historical run. Projected Tmean and Tmax both increase under 1.5 and 2.0°C warming throughout the urban agglomerations. When the warming reaches 1.5°C under RCP4.5, the averaged increasing magnitude of Tmax are 0.97°C with the inhomogeneous changes range between 0.92 and 1.01°C over BTH region. As for YRD region, the 10-year mean increasing magnitude is 0.88°C, with the range between 0.82 and 0.94°C. The increasing magnitude is smallest over PRD region, with mean magnitude of 0.85°C, maximum Tmax increase is 0.90°C, and minimum Tmax increase is 0.82°C. The increasing magnitudes of Tmax are stronger than those of Tmean. It suggests that the number of extreme high temperature events will soar in urban agglomerations. Under the scenario of 2.0°C warming, the changes of summer temperatures will be greater (Figure 5B), and the largest increases of Tmean and Tmax occur in YRD.
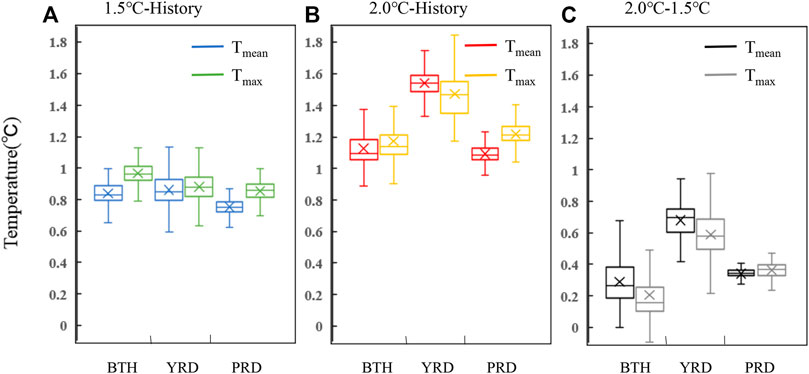
FIGURE 5. Box diagram of the differences in Tmean and Tmax of the three urban agglomerations over eastern China between (A) Exp 1.5-run and Exp HIS-run, between (B) Exp 2.0-run and Exp HIS-run, and between (C) Exp 2.0-run and Exp 1.5-run (“×” represents the average value, the top horizontal line refers to the maximum value, the bottom horizontal line represents the minimum value, the upper and lower quartile indicate the ranges from 25th to 75th percentile in the packing drawing, and the middle horizontal line represents the median).
How the increase from 1.5 to 2.0°C warming impacts on summer temperatures is shown in Figure 5C. With this additional 0.5°C temperature rise, Tmean will increase by 0.29°C (0.19–0.38°C), 0.68°C (0.6–0.75°C) and 0.34°C (0.33–0.36°C) over BTH, YRD and PRD, respectively, whereas Tmax can rise by 0.2°C (0.1–0.26°C), 0.59°C (0.5–0.69°C) and 0.36°C (0.33–0.4°C) for BTH, YRD and PRD, respectively. Obviously, the increases of Tmean and Tmax in response to the additional 0.5°C warming are largest in YRD, which implies that by enforcing the agreement on limiting the temperature increase to 1.5°C, the YRD region will benefit more than the other urban agglomerations in terms of reducing extreme hot events. This result is consistent with the results of multi-mode projection on extreme maximum temperature by Yu et al. (2018). Note that the increases of Tmean and Tmax in response to the additional 0.5°C warming in the other urban agglomerations except YRD region is slightly weaker than the additional rise. This may be because our study focuses on summertime when the warming trend will be less significant than winter in China under future global warming (Yang et al., 2021c). In addition, Ge et al. (2021) pointed out that the smaller benefits achieved from the additional 0.5°C warming limit for the WRF projection than CESM.
Figures 6–8 show the spatial distributions of projected future changes in the HWs’ frequency, duration, and intensity over the three urban agglomerations. The three indices of summer HWs are enhanced in most areas of the urban agglomerations against the backgrounds of 1.5 and 2.0°C warming. According to the variation diagrams of HW frequency in Figures 6A,D,G, the HW frequency is enhanced in almost entire BTH and YRD under the 1.5°C warming scenario. In BTH, the enhancement mainly occurs over the urban underlying surface and the underlying surface of dry cropland to the south of the urban areas, while the urban and cropland/woodland mosaic areas witness most of the HW frequency increases in YRD. As for PRD, the HW frequency decreases in the urban areas of Guangzhou, but increases significantly in the surrounding cities. Under the 2.0°C warming scenario, there is a similar distribution of HW frequency changes, but the range is more extensive, and the intensity is stronger (Figures 6B,E,H). With the additional temperature increase of 0.5°C from 1.5 to 2.0°C, the frequency of HWs in metropolitan areas (such as Beijing, Shanghai, Guangzhou) will decrease (Figures 6C,F,I). It should be pointed out that the frequency of HWs in our study is defined based on the HW events, so the reduction of frequency may not mean the decrease of high-temperature days, because the increase of HWs’ duration may reduce HWs’ frequency in the fixed summertime.
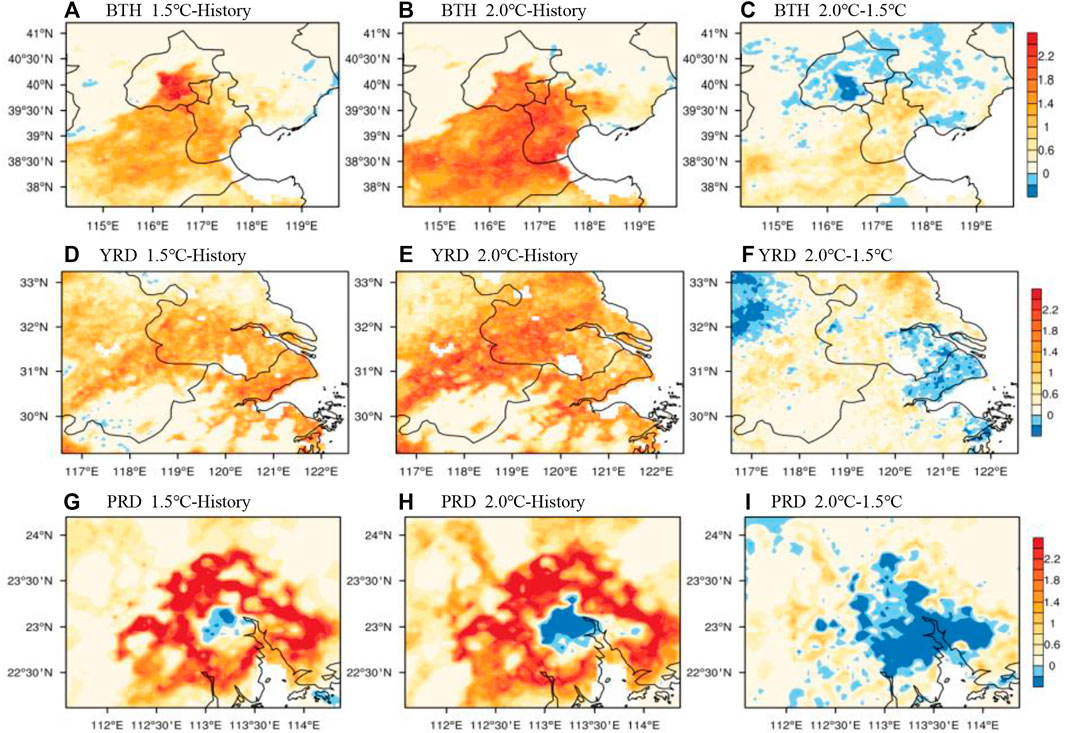
FIGURE 6. Spatial distributions of the difference in HW frequency over the three urban agglomerations between Exp 1.5-run and Exp HIS-run (A,D,G), between Exp 2.0-run and Exp HIS-run (B,E,H), and between Exp 2.0-run and Exp 1.5-run (C,F,I). The colored area indicates that the change is statistically significant at the 95% confidence level.
The variations of HW duration under different scenarios are illustrated in Figure 7. Compared with the historical period, when reaching the warming scenarios of 1.5 and 2.0°C, the urban agglomerations show a ubiquitous characteristic of prolonged HW duration at different latitudes from north to south, and the more southwards the urban agglomerations are located, the larger increases their HW duration will have. In those urban agglomerations, the regions with relatively larger HW duration growth can generally match the regions with higher HW frequency increase shown in Figure 6. As can be seen from Figures 7C,F,I, with the additional 0.5°C warming, the duration of HWs increases both in the urban areas and in the suburbs. Why does the frequency of HWs in urban areas decrease, while in the suburbs on the contrary (Figures 6C,F,I), and the duration of HWs in the suburbs increases more than that in urban areas? It may be because the current urban areas have higher frequency and longer duration of HWs than the suburbs due to the heat island effect. Therefore, under global warming, HWs’ frequency and duration increase within a limited extent in cities, while the suburbs have a greater growth space.
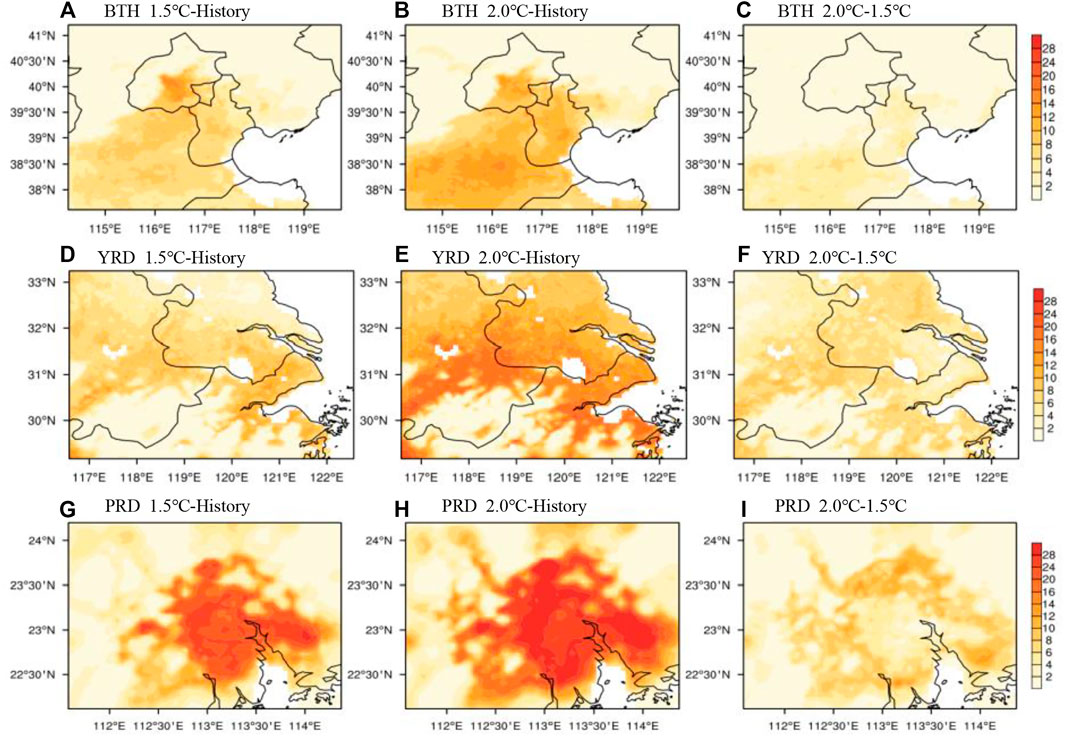
FIGURE 7. Spatial distributions of the difference in HW duration over the three urban agglomerations between Exp 1.5-run and Exp HIS-run (A,D,G), between Exp 2.0-run and Exp HIS-run (B,E,H), and between Exp 2.0-run and Exp 1.5-run (C,F,I). The colored area indicates that the change is statistically significant at the 95% confidence level.
Different from the changes in the frequency and duration of HWs, whether from the historical period to the 1.5 and 2.0°C warming periods or from 1.5 to 2.0°C warming, large increases of HW intensity are mainly concentrated over the urban underlying surface (Figure 8). This implies that the urban population will face stronger HWs in the future.
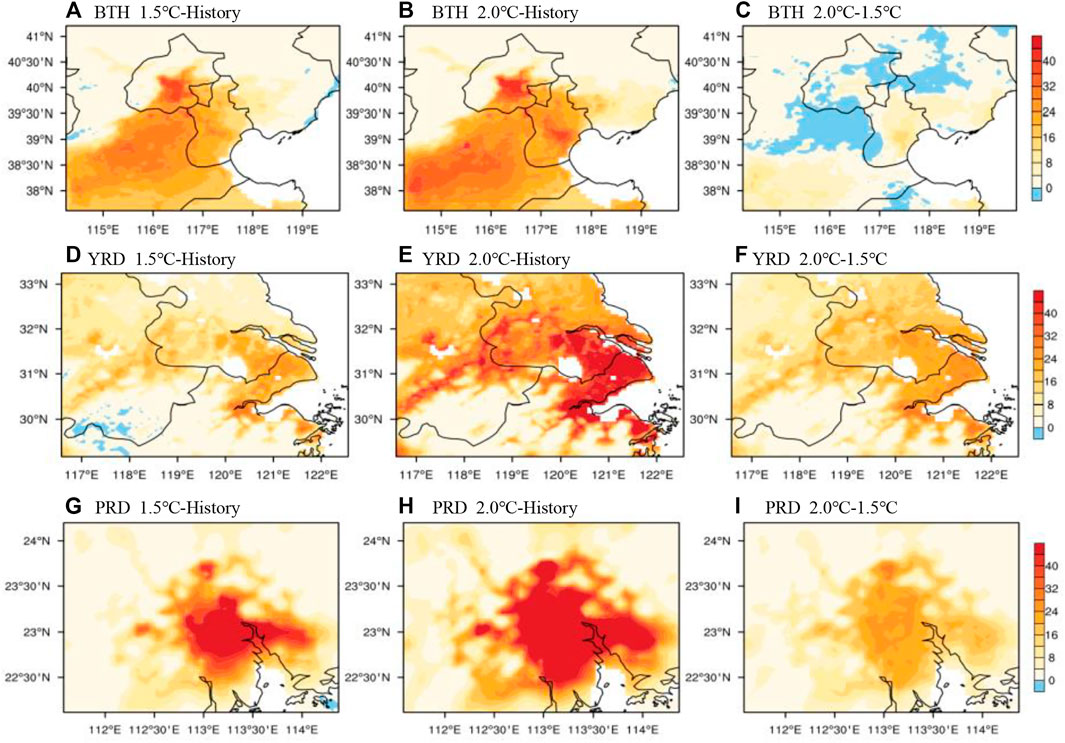
FIGURE 8. Spatial distributions of the difference in HW intensity over the three urban agglomerations between Exp 1.5-run and Exp HIS-run (A,D,G), between Exp 2.0-run and Exp HIS-run (B,E,H), and between Exp 2.0-run and Exp 1.5-run (C,F,I). The colored area indicates that the change is statistically significant at the 95% confidence level.
Furthermore, the future changes in the area-average frequency, duration, and intensity of HWs in each urban agglomeration are summarized in Table 1. It can be seen from the table that, under any scenario, the more southward the urban agglomerations are, the higher frequency, longer duration, and greater intensity their HWs will have, since the HW indices are related to the geographical latitudes of the urban agglomerations. Under the 1.5°C warming scenario, the frequency, duration and intensity of HWs are increased respectively by 50.4, 63.6, and 116.7% in BTH, 84.7, 84.6, and 123.2% in YRD, and 76.3, 109.8, and 130.4% in PRD compared with the historical period. Among the three HWs indices, the intensity grows the most. The additional warming of 0.5°C from 1.5 to 2.0°C will result in 15.5, 44.7, and 75.5% increases in the frequency, duration, and intensity of HWs in YRD, which are the largest among those of the three urban agglomerations.

TABLE 1. The values and growth rates of the three HW indices in the three urban agglomerations over eastern China under historical and different warming scenarios.
From the spatial distribution figures concerning the future changes in HWs’ frequency, duration, and intensity, we can see large spatial differences in each urban agglomeration, which mainly lie between the urban and non-urban underlying surfaces. Four major land cover types were selected to analyze their HW index values in each urban agglomeration in detail. Figure 9 shows the area-average HW frequency, duration, and intensity values of different land cover types in each urban agglomeration. Compared with other major land cover types, the urban areas have much higher frequency, duration, and intensity of HWs. The response of HW indices to the warming is more robust in the urban areas, especially under 1.5°C warming climate. In the scenario of 1.5°C warming, the HWs’ frequency, duration and intensity in urban areas of BTH are 3.73, 19.36, and 51.98 respectively. Compared to the respective values of HW indices over the dryland cropland and pasture, which are the biggest among those of non-urban land cover types in BTH, the above values in urban areas are 60, 68, and 144% higher. In YRD, the HW frequency, duration, and intensity in urban areas are 3.44, 22.96, and 41.49 respectively, and those values are 65, 83 and 140% higher than the respective greatest values for non-urban land cover, which all belong to the irrigated cropland and pasture in this case. The HW frequency, duration, and intensity in the urban areas of PRD are 4.71, 38.74, and 59.54 respectively, which are 74, 126, and 200% higher than those of the cropland and woodland mosaic, the largest among the respective values for non-urban land cover. In PRD, the differences in the values of HW indices between urban and non-urban areas are particularly significant. The foregoing results thus suggest a much graver future risk of HWs in urban areas than in non-urban areas.
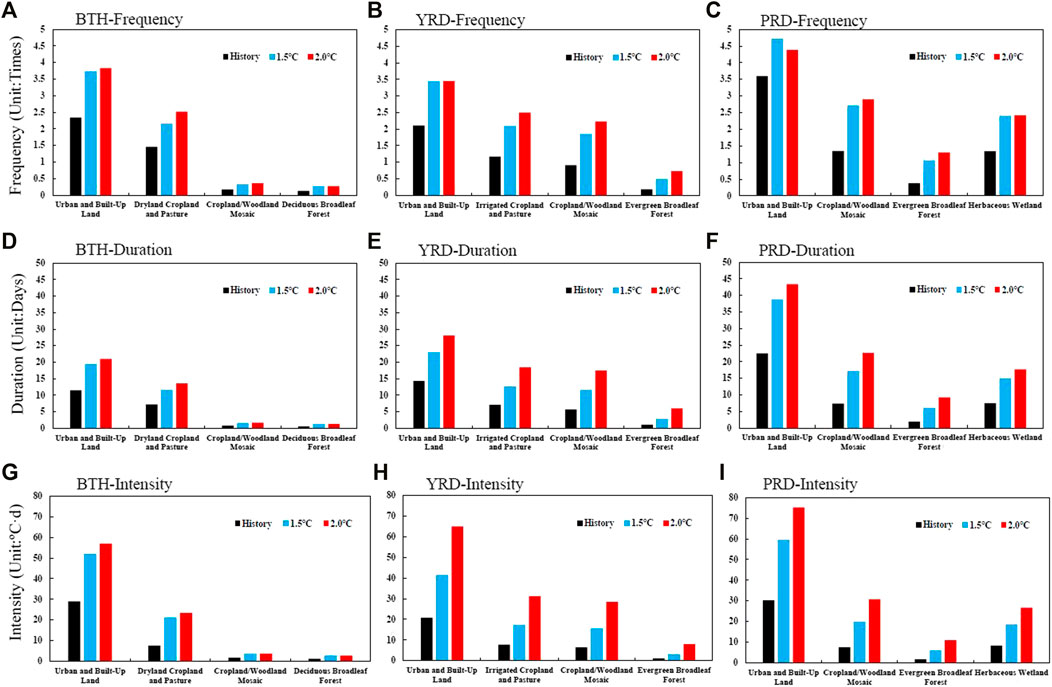
FIGURE 9. Area averages of HW frequency (A), (B), (C), duration (D), (E), (F) and intensity (G), (H), (I) over four major underlying surfaces in each urban agglomeration (black represents the historical period, blue represents the 1.5°C warming period and red represents the 2.0°C warming period).
Urban areas are more vulnerable to HWs due to the combined impacts of global climate change and their own local climate effects. In this study, the high-resolution downscaling results of WRF/UCM have been used to investigate the future changes of summer HWs under 1.5 and 2.0°C global warming over three urban agglomerations of eastern China. The results indicate that the WRF/UCM model can capture the basic features of summer temperature across urban agglomerations.
The results of downscaling projection based on the WRF/UCM show that the influence ranges of HWs in summer are significantly expanded, and the values of HWs indices are significantly increased compared with the data of the historical period. The growth rates of the three HWs indices can reach more than 50% in the 1.5°C warming period, and can even be higher than 70% in the 2.0°C warming period, during which the growth rate of HW intensity is more than 200%. An additional 0.5°C temperature increase from 1.5 to 2.0°C has the most significant impact on the future HWs of the YRD urban agglomeration; particularly, the HW intensity therein can increase by 75.5%, which is far higher than the other urban agglomerations.
The downscaled changes of HWs in the three urban agglomerations under the future warming of 1.5–2.0°C are qualitatively consistent with previous conclusions derived from statistically downscaled results of 19 CMIP5 models under RCP4.5 (Yu et al., 2017), although the magnitude of changes differs due to difference in extreme events definition and climate models used for projection (Li et al., 2018; Sun et al., 2019). But all results suggest that urban agglomerations would go through very extreme heat waves events if there is no climate change mitigation strategy being taken in the remainder of the 21st century.
It is noted that the possible changes of the HWs across three urban agglomerations in this study are under transient warming condition using CESM projection results. There has recent interest in understanding the differences of future changes of climate extremes between stabilized and transient warming situation (Sun et al., 2019; King et al., 2020; Ge et al., 2021). King et al. (2020) pointed out that there are substantial differences of temperature changes between transient and quasi-equilibrium states, relative to differences between the 1.5 and 2 °C global warming limits. Therefore, it is worthy of in-depth study of the differences in HWs between transient and equilibrium climates, which is of great significance for managing the risks of climate change.
On the other hand, the projections or statistically downscaled data based on coarse-resolution global climate system models used the regional averaged results to represent the future climate change in urban agglomerations, which is insufficient in urban areas (Bounoua et al., 2015; Zhao et al., 2021). This results derived from WRF/UCM model downscaled data demonstrate the warming response in urban areas is more prominent, compared with other major land cover types in each urban agglomeration. In the scenario of 1.5°C warming, the difference of HWs between urban and non-urban areas is particularly significant in PRD. Based on the CMIP6 data sets under all future scenarios, the greatest heat risk considering population or economy is projected in the PRD region (Chou et al., 2021; Zhang et al., 2021), which is consistent with our projections. The results should provide further scientific support for the mitigation and adaption of the future HWs risk in mega-cities.
However, only RCP4.5 was used in our analysis and various RCPs may cause uncertainties of the result. Uncertainties from the projections of various global models can also be another source of the uncertainties of the results. In addition, accurate land cover information is also important. It is necessary to perform further investigation to reduce the uncertainty in our results for better supporting the mitigation and adoption of the future HWs risk in the urban areas.
The original contributions presented in the study are included in the article/Supplementary Material, further inquiries can be directed to the corresponding author.
HM and ZL designed the study. HM and YW performed the downscaling simulations and the data analysis. All authors contributed to the writing of the manuscript.
This work was jointly supported by China National Key R&D Program (2017YFA0603804), the National Natural Science Foundation of China (42021004, 42175032) and the “Earth System Science Numerical Simulator Facility” (EarthLab).
The authors declare that the research was conducted in the absence of any commercial or financial relationships that could be construed as a potential conflict of interest.
All claims expressed in this article are solely those of the authors and do not necessarily represent those of their affiliated organizations, or those of the publisher, the editors and the reviewers. Any product that may be evaluated in this article, or claim that may be made by its manufacturer, is not guaranteed or endorsed by the publisher.
Bounoua, L., Zhang, P., Mostovoy, G., Thome, K., Masek, J., Imhoff, M., et al. (2015). Impact of Urbanization on US Surface Climate. Environ. Res. Lett. 10, 084010. doi:10.1088/1748-9326/10/8/084010
Chen, F., and Dudhia, J. (2001). Coupling an Advanced Land Surface-Hydrology Model with the Penn State-NCAR MM5 Modeling System. Part I: Model Implementation and Sensitivity. Mon. Wea. Rev. 129, 569–585. doi:10.1175/1520-0493(2001)129<0569:caalsh>2.0.co;2
Chen, L., and Frauenfeld, O. W. (2014). A Comprehensive Evaluation of Precipitation Simulations over China Based on CMIP5 Multimodel Ensemble Projections. J. Geophys. Res. Atmos. 119, 5767–5786. doi:10.1002/2013jd021190
Chen, L., Ma, Z., Li, Z., Wu, L., Flemke, J., and Li, Y. (2018). Dynamical Downscaling of Temperature and Precipitation Extremes in China under Current and Future Climates. Atmosphere-Ocean 56 (1), 55–70. doi:10.1080/07055900.2017.1422691
Chen, Y., and Li, Y. (2017). An Inter-comparison of Three Heat Wave Types in China during 1961-2010: Observed Basic Features and Linear Trends. Sci. Rep. 7, 45619. doi:10.1038/srep45619
Chou, J., Sun, M., Dong, W., Zhao, W., Li, J., Li, Y., et al. (2021). Assessment and Prediction of Climate Risks in Three Major Urban Agglomerations of Eastern China. Sustainability 13, 13037. doi:10.3390/su132313037
Coumou, D., and Robinson, A. (2013). Historic and Future Increase in the Global Land Area Affected by Monthly Heat Extremes. Environ. Res. Lett. 8 (3), 034018. doi:10.1088/1748-9326/8/3/034018
Dian-Xiu, Y., Ji-Fu, Y., Zheng-Hong, C., You-Fei, Z., and Rong-Jun, W. (2014). Spatial and Temporal Variations of Heat Waves in China from 1961 to 2010. Adv. Clim. Change Res. 5, 66–73.
Fang, C. (2015). Important Progress and Future Direction of Studies on China's Urban Agglomerations. J. Geogr. Sci. 25 (8), 1003–1024. doi:10.1007/s11442-015-1216-5
Frich, P., Alexander, L., Della-Marta, P., Gleason, B., Haylock, M., Klein Tank, A., et al. (2002). Observed Coherent Changes in Climatic Extremes during the Second Half of the Twentieth century. Clim. Res. 19 (3), 193–212. doi:10.3354/cr019193
Ge, J., Qiu, B., Wu, R., Cao, Y., Zhou, W. D., Zhou, W., et al. (2021). Does Dynamic Downscaling Modify the Projected Impacts of Stabilized 1.5°C and 2°C Warming on Hot Extremes Over China? Geophys. Res. Lett. 48. doi:10.1029/2021GL092792
Grossman-Clarke, S., Schubert, S., and Fenner, D. (2017). Urban Effects on Summertime Air Temperature in Germany under Climate Change. Int. J. Climatol. 37, 905–917. doi:10.1002/joc.4748
Gong, P., Li, X. C., and Zhang, W. (2019). 40-Year (1978–2017) Human Settlement Changes in China Reflected by Impervious Surfaces From Satellite Remote Sensing. Science Bulletin 64 (11), 756–763.
Hong, S.-Y., Noh, Y., and Dudhia, J. (2006). A New Vertical Diffusion Package with an Explicit Treatment of Entrainment Processes. Monthly Weather Rev. 134, 2318–2341. doi:10.1175/mwr3199.1
Hong, S. Y., and Lim, J. J. (2006). The WRF Single-Moment 6-Class Microphysics Scheme (WSM6). J. Korean Meteorol. Soc. 42 (2), 129–151.
Hua, W., Dong, X., Liu, Q., Zhou, L., Chen, H., and Sun, S. (2021). High-Resolution WRF Simulation of Extreme Heat Events in Eastern China: Large Sensitivity to Land Surface Schemes. Front. Earth Sci. 9, 770826. doi:10.3389/feart.2021.770826
Iacono, M. J., Delamere, J. S., Mlawer, E. J., Shephard, M. W., Clough, S. A., and Collins, W. D. (2008). Radiative Forcing by Long-Lived Greenhouse Gases: Calculations with the AER Radiative Transfer Models. J. Geophys. Res. 113, D13103. doi:10.1029/2008JD009944
IPCC (2014). “Part A: Global and Sectoral Aspects. Contribution of Working Group II to the Fifth Assessment Report of the Intergovernmental Panel on Climate Change,” in Climate Change 2014: Impacts, Adaptation, and Vulnerability (Cambridge, United Kingdom and New York, NY: Cambridge University Press) 1132.
Kain, J. S. (2004). The Kain-Fritsch Convective Parameterization: An Update. J. Appl. Meteorol. 43, 170–181. doi:10.1175/1520-0450(2004)043<0170:tkcpau>2.0.co;2
King, A. D., Lane, T. P., Henley, B. J., and Brown, J. R. (2020). Global and Regional Impacts Differ between Transient and Equilibrium Warmer Worlds. Nat. Clim. Chang. 10, 42–47. doi:10.1038/s41558-019-0658-7
Knutti, R., and Sedláček, J. (2013). Robustness and Uncertainties in the New CMIP5 Climate Model Projections. Nat. Clim Change 3 (4), 369–373. doi:10.1038/nclimate1716
Kovats, R. S., and Hajat, S. (2008). Heat Stress and Public Health: A Critical Review. Annu. Rev. Public Health 29, 41–55. doi:10.1146/annurev.publhealth.29.020907.090843
Kusaka, H., and Kimura, F. (2004). Coupling a Single-Layer Urban Canopy Model with a Simple Atmospheric Model: Impact on Urban Heat Island Simulation for an Idealized Case. J. Meteorol. Soc. Jpn. 82, 67–80. doi:10.2151/jmsj.82.67
Kusaka, H., Kondo, H., Kikegawa, Y., and Kimura, F. (2001). A Simple Single-Layer Urban Canopy Model for Atmospheric Models: Comparison with Multi-Layer and Slab Models. Boundary-Layer Meteorology 101, 329–358. doi:10.1023/a:1019207923078
Lesk, C., Rowhani, P., and Ramankutty, N. (2016). Influence of Extreme Weather Disasters on Global Crop Production. Nature 529 (7584), 84–87. doi:10.1038/nature16467
Li, D., Zhou, T., Zou, L., Zhang, W., and Zhang, L. (2018). Extreme High‐Temperature Events Over East Asia in 1.5°C and 2°C Warmer Futures: Analysis of NCAR CESM Low‐Warming Experiments. Geophys. Res. Lett. 45, 1541–1550. doi:10.1002/2017gl076753
Li, H., Xiao, P., Feng, X., Yang, Y., Wang, L., Zhang, W., et al. (2017). Using Land Long-Term Data Records to Map Land Cover Changes in China Over 1981-2010. IEEE J. Sel. Top. Appl. Earth Observations Remote Sensing 10 (4), 1372–1389. doi:10.1109/jstars.2016.2645203
Liang, Y. X., Ma, H. Y., Jiang, Z. H., Bao, Y. T., and Li, H. J. (2019). Impact Assessment of Changes in Agricultural and Natural Vegetation Mosaics on Near-Surface Meteorological fields in the Yangtze River Delta. J. Meteorol. Sci. 39 (1), 23–33. doi:10.3969/2018jms.0013 (in Chinese).
McMichael, A. J., and Lindgren, E. (2011). Climate Change: Present and Future Risks to Health, and Necessary Responses. J. Intern. Med. 270 (5), 401–413. doi:10.1111/j.1365-2796.2011.02415.x
Meehl, G. A., and Tebaldi, C. (2004). More Intense, More Frequent, and Longer Lasting Heat Waves in the 21st century. Science 305 (5686), 994–997. doi:10.1126/science.1098704
Oke, T. R. (1982). The Energetic Basis of the Urban Heat Island. Q.J Royal Met. Soc. 108, 1–24. doi:10.1002/qj.49710845502
Pachauri, R. K., Allen, M. R., Barros, V. R., Broome, J., Cramer, W., Christ, R., et al. (2014). Climate Change 2014: Synthesis Report. Contribution of Working Groups I, II and III to the Fifth Assessment Report of the Intergovernmental Panel on Climate Change. Geneva, Switzerland: IPCC, 151.
Perkins, S. E. (2015). A Review on the Scientific Understanding of Heatwaves—Their Measurement, Driving Mechanisms, and Changes at the Global Scale. Atmos. Res. 164-165, 242–267. doi:10.1016/j.atmosres.2015.05.014
Ren, G., and Zhou, Y. (2014). Urbanization Effects on Trends of Extreme Temperature Indices of National Stations over mainland China, 1961–2008. J. Clim. 27, 2340–2360. doi:10.1175/jcli-d-13-00393.1
Seneviratne, S. I., Donat, M. G., Mueller, B., and Alexander, L. V. (2014). No Pause in the Increase of Hot Temperature Extremes. Nat. Clim Change 4 (3), 161–163. doi:10.1038/nclimate2145
Skamarock, W. C., and Klemp, J. B. (2008). A Time-Split Nonhydrostatic Atmospheric Model for Weather Research and Forecasting Applications. J. Comput. Phys. 227 (7), 3465–3485. doi:10.1016/j.jcp.2007.01.037
Stone, B., Hess, J. J., and Frumkin, H. (2010). Urban Form and Extreme Heat Events: Are Sprawling Cities More Vulnerable to Climate Change Than Compact Cities? Environ. Health Perspect. 118 (10), 1425–1428. doi:10.1289/ehp.0901879
Su, Q., and Dong, B. (2019a). Projected Near-Term Changes in Three Types of Heat Waves over China under RCP4.5. Clim. Dyn. 53, 3751–3769. doi:10.1007/s00382-019-04743-y
Su, Q., and Dong, B. (2019b). Recent Decadal Changes in Heat Waves over China: Drivers and Mechanisms. J. Clim. 32 (14), 4215–4234. doi:10.1175/jcli-d-18-0479.1
Sun, C., Jiang, Z., Li, W., Hou, Q., and Li, L. (2019). Changes in Extreme Temperature over China when Global Warming Stabilized at 1.5 °C and 2.0 °C. Sci. Rep. 9. doi:10.1038/s41598-019-50036-z
Sun, Y., Zhang, X., Ren, G., Zwiers, F. W., and Hu, T. (2016). Contribution of Urbanization to Warming in China. Nat. Clim Change 6 (7), 706–709. doi:10.1038/nclimate2956
Sun, Y., Zhang, X., Zwiers, F. W., Song, L., Wan, H., Hu, T., et al. (2014). Rapid Increase in the Risk of Extreme Summer Heat in Eastern China. Nat. Clim Change 4 (12), 1082–1085. doi:10.1038/nclimate2410
Thomson, A. M., Calvin, K. V., Smith, S. J., et al. (2011). RCP4.5: A Pathway for Stabilization of Radiative Forcing by 2100. Climatic Change 109 (1–2), 77–94. doi:10.1007/s10584-011-0151-4
Wang, L., Li, C., Ying, Q., Cheng, X., Wang, X., Li, X., et al. (2012). China's Urban Expansion from 1990 to 2010 Determined with Satellite Remote Sensing. Chin. Sci. Bull. 57, 2802–2812. doi:10.1007/s11434-012-5235-7
Wu, J., Han, Z., Xu, Y., Zhou, B., and Gao, X. (2020). Changes in Extreme Climate Events in China Under 1.5 °C-4 °C Global Warming Targets: Projections Using an Ensemble of Regional Climate Model Simulations. J. Geophys. Res. Atmos. 125. doi:10.1029/2019JD031057
Xiao, P., Li, H., Yang, Y., Wang, L., and Wang, X. (2015). “Land-use Changes in China during the Past 30 Years,” in Land-Use Changes in China (Singapore: World Scientific), 11–49. doi:10.1142/9789814651783_0002
Yamamoto, M., Kasai, M., Okaze, T., Hanaoka, K., and Mochida, A. (2018). Analysis of Climatic Factors Leading to Future Summer Heatstroke Risk Changes in Tokyo and Sendai Based on Dynamical Downscaling of Pseudo Global Warming Data Using WRF. J. Wind Eng. Ind. Aerodynamics 183, 187–197. doi:10.1016/j.jweia.2018.10.001
Yang, X., Zeng, G., Zhang, S., Hao, Z., and Iyakaremye, V. (2021a). Relationship between Two Types of Heat Waves in Northern East Asia and Temperature Anomalies in Eastern Europe. Environ. Res. Lett. 16, 024048. doi:10.1088/1748-9326/abdc8a
Yang, X., Zhou, B., Xu, Y., and Han, Z. (2021b). CMIP6 Evaluation and Projection of Temperature and Precipitation over China. Adv. Atmos. Sci. 38, 817–830. doi:10.1007/s00376-021-0351-4
Yang, Y., Lin, Z., Luo, L., Zhang, Y., and Li, Z. (2021c). Inhomogeneous Trends in the Onset Date of Extreme Hot Days in China over the Last Five Decades. Atmos. Oceanic Sci. Lett. 14, 100080. doi:10.1016/j.aosl.2021.100080
Yang, Y., Xiao, P., Feng, X., and Li, H. (2017). Accuracy Assessment of Seven Global Land Cover Datasets over China. ISPRS J. Photogrammetry Remote Sensing 125, 156–173. doi:10.1016/j.isprsjprs.2017.01.016
You, Q. L., Jiang, Z. H., Kong, L., Wu, Z., Bao, Y., Kang, S., et al. (2017). A Comparison of Heat Wave Climatologies and Trends in China Based on Multiple Definitions. Clim. Dyn. 48, 3975–3989. doi:10.1007/s00382-016-3315-0
Yu, R., Zhai, P., and Lu, Y. (2018). Implications of Differential Effects between 1.5 and 2 °C Global Warming on Temperature and Precipitation Extremes in China's Urban Agglomerations. Int. J. Climatol 38, 2374–2385. doi:10.1002/joc.5340
Yu, Y., Shao, Q., Lin, Z., and Kang, I.-S. (2021). Characteristics Analysis and Synoptic Features of Event-Based Regional Heatwaves over China. J. Geophys. Res. Atmospheres 126, e2020JD033865. doi:10.1029/2020jd033865
Zhang, G., Zeng, G., Liang, X.-Z., and Huang, C. (2021). Increasing Heat Risk in China's Urban Agglomerations. Environ. Res. Lett. 16, 064073. doi:10.1088/1748-9326/ac046e
Keywords: heat waves, dynamic downscaling, urban agglomerations, 1.5°C and 2.0°C global warming, future projection
Citation: Ma H, Wang Y and Lin Z (2022) Future Changes of Summer Heat Waves Over Urban Agglomerations in Eastern China Under 1.5°C and 2.0°C Global Warming. Front. Earth Sci. 10:823286. doi: 10.3389/feart.2022.823286
Received: 27 November 2021; Accepted: 18 January 2022;
Published: 18 February 2022.
Edited by:
Zhaowu Yu, Fudan University, ChinaReviewed by:
Huopo Chen, Institute of Atmospheric Physics (CAS), ChinaCopyright © 2022 Ma, Wang and Lin. This is an open-access article distributed under the terms of the Creative Commons Attribution License (CC BY). The use, distribution or reproduction in other forums is permitted, provided the original author(s) and the copyright owner(s) are credited and that the original publication in this journal is cited, in accordance with accepted academic practice. No use, distribution or reproduction is permitted which does not comply with these terms.
*Correspondence: Hongyun Ma, aHltYUBudWlzdC5lZHUuY24=
Disclaimer: All claims expressed in this article are solely those of the authors and do not necessarily represent those of their affiliated organizations, or those of the publisher, the editors and the reviewers. Any product that may be evaluated in this article or claim that may be made by its manufacturer is not guaranteed or endorsed by the publisher.
Research integrity at Frontiers

Learn more about the work of our research integrity team to safeguard the quality of each article we publish.