 Anmin Wang
 Jing Li2
 Daiyong Cao
- 1College of Geoscience and Surveying Engineering, China University of Mining and Technology, Beijing, China
- 2Department of Geology and Surveying Engineering, Shanxi Institute of Energy, Jinzhong, China
The understanding of the nanopore structure in tectonically deformed coal (TDC) could be expanded from the perspective of a single maceral. A total of 10 TDCs with an increasing deformation degree (in the order of unaltered, cataclastic, porphyroclast, scaly, and powdery coal), were collected in a single coal seam and stripped into 10 vitrinite and 10 inertinite samples. Carbon dioxide (CO2) adsorption and nitrogen (N2) adsorption/desorption experiments were conducted to reveal the nanopore structure, whereas 13C solid-state nuclear magnetic resonance and X-ray diffraction experiments were conducted to detect the macromolecular structure. The results reveal that the macromolecular structures of both vitrinite and inertinite can be altered by tectonic stress. As the deformation degree increases, the aliphatic carbons decrease, the aromatic carbons increase, and the aromatic interlayer spacing decreases, whereas the crystallite stacking height and the average number of crystallites in a stack increase. For mesopores, the pore volume of vitrinite slowly decreases and then increases at the stage of scaly coal, whereas that of inertinite fluctuates with no obvious regularities. For micropores, the pore volume of vitrinite deceases as the deformation degree increases, whereas that of inertinite decreases since the deformation stage of porphyroclast coal, and little changed from the deformation stage of unaltered to cataclastic coal. As the coal deformation degree increases, the aromatic interlayer spacing decreases, resulting in a decrease in the micropore volume; however, the average crystallite stacking height and the average number of crystallites in a stack increase, leading to an increase in the micropore volume. Therefore, the micropore decreases and then increases as the coal deformation degree increases. However, the macromolecular changes weakly affect the mesopore evolution in the coal deformation process.
Introduction
As China’s coal basins have generally experienced late tectonic deformations (Cao et al., 2020), tectonically deformed coals (TDCs) can typically be found in the edges of the coal basins, which often leads to coal and gas outbursts, threatening the safe production of coal mines. In addition, TDCs seriously hinder the exploration and development of coalbed methane in complicated structure areas, since the reservoir characteristics of TDCs are much different from that of unaltered coals (Zhang and Yao, 2021). Nanopore structure in coal is a key factor affecting coal reservoirs (Yao et al., 2011; Liu et al., 2019a), and an important scientific issue is that the pore structure of TDCs is very complex, which makes it difficult to produce methane gas in TDCs. Therefore, the pore structure of TDC has always been a hot topic in the fields of gas prevention in coal mines and coalbed methane drainage (Pan et al., 2016).
Tectonic stress is deemed to be one of the dynamic factors in the evolution of coal macromolecular structures (Cao et al., 2007), determining the evolution of the pore structure of tectonic coals (Pan et al., 2015a). A general consensus view is that the evolution characteristics of the pore structure of TDCs in the low deformation stage (generally the brittle deformation stage, including calaclastic, granulated, and flake coals) differ from those in the high deformation stage (generally the ductile deformation stage, including scaly, powdery, wrinkle, and mylonitic coals). Pan et al. (2015b) observed that the content of transitional pores and pore interconnectivity increased at the brittle deformation stage, whereas the content of both micropores and transitional pore increased under ductile deformation with the surface pores developing irregularly. Song et al. (2017) found that the fractal dimension of pores greater than 100 nm in diameter was higher than that of pores less than 100 nm in diameter in primary and brittle deformed coals, but the relationship between the two reversed in wrinkle and mylonitic coals. Li et al. (2020) deemed that the pore volume and specific surface area of ultramicropores (below 1.1 nm in diameter) in TDCs decreased in the brittle deformed stage and then increased in the ductile deformed stage. Guo et al. (2017) revealed that the specific surface area and total pore volume of TDCs slightly decreased under the brittle deformation mechanism and then noticeably increased under ductile deformation. Wang et al. (2020a) believed that as the deformation degree of TDCs increased, the pore volume and specific surface area increased at the deformation stages of cataclastic and ganulitic coals and then remained stable at the stage of crumple coal. Those conclusions have deepened the understanding of pore structure evolution in TDCs; however, further discussions related to how the pore structure of the maceral in a single coal evolves in TDCs need to be held.
Most research studies on the pore structure of TDCs were conducted on whole coal samples that have not been stripped. However, the physical and chemical properties of different macerals in coal are different; for example, the hardness of inertinite is generally greater than that of vitrinite (Wang et al., 2020a). Under tectonic stress compression, the pore structure evolution of different macerals is bound to be different. In our previous studies, we found that the pore structure evolution of vitrinite and inertinite of different coal ranks is different (Wang et al., 2020b). As the degree of thermal metamorphism increases, the pore structure of vitrinite exhibits orderly and regular changes, whereas that of inertinite exhibits no changing regularities. This is because the inertinite group is not sensitive to thermal metamorphism. Therefore, the question arises that if the pore structure of the inertinite is not sensitive to thermal metamorphism, how does it react to tectonic stress? In addition, the macromolecular structure significantly affects the nanopore structure in coal, thus, comparing the nanopore structure evolution characteristics between vitrinite and inertinite with different macromolecular structures is necessary.
Therefore, this study separated the vitrinite and inertinite of tectonic coal with different deformation degrees and used CO2 adsorption and N2 adsorption/desorption experiments to evaluate the evolution of nanopore structures. 13C nuclear magnetic resonance (NMR) and X-ray diffraction (XRD) experiments were also conducted to obtain the macromolecular structures. Ultimately, the comparison of the nanopore evolution of vitrinite and inertinite in TDCs controlled by tectonic stress is revealed.
Samples and Experiments
Sample Preparation
To ensure the consistency of coal rank and composition of samples, a total of 10 TDCs (WTZ-1–WTZ-10) with an increasing deformation degree were collected from a single coal seam in the Wutongzhuang coal mine of the Hebei province, North China, including unaltered, cataclastic, porphyroclast, scaly, and powdery coals (based on Cao et al., 2002 classification of TDCs). It should be pointed out that the sampling coal seam didn’t experience magmatic intrusion or geological hydrotherm fluid, and all the samples experienced the same geological evolution after diagenetic stage but have different deformation degree because of the difference in structural location. Samples belongs to middle rank coal with the average vitrinite reflectance (Ro) being 0.99%.Vitrinite and inertinite were stripped from the vitrain and fusain of the collected samples by handpick. As a result, a single sample could be stripped as both a vitrinite (–V) as well as an inertinite sample (–I). For example, Sample WTZ-1 was stripped as Samples WTZ-1-V and WTZ-1-I. Each vitrinite or inertinite sample must be examined by optical microscopy to ensure the corresponding component of each sample exceeds 90%. All the sample information is listed in Table 1.
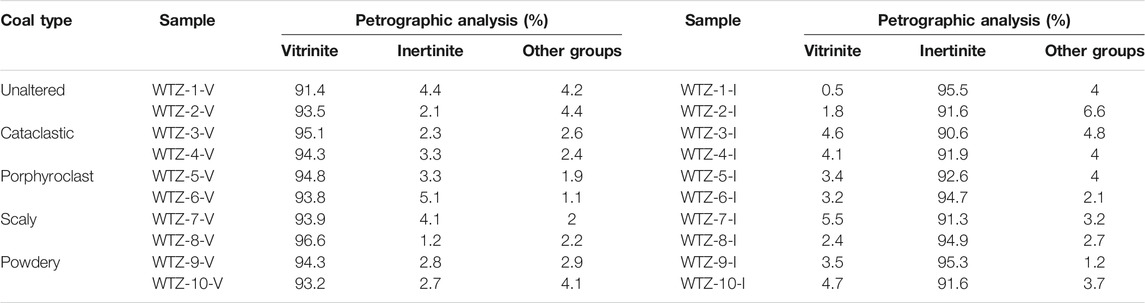
TABLE 1. Sample information.
At least 20 g of each sample was collected, and they were ground into particles of 60–80 mesh (0.20–0.25 mm in diameter). A weight of at least 5 g sample was prepared for the CO2 adsorption experiment and N2 adsorption/desorption experiment. Other samples were demineralized for use in the NMR and XRD experiments. The demineralization steps were as follows.
1) The coal samples were put into a volumetric flask, and 20 ml of water was poured into a beaker; then, 20 ml of hydrochloric acid was added into the beaker. After stirring the solution with a glass rod, the mixed liquor in the beaker was added into the volumetric flask to soak all the coal samples in the mixed liquor.
2) After sealing the volumetric flask with a tin foil, the mixture was placed into a thermostat for heating in a water bath for 45 min at a temperature of 60°C. Then, we took the volumetric flask out and poured it into the funnel for filtration. Coal samples were rinsed with distilled water three times so that the minerals could be washed off.
3) The coal sample was put into the volumetric flask again, and 40 ml of diluted hydrofluoric acid was added to it. After sealing the volumetric flask with tin foil, the mixture was placed again in the thermostat to heat in a water bath for 45 min at a temperature of 60°C
4) We poured the mixture into the funnel for filtration and rinsed the coal samples with distilled water three times. Then, the demineralized coal samples were placed in a drying box for drying.
CO2 Adsorption Experiment
Vitrinite and inertinite samples were tested using an instrument model of Autosorb-IQ-Station produced by Quantachrome Instruments. The samples were placed in a degassing device and heated at a temperature of 100–105°C for vacuum degassing. The CO2 adsorption experiment was conducted according to the set pressure point, and the data were recorded to obtain the adsorption curve. The micropore volume and surface area were calculated using the density functional theory.
N2 Adsorption/Desorption Experiments
According to the national standard SY/T6154-1995, the vitrinite and inertinite samples were tested using the gas sorption analyzer (Autosorb-IQ-Station). Using the “static volume method,” the N2 adsorption/desorption experiment was performed on the coal samples. The instrument system recorded the nitrogen adsorption amount at each pressure point and obtained the adsorption/desorption curves. The specific surface area was calculated according to the Brunauer–Emmett–Teller (BET) multimolecular layer adsorption formula; then, the pore volume and pore size distribution of the coal samples were computed using the Barrett–Joyner–Halenda (BJH) model.
13C NMR Experiment
A13C NMR experiment was conducted using a test equipment with the model of Agilent 600M. The experimental conditions were as follows. Experiments run in the double-resonance probe head, and 4-mm sample rotors were used. The magic-angle spinning speed was 8 KHz. The data were recorded by the probe in the Agilent DSX-300 spectrometer at ambient temperature. The radio frequency field strength of the 13C was 600 MHz.
XRD Experiment
The instrument model used for the XRD experiment was MSXD-3 produced by Instruments Inc. Beijing, China. The experimental conditions were as follows: Cu Kα radiation, voltage of 40 kV, current of 40 mA, step size of 0.01, and test range of 10–90°. The scanning speed was 5°/min, and the X-ray wavelength was 0.154,056 nm.
In the typical XRD spectrum of coal, there are two obvious peaks with the values being approximately 25–43° (Ergun et al., 1960; Saikia et al., 2007; Pan et al., 2019), presenting the (002) and (100) peaks of the aromatic layers, respectively. After obtaining the XRD spectrum, the PeakFit software was used to perform peak fitting for the (002) and (100) peaks in the ranges of 10–35° and 35–50°, respectively. The aromatic interlayer spacing (d002), average crystallite stacking height (Lc), the average diameter of coal crystallites (La), and the average number of crystallites in a stack (Nave) can be calculated using the following formulas (Iwashita et al., 2004; Okolo et al., 2015; Li et al., 2017):
λ is the wavelength of the X-ray with the value being 0.154,056 nm; θ002 and θ100 are the diffraction angles corresponding to the (002) and the (100) peaks, respectively (°); β002 and β100 are the half-peak breadths corresponding to the (002) and (100) peaks, respectively, rad; K1 and K2 are crystallite shape factors, K1 = 0.94 and K2 = 1.84.
Results
CO2 Adsorption Experiment Results
The CO2 adsorption experiment is mainly used to measure micropores less than 2 nm in size (Wang and Long, 2020). The measured pore size range of the CO2 adsorption experiment in this study is 0.3–1.4 nm. The adsorption curves obtained are illustrated in Figure 1. The maximum absorption volume range of vitrinite is 6.22–10.14 cc/g (Figure 1A), whereas that of inertinite is 5.01–9.90 cc/g (Figure 1B); therefore, the maximum adsorption capacities of the two macerals do not differ considerably from each other. However, the adsorption curves of vitrinite and inertinite stripped from the same coal sample are different, denoting that the pore structure of vitrinite is far different from that of inertinite.
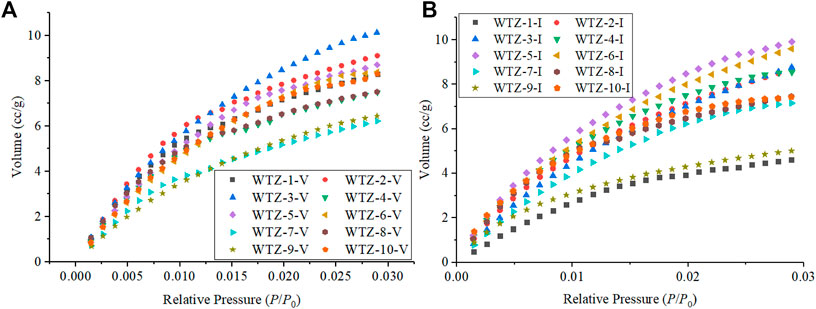
FIGURE 1. CO2 adsorption curves of vitrinite (A) and inertinite (B).
The calculated micropore volumes and micropore specific surface areas of vitrinite and inertinite are listed in Table 2. The micropore volume of vitrinite ranges from 16.758 × 10⁻³ to 30.153 × 10⁻³ cc/g with a mean of 21.586 × 10⁻³ cc/g, whereas that of inertinite is between 15.740 × 10⁻³ and 30.527 × 10⁻³ cc/g with a mean of 23.240 × 10⁻³ cc/g, denoting that the micropore volume of vitrinite is generally close to that of inertinite. The micropore specific surface area of vitrinite ranges from 64.296 to 99.079 m2/g with an average of 79.651 m2/g, which is close to that of inertinite (from 49.963 to 101.893 m2/g with an average of 77.062 m2/g).
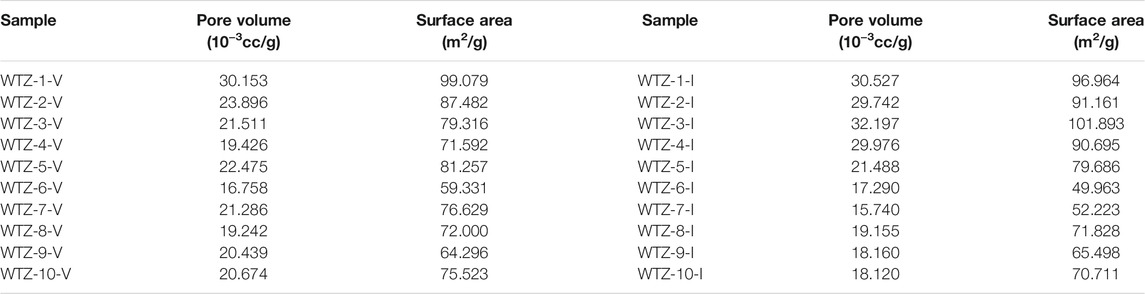
TABLE 2. Results of CO2 adsorption experiments.
N2 Adsorption/Desorption Experiment Results
The N2 adsorption/desorption experiment is mainly used to measure the mesopore (2–50 nm in size). The mesopore size range that can be measured in this paper is 2–140 nm. The adsorption/desorption curves are shown in Figure 2. The maximum nitrogen gas adsorption capacity of inertinite, as Figure 2B shows, is much higher than that of vitrinite (Figure 2A). With respect to the curve shape, the desorption/desorption curves of vitrinite are considerably different from those of inertinite. The curve shape of vitrinite is not smooth, and there is a sharp decrease in the desorption curve, indicating that there are more bottleneck pores in vitrinite than in inertinite (Wang et al., 2017). The adsorption curves of inertinite are relatively smoother than that of vitrinite, and the adsorption curve almost coincides with the desorption curve, indicating that there are relatively more one-side-closed and two-side-opened pores in inertinite than that in vitrinite.
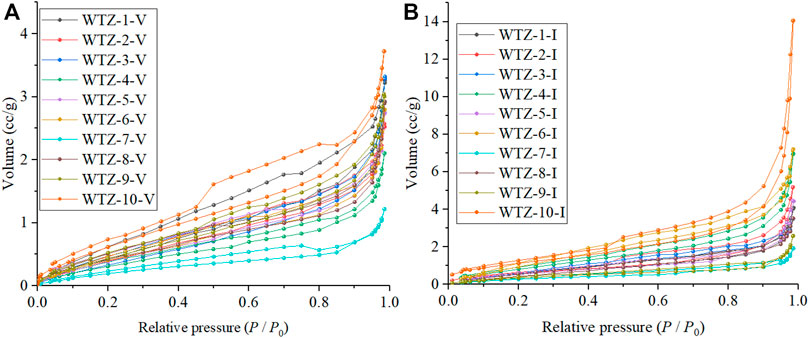
FIGURE 2. N2 adsorption/desorption curves of vitrinite (A) and inertinite (B).
The calculated N2 adsorption/desorption experiment results are listed in Table 3. For vitrinite, the total pore volume ranges from 1.733 × 10⁻³ to 5.655 × 10⁻³ cc/g with a mean of 3.952 × 10⁻³ cc/g, whereas the mesopore volume ranges from 1.314 × 10⁻³ to 4.662 × 10⁻³ cc/g with a mean of 3.047 × 10⁻³ cc/g; the BET specific surface area is between 1.006 and 2.967 m2/g with an average of 1.991 m2/g, and the BJH pore surface area ranges from 0.641 to 3.017 m2/g with an average of 1.633 m2/g. For inertinite, the total pore volume ranges from 1.407 × 10⁻³ to 21.755 × 10⁻³ cc/g with a mean of 7.068 × 10⁻³ cc/g and the mesopore volume ranges from 0.796 × 10⁻³ to 14.616 × 10⁻³ cc/g with a mean of 4.989 × 10⁻³ cc/g, which is higher than that of vitrinite; furthermore, the BET specific surface area is between 1.083 and 4.195 m2/g with an average of 4.989 m2/g and the BJH pore surface area ranges from 0.473 to 5.276 m2/g with an average of 2.248 m2/g, which is also higher than that of vitrinite.

TABLE 3. Result of N2 adsorption/desorption experiments.
In addition, for both vitrinite and inertinite, the micropore volume and surface area are much higher than the mesopore volume and surface area according to the comparison results of Table 2 and Table 3.
13C NMR Experiment
The obtained spectra curves of the 13C NMR experiments are presented in Figure 3. Based on the literature, the NMR spectrum of coal can be divided into three parts (Li, 2015; Liu et al., 2019b): aliphatic carbons (0–90 ppm), aromatic carbons (90–165 ppm), and carbonyl or carboxyl carbons (165–240 ppm). The spectrum curves of the aromatic carbons of vitrinite (Figure 3A) and inertinite (Figure 3A) have basically unimodal characteristics, whereas those of the aliphatic carbons have bimodal characteristics. As the degree of coal deformation increases, the aliphatic carbon peak gradually becomes flat, whereas the peak shape of the aromatic carbon does not change considerably, indicating that the deformation of TDCs has a significantly stronger influence on aliphatic carbons than on aromatic carbons.

FIGURE 3. NMR spectra of vitrinite (A) and inertinite (B).
The NMR spectra of samples are analyzed using the curve-fitting method (Li et al., 2017). This study adopts a widely used classification of chemical shifts to represent different functional groups of coal (Suggate and Dickinson, 2004; Erdenetsogt et al., 2010; Malumbazo et al., 2011): fal (aliphatic carbons, 0–90 ppm), fa (aromatic carbons, 90–165 ppm), faH (protonated aromatic carbons, 100–129 ppm), faB (aromatic bridgehead carbons, 129–135 ppm), faS (alkylation aromatic carbons, 135–150 ppm), and faP (nonprotonated aromatic carbon constituted by phenolic, 150–165 ppm) have been calculated, and fa/fal is also computed to reveal the enrichment degree of aromatic carbons to aliphatic carbons.
The calculated parameters representing the functional groups of coal are presented in Table 4 and Figure 4. For both vitrinite and inertinite, the fal remains stable from the deformation degree of unaltered to cataclastic coal and starts to decrease at porphyroclast coal, indicating that the aliphatic carbons distinctly reduce at the porphyroclast coal; the fa of vitrinite increases from unaltered to powdery coal (Figure 4A), whereas that of inertinite increases from unaltered coal but is stable from scaly to powdery coal (Figure 4B), implying that it is difficult to alter the aromatic carbon of inertinite compared with that of vitrinite. The faH of vitrinite increases from porphyroclast to powdery coal, whereas that of inertinite exhibits no obvious regularities related to the deformation degree, suggesting that the protonated aromatic carbons of vitrinite would be greater in number from porphyroclast to powdery coal. The faB, faS, and faP of both vitrinite and inertinite have no relations to deformation degree of TDCs. The fa fal of both vitrinite and inertinite significantly increases from unalterted to powdery coal. This clearly shows that the tectonic stress can reduce the aliphatic carbons and increase the aromatic carbons of coal.

TABLE 4. Results of the NMR parameters.
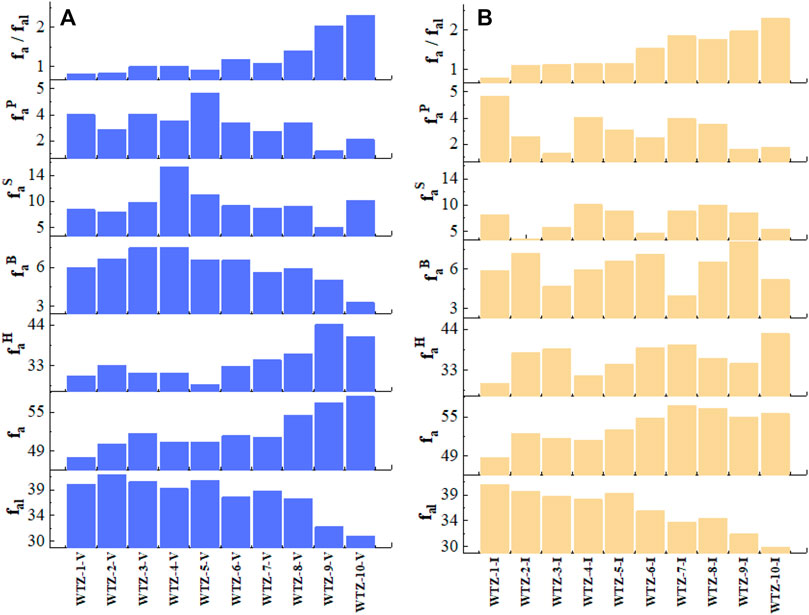
FIGURE 4. NMR structure parameters of vitrinite (A) and inertinite (B).
XRD Results
The spectra obtained by the XRD experiment are presented in Figure 5. As the degree of TDC deformation increases, the shape of peak 002 in both vitrinite (Figure 5A) and inertinite (Figure 5B) becomes sharper, whereas peak 100 does not change considerably. The calculated parameters mentioned in Section 2.5 are shown in Figure 6. It can be seen that independently of vitrinite or inertinite, as the deformation degree of TDC increases, d002 gradually decreases, indicating that tectonic stress diminishes the aromatic interlayer space. In addition, Lc and Nave gradually increase, indicating that the tectonic stress causes the average crystallite stacking height and the average number of crystallites in a stack to grow. However, La does not exhibit an obvious regularity as the deformation degree increases. Furthermore, the parameters of vitrinite and inertinite differ: the changes in Lc and Nave of the vitrinite remain stable (Figure 6A), whereas those of the inertinite exhibit greater variability (Figure 6B).
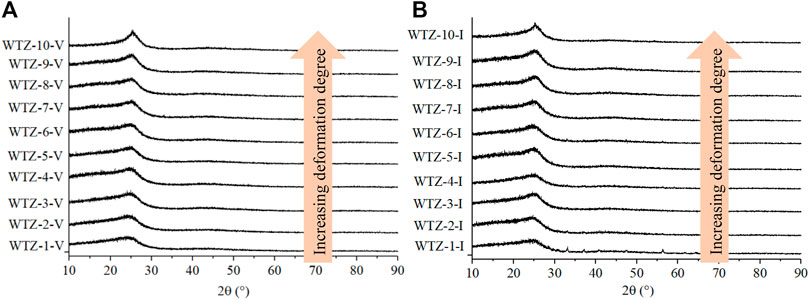
FIGURE 5. XRD spectrogram of vitrinite (A) and inertinite (B).
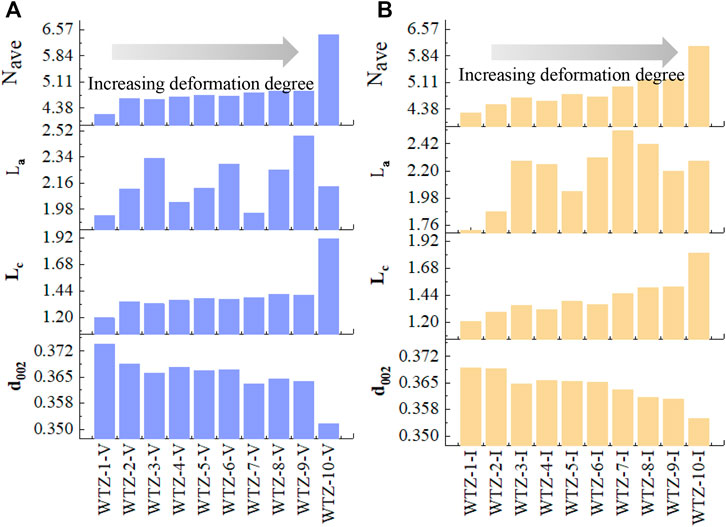
FIGURE 6. XRD parameters of vitrinite (A) and inertinite (B).
Discussion
Pore Structure Evolution of Vitrinite and Inertinite at Different Stages of TDCs
According to Sections 3.1 and Section 3.2, the pore structure evolution characteristics of vitrinite and inertinite are shown as follows.
1) For mesopores, from unaltered to powdery coal, the total pore and mesopore volume of vitrinite slowly decrease and then increase at the stage of scaly coal, whereas those of inertinite fluctuate from unaltered to porphyroclast coal and then increase at the stage of scaly coal (Figure 7A). In addition, the mesopore and total pore volume of inertinite are generally higher than those of vitrinite (except Sample WTZ-6). Whether in accordance with the BET or BJH model, the surface area value of vitrinite slowly decreases from unaltered to porphyroclast coal and then increases from scaly to powdery coal, whereas that of inertinite increases at cataclastic coal, decreases at porphyroclast coal, and then increases from scaly to powdery coal (Figure 7B).
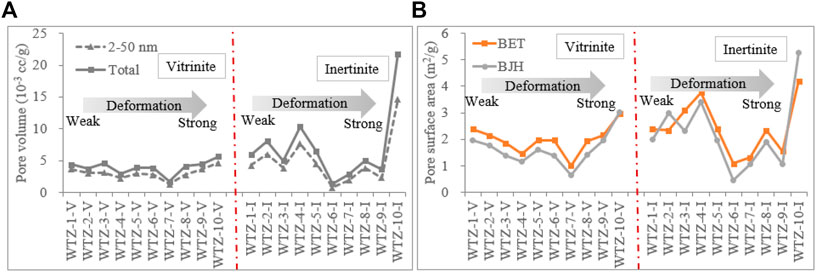
FIGURE 7. Pore volume (A) and surface area (B) of vitrinite and inertinite.
2) For micropores, the micropore volume and specific surface area of vitrinite are different from those of inertinite (Figure 8). 1) The micropore volume of vitrinite gradually decreases as the deformation degree of TDC increases (Figure 8A), whereas that of inertinite decreases since the deformation degree of porphyroclast coal (WTZ-5) as Figure 8B shows; thus, in the deformation stage of unaltered and cataclastic coal, the pore volume of the inertinite does not change considerably. This also reduces the difference in the pore volume between vitrinite and inertinite as the deformation degree of TDC increases. 2) The micropore volume of inertinite is higher than that of vitrinite from unaltered and cataclastic coal (WTZ-1–WTZ-4); however, vitrinite’s micropore volume exceeds inertinite’s micropore volume since the deformation degree of porphyroclast coal (WTZ-5–WTZ-10). 3) The micropore specific surface area of vitrinite gradually decreases as the deformation degree of TDC increases and that of inertinite also gradually decreases starting from the stage of porphyroclast coal (WTZ-5). The micropore specific surface area of vitrinite is larger than that of inertinite. In the stage of unaltered and cataclastic coal, the micropore specific surface area of inertinite exhibits undulating changes; however, the changes are insignificant.
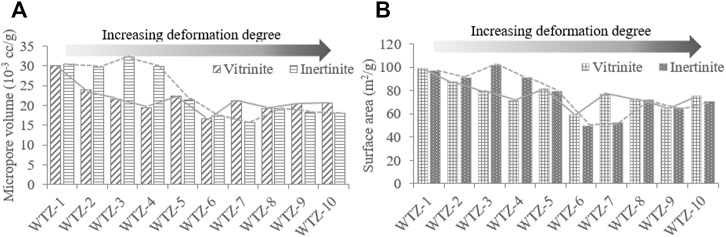
FIGURE 8. Micropore volume and surface area of vitrinite (A) and inertinite (B).
Pore Structure Controlled by Macromolecular Structure Evolution
1) Mesopore structure determined by N2 adsorption/desorption experiments
The N2 experiment mainly determines the mesopore (2–50 nm) structure. Based on the NMR and N2 adsorption/desorption experiment results, with the increasing fa/fal, the mesopore volume and surface area of vitrinite first decreases and then increases, whereas those of inertinite exhibit no obvious regularities (Figure 9).
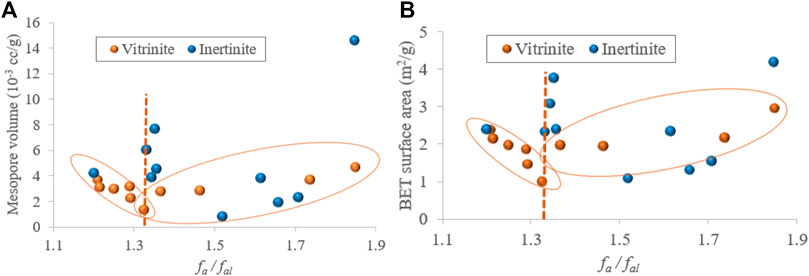
FIGURE 9. Relationships between the fa/fal and mesopore volume (A), fa/fal and BET surface area (B).
Based on the results of the XRD and N2 adsorption/desorption experiments, there are no obvious relationships between the mesopore volume and macromolecular structure parameters (d002, Lc, La, and Nave) of inertinite. For vitrinite, the mesopore decreases as Lc (Figure 10B) and Nave (Figure 10D) increase within a certain range (Lc < 1.4 and Nave < 4.8, respectively) and increases when d002 > 0.365 and La > 2.2 (Figures 10A,B). Therefore, it can be concluded that the macromolecular structure evolution does not affect the mesopore structure of inertinite but weakly influences the mesopore structure of vitrinite at a certain range.
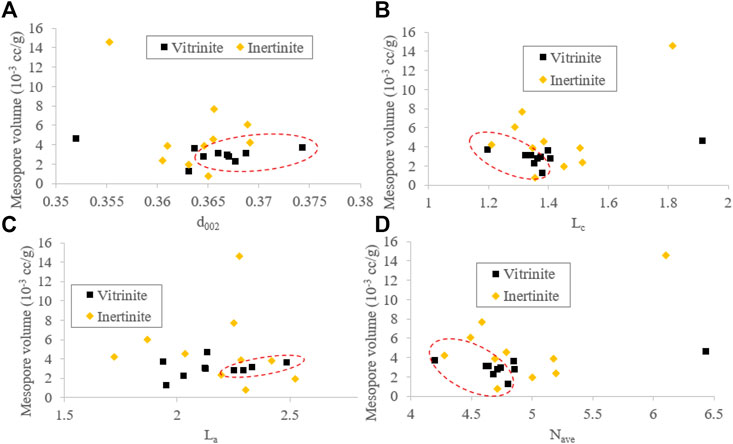
FIGURE 10. Relationships between the mesopore volume and XRD parameters (d002 (A), Lc (B), La (C), and Nave (D)).
2) Micropore structure determined by CO2 adsorption/desorption experiments.
The micropore volume and micropore surface area of both vitrinite and inertinite first decrease and then increase as fa/fal increases (Figure 11); however, they still slightly differ in the following: the micropore volume and micropore surface area of vitrinite gradually decrease and then increase, whereas those of inertinite first remain stable, sharply decrease, and then gradually increase.
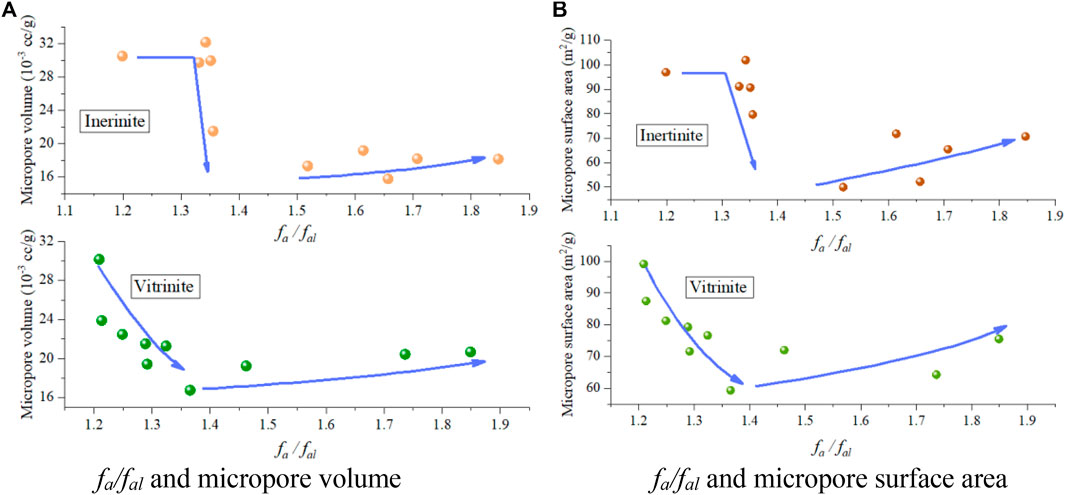
FIGURE 11. fa/fal and micropore structures. fa/fal and micropore volume (A), fa/fal and micropore surface area (B).
The correlation analysis between the XRD results and micropore volume (Figure 12) show that 1) with the decreasing d002 caused by the coal deformation, the micropore volume of vitrinite first decreases and then increases at the point of d002 being approximately 0.365, whereas that of inertinite remains nearly unchanged at first, then sharply drops, and increases when the d002 is less than 0.364 (Figure 12A); 2) as Lc increases, the micropore volume of vitrinite first decreases and then increases when Lc exceeds 1.4, whereas that of inertinite also remains unchanged at first, drops sharply, and then increases when Lc exceeds 1.4 (Figure 12B); 3) for both vitrinite and inertinite, there are no obvious relationships between La and the micropore volume (Figure 12C); 4) as Nave increases, the micropore volume of vitrinite first decreases and then increases when Nave exceeds 4.8, whereas that of inertinite first remains unchanged, then significantly drops, and increases when Nave exceeds 4.8 (Figure 12D). In summary, as the deformation degree of TDCs increases, the micropore volume of both vitrinite and inertinite decreases and then increases. However, the micropore of inertinite remains nearly unchanged, sharply drops, and then slowly increases, whereas that of vitrinite decreases and then increases.
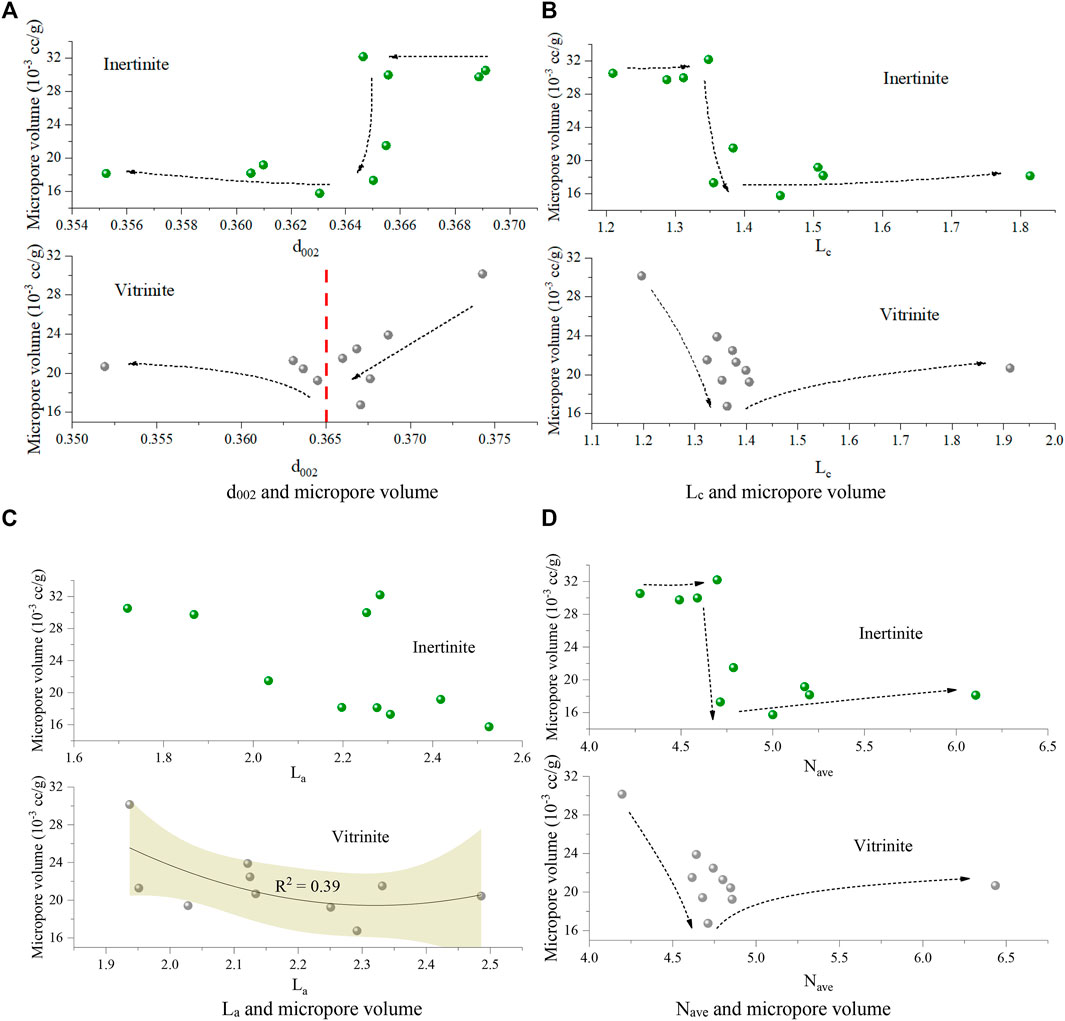
FIGURE 12. Relationships between micropore volume and XRD parameters d002 and micropore volume (A) Lc and micropore volume (B) La and micropore volume (C) Nave and micropore volume (D).
The Mechanisms of Pore Structure Evolution in TDCs
As presented in Section 4.1 and Section 4.2, only the mesopores of vitrinite will first decrease and then increase as the deformation degree increases, which is controlled by the evolution of fa/fal, and, to a certain degree, the mesopore evolution could also be affected by d002, Lc, and Nave. However, the inertinite mesopore has no obvious relations with the deformation degree. The micropore volumes of both vitrinite and inertinite first decrease and then increase with the increasing deformation degree of TDC, which are also controlled by fa/fal, d002, Lc, La, and Nave.
When coal is subjected to strong deformation by tectonic movements, it exhibits a gradual decrease in hardness on the macroscopic scale (Wang et al., 2020a). On the microscopic scale, the aliphatic carbon in the basic structural unit (BSU) of the macromolecular structure in coal decreases and the aromatic carbon increases. In the deformation process, d002 gradually decreases, causing the micropore volume of the coal to gradually decrease (Figure 13). However, the Lc and Nave increase, causing the micropore volume to increase (Figure 13). Based on the experimental results, from unaltered coal to porphyroclast coal, i.e., Samples WTZ-1–WTZ-6, the decrease in the micropore volume caused by decreased d002 values is higher than the increase in the micropore volume caused by increased Lc and Nave values.
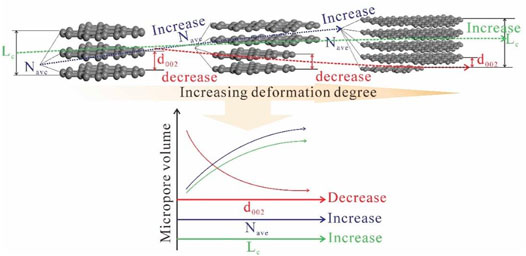
FIGURE 13. Micropore variation with macromolecular structure evolution
The pores in the BSU of the macromolecular structure in coal are less than 2 nm in size (Liu et al., 2019a). Therefore, the micropores will inevitably exhibit regularity as the macromolecular structure evolves. However, mesopores do not mainly occur in the BSU but exist between BSUs, which is related to the order degree of the BSU (Liu et al., 2019b). The order degree of the BSU is determined by the coal metamorphism degree, therefore, the evolution of mesopore volume is also affected by the macromolecular structure changes as Figure 9 shows.
Conclusion
In this study, the TDC samples of different deformation degrees have been stripped into vitrinite and inertinite samples to compare the nanopore structure evolution in the deformation process. CO2 adsorption and N2 adsorption/desorption experiments were applied to study the nanopore structure, whereas 13C NMR and XRD experiments were conducted to obtain the macromolecular structures of coal. The main conclusions can be drawn as follows.
1) For mesopores, the pore volume of vitrinite slowly decreases and then increases at the stage of scaly coal, whereas that of inertinite fluctuates with no obvious regularities.
2) For micropores, the pore volume of vitrinite deceases as the deformation degree increases, whereas that of inertinite decreases from the deformation degree of porphyroclast coal and slightly changes from unaltered to cataclastic coal.
3) The macromolecular structures of both vitrinite and inertinite can be altered by tectonic stress. As the deformation degree increases, the aliphatic carbons decrease, the aromatic carbons increase, and the aromatic interlayer spacing also decreases; conversely, the crystallite stacking height and the average number of crystallites in a stack increase.
4) In the deformation process of coal, d002 decreases, resulting in a decrease in the micropore volume; however, Lc and Nave increase, leading to an increase in the micropore volume. Therefore, the micropore decreases and then increases as the deformation degree of coal increases.
Data Availability Statement
The original contributions presented in the study are included in the article/Supplementary Material, further inquiries can be directed to the corresponding author.
Author Contributions
Original draft preparation, AW; Supervision, DC; Resources, YW; Methodology, LD and MZ.
Funding
This study was financially supported by the National Natural Science Foundation of China (Nos. 41902170, 42072197, 41972174), and Science and Technology Innovation Project of Higher Education Institutions in Shanxi Province in 2020 (2020L0730).
Conflict of Interest
The authors declare that the research was conducted in the absence of any commercial or financial relationships that could be construed as a potential conflict of interest.
Publisher’s Note
All claims expressed in this article are solely those of the authors and do not necessarily represent those of their affiliated organizations, or those of the publisher, the editors and the reviewers. Any product that may be evaluated in this article, or claim that may be made by its manufacturer, is not guaranteed or endorsed by the publisher.
References
Cao, D., Li, X., and Zhang, S. (2007). Influence of Tectonic Stress on Coalification: Stress Degradation Mechanism and Stress Polycondensation Mechanism. Sci. China Ser. D 50 (01), 43–54. doi:10.1007/s11430-007-2023-3
Cao, D., Wang, A., Ning, S., Li, H., Guo, A., Chen, L., et al. (2020). Coalfield Structure and Structural Controls on Coal in China. Int. J. Coal Sci. Technol. 7 (2), 220–239. doi:10.1007/s40789-020-00326-z
Cao, D. Y., Zhang, S. R., and Ren, D. Y. (2002). The Influence of Structural Deformation on Coalification: a Case Study of Carboniferous Coal Measures in the Northern Foothills of the Dabie Orogenic belt. Geol. Rev. 48 (3), 313–317. doi:10.16509/j.georeview.2002.03.015
Erdenetsogt, B.-O., Lee, I., Lee, S. K., Ko, Y.-J., and Bat-Erdene, D. (2010). Solid-state C-13 CP/MAS NMR Study of Baganuur Coal, Mongolia: Oxygen-Loss during Coalification from lignite to Subbituminous Rank. Int. J. Coal Geology. 82, 37–44. doi:10.1016/j.coal.2010.02.005
Ergun, S., Mentser, M., and O'Donnell, H. J. (1960). Three-Dimensional X-ray Reflections from Anthracite and Meta-Anthracite. Science 132 (3436), 1314–1316. doi:10.1126/science.132.3436.1314
Guo, X., Huan, X., and Huan, H. (2017). Structural Characteristics of Deformed Coals with Different Deformation Degrees and Their Effects on Gas Adsorption. Energy Fuels 31, 13374–13381. doi:10.1021/acs.energyfuels.7b02515
Iwashita, N., Park, C. R., Fujimoto, H., Shiraishi, M., and Inagaki, M. (2004). Specification for a Standard Procedure of X-ray Diffraction Measurements on Carbon Materials. Carbon 42, 701–714. doi:10.1016/j.carbon.2004.02.008
Li, W., Jiang, B., Moore, T. A., Wang, G., Liu, J.-g., and Song, Y. (2017). Characterization of the Chemical Structure of Tectonically Deformed Coals. Energy Fuels 31, 6977–6985. doi:10.1021/acs.energyfuels.7b00901
Li, W. (2015). “Study of Coal Vitrinite Macromolecular Structure Evolution and Control Mechanism of the Energy Barrier in Hydrocarbon Generation,” (Jiangsu Province, China: China University of Mining & Technology). Doctoral Dissertation.
Li, Y., Song, D., Liu, S., and Pan, J. (2020). Characterization of Ultramicropores and Analysis of Their Evolution in Tectonically Deformed Coals by Low-Pressure CO2 Adsorption, XRD, and HRTEM Techniques. Energy Fuels 34, 9436–9449. doi:10.1021/acs.energyfuels.0c01403
Liu, Y., Yao, S. P., and Tang, Z. Y. (2019a). Characterization of Nanopore of Different Metamorphic Coals by SAXS. Geol. J. China universities 25 (01), 108–115. doi:10.16108/j.issn1006-7493.2018072
Liu, Y., Zhu, Y., and Chen, S. (2019b). Effects of Chemical Composition, Disorder Degree and Crystallite Structure of Coal Macromolecule on Nanopores (0.4-150 Nm) in Different Rank Naturally-Matured Coals. Fuel 242, 553–561. doi:10.1016/j.fuel.2019.01.095
Malumbazo, N., Wagner, N. J., Bunt, J. R., Van Niekerk, D., and Assumption, H. (2011). Structural Analysis of Chars Generated from South African Inertinite Coals in a Pipe-Reactor Combustion Unit. Fuel Process. Techn. 92, 743–749. doi:10.1016/j.fuproc.2010.09.009
Okolo, G. N., Neomagus, H. W. J. P., Everson, R. C., Roberts, M. J., Bunt, J. R., Sakurovs, R., et al. (2015). Chemical-structural Properties of South African Bituminous Coals: Insights from Wide Angle XRD-Carbon Fraction Analysis, ATR-FTIR, Solid State 13 C NMR, and HRTEM Techniques. Fuel 158, 779–792. doi:10.1016/j.fuel.2015.06.027
Pan, J., Lv, M., Hou, Q., Han, Y., and Wang, K. (2019). Coal Microcrystalline Structural Changes Related to Methane Adsorption/desorption. Fuel 239, 13–23. doi:10.1016/j.fuel.2018.10.155
Pan, J., Niu, Q., Wang, K., Shi, X., and Li, M. (2016). The Closed Pores of Tectonically Deformed Coal Studied by Small-Angle X-ray Scattering and Liquid Nitrogen Adsorption. Microporous Mesoporous Mater. 224, 245–252. doi:10.1016/j.micromeso.2015.11.057
Pan, J., Zhao, Y., Hou, Q., and Jin, Y. (2015a). Nanoscale Pores in Coal Related to Coal Rank and Deformation Structures. Transp Porous Med. 107 (2), 543–554. doi:10.1007/s11242-015-0453-5
Pan, J., Zhu, H., Hou, Q., Wang, H., and Wang, S. (2015b). Macromolecular and Pore Structures of Chinese Tectonically Deformed Coal Studied by Atomic Force Microscopy. Fuel 139, 94–101. doi:10.1016/j.fuel.2014.08.039
Saikia, B. K., Boruah, R. K., and Gogoi, P. K. (2007). FT-IR and XRD Analysis of Coal from Makum coalfield of Assam. J. Earth. Syst. Sci. 116 (6), 575–579. doi:10.1007/s12040-007-0052-0
Song, Y., Jiang, B., and Liu, J. G. (2017). Nanopore Structural Characteristics and Their Impact on Methane Adsorption and Diffusion in Low to Medium Tectonically Deformed Coals: Case Study in the Huaibei Coal Field. Energy & Fuels 31, 6711–6723. doi:10.1021/acs.energyfuels.7b00512
Suggate, R. P., and Dickinson, W. W. (2004). Carbon NMR of Coals: the Effects of Coal Type and Rank. Int. J. Coal Geology. 57, 1–22. doi:10.1016/s0166-5162(03)00116-2
Wang, A., Cao, D., Wei, Y., and Liu, Z. (2020a). Macromolecular Structure Controlling Micro Mechanical Properties of Vitrinite and Inertinite in Tectonically Deformed Coals-A Case Study in Fengfeng Coal Mine of Taihangshan Fault Zone (North China). Energies 13, 6618. doi:10.3390/en13246618
Wang, A., Cao, D., Wei, Y., Nie, J., and Qin, R. (2020b). Comparison of Nanopore Evolution in Vitrinite and Inertinite in Coalbed Methane Reservoirs during Coalification. J. Nat. Gas Sci. Eng. 78, 103289. doi:10.1016/j.jngse.2020.103289
Wang, A., Wei, Y., Yuan, Y., Li, C., Li, Y., and Cao, D. (2017). Coalbed Methane Reservoirs' Pore-Structure Characterization of Different Macrolithotypes in the Southern Junggar Basin of Northwest China. Mar. Pet. Geology. 86, 675–688. doi:10.1016/j.marpetgeo.2017.06.028
Wang, L., and Long, Z. (2020). Evolutions of CO2 Adsorption and Nanopore Development Characteristics during Coal Structure Deformation. Appl. Sci. 10, 4997. doi:10.3390/app10144997
Yao, S., Jiao, K., Zhang, K., Hu, W., Ding, H., Li, M., et al. (2011). An Atomic Force Microscopy Study of Coal Nanopore Structure. Chin. Sci. Bull. 56 (25), 2706–2712. doi:10.1007/s11434-011-4623-8
Zhang, N. Y., and Yao, S. P. (2021). Nanopore Structure and Surface Roughness in Brittle Tectonically Deformed Coals Explored by Atomic Force Microscopy. Coalfield Geology. Exploration 1-11. Available at:http://kns.cnki.net/kcms/detail/61.1155.P.20211014.1104.002.html.
Keywords: vitrinite, inertinite, nanopore structure, macromolecular structure, tectonically deformed coals
Citation: Wang A, Li J, Cao D, Wei Y, Ding L and Zhao M (2022) Comparison of Nanopore Structure Evolution in Vitrinite and Inertinite of Tectonically Deformed Coals: A Case Study in the Wutongzhuang Coal Mine of Hebei Province, North China. Front. Earth Sci. 10:822338. doi: 10.3389/feart.2022.822338
Received: 30 November 2021; Accepted: 17 January 2022;
Published: 16 February 2022.
Edited by:
Yiwen Ju, University of Chinese Academy of Sciences, ChinaCopyright © 2022 Wang, Li, Cao, Wei, Ding and Zhao. This is an open-access article distributed under the terms of the Creative Commons Attribution License (CC BY). The use, distribution or reproduction in other forums is permitted, provided the original author(s) and the copyright owner(s) are credited and that the original publication in this journal is cited, in accordance with accepted academic practice. No use, distribution or reproduction is permitted which does not comply with these terms.
*Correspondence: Daiyong Cao, Y2R5Y3VtdGJAMTYzLmNvbQ==