 Nikita N. Avdievitch
 Jeffrey A. Coe
- U.S. Geological Survey, Geologic Hazards Science Center, Golden, CO, United States
Submarine mass wasting events have damaged underwater structures and propagated waves that have inundated towns and affected human populations in nearby coastal areas. Susceptibility to submarine landslides can be pronounced in degrading cryospheric environments, where existing glaciers can provide high volumes of sediment, while cycles of glaciation and ice-loss can damage and destabilize slopes. Despite their contribution to potential tsunami hazard, submarine landslides can be difficult to study because of limited access and data collection in underwater environments. Here we present a method to quantify and map the submarine landslide susceptibility of sediment-covered slopes in Glacier Bay, Glacier Bay National Park and Preserve, Alaska, using multibeam-sonar bathymetric digital elevation models (DEMs) and historical maps of glacial extents over the last ∼250 years. After mapping an inventory of >7,000 landslide scarps in submarine sediments, we filtered the inventory by size to account for limitations in DEM resolution and spatial scales relevant to tsunami hazards. We then assessed landslide concentration, accounting for the age of the initial exposure of submarine slopes by deglaciation. We found a positive correlation between landslide concentration and deglaciation age, which we interpreted as a mean landslide accumulation rate over the period of record. Local deviations from this rate indicated differences in susceptibility. Additionally, we accounted for some of the effect of material and morphometric properties by estimating the submarine bedrock-sediment distribution using a morphometric model and assessing the relationship between slope angle and landslide incidence. Finally, we supplemented our susceptibility assessment with a geomorphic component based on the propensity of active submarine fans and deltas to produce landslides. Thus, our map of submarine landslide susceptibility incorporates three components: age-adjusted landslide concentration, slope angle, and geomorphology. We find that areas of mapped high susceptibility correlate broadly with areas of high sediment input and availability, locations of fans and deltas, and steep sediment-covered glacially carved fjords and troughs. Areas of high submarine landslide susceptibility in Glacier Bay moderately correspond with locations of known high-hazard subaerial slopes, but more research on submarine and subaerial landslides in degrading cryospheric environments would be beneficial to better understand landslide and tsunami hazards.
Introduction
Submarine mass-wasting events can initiate from both above (subaerial-to-submarine landslides) and below water (submarine landslides) and can damage underwater structures such as communication lines (e.g., Heezen et al., 1959; L’Heureux et al., 2014; Pope et al., 2017) or cause tsunamis (also known as displacement waves, Hermanns et al., 2013) that affect infrastructure at and near coastlines (e.g., Bardet et al., 2003; Haeussler et al., 2014; Suleimani et al., 2015; Higman et al., 2018; Coe et al., 2019; Dai et al., 2020). Potential tsunamigenic landslides include rockslides, rock avalanches, and slides in unconsolidated marine sediment. In paraglacial landscapes such as the fjords and mountain slopes adjacent to tidewater glaciers, cycles of glacial advance and retreat (e.g., Fritz, 2001; Grämiger, et al., 2017; Higman et al., 2018; Dai et al., 2020) and permafrost degradation (Bottino et al., 2002; Coe et al., 2018; Patton et al., 2019; Bessette-Kirton and Coe, 2020; Svennevig et al., 2020; Hilger et al., 2021) can damage and destabilize slopes and increase landslide potential (Evans and Clague, 1994; Ballantyne, 2002; McColl and Davies, 2013; Kos et al., 2016; Cody et al., 2020). In these regions, fjords can also amplify tsunamis in their narrow enclosures and produce larger waves than would similar events in open water (e.g., Fritz, 2001; Geist et al., 2003; Okal and Synolakis, 2003; Harbitz et al., 2014; Yavari-Ramshe and Ataie-Ashtiani, 2016). If these sheltered waterways host human populations or marine activities, they are especially vulnerable to damage from tsunami waves. To mitigate landslide risk in paraglacial coastal environments, establishing, maintaining, and studying inventories of both subaerial and submarine landslides is critical for understanding the magnitude and frequency of past events. These inventories are an important step in identifying areas prone to future slope failure (landslide susceptibility) and possible tsunami effects (e.g., Hermanns et al., 2012; Zaniboni et al., 2021).
Although subaerial landslides are generally easier to observe, submarine landslides are significant and often underrepresented sources of hazard for coastal areas (Margottini et al., 2013; Brothers et al., 2016; Normandeau et al., 2019a). To assess the frequency characteristics of submarine landslides, high-quality multitemporal landslide inventories from repeat bathymetric or geophysical surveys are needed. Recent work using repeat bathymetry has highlighted the importance of these data in understanding submarine processes (e.g., Smith et al., 2005; Mazières et al., 2014; Stacey et al., 2019; Heijnen et al., 2020) and tying submarine landslides to their triggering mechanisms (Mountjoy et al., 2018; Normandeau et al., 2019b; Normandeau et al., 2020; Normandeau et al., 2021). However, because multitemporal submarine surveys are uncommon, recent or new submarine landslides can go unnoticed, and both their triggers and underlying causes are difficult to identify (Masson et al., 2006; Fan et al., 2020). Furthermore, many common subaerial slope instability factors such as weather and land use are largely irrelevant to considerations of submarine landslide susceptibility, while others such as sediment thicknesses are virtually impossible to map regionally without expensive underwater surveys (e.g., core samples or seismic lines). Additional complications include the high mobility of submarine landslides, which make it difficult to identify landslide deposits and failure types in submarine survey data (Locat and Lee, 2002; De Blasio et al., 2006). As a result, past studies have focused on assessing individual submarine landslides or slopes for underlying causes or triggers (e.g., McAdoo et al., 2000; Hansen et al., 2013; L’Heureux et al., 2013; MacKillop et al., 2018; Brothers et al., 2019; Fan et al., 2020). However, predictive maps and broader regional assessments of susceptibility are a relatively new endeavor in submarine geoscience. Recent submarine landslide susceptibility assessments have focused on continental margin (e.g., Collico et al., 2020; Innocenti et al., 2021) or lake (e.g., Strasser et al., 2007; Strasser et al., 2011) environments, rather than on fjords and bays in glaciated or recently deglaciated terrain. However, with continued availability of high-resolution bathymetry, more work is being done to assess the numerous geohazards in glaciated marine settings (e.g., morphological analyses tied to tsunamigenic landslides, Stacey et al., 2018; turbidity currents, Normandeau et al., 2019b).
Without age constraints for mapped landslides or detailed knowledge of the longevity of scarp and deposit persistence in the terrain, determining landslide susceptibility based on extant features is limited by the unknown timing and frequency of landslides and their triggers. Previous studies have produced statistical age estimates for subaerial landslide inventories by using dating techniques on a subset of landslides and referencing the ages to morphologic age-proxies (e.g., surface roughness of deposits) for the entire inventory (e.g., Bell et al., 2012; LaHusen et al., 2016; LaHusen et al., 2020; Booth et al., 2017). Although less common, some submarine landslides have been dated from sediment cores and seismic reflection data (e.g., Schnellmann et al., 2006; Strasser et al., 2013; Bellwald et al., 2016; Stacey et al., 2018). Strupler et al. (2019) further demonstrated the possibility of creating a local subaqueous landslide age calibration curve by correlating landslide roughness with previously established ages. Several studies have also shown a correlation between scarp diffusion and relative age in both subaerial (e.g., Bucknam and Anderson, 1979) and submarine environments (e.g., Vargas and Idarraga-García, 2014). Despite these successes, in submarine environments, the limitations in access, resolution, and diffuse landslide deposits largely preclude dating most landslides in comparable ways. However, in recently deglaciated terrain, maximum age constraints can be determined by the timing of deglaciation. To conduct submarine susceptibility assessments in these environments, accounting for the timing of deglaciation is an important consideration because the number of landslides should vary not only based on differences in the material, morphometric properties, and triggering conditions, but also as a function of the exposure age of submarine slopes after glacial retreat.
In this paper, we present an approach to mapping submarine landslide susceptibility in unconsolidated sediments in recently deglaciated fjords and bays in Glacier Bay National Park and Preserve (GBNPP) in southeast Alaska (Figure 1). Glacier Bay National Park is visited by hundreds of thousands of people in cruise ships and tour boats each year (about 643,000 people in 2019; National Park Service, 2020) and has a history of landslide-generated tsunamis (e.g., Coe et al., 2019). To perform the susceptibility assessment, we modeled morphometric properties to differentiate submarine rock and sediment, evaluated the bathymetric characteristics of an inventory of more than 7,000 submarine landslide scarps in sediment (see Avdievitch et al., 2020 for these data), and incorporated failure-prone fans and deltas. Additionally, we accounted for varying submarine slope exposure times using existing maps of glacier terminus positions from about 1750 to present (all calendar years are given as Common Era). Our work, while leaving room for improvement as new and better data become available, provides insights into the relative susceptibility of different submarine slopes. After we account for exposure age, our basic dataset of >7,000 landslide scarps implicitly addresses material properties, sediment thickness, and other variables that control landslide susceptibility but are difficult to constrain in submarine environments. For example, sediment on slopes with a high concentration of scarps may have inherently lower shear strength than sediment on slopes with a low concentration of scarps. If new bathymetric or geotechnical data become available in the future, particularly following a single regional triggering event such as an earthquake, our susceptibility approach and results could be evaluated based on landslides caused by that event. Given that Glacier Bay is along an active tectonic plate boundary (Figure 1), it is a question of when, not if, an earthquake will occur to test our results against a single triggering event.
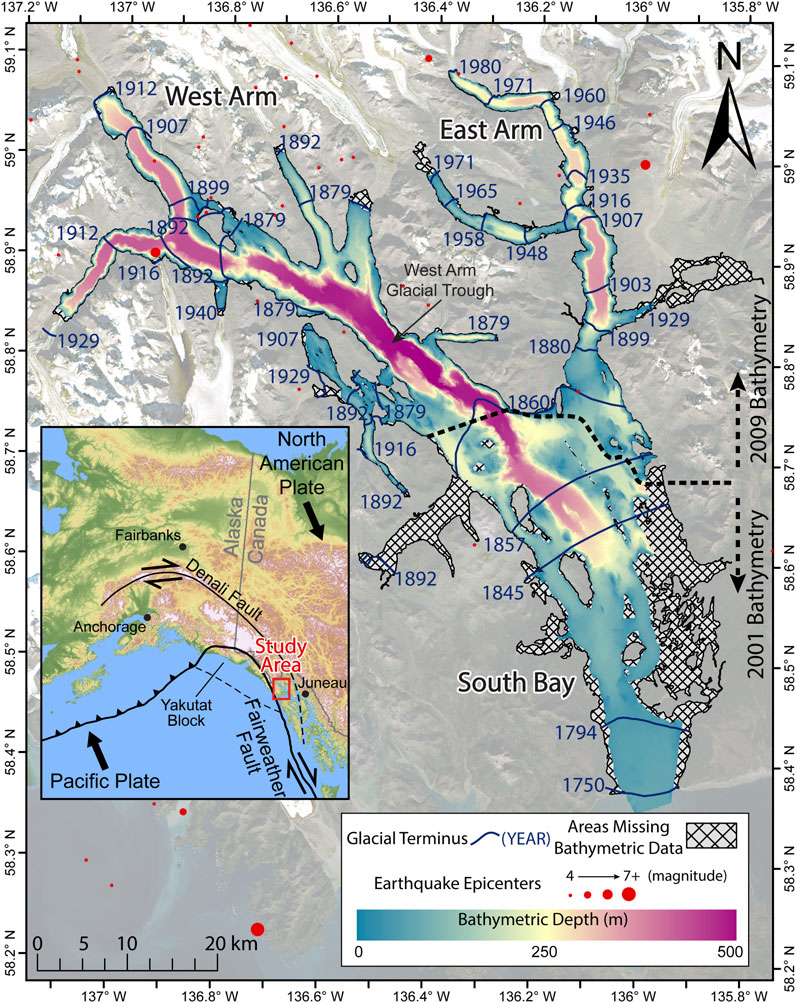
FIGURE 1. Overview map of Glacier Bay and surrounding area. Bathymetry is sourced from two multi-beam sonar data collections in 2009 and 2001 for the northern and southern portions, respectively (NOAA and USGS). Earthquakes magnitude 4 and above are plotted at their epicenters for the period of 1899–2009 (compiled from https://earthquake.usgs.gov/earthquakes/search/). Glacial extent locations since the Little Ice Age are shown with their labeled years and are compiled from Powell (1980) and refined using other original sources (see Materials and Methods). For visual clarity, not all extents are shown on this map. Background imagery is from 2018 Landsat data. Inset map shows regional tectonic setting and geographic overview.
Regional Setting
Glacier Bay is a network of inlets and fjords that sits within the greater GBNPP along an approximately 1,200 km transform plate boundary between the Pacific and North American Plates (Figure 1). The Fairweather-Queen Charlotte Fault system, which marks the boundary, is onshore in GBNPP and accommodates relative motion between the plates through dextral slip of approximately 4.3 cm yr−1 (Elliott et al., 2010). To the east of GBNPP, the Denali Fault system continues from the Alaska Range and, along with the Fairweather Fault, contributes to the region’s seismicity (Bufe et al., 1994; Mueller et al., 2015). In submarine environments, earthquakes are arguably the most well-documented landslide triggers (Fine et al., 2005; Masson et al., 2006; Johnson et al., 2017; Fan et al., 2020). Seismic data in the Glacier Bay region, dating back to 1899, show a consistent occurrence of earthquakes (Figure 2A) with distance and magnitude characteristics capable of inducing landslides (Keefer, 1984; Fan et al., 2020). In 1958, one of the best-known examples of a tsunamigenic subaerial-to-submarine landslide occurred in Lituya Bay, on the west side of the park, following a M7.8 earthquake (Miller, 1960). In 1964, the second largest earthquake ever recorded (M9.2 “Good Friday” Earthquake) (Hansen, 1966; Haeussler et al., 2014; Brothers et al., 2016) initiated some 600 km from Glacier Bay. Since 1958, at least 90 >M4.0 earthquakes have occurred within 100 km of the park (Coe et al., 2019).
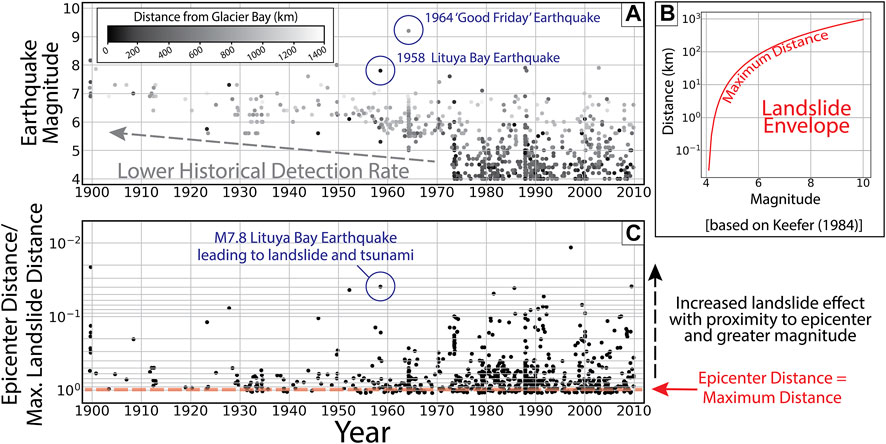
FIGURE 2. Earthquake history in regional circular window (1,400 km maximum distance) surrounding Glacier Bay. Period of record started in 1899 and is compiled here through 2009 (from https://earthquake.usgs.gov/earthquakes/search/). Detection rate of earthquakes below magnitude (M) 5 is limited before 1973. (A) Plot of year vs. earthquake magnitude with shading as a function of distance from Glacier Bay. (B) Plot of estimated maximum landslide-inducing earthquake distance as a function of earthquake magnitude, adapted from Keefer (1984). These subaerial landslide-derived data serve as a conservative estimate for submarine landslides that have been shown to occur at greater distances from earthquake epicenter (e.g., Fan et al., 2020). (C) Log-normal plot of earthquakes from Plot A expressed as a fraction of maximum landslide-inducing distance for that magnitude, i.e., the outer envelope of Plot B.
GBNPP hosts some of the lowest-latitude tidewater glaciers on the planet, sustained at sea level by a wet and moderate maritime climate with high orographic precipitation rates of up to 800 cm yr−1 (Cowan et al., 2010) and a mean of about 176 cm yr−1 (Syverson and Mickelson, 2009). Glacier Bay has a significant and largely unknown history of late-Quaternary glaciation with the last major advance ending at the end of the Little Ice Age (LIA), about 1750 (Mann, 1986; Seramur et al., 1997; Cowan et al., 2010). Since then, most glaciers in Alaska have been thinning and retreating (Larsen et al., 2004; Molnia et al., 2007; Molnia, 2007). Glacier Bay currently occupies approximately 1,200 km2, although it has continuously increased in area as retreating tidewater glaciers expose new previously ice-filled inlets and fjords. Over the last ∼250 years, extensive retreat has resulted in the formation of the entire bay from its mouth. The West and East Arms have been exposed in their entirety since about 1860 (Figure 1). During the LIA, the Glacier Bay ice field reached a maximum thickness of approximately 1.5 km in the West Arm (Larsen et al., 2005). Bathymetry reveals depths of more than 400 m below mean sea level (mbmsl) in the West Arm where glacial erosive forces were highest. As a result of viscoelastic rebound from significant ice loss since the LIA, GBNPP has an uplift rate of up to 3 cm yr−1, one of the highest on Earth (Clague and Evans, 1993; Larsen et al., 2004; Larsen et al., 2005). Studies in other parts of the world show that active uplift increases erosion and landslide frequency (e.g., Roering, 2012) while glacial isostatic rebound can cause earthquakes through reactivation of existing faults (e.g., Van Loon and Pisarska-Jamroży, 2014).
Terrain in GBNPP reaches 4,671 m above sea level (masl) at Mt. Fairweather west of Johns Hopkins Inlet. Bedrock in and around Glacier Bay is exposed along mountain peaks and ridges and glacially carved subaerial and submarine fjord flanks. The geology surrounding Glacier Bay consists largely of Paleozoic and Mesozoic accretionary terranes containing Tertiary sedimentary, plutonic, and volcanic rocks (see Figure 3A for general lithology; Brew, 2008; Wilson et al., 2015). Notable bedrock units that surround the bay are Jurassic and Cretaceous granites and granodiorites; Cretaceous foliated granitic rocks and migmatites; Tertiary (Oligocene and Eocene) granitic rocks; the Cretaceous Chugach accretionary complex consisting of flysch, graywacke, and basalts; Silurian turbidite deposits of graywacke, siltstone, and argillite; and mid- to late-Paleozoic (Silurian, Devonian, and Permian) carbonates and metacarbonates (Wilson et al., 2015). Global scale permafrost mapping by Gruber (2012a), Gruber (2012b) shows a high probability of mountain permafrost in high-elevation (>∼500 masl) areas within GBNPP (see Gruber, 2012b for map data) with a high incidence of historical landslides in these areas (Coe et al., 2018). In and adjacent to Glacier Bay, some of the highest sediment fluxes in the world result in extensive sediment-covered submarine slopes, glacial outwash deltas, alluvial fans, and debris-flow fans (Cowan et al., 2010).
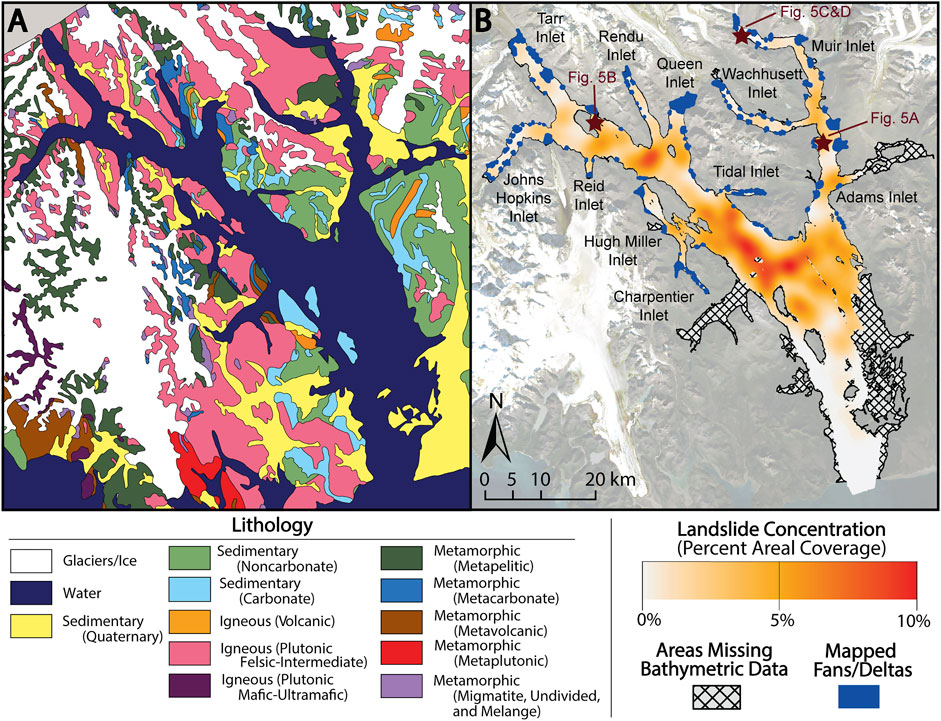
FIGURE 3. (A) Regional lithologic map of Glacier Bay and surrounding area modified from Brew (2008). Geologic units are shown without ages and lumped together according to general lithologic properties. (B) Raw submarine landslide concentration map for Glacier Bay, expressed as a percentage of total area calculated in a moving window with a 3 km radius. Deltas and fans that extend into the bathymetry are mapped from bathymetry used in this study, subaerial 5 m IFSAR, and Landsat and DigitalGlobe satellite imagery. Background imagery is from 2018 Landsat data. Major inlets are labeled for reference to the text. Stars show the locations of areas depicted in Figure 5.
Materials and Methods
Data Sources
We used a composite digital elevation model (DEM) raster compiled from available bathymetry (see https://coastalscience.noaa.gov/products/noaa-bathymetric-data-viewer/) from the National Oceanic and Atmospheric Administration (NOAA) and the U.S. Geological Survey (USGS) for all of our submarine mapping and analyses. The DEM composite covers 1,013 km2, representing approximately 80% of the total area of Glacier Bay, and consists of bathymetric multibeam sonar data collected during two periods, 2001 and 2009, for the southern and northern portions of the bay, respectively (Figure 1). To minimize resolution bias and maximize mapping consistency, we resampled all the original bathymetry data (resolutions ranging from 1 to 16 m) to 5 m. For a detailed overview of bathymetry source resolutions and original data extents, see “Glacier Bay Bathymetry Footprints.pdf,” included in the zipped file with the accompanying data release (Avdievitch et al., 2020). To map subaerial geomorphic features adjacent to Glacier Bay, we used a 5 m Interferometric Synthetic Aperture Radar (IFSAR) DEM available from the USGS at https://earthexplorer.usgs.gov/.
Mapping of Landslide Scarps, Fans, and Deltas
To produce our inventory, we mapped landslide scarps, and coastal fans and deltas using a Red Relief Image Map (RRIM) of the 5-m bathymetric data (Figures 4, 5). The RRIM consists of a topographic openness map (Yokoyama et al., 2002) in combination with a traditional slope map (Chiba et al., 2008). Red Relief Image Maps allow for good discernment of subtle concavities and convexities in the bathymetry and are thus well-suited for visually identifying landslide scars and deposits (e.g., Görüm, 2019). We mapped submarine landslide scarps (7,097 total) where the distance between lateral scarp flanks was approximately 50 m or more. Because the visibility of associated landslide deposits was usually limited by DEM resolution, material preservation, or substrate variability, we did not delineate their areal extent. See Figures 5A,B for examples of mapped landslide scarps. We used 50 m as a mapping cutoff because landslide scarps smaller than this size were difficult to discriminate in the 5-m DEM and were less likely to have generated hazardous tsunamis (e.g., Murty, 2003). Although we mapped only arcuate-shaped scarps typically formed by landslides (i.e., single mass failures), we acknowledge that some mapped scarps may have been formed by processes other than landsliding such as erosion from glaciers or submarine currents. We used the mapped scarps to estimate minimum landslide initiation areas (hereon referred to as landslide source areas) by linearly connecting the end points of each scarp (see Figure 4D for examples). This simple method has the benefit of being easily executable on a regional scale and applicable in areas with superimposed landslides, even though it does not account for the exact shape and size of landslide source areas. Further details on landslide mapping and DEM creation, as well as the full dataset of mapped landslide scarps, bathymetric rasters, and DEM-derivative products are available in Avdievitch et al. (2020).
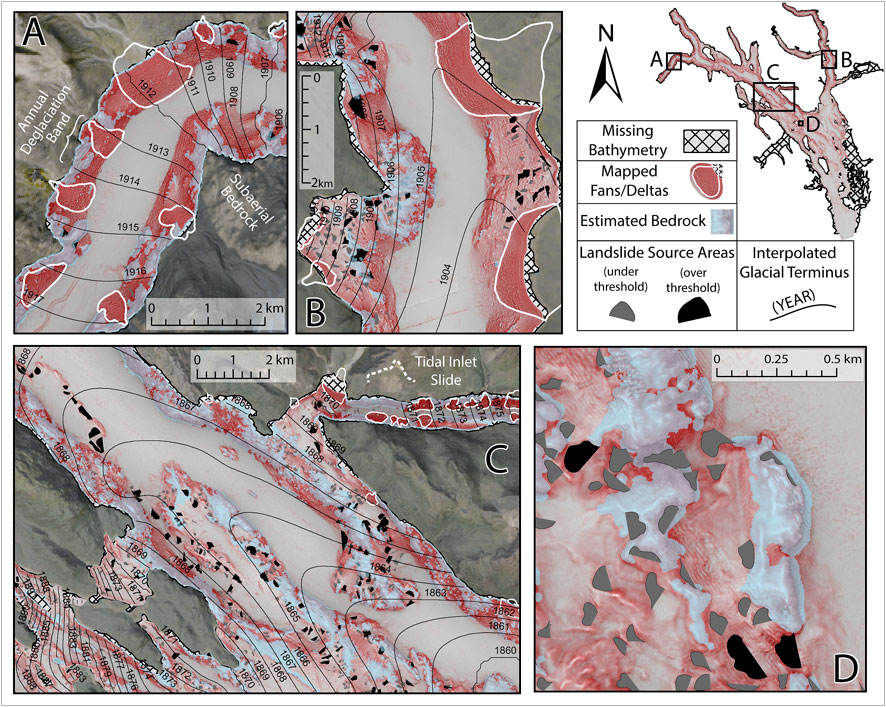
FIGURE 4. Detailed maps of four locations (A–D) in Glacier Bay showing input data for this study. Background submarine imagery is a Red Relief Image Map (Chiba et al., 2008) derived from compiled bathymetry and shows an overlay of topographic openness (darker is more concave) and slope (redder is steeper). Interpolated glacial terminus positions are plotted and represent annual deglaciation bands, with an example shown in (A). Maximum age for each landslide is expressed as the year of earliest possible occurrence, derived from the encompassing deglaciation band. Locations of estimated bedrock based on slope, topographic openness, and surface roughness are shown in light blue. (A) shows an example of subaerial bedrock identified in satellite imagery and the IFSAR DEM with contiguous expression of modeled bedrock into bathymetric terrain. Subaqueous fans and deltas are delineated in white. Mapped landslide scarps are shown as their estimated source areas (connected at the end points). Landslides shown in black are those included in susceptibility assessment based on power law fitting (see Figure 7). The Tidal Inlet landslide (Wieczorek et al., 2007) is visible in (C). Overview map in the top right corner shows the locations of four included panels.
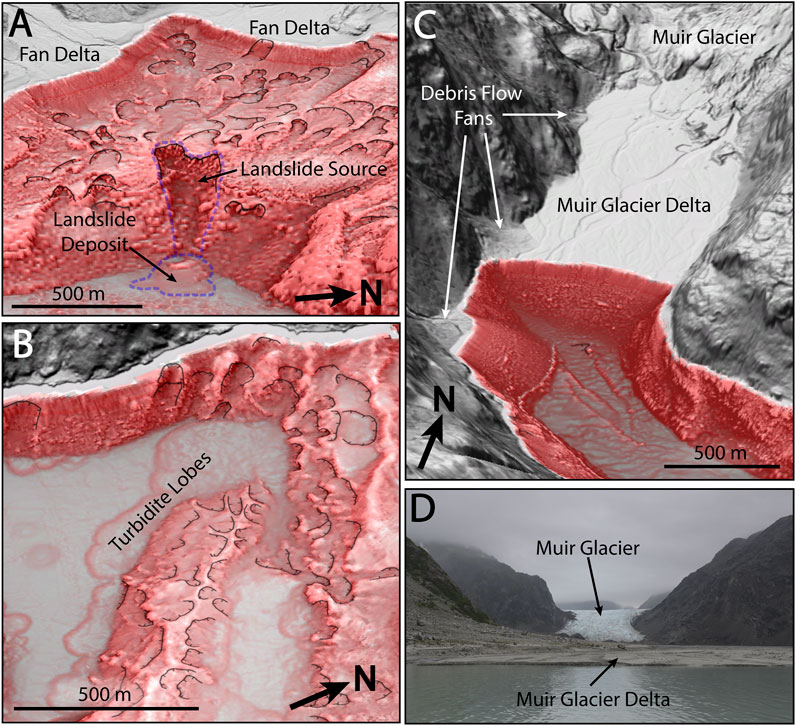
FIGURE 5. Examples of mapped landslide scarps and deltas in Glacier Bay. Scales are approximate. See Figure 3B for locations. Scarps are delineated with black lines with hatch marks pointing down slope. (A) Oblique view of landslide with visible scar and deposit (outlined in dashed blue line) and shallow landslide scarps without visible deposits on sediment slope above. Approximate center of view is 136.120°W 58.903°N. (B) Oblique view of landslide scarps in glacial moraine with turbidite lobes on sea floor below. Turbidite deposits are approx. 1–3 m thick. Approximate center of view is 136.801°W 58.934°N. (C) Oblique view of the Muir Glacier and Delta with adjected debris flow fans and fan delta (bottom-most fan). Approximate center of view is 136.378°W 59.093°N. (D) Photograph taken on 25 August 2021, looking up the Muir Glacier Delta at Muir Glacier (view to the North).
Previous work has shown that depositional coastal features (i.e., fans and deltas) are susceptible to landslides, especially during earthquakes (Hampton et al., 1996; Lee et al., 2003; Lee et al., 2006; Haeussler et al., 2007; Haeussler et al., 2014; Hughes Clarke et al., 2014; Brothers et al., 2016). For the purposes of this study, we define fans and deltas as sediment bodies, often radially dispersed, that are deposited downslope from an active sediment source (Harvey, 2018). This definition accommodates a range of features, including individual debris-flow lobes, coalescing debris-flow fans, alluvial fans, fan deltas, river deltas, and a variety of proglacial deltas. Adjacent to Glacier Bay, many of these depositional features can be classified as fan deltas or braid deltas as defined by McPherson et al. (1987); they are often coarse-grained (i.e., grain sizes range from clay to boulders) and their toes occur underwater. Most importantly, relatively few landslide scarps in GBNPP are preserved on fans and deltas because they are actively aggrading or prograding. See Figure 5 for examples of mapped deltas. We mapped both the submarine and subaerial parts of all active fans and deltas along the Glacier Bay coastline, including deposits from rivers, debris-flow dominated catchments, proglacial run-off, and active tide-water glacier grounding line processes (all hereon referred to as fans and deltas; Figure 3B).
Glacial Retreat Ages
To attribute maximum ages to all landslide source areas, we compiled glacial terminus locations through time from available maps and literature (for examples, see Figure 1). The most complete effort to map glacial terminus locations in Glacier Bay was conducted by Powell (1980), which we used as our primary source map. We refined the Powell terminus locations using an extended list of literature, maps, sketches, and written accounts of ice in Glacier Bay dating back to the late 1800s (Reid, 1892; Wright, 1894; Muir, 1895; Reid, 1896; Scidmore, 1896; Klotz, 1899; Gilbert, 1904; Klotz, 1907; Morse, 1908; Reid, 1908; Reid, 1913; McNabb and Hock, 2014). Because the timing of mapping efforts was inconsistent for much of the glacial retreat history (with a substantial increase in mapping frequency closer to present), we used spline interpolation of known terminus locations (primarily from Powell, 1980, but also from other references listed above) to estimate terminus locations for missing time periods (Figures 4A–C). The resulting map of deglaciation ages serves as a maximum age map for landslide scarps occurring within each annual deglaciation band (i.e., the area between glacial terminus positions for two consecutive years). For example, the earliest possible occurrence year for a landslide between glacial terminus locations of 1889 and 1890, is 1889. To estimate maximum ages for each landslide source area, we converted the deglaciation map to a raster and extracted the mean interpolated deglaciation age within the footprint of each source area. For simplicity, when referring to a maximum landslide age, we report the earliest possible year of occurrence, rather than the age (e.g., 1980 rather than 39 years).
As an alternative method to estimate relative landslide ages, we evaluated the relation between maximum age and scarp smoothness (a measure of scarp degradation through time; e.g., Bucknam and Anderson, 1979; Vargas and Idarraga-García, 2014). To estimate scarp smoothness, we calculated planar curvature in a 10-m buffer upslope and downslope of each scarp. However, we failed to find any correlation between maximum age and curvature, most likely because of limitations in DEM resolution and inconsistent sediment properties.
Landslide Susceptibility Analysis
To map submarine landslide susceptibility in sediment in Glacier Bay, we used two general approaches: an approach based on heuristic knowledge of two known landslide-controlling variables (slope angle and the presence of fans and deltas) that are directly measurable or mappable, and an inventory-based approach based on the distribution of mapped landslide source areas. These two approaches resulted in three individual susceptibility indices (Figure 6). We combined these three index values to create a final submarine landslide susceptibility map (see flow chart in Figure 6).
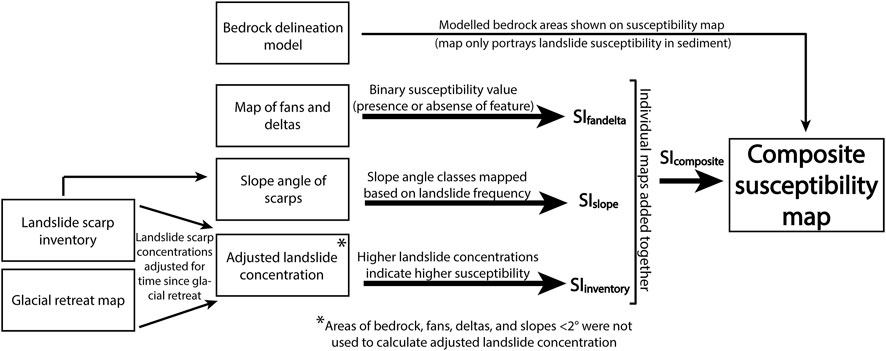
FIGURE 6. Flow chart showing the workflow of the study.
In general, lithology and slope angle have long been established as dominant controls on landslide susceptibility in both submarine and subaerial environments (e.g., Reichenbach et al., 2018; Innocenti et al., 2021). Outside of areas associated with near-shore subaerial geologic units, bedrock lithology is difficult to map in submarine terrain. In GBNPP, the geology is complex, and regional (Brew, 2008) and state-wide geologic mapping (Wilson et al., 2015) has been done at scales ranging from 1:250,000 to 1:1,584,000, making it difficult to interpolate geologic units in areas covered by water.
Because a submarine geologic or geomorphic map for Glacier Bay is not available, we isolated sediment-covered areas from exposed bedrock areas using morphometric properties of slope angle, bathymetric roughness, and convexity, which we extracted from bathymetric data (see Figure 4 for examples). To conduct this assessment, we initially defined bedrock at any grid cell with a slope angle >45°, that is, areas over a conservative maximum angle of repose for submarine sediment (e.g., Kleinhans, 2004; Kleinhans et al., 2011; Al-Hashemi and Al-Amoudi, 2018). Next, we incorporated rough and convex areas because they generally signify bedrock outcrops and ridges, respectively. To calculate bathymetric roughness, we used a root-mean-square deviation (RMSD) from mean bathymetry in a moving circular window with a 50-m radius. We set the minimum roughness RMSD value at a threshold of ±5 m (10 m total outcrop height), based on a minimum bedrock outcrop size that would be discernable at the resolution of the bathymetry (5 m). We attributed convex terrain to grid cells that had a topographic openness value of >2° (Yokoyama et al., 2002). To delineate rough and convex terrain, we mapped contiguous areas where >25% of cells in a 25-m radius moving window met or exceeded each threshold. To create the final bedrock map, we evaluated high-slope-angle grid cells in relation to surrounding bathymetrically rough and convex terrain by delineating areas where the three parameters were co-located. We considered contiguous areas with overlap of high-angle grid cells and at least one of the two other parameters to be the minimum evidence required for bedrock morphology. Conversely, if areas had high roughness or convexity, but no associated steep grid cells, we did not map them as bedrock. Our resulting submarine bedrock map was consistent with observations of bedrock spurs and fans and deltas that had continuous expressions in the bathymetry from adjacent subaerial terrain. For example, our approach resulted in areas of observed subaerial bedrock being contiguous with areas of mapped submarine bedrock in Johns Hopkins Inlet (Figure 4A).
To select landslides to use in the susceptibility assessment, we evaluated the frequency-magnitude distributions of landslide source areas using three landslide magnitude metrics: scarp length, estimated minimum source area, and estimated volume (Figure 7). We estimated volume by subtracting the DEM within each source area polygon from a second order polynomial surface fit to the 3D representation of each scarp. We fit a power law to the tail end of the distributions of each of these three magnitude-frequency curves using the Maximum Likelihood Estimator (MLE) method (Clauset et al., 2009; Alstott et al., 2014). The method simultaneously selects the range of data values (i.e., the validity domain) that fit a power law and determines the fit parameters for the trend. Studies have shown that only the tail end of landslide magnitude-frequency distributions follows a power law, with the point of divergence known as the cutoff point (e.g., see Figure 7 and Stark and Hovius, 2001; Malamud et al., 2004; Tanyaş et al., 2018; Tanyaş et al., 2019). To ensure analysis of a more statistically complete sample of features, we only selected landslides for the susceptibility assessment that were above the cutoff point within the MLE validity domain (minimum size of 273 m for scarp length and 9,596 m2 for source area) and thus fit the power law trend. Further benefits of this approach include the fact that larger scarps and sources areas are easier to map and more likely to be tsunamigenic (e.g., Murty, 2003).
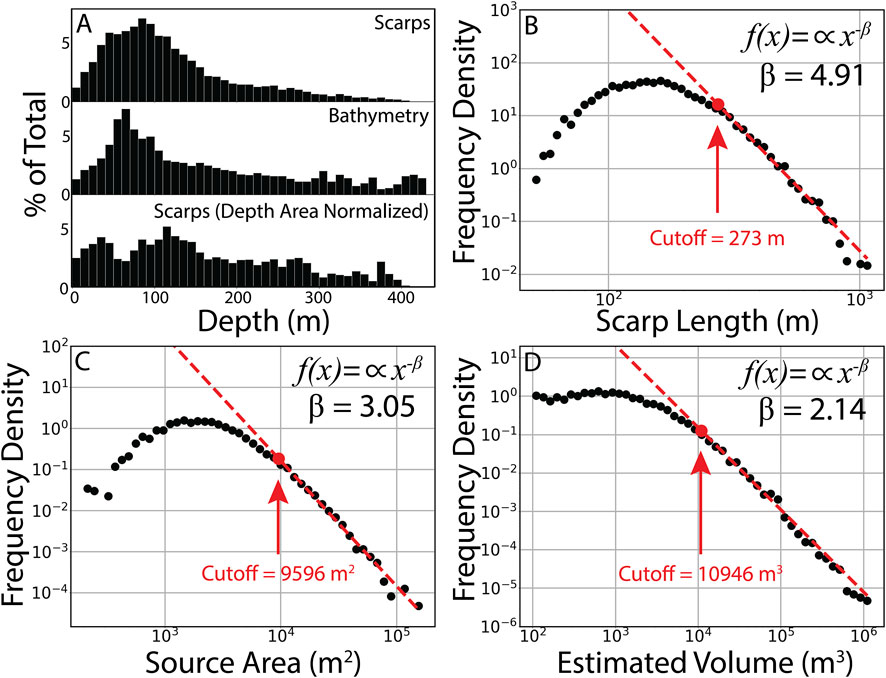
FIGURE 7. (A) Depth-frequency plots for all mapped landslide scarps and bathymetric grid cells expressed as a percentage of total scarps and total grid cells, respectively. Under-sampling at shallow depths is likely a result of unavailable near-shore bathymetry. Lower panel shows normalized values for scarp depth-frequency (top panel divided by middle panel), with an apparent decrease in frequency at greater depths. Lack of data at greater depths is likely a result of lower available multi-beam sonar resolutions and thus poorer discernability of scarps at these depths. (B–D) Magnitude-frequency density plots for scarp length, source area, and estimated source area volume for submarine landslide scarps mapped in this study. Best fit power law and minimum values were calculated using the maximum likelihood method (MLE) after (Clauset et al., 2009) with logarithmic bins. Cutoff values representing the MLE validity domain are shown in red. Power law exponents (β) are reported for each fit. Source area was derived for each scarp by connecting scarps at their end points. Volume was estimated by differencing the bathymetric surface within the source area footprint from a best-fit polynomial surface for each three-dimensional scarp representation. Negative volumes resulting from uncertainty in the method and a dominance of shallow landslides in these environments are not shown (see Supplementary Figure S1).
To determine how slope angle affected landslide incidence in our data, we evaluated the slope-frequency distribution of landslide source areas using bins of 2° (Figure 8). To estimate the slope angle of the original pre-failure surface, we calculated the mean bathymetric slope angle in a 25-m buffer directly upslope and adjacent to the scarps. We normalized the landslide slope angle frequencies by the prevalence of bathymetric slope angle frequencies throughout Glacier Bay. For normalization, we did not include areas of bedrock because they are not part of terrain where submarine landslides in sediment occur. Similarly, we removed areas covered by fans and deltas because rapid deposition prevents the preservation of landslide scars on these features. The ratio of landslide slope angle frequency to overall bathymetric slope angle frequency (i.e., normalized landslide slope angle frequency) can be more accurately portrayed by taking the natural log of the ratio to linearly distribute values above and below a value of 0 (representing a 1:1 landslide slope frequency to bathymetry slope frequency ratio; for another example of this procedure, see Hughes and Schulz, 2020). The final log value serves as a slope susceptibility index (SIslope), where:
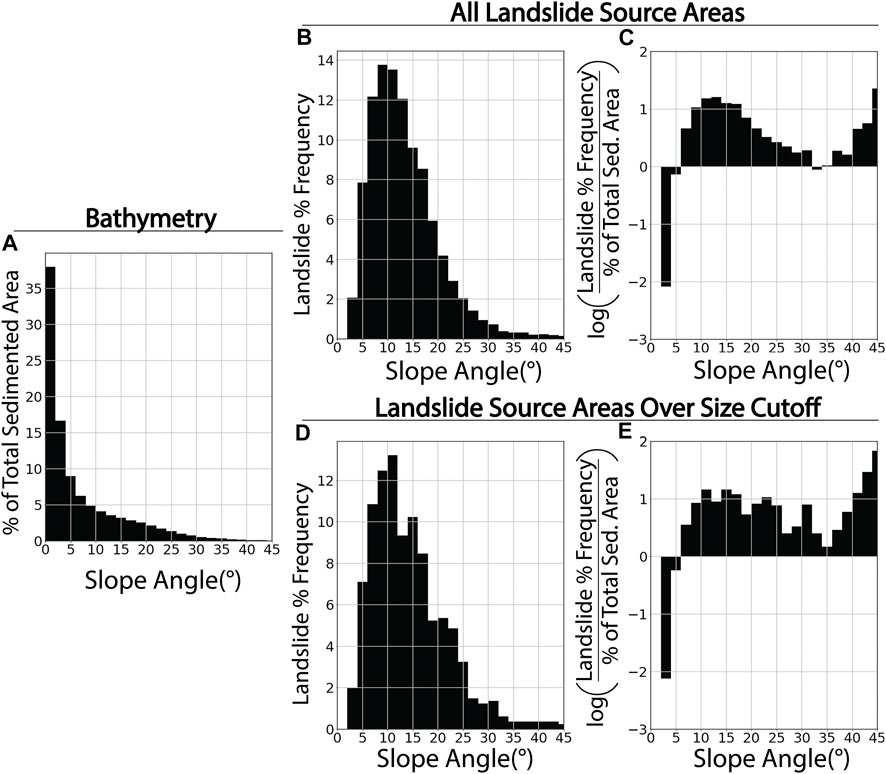
FIGURE 8. (A) Slope angle distribution of sedimented areas for Glacier Bay bathymetric data, expressed as a percentage of total sedimented area in the bathymetric data. (B, D) Landslide slope angle plotted against frequency of landslide occurrence (expressed as a percent of total number of landslides), shown for all landslides in the inventory (Plot B), and for landslides above the threshold values in this study (Plot D). Slope angle for each landslide was calculated as the mean slope angle in a 25 m buffer upslope of the scarp. (C, E) Slope angle frequency of landslides normalized for total slope area, expressed as the natural log of the ratio of landslide frequency (% of total landslide) to the area of bathymetric data at that slope angle (% of total area), shown for all landslides in the inventory (Plot C) and for landslides above the threshold values in this study (Plot E). Values in Plot E represent the slope-based susceptibility index (SIslope) in the final susceptibility maps. No landslides were observed in the 0–2° slope bin.
for each slope class.
We incorporated fans and deltas into the susceptibility map as a Susceptibility Index, SIfandelta, by assigning them a log normal susceptibility index value of 1, which ranks them as likely sources of future landslides. This ranking is based on their known history of failure during earthquakes in Alaska (Haeussler et al., 2014; Brothers et al., 2016) and other parts of the world (e.g., L’Heureux et al., 2014). This consistent ranking could be revised if geotechnical data become available that would allow for fans and deltas to be differentiated into variable susceptibility categories.
To determine the inventory-based susceptibility for mapped landslides in Glacier Bay, we adjusted landslide source area spatial concentrations for the duration of time each area had been exposed since deglaciation. To do so, we binned each landslide into annual bands, based on interpolated terminus locations (see Figure 4A). The year of each band functions as an earliest occurrence year defining a maximum age for landslides within that band.
For each annual deglaciation band, we calculated the accumulation of landslides in each band (i.e., the total landslide area accumulated since the exposure of the band from deglaciation). To do so, we normalized the total area of landslide source areas in each band by the total amount of susceptible area each band contained (Figure 9). We defined susceptible area as non-bedrock area over a 2° slope, as determined by the lack of landslides in the 0–2° slope bin from the slope-frequency analysis (Figure 8). As with the slope analysis, we removed fan and delta areas to address the lack of scarp persistence on these features. The resulting value is a landslide areal concentration for each deglaciation band (e.g., the cumulative landslide source area divided by total susceptible area). To account for error in deglaciation years from both mapping and interpolation, we smoothed the data with a 20-year (±10 years) moving mean window, based on the approximate maximum spatio-temporal gap in glacial terminus mapping (1860–1879 extents in the West Arm; see Figure 1). To calculate a mean landslide accumulation rate, we fit a linear model to the resulting data, inversely proportional to time. We fit the accumulation rate only to post-1860 deglaciation bands and landslides (dashed line in Figure 9). This approach addresses the 8-year gap in collection time between data in the South Bay and East and West Arms (Figure 1), the lack of landslides in the gently sloping south part of the bay, and the relative incompleteness of South Bay bathymetry (see Figure 1).
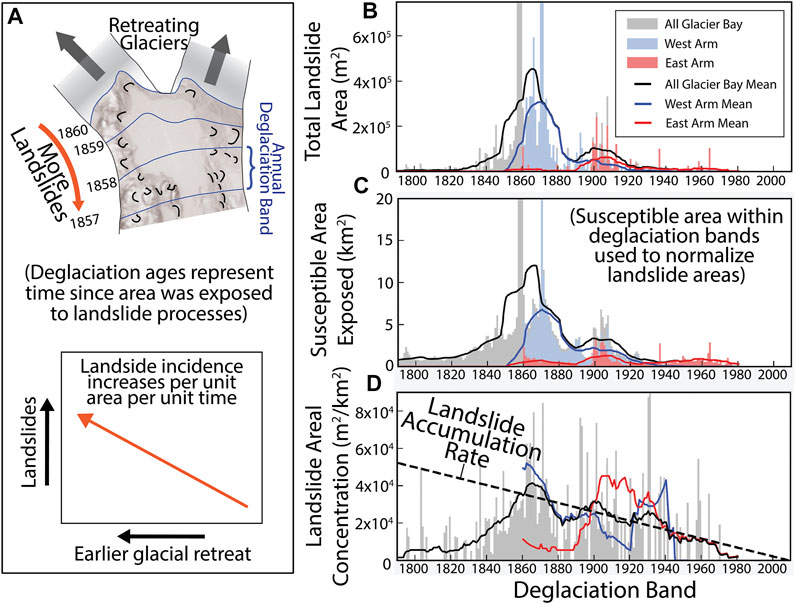
FIGURE 9. (A) Conceptual diagram for the inventory-based landslide accumulation approach to determine susceptibility. Total landslide incidence varies as a function of the timing of the initial exposure of submarine slopes, resulting in a mean increase in areal concentration of accumulated landslides with deglaciation band age. (B) Plot of total landslide area within each deglaciation band, shown for all of Glacier Bay, and the West and East Arms, individually. Data are expressed in raw form and with a 20-year moving-window mean (±10-year central window). (C) Plot of total susceptible (sediment-covered and >2° slope angle) area exposed during each year of deglaciation (i.e., total susceptible area in each deglaciation band) for all of Glacier Bay and the West and East Arms individually. Plots B and C share a general distribution shape, whereby the larger a deglaciation band is, the more landslide area it hosts. (D) Plot of landslide areal concentration for all of Glacier Bay (raw and smoothed data), and for the West and East Arms, individually (smoothed data only), i.e., Plot B divided by Plot C. A positive correlation between landslide concentration and deglaciation age between 1860 and 2009 corroborates the conceptual model shown in (A). Dashed black line shows a least squares linear regression (coefficient of determination (R2) = 0.82) to Glacier-Bay-wide mean areal landslide concentration for the period of 1860–2009, representing a landslide areal concentration accumulation rate of 238 m2 km−2 yr−1. For the susceptibility model, we did not fit the accumulation trend to pre-1860 data because of the existence of broad areas of missing bathymetry in the South Bay (e.g., Figure 1), disparities in bathymetry collection years, and substantial differences in geomorphology between the South Bay and the Arms, which resulted in generally less susceptible terrain in the South Bay. The solid black line represents the mean spatial concentration (the one-dimensional mean of data presented in Figure 3B). The log-normal ratio of landslide concentration (solid black line) to landslide accumulation (dashed black line) represents SIinventory values shown in the susceptibility map (Figure 10B).
The landslide accumulation rate (238 m2 km−2 yr−1, Figure 9D) determines an expected areal concentration of landslides that a submarine slope should exhibit based on how long it has been exposed from glaciers. Thus, the total landslide concentration on a slope, taken as a ratio to the expected landslide concentration on that slope, is a relative measure of susceptibility, because it shows a deviation from the expected landslide accumulation rate (Figure 9D). To produce the inventory-based susceptibility map, we first calculated expected landslide concentration per grid cell in the bathymetry, taken as
for each grid cell. The 3 km radius used to measure landslide concentration surrounding a grid cell incorporates the distance to which surrounding landslides likely share similar background conditions, such as substrate, but also represents uncertainty in the position of deglaciation bands.
For the final susceptibility map, we created an equally weighted, additive composite of the slope susceptibility index, the fan and delta susceptibility index value, and the inventory-based susceptibility index. The final composite susceptibility index (SIcomposite) values were grouped into three susceptibility classes: moderate (SIcomposite < −3), high (−3 < SIcomposite < 0), and very high (SIcomposite > 0). Areas less than or equal to a 2° slope angle were automatically categorized into a fourth class of “low.” Bedrock was not given a susceptibility value as our method explicitly addresses landslide susceptibility in marine sediments (Figure 6).
Results
Scarp, Landslide, and Fan and Delta Distributions
Although we explicitly mapped landslide scarps without the aid of delineated bedrock, most scarps (>98%) were in areas delineated as sediment. Mapped landslide concentrations were high at the mouth of the West Arm, and near the mouth of Rendu Inlet (Figure 3B). Generally, these areas were broad sedimented slopes with high relief from subglacial erosion (Figure 1). We observed landslide source areas of all sizes at all depths (Figure 7A). Landslide frequency showed no consistent correlation with depth, although a systematic lack of scarps in the shallowest water is apparent where ships were unable to collect bathymetric data (Figure 7A). Scarp depth-frequency has a peak occurrence at 90–100 mbmsl and exhibits a similar trend to bathymetry depth-frequency, which has a peak between 60 and 70 mbmsl (Figure 7A). When normalized to bathymetric depths within Glacier Bay, the frequency of scarps decreases moderately with depth, starting at approximately 100 mbmsl, although this trend could be partly due to coarser bathymetric data at greater depths.
As is typical of both subaerial (Van Den Eeckhaut et al., 2007) and submarine (e.g., Chaytor et al., 2009; Urgeles and Camerlenghi, 2013; Katz et al., 2015; Casas et al., 2016) landslide data, magnitude-frequency density plots in Glacier Bay follow a power law in the tail end of the distributions for scarp length, minimum source area, and estimated volume (Figures 7B–D). Scarp lengths within the validity domain of our data range about a half an order of magnitude (from 273 to 1,100 m; Figure 7B), while source areas range about one order of magnitude (from about 9,600 to 165,000 m2; Figure 7C). Approximately 800 landslides were in both the length and area validity domains. The power-law exponent associated with source areas (3.05; Figure 7C) is within appropriate ranges (approximately 1.4–3.4) for other landslide inventories in both subaerial (Van Den Eeckhaut et al., 2007) and submarine settings (e.g., Katz et al., 2015). Much of the variance in exponents is rooted in inventory-specific characteristics such as temporal resolution and amalgamation of landslide features rather than intrinsic susceptibility factors in the terrain (Tanyaş et al., 2018; Tanyaş et al., 2019). Volume estimates based on fit polynomial paleosurfaces for the 7,097 scarps yielded 1,143 landslides in the volume validity domain (approximately 11,000–1,100,000 m3; Figure 7D). The upper end of these volumes have been suggested to be the smallest needed to generate hazardous tsunamis (about 1 × 10⁶ m3; e.g., Murty, 2003). Conversely, 1,152 landslides showed apparent negative volumes (not shown in Figure 4) and the remaining 4,801 landslides yielded volumes with a mean thickness of <2 m (Supplementary Figure S1). In both these cases, landslides were likely too thin to accurately estimate volumes. As a result, for 5,953 landslides, fit pre-failure surfaces could not be quantitatively distinguished from the DEM surface, either because of low DEM resolution, possible changes in bathymetry since failure, or uncertainties associated with automated reconstruction of pre-failure surfaces. The landslide source area volume estimate exponent for Glacier Bay (2.14; Figure 7D) also deviates from other studies (e.g., Chaytor et al., 2009; Urgeles and Camerlenghi, 2013; Casas et al., 2016). We note, however, that robust volume estimates for submarine inventories are difficult to obtain and the commonly used method of power law area-volume scaling can produce inaccurate results (Larsen et al., 2010; Urgeles and Camerlenghi, 2013). Thus, our calculated volumes serve as a first order estimate of the largest submarine landslides in sediment in Glacier Bay and indicate that most slides are shallow (<2 m) rather than deep-seated.
We mapped 159 fans and deltas ranging in total area from approximately 7,000 to 8,000,000 m2 (Figure 3B). Submarine portions of deposits ranged from 5,000 to 1,700,000 m2. We were unable to differentiate geotechnical characteristics between different fan and delta types from remote sensing data alone. However, visual analysis of subaerial satellite imagery shows that about 3% of mapped fans or deltas were tidewater glacial grounding line fans, 26% were lower angle river deltas, and 71% were deposits downslope from steep catchments with sediment contributions from debris flows and/or water-dominated flows.
Slope-Based Susceptibility Index (SIslope)
The frequency distribution of slope angles for all sediment-covered submarine areas follows an exponential decline at higher slope angles (Figure 8A). The landslide slope angle distributions for both the entire landslide inventory and the subset filtered by scarp length and source area size show similar trends to each other (Figures 8B, D). We observed no landslides in the 0–2° range, with a steady and steep increase in frequency at slopes from about 8 to 12° (Figures 8B, D). Above 12°, a steady decline is apparent with higher slope angles. When normalized by the overall submarine slope distribution, the peak in the landslide distribution is spread to a wider range of approximately 8–17° (Figures 8C, E).
Figure 8E serves as the slope angle-derived susceptibility index (SIslope). A map of SIslope, shows high values through the sloped sides and flanks in the fjords of the West and East Arms, as well as the glacial trough edges extending into the South Bay (Figure 10A). The South Bay shows lower SIslope values, although thin slivers of higher susceptibility slope angles occur within morainal sediments. The range of lower-susceptibility high-angle slopes (e.g., 25–40°, Figure 8E) coincides with a lower frequency of grid cells in the bathymetric data at those angles (Figure 8A), implying greater uncertainty for those values.
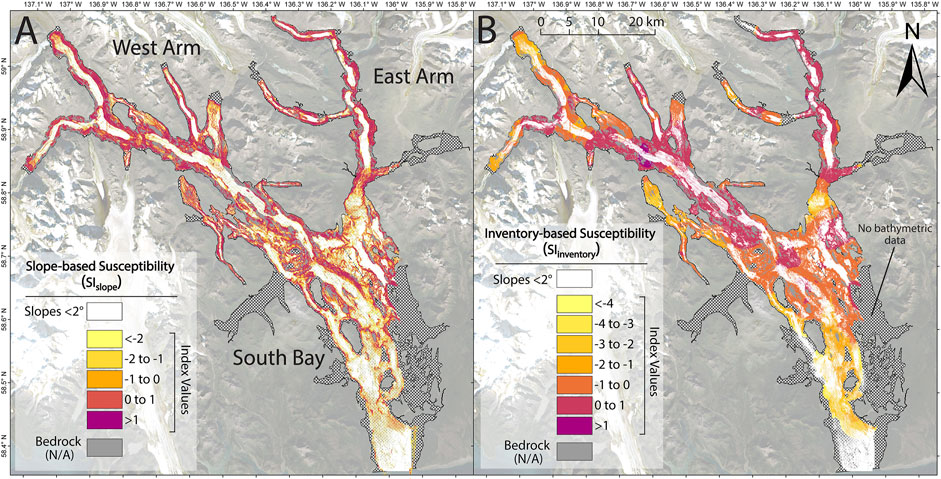
FIGURE 10. (A) Map of slope-based susceptibility for Glacier Bay using SIslope values shown in Figure 8E. (B) Map of inventory-based susceptibility for Glacier Bay using SIinventory values derived as the log-normal ratio of expected landslide accumulation (based on the regression in Figure 9D) to actual landslide concentration in a 3-km radius moving window (Figure 3B).
Inventory-Based Susceptibility Index (SIinventory)
Inventory-based assessment of landslide accumulation in areas deglaciated at different times (Figure 9D) shows an inverse correlation of landslide concentration with time between the years 1860 and 2009, with 2009 being the age of bathymetric data. Although total landslide area shown in Figure 9B is substantially higher in areas deglaciated around 1860–1870 in the West Arm, this peak is lowered when normalized by sediment-covered areas >2° (Figures 9C,D). A linear regression of deglaciation year vs. landslide areal concentration for the years 1860–2009 reveals a mean landslide accumulation rate of 238 m2 km−2 yr−1 (slope of the dashed line in Figure 9D) for landslides throughout Glacier Bay. However, there are substantial variations in accumulation rate for the West and East Arms as well as variations in time.
A map of SIinventory shows clusters of high SIinventory values throughout the West and East Arms (Figure 10B). These clusters mostly occur in both narrow, steep walled sections of the arms, but also in isolated pockets near the mouths of both arms. Differences between the raw landslide concentration map (Figure 3) and mapped SIinventory (Figure 10B) are most notable in areas of recent deglaciation, such as the northern part of Muir Inlet where deglaciation occurred through the latter part of the 19th century.
Composite Susceptibility Map (SIcomposite)
The composite susceptibility (SIcomposite) map (Figure 11) has a broad resemblance to the inventory-based map, although the added effect of slope and geomorphology (fans and deltas) is notable because it changes local values in susceptibility. These local changes are lower than the total variability in SIinventory. As a result, inventory-based susceptibility controls the first order effect on SIcomposite. The South Bay exhibits the lowest overall susceptibility, consisting largely of older flatter moraines and glacial terminus deposits. Areas around islands and adjacent to the glacial trough in the South Bay have notably high susceptibility.
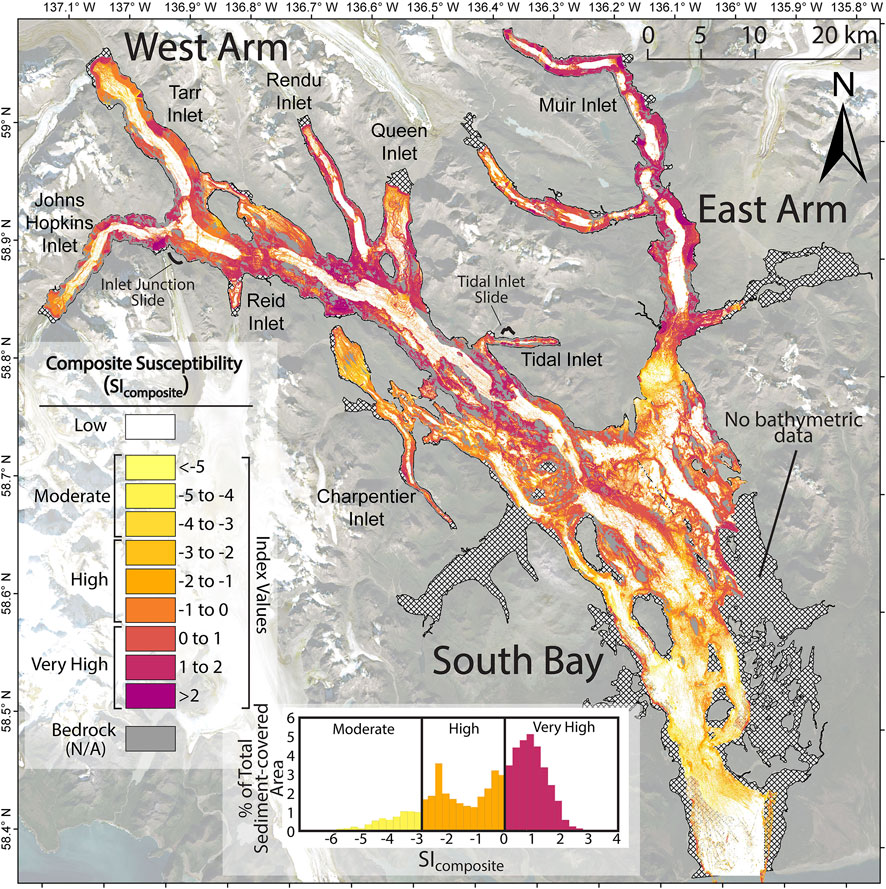
FIGURE 11. Final composite (SIcomposite) submarine landslide susceptibility map for sediment-covered areas in Glacier Bay. Final map shows an additive equally weighted composite of slope-based susceptibility index (Figure 10A), fan and delta index susceptibility value of 1 (locations shown in Figure 3B), and inventory-based susceptibility index (Figure 10B). Susceptibility classes are based on SIcomposite values for moderate (SIcomposite < −3), high (−3 < SIcomposite < 0), and very high (SIcomposite > 0). Areas under 2° slope were automatically attributed to the “Low” susceptibility class. Although we observed no landslides in areas under 2° slope in Glacier Bay, we attributed a susceptibility category to these areas because of previously documented submarine landslides in low-sloping submarine terrain (e.g., Masson et al., 2006). Bedrock was not given a susceptibility value as our method explicitly addresses landslide susceptibility in soft marine sediment. Areal distribution of susceptibility classes expressed as a percentage of total sediment-covered area reveal the highest total percent of grid cells in “Low” (39%), followed by “Very High” (34%), “High” (22%), and “Moderate” (5%) classes. Histogram below map shows the SIcomposite distribution for classes “Moderate” through “Very High.”
Discussion
Factors Influencing Slope-Based Susceptibility
Slope is arguably the most common instability variable used in susceptibility mapping (e.g., Reichenbach et al., 2018; Innocenti et al., 2021). While the exact relationship between susceptibility and slope is complex and depends on other variables unique to a particular study area, a trend of increasing susceptibility with increasing slope angles has been shown to hold true at certain ranges. Glacier Bay data show this trend between slopes of 2° and 12° (Figure 8E). From 12° to 36°, a drop in SIslope indicates either that higher slopes are less susceptible, or that unmapped landslides from a lack of scarp persistence or limited spatial coverage at these slope angles result in an apparent decrease in susceptibility (Figures 8C, E). While we can assume that scarps in aggrading or prograding sedimentary features (fans and deltas) are not fully represented in the inventory, we cannot fully determine how complete the inventory is at higher slope angles.
Although we cannot determine the extent to which limited preservation variably affects the slope-frequency plots, other studies have documented similar ranges of submarine landslide incidence with increasing slope angles (e.g., McAdoo et al., 2000; Masson et al., 2006; Twichell et al., 2009). Similar trends, whereby the steepest slopes do not host the greatest number of landslides, have also been shown in other environments with other types of mass wasting, such as thaw slumps in permafrost terrain (e.g., Niu et al., 2014; Lacelle et al., 2015) and shallow landslides in subaerial environments (Prancevic et al., 2020). Prancevic et al. (2020) posited that the tendency for steeper slopes to fail more frequently by way of smaller erosional events limited the number of larger shallow landslides that would otherwise occur above certain slope angles. Although the slope angle values are different in Glacier Bay data, a similar process in submarine environments may be responsible for some of the trend. For example, unmapped <50 m landslides could account for much of the erosion on steeper slopes. Additionally, volume estimates for our source areas indicate that most submarine landslides in Glacier Bay are shallow (generally <2 m) rather than deep-seated (Supplementary Figure S1). Other processes that bias data towards scarps on shallow slopes are also observable in submarine environments. In some cases, submarine landslides occur on low angle slopes that are steeply undercut and debutressed at the toes of the slides. For example, landslides often occur where a low angle slope is cut by a submarine canyon. Larger slides of this type have been documented at the edges of continental shelves (e.g., Masson et al., 2006). Although this phenomenon could influence slope-based susceptibility results, the effect is probably minimal and consistent throughout the study area, with little resulting bias in susceptibility results. Finally, slope angle may correlate with other variables such as lithology or sediment thickness, which affect landslide occurrence but remain unmapped. For example, slope-parallel planes of weakness controlled by sedimentation may play a greater role on gentler slopes where thick sequences of sediment are likely to accumulate.
Factors Influencing Inventory-Based Susceptibility
The accuracy of SIinventory depends on how well the mapped distribution of landslide scarps reflects implicit landslide susceptibility. This reflection is directly related to the completeness and scope of the inventory and the temporal distribution of triggers. To address the completeness and scope of the inventory, we assessed landslide scarp coverage in the study area. Outside of aggrading fans and deltas or sub-horizontal (<2°) slopes, we observed landslide scarps in all sediment-covered areas of the bathymetry, including in terrain in the northern East Arm that has been deglaciated and exposed since 1980. In other words, sufficient time has elapsed to accumulate landslides in all parts of Glacier Bay. At a minimum, this indicates that persistence of landslide scarps in the terrain is sufficient to preserve landslides accumulated over the last 250 years. Many studies have documented similar and greater timescales (hundred to tens of thousands of years) of submarine landslide preservation in fjord settings (e.g., Van Daele et al., 2013; Bellwald et al., 2016; Stacey et al., 2018). Additionally, the young timescales of deglaciation in Glacier Bay contrast with studies in other submarine settings such as mid-ocean ridges that have dated substantially older (millions of years) preserved landslides and scarps (e.g., Schlager et al., 2021). Furthermore, our approach focused on large landslides in Glacier Bay (>9,596 m2), which are likely to persist longer than smaller landslides. Some under-representation of smaller landslide scarps suggested by the magnitude-frequency plots (Figure 7) support the likelihood of greater erosion and smoothing of smaller scarps. In general, these data and previous studies indicate that landslides are likely to persist in the bathymetry on the timescales relevant to this study (e.g., Urgeles and Camerlenghi, 2013) and minimize any mapping bias towards localized areas where more scarps are preserved.
The inventory-based landslide susceptibility approach in recently deglaciated terrain also relies on landslide-inducing triggers being reasonably uniform in time. That is, a small number of large events did not trigger the majority of slides as this would heavily bias landslide prevalence toward areas that were already exposed at the time of such events. Many submarine landslide triggers likely exist in Glacier Bay that contribute to triggering uniformity through time and a uniform landslide distribution in space and time. These include iceberg calving (Normandeau et al., 2021), rapid sediment loading and increase in pore pressure from subaerial debris flows entering the submarine environment, and progressive erosion of submarine canyons from submarine currents. However, earthquakes are likely a common trigger that have the capability to initiate landslides throughout the Glacier Bay region, in particular for large landslides that may be tsunamigenic and therefore more hazardous. Plotting earthquake distances from Glacier Bay as a ratio to the maximum landslide-triggering distance observed for that magnitude (see Figure 2C) provides a relative estimate for the effect of potentially landslide-inducing historical earthquakes. However, the exact relationships between landslides and the earthquake depth, magnitude, shaking, or distance from the event are complex and convoluted by factors such as tectonic setting and lithology (e.g., Pope et al., 2017). In general, earthquakes below a ratio of 1 (shown in Figure 2C) could cause landslides and have occurred regularly throughout the period since LIA deglaciation in Glacier Bay. Although no seismic data exists before the late 1800s, the area was likely comparably active for this period of the deglaciation record used in this study.
Interpreting Susceptibility Results
Variations in slope angle and the material properties of sediment likely control landslide susceptibility throughout the study area. However, material properties are not directly measurable or quantifiable with data that are currently available. Our SIinventory approach implicitly accounts for these factors, but regional differences in subaerial geology and sedimentation rates can provide additional clues for observed variations in susceptibility.
Subaerial lithologic units in coastal areas of Glacier Bay range from predominantly felsic-to-intermediate plutonic rocks in the northern parts of the East and West Arms, to carbonate and clastic sedimentary rocks in the southern parts of the Arms and in the southern part of Glacier Bay proper (Figure 3A). Some of these lithologic units are associated with large subaerial rock-slope failures related to glacial retreat both in Glacier Bay (e.g., the Tidal Inlet landslide (Wieczorek et al., 2007 and Figures 3, 11) in carbonate and noncarbonate sedimentary rocks and the Inlet Junction landslide (Coe et al., 2019) in felsic plutonic rocks), and other parts of Alaska (e.g., the Barry Arm landslides (Dai et al., 2020; Coe et al., 2021) in Chugach Flysch, which is also found in areas adjacent to the West Arm (Wilson et al., 2015)). However, it is unclear if the properties that make these bedrock areas susceptible are also at least partially responsible for landslide susceptibility in marine sediments. Susceptibility in sediments would more likely relate to mineralogy and weathering characteristics of underlying lithologies in areas where sediments are proximal to their source, such as downslope from steep fjord walls. Submarine areas at and near the Tidal Inlet and Inlet Junction landslides have moderate to high susceptibility to submarine landslides in sediment (Figure 11).
Variations in the sediment input into Glacier Bay are probably a better proxy for differences in submarine landslide susceptibility than lithology. The East Arm shows a high propensity for landsliding based on both slope (SIslope) and age-adjusted landslide concentrations (SIinventory) (Figure 10). High sediment fluxes since LIA retreat in the East Arm have been documented at rates of 1.3 × 10⁶–4.6 × 10⁷ m3 yr−1 (Cowan et al., 2010). This same area is blanketed by Quaternary sediments (Figure 3A) and contains many fans and deltas (Figure 3B). Total area of all mapped fans and deltas amounts to 20.3 km2 in the East Arm (14.1% of the 146.1 km2 of the East Arm bathymetric data) and 36.5 km2 in the West Arm (only 9.1% of the 401.4 km2 of West Arm bathymetric data). In comparison to the West Arm, retreat of the Muir Glacier in the East Arm has also been more recent (Figure 1), with young proglacial sediments accumulating in the fjord as the glacier retreated. Although sediment dynamics are not explicitly accounted for in either slope- or inventory-based approaches, landslides in active fans and deltas are also more likely where sediment is accumulating (Haeussler et al., 2014). We account for this sediment accumulation by assigning fans and deltas an SIfandelta value of 1, but this approach is also justified by the generally higher susceptibility values for adjacent slopes, which had substantial evidence of landsliding and resulted in high SIslope and SIinventory values (Figure 10).
In general, there is a positive correspondence between the rate of glacier retreat and landslide susceptibility, with areas of relatively rapid retreat having higher susceptibility and areas of slow retreat having lower susceptibility (compare Figures 1, 11). For example, faster retreat in the upper portions of the East Arm, confluence of East and West Arms, and confluence of Queen and Rendu Inlets corresponds with high susceptibility, while slower retreat in the South Bay and at the entrance to the East Arm resulted in lower susceptibility (Supplementary Figure S2). In general, tidewater glaciers retreat faster in deeper water because their mass loss is driven by calving, which scales with depth (Vieli, 2011). Thus, the coincidence between high-susceptibility areas and rapid retreat may be largely related to the morphological characteristics of areas with high submarine relief or to the potential increase in glacially triggered landslides (e.g., from calving). However, other possible explanations for increased susceptibility in areas of rapid retreat include greater glacier erosive strength and faster corresponding sedimentation. Koppes and Hallet (2002) used Muir Inlet to show that tidewater glacial basal ice flux and sediment yields are higher during periods of anomalously high retreat rates. Some of the highest susceptibility areas are also the deepest parts of Glacier Bay (e.g., the West Arm glacial trough and local over-deepenings in the East Arm, Figure 1). The highest susceptibility area in the West Arm is at the intersection of Queen and Rendu Inlets, which has high relief and significant sediment coverage. This area also coincides with the location of a large (approximately 3 km across) turbidite fan originating from the delta at the head of Queen Inlet, which may suggest rapid and sporadic sediment accumulation of varying grain sizes (Figure 3B).
Historical Context and Potential Future Research Directions
The results shown in our composite susceptibility map (Figure 11) are based on up to 250 years of landslide activity. Mapped scarps used to create the susceptibility map could have been generated by a wide variety of triggers through time. Possible earthquake triggers shown in Figure 2 indicate a long history of large and small earthquakes throughout the entire study area, which would diminish the biasing effect on our inventory from small earthquakes inducing localized landslides. Likewise, the benefits of a cumulative inventory over an inventory resulting from a single event include our ability to incorporate multiple triggering mechanisms and better determine a broad regional tendency to produce landslides. With the addition of glacial extent mapping, we add knowledge of temporal constraints, which would not be the case with an undated cumulative landslide landslide inventory. When a single triggering event occurs in the region (i.e., a large earthquake), the acquisition of a new set of bathymetric data and the collection of a new landslide inventory would provide a dataset with which to refine and test the validity of our time-integrated susceptibility map and further improve our understanding of submarine landslide susceptibility in response to specific triggers. For future studies, our results provide baseline data that can be used to evaluate new landslides.
In Glacier Bay, the moderate coincidence between locations of highest submarine landslide susceptibility (for sediments) and locations of documented, rock-dominated, subaerial landslides warrants further investigation (Figure 11). Discrepancies in coincidence highlight the importance of assessing coastal areas for all types of landslides. Well-known subaerial landslides along coasts often receive academic and journalistic attention and sometimes show detectable precursor movement prior to catastrophic failure (e.g., Higman et al., 2018), a luxury not available for tsunamigenic “surprise” submarine landslides in unmapped or poorly mapped areas (e.g., Ward, 2001; Fine et al., 2005). With many studies documenting the risk associated with submerged fans and deltas as sources of coseismic landslide-induced tsunamis (e.g., Haeussler et al., 2014; L’Heureux et al., 2014; Brothers et al., 2016), and the importance of subaerial-to-submarine landslides in generating tsunamis (e.g., Dai et al., 2020; Barnhart et al., 2021), integrating both submarine and subaerial data would be important to fully understand potential tsunami hazards. For example, subaerial DEMs and images were critical to accurately incorporating fans and deltas in our susceptibility work. Although the largest landslides in our submarine inventory represent approximate minimum volumes associated with notable tsunamigenic landslides (about 1 × 10⁶ m3; e.g., Murty, 2003), landslide-tsunami size correlations are variable, and actual wave heights depend on a wide range of local factors besides volume, including slope angle, depth, fjord geometry, material properties, and duration of failure (Murty, 2003). As a result, relatively large waves may be generated from relatively small slides (e.g., Bardet et al., 2003; Murty, 2003; Okal and Synolakis, 2003). Although our results are regional in scope, identified areas of high-to-moderate susceptibility could be used to inform localized tsunami modelling using a probable range of landslide volume and runout scenarios for hazard and risk forecasting. Furthermore, our susceptibility map addresses landslides in submarine sediments, but further research could be done on both submarine and subaerial bedrock failures in and near water, as these failures depend on a different set of controlling factors (e.g., fracture patterns and rock mass quality) that are highly localized and difficult to map. Additionally, a model of glacial dynamics for the last ∼250 years could shed light on the effects of rapid versus slow glacial retreat.
Conclusion
Submarine landslide susceptibility can be difficult to model and map because of limitations in availability and quality of bathymetric data, substrate maps, and geotechnical data. Although limited data are available for submarine environments, submarine landslides of moderate to large sizes (source areas >∼10,000 m2) are numerous and their scarps are generally discernable in medium resolution bathymetric data (e.g., 5 m) in post-glacial environments.
In this study, in Glacier Bay, Alaska, we showed that landslide susceptibility in sediments within a recently deglaciated submarine environment can be derived from the concentration of landslide scarps using the timing of submarine slope exposure from deglaciation. We did this work in Glacier Bay because it has one of the fastest post-LIA glacial retreat rates in the world, with records of retreat for the last ∼250 years. However, our method can be applied to other areas where landslide age constraints can be determined from deglaciation records. Given the ongoing degradation of glaciated terrain from increasing global temperatures (Hock et al., 2019), our approach may be useful for assessing submarine landslide susceptibility in glaciated mountainous terrain in many parts of the world.
We demonstrate that trends in regional susceptibility can be mapped where landslide-controlling variables are poorly known. We established a mean positive correlation between the concentration of landslides and the age of exposure from glacial retreat and used local variations from that mean to map relative landslide susceptibility. Additionally, we used geomorphology and slope angle to refine susceptibility values. Our method is flexible enough to incorporate other factors such as the strength of material in fans and deltas, a new inventory following an earthquake, or more precise ages of landslides if such data become available in the future.
Our results show generally high landslide susceptibility in narrow and steep fjords and inlets, and lower susceptibility in broad open bays. In general, we observe a moderate correspondence between areas of high submarine landslide susceptibility and subaerial terrain prone to landslides, but further research would be beneficial to better understand and integrate landslide hazards in both environments, especially in regions with rapidly degrading cryospheric terrain such as Glacier Bay.
Data Availability Statement
The data used in this study are publicly available and can be found in Avdievitch, N. N., Schmitt, R. G., and Coe, J. A. (2020). Inventory map of submarine and subaerial-to-submarine landslides in Glacier Bay, Glacier Bay National Park and Preserve, Alaska. U.S. Geological Survey data release. https://doi.org/10.5066/P9GCDYT2.
Author Contributions
NA and JC conceived the study. NA conducted landslide and geomorphic mapping with input and review from JC. NA executed analyses with input from JC. NA and JC interpreted results and contributed to manuscript text.
Funding
This work was supported by the 2019 USGS Supplemental Appropriations for Disaster Recovery Activities from the U.S. Disaster Relief Act and the USGS Landslide Hazards Program.
Conflict of Interest
The authors declare that the research was conducted in the absence of any commercial or financial relationships that could be construed as a potential conflict of interest.
Publisher’s Note
All claims expressed in this article are solely those of the authors and do not necessarily represent those of their affiliated organizations, or those of the publisher, the editors and the reviewers. Any product that may be evaluated in this article, or claim that may be made by its manufacturer, is not guaranteed or endorsed by the publisher.
Acknowledgments
We thank Chad Hults, Lisa Etherington, Kate Allstadt, Sean Lahusen, Brian Collins, Eric Thompson, and Bill Stephenson for valuable discussions that helped shape the study. Constructive reviews by Dennis Staley, Janet Carter, Rex Baum, and two Frontiers reviewers improved the paper. We thank Bill Schulz for his review of the landslide inventory, and National Park Service research vessel captain Justin Smith for his expert guidance and patience during fieldwork in the summer of 2021. Fieldwork was conducted through National Park Service Scientific Research and Collecting Permit GLBA-2021-SCI-0012. Any use of trade, firm, or product names is for descriptive purposes only and does not imply endorsement by the U.S. Government.
Supplementary Material
The Supplementary Material for this article can be found online at: https://www.frontiersin.org/articles/10.3389/feart.2022.821188/full#supplementary-material
References
Alstott, J., Bullmore, E., and Plenz, D. (2014). Powerlaw: A Python Package for Analysis of Heavy-Tailed Distributions. PLoS One 9 (1), e85777. doi:10.1371/journal.pone.0085777
Avdievitch, N. N., Schmitt, R. G., and Coe, J. A. (2020). Inventory Map of Submarine and Subaerial-To-Submarine Landslides in Glacier Bay, Glacier Bay National Park and Preserve, Alaska. U.S. Geological Survey data release. doi:10.5066/P9GCDYT2
Ballantyne, C. K. (2002). Paraglacial Geomorphology. Quat. Sci. Rev. 21 (18–19), 1935–2017. doi:10.1016/s0277-3791(02)00005-7
Bardet, J.-P., Synolakis, C. E., Davies, H. L., Imamura, F., and Okal, E. A. (2003). Landslide Tsunamis: Recent Findings and Research Directions. Pure Appl. Geophys. 160 (10–11), 1793–1809. doi:10.1007/978-3-0348-7995-8_1
Barnhart, K. R., Jones, R. P., George, D. L., Coe, J. A., and Staley, D. M. (2021). Preliminary Assessment of the Wave Generating Potential from Landslides at Barry Arm, Prince William Sound. U.S. Geological Survey Open-File Report 2021–1071, 28. doi:10.3133/ofr20211071
Beakawi Al-Hashemi, H. M., and Baghabra Al-Amoudi, O. S. (2018). A Review on the Angle of Repose of Granular Materials. Powder Techn. 330, 397–417. doi:10.1016/j.powtec.2018.02.003
Bell, R., Petschko, H., Röhrs, M., and Dix, A. (2012). Assessment of Landslide Age, Landslide Persistence and Human Impact Using Airborne Laser Scanning Digital Terrain Models. Geografiska Annaler: Ser. A, Phys. Geogr. 94 (1), 135–156. doi:10.1111/j.1468-0459.2012.00454.x
Bellwald, B., Hjelstuen, B. O., Sejrup, H. P., and Haflidason, H. (2016). Postglacial Mass Movements and Depositional Environments in a High-Latitude Fjord System - Hardangerfjorden, Western Norway. Mar. Geol. 379, 157–175. doi:10.1016/j.margeo.2016.06.002
Bessette-Kirton, E. K., and Coe, J. A. (2020). A 36-Year Record of Rock Avalanches in the Saint Elias Mountains of Alaska, with Implications for Future Hazards. Front. Earth Sci. 8, 293. doi:10.3389/feart.2020.00293
Booth, A. M., LaHusen, S. R., Duvall, A. R., and Montgomery, D. R. (2017). Holocene History of Deep‐Seated Landsliding in the North Fork Stillaguamish River Valley from Surface Roughness Analysis, Radiocarbon Dating, and Numerical Landscape Evolution Modeling. J. Geophys. Res. Earth Surf. 122 (2), 456–472. doi:10.1002/2016jf003934
Bottino, G., Chiarle, M., Joly, A., and Mortara, G. (2002). Modelling Rock Avalanches and Their Relation to Permafrost Degradation in Glacial Environments. Permafrost Periglac. Process. 13 (4), 283–288. doi:10.1002/ppp.432
Brew, D. A. (2008). Delineation of Landform and Lithologic Units for Ecological Landtype-Association Analysis in Glacier Bay National Park, Southeast Alaska. U.S. Geological Survey Scientific Investigations Report 2008-5183.
Brothers, D. S., Andrews, B. D., Walton, M. A. L., Greene, H. G., Barrie, J. V., Miller, N. C., et al. (2019). Slope Failure and Mass Transport Processes along the Queen Charlotte Fault, southeastern Alaska. Geol. Soc. Lond. Spec. Publications 477 (1), 69–83. doi:10.1144/sp477.30
Brothers, D. S., Haeussler, P. J., Liberty, L., Finlayson, D., Geist, E., Labay, K., et al. (2016). A Submarine Landslide Source for the Devastating 1964 Chenega Tsunami, Southern Alaska. Earth Planet. Sci. Lett. 438, 112–121. doi:10.1016/j.epsl.2016.01.008
Bucknam, R. C., and Anderson, R. E. (1979). Estimation of Fault-Scarp Ages from a Scarp-Height-Slope-Angle Relationship. Geology 7 (1), 11–14. doi:10.1130/0091-7613(1979)7<11:eofafa>2.0.co;2
Bufe, C. G., Nishenko, S. P., and Varnes, D. J. (1994). Seismicity Trends and Potential for Large Earthquakes in the Alaska-Aleutian Region. Pageoph 142 (1), 83–99. doi:10.1007/bf00875969
Casas, D., Chiocci, F., Casalbore, D., Ercilla, G., and de Urbina, J. O. (2016). Magnitude-frequency Distribution of Submarine Landslides in the Gioia Basin (Southern Tyrrhenian Sea). Geo-Mar Lett. 36 (6), 405–414. doi:10.1007/s00367-016-0458-2
Chaytor, J. D., ten Brink, U. S., Solow, A. R., and Andrews, B. D. (2009). Size Distribution of Submarine Landslides along the U.S. Atlantic Margin. Mar. Geology. 264 (1–2), 16–27. doi:10.1016/j.margeo.2008.08.007
Chiba, T., Kaneta, S., and Suzuki, Y. (2008). Red Relief Image Map: New Visualization Method for Three Dimensional Data. Int. Arch. Photogramm. Remote Sens. Spat. Inf. Sci. 37 (B2), 1071–1076.
Clague, J. J., and Evans, S. G. (1993). Historic Retreat of Grand Pacific and Melbern Glaciers Saint Elias Mountains, Canada: An Analogue for Decay of the Cordilleran Ice Sheet at the End of the Pleistocene? J. Glaciol. 39 (133), 619–624. doi:10.3189/s0022143000016518
Clarke, J. E. H., Marques, C. R. V., and Pratomo, D. (2014). “Imaging Active Mass-Wasting and Sediment Flows on a Fjord delta, Squamish, British Columbia,” in Submarine Mass Movements and Their Consequences. Editors S. Krastel, J. H. Behrmann, D. Völker, M. Stipp, C. Berndt, R. Urgeleset al. (Springer International Publishing), 37, 249–260. doi:10.1007/978-3-319-00972-8_22
Clauset, A., Shalizi, C. R., and Newman, M. E. J. (2009). Power-Law Distributions in Empirical Data. SIAM Rev. 51 (4), 661–703. doi:10.1137/070710111
Cody, E., Anderson, B. M., McColl, S. T., Fuller, I. C., and Purdie, H. L. (2020). Paraglacial Adjustment of Sediment Slopes during and Immediately after Glacial Debuttressing. Geomorphology 371, 107411. doi:10.1016/j.geomorph.2020.107411
Coe, J. A., Bessette-Kirton, E. K., and Geertsema, M. (2018). Increasing Rock-Avalanche Size and Mobility in Glacier Bay National Park and Preserve, Alaska Detected from 1984 to 2016 Landsat Imagery. Landslides 15 (3), 393–407. doi:10.1007/s10346-017-0879-7
Coe, J. A., Schmitt, R. G., and Bessette-Kirton, E. (2019). An Initial Assessment of Areas where Landslides Could Enter the West Arm of Glacier Bay, Alaska and Implications for Tsunami Hazards. Alsk. Park Sci. 18 (1), 26–37.
Coe, J. A., Wolken, G. J., Daanen, R. P., and Schmitt, R. G. (2021). Map of Landslide Structures and Kinematic Elements at Barry Arm, Alaska in the Summer of 2020. U.S. Geological Survey data release. doi:10.5066/P9EUCGJQ
Collico, S., Arroyo, M., Urgeles, R., Gràcia, E., Devincenzi, M., and Peréz, N. (2020). Probabilistic Mapping of Earthquake-Induced Submarine Landslide Susceptibility in the South-West Iberian Margin. Mar. Geology. 429, 106296. doi:10.1016/j.margeo.2020.106296
Cowan, E. A., Seramur, K. C., Powell, R. D., Willems, B. A., Gulick, S. P. S., and Jaeger, J. M. (2010). Fjords as Temporary Sediment Traps: History of Glacial Erosion and Deposition in Muir Inlet, Glacier Bay National Park, southeastern Alaska. Geol. Soc. Am. Bull. 122 (7–8), 1067–1080. doi:10.1130/b26595.1
Dai, C., Higman, B., Lynett, P. J., Jacquemart, M., Howat, I. M., Liljedahl, A. K., et al. (2020). Detection and Assessment of a Large and Potentially Tsunamigenic Periglacial Landslide in Barry Arm, Alaska. Geophys. Res. Lett. 47 (22), e2020GL089800. doi:10.1029/2020GL089800
De Blasio, F. V., Elverhøi, A., Engvik, L. E., Issler, D., Gauer, P., and Harbitz, C. (2006). Understanding the High Mobility of Subaqueous Debris Flows. Nor. J. Geol. 86 (3).
Elliott, J. L., Larsen, C. F., Freymueller, J. T., and Motyka, R. J. (2010). Tectonic Block Motion and Glacial Isostatic Adjustment in Southeast Alaska and Adjacent Canada Constrained by GPS Measurements. J. Geophys. Res. 115 (B9), B09407. doi:10.1029/2009jb007139
Evans, S. G., and Clague, J. J. (1994). Recent Climatic Change and Catastrophic Geomorphic Processes in Mountain Environments. Geomorphology 10 (1-4), 107–128. doi:10.1016/B978-0-444-82012-9.50012-8
Fan, W., McGuire, J. J., and Shearer, P. M. (2020). Abundant Spontaneous and Dynamically Triggered Submarine Landslides in the Gulf of Mexico. Geophys. Res. Lett. 47 (12), e2020GL087213. doi:10.1029/2020gl087213
Fine, I. V., Rabinovich, A. B., Bornhold, B. D., Thomson, R. E., and Kulikov, E. A. (2005). The Grand Banks Landslide-Generated Tsunami of November 18, 1929: Preliminary Analysis and Numerical Modeling. Mar. Geology. 215 (1–2), 45–57. doi:10.1016/j.margeo.2004.11.007
Fritz, H. M. (2001). Lituya Bay Case Rockslide Impact and Wave Run-Up. Int. J. Tsunami Soc. 19 (1), 3–22.
Geist, E. L., Jakob, M., Wieczorek, G. F., and Dartnell, P. (2003). Preliminary Hydrodynamic Analysis of Landslide-Generated Waves in Tidal Inlet, Glacier Bay National Park. Alaska, U.S. Geological Survey OFR 03-411. doi:10.3133/ofr03411
Görüm, T. (2019). Tectonic, Topographic and Rock-type Influences on Large Landslides at the Northern Margin of the Anatolian Plateau. Landslides 16 (2), 333–346. doi:10.1007/s10346-018-1097-7
Grämiger, L. M., Moore, J. R., Gischig, V. S., Ivy-Ochs, S., and Loew, S. (2017). Beyond Debuttressing: Mechanics of Paraglacial Rock Slope Damage during Repeat Glacial Cycles. J. Geophys. Res. Earth Surf. 122 (4), 1004–1036. doi:10.1002/2016JF003967
Gruber, S. (2012a). Derivation and Analysis of a High-Resolution Estimate of Global Permafrost Zonation. Cryosphere 6 (1), 221–233. doi:10.5194/tc-6-221-2012
Gruber, S. (2012b). Global Permafrost Zonation Index Map. Available at: http://www.geo.uzh.ch/microsite/cryodata/pf_global/ (Accessed December, 2020).
Haeussler, P. J., Lee, H. J., Ryan, H. F., Labay, K., Kayen, R. E., Hampton, M. A., et al. (2007). “Submarine Slope Failures Near Seward, Alaska, During the M9.2 1964 Earthquake,” in Submarine Mass Movements and Their Consequences. Editors V. Lykousis, D. Sakellariou, and J. Locat (Springer Netherlands), 269–278. doi:10.1007/978-1-4020-6512-5_28
Haeussler, P. J., Parsons, T., Finlayson, D. P., Hart, P., Chaytor, J. D., Ryan, H., et al. (2014). “New Imaging of Submarine Landslides from the 1964 Earthquake Near Whittier, Alaska, and a Comparison to Failures in Other Alaskan Fjords,” in Submarine Mass Movements and Their Consequences. Editors S. Krastel, J. H. Behrmann, D. Völker, M. Stipp, C. Berndt, and R. Urgeles (Springer International Publishing), 37, 361–370. doi:10.1007/978-3-319-00972-8_32
Hampton, M. A., Lee, H. J., and Locat, J. (1996). Submarine Landslides. Rev. Geophys. 34 (1), 33–59. doi:10.1029/95rg03287
Hansen, L., L’Heureux, J. S., Longva, O., Eilertsen, R. S., and Bøe, R. (2013). “Mapping of Subaqueous Landforms for Near-Shore Landslide Susceptibility Assessment along Norwegian Fjords,” in Landslide Science and Practice. (Berlin, Heidelberg: Springer). doi:10.1007/978-3-642-31427-8_11
Hansen, W. R. (1966). The Alaska Earthquake, March 27, 1964: Field Investigations and Reconstruction Effort. U.S. Geological Survey Professional Paper 541:111. doi:10.3133/pp541
Harbitz, C. B., Løvholt, F., and Bungum, H. (2014). Submarine Landslide Tsunamis: How Extreme and How Likely? Nat. Hazards 72 (3), 1341–1374. doi:10.1007/s11069-013-0681-3
Harvey, A. (2018). “Alluvial Fans,” in Reference Module in Earth Systems and Environmental Sciences (B9780124095489110000). (Elsevier). doi:10.1016/b978-0-12-409548-9.11066-8
Heezen, B. C., Tharp, M., and Ewing, M. (1959). The Floors of the Oceans. Geol. Soc. Am. Spec. Pap. 65, 1–126. doi:10.1130/spe65-p1
Heijnen, M. S., Clare, M. A., Cartigny, M. J. B., Talling, P. J., Hage, S., Lintern, D. G., et al. (2020). Rapidly-Migrating and Internally-Generated Knickpoints can Control Submarine Channel Evolution. Nat. Commun. 11, 3129. doi:10.1038/s41467-020-16861-x
Hermanns, R. L., Hansen, L., Sletten, K., Böhme, M., Bunkholt, H. S. S., Dehls, J. F., et al. (2012). “Systematic Geological Mapping for Landslide Understanding in the Norwegian Context,” in Landslide and Engineered Slopes: Protecting Society Through Improved Understanding, 265–271. Editors E. Eberhardt, C. Froese, K. Turner, and S. Leroueil (London: Taylor & Francis Group).
Hermanns, R. L., L’Heureux, J. S., and Blikra, L. H. (2013). “Landslide Triggered Tsunami, Displacement Wave,” in Encyclopedia of Natural Hazards, 611–615. Editor P. T. Bobrowsky (Springer Netherlands). doi:10.1007/978-1-4020-4399-4_95
Higman, B., Shugar, D. H., Stark, C. P., Ekström, G., Koppes, M. N., Lynett, P., et al. (2018). The 2015 Landslide and Tsunami in Taan Fiord, Alaska. Sci. Rep. 8 (1), 12993. doi:10.1038/s41598-018-30475-w
Hilger, P., Hermanns, R. L., Czekirda, J., Myhra, K. S., Gosse, J. C., and Etzelmüller, B. (2021). Permafrost as a First Order Control on Long-Term Rock-Slope Deformation in (Sub-)Arctic Norway. Quat. Sci. Rev. 251, 106718. doi:10.1016/j.quascirev.2020.106718
Hock, R., Rasul, G., Adler, C., Cáceres, B., Gruber, S., Hirabayashi, Y., et al. (2019). “High Mountain Areas,” in IPCC Special Report on the Ocean and Cryosphere in a Changing Climate. Editors H.-O. Pörtner, D. C. Roberts, V. Masson-Delmotte, P. Zhai, M. Tignor, and E. Poloczanska (Geneva: IPCC).
Hughes, K. S., and Schulz, W. H. (2020). Map Depicting Susceptibility to Landslides Triggered by Intense Rainfall, Puerto Rico. U.S. Geol. Surv. 2020–1022, 91. doi:10.3133/ofr20201022
Innocenti, C., Battaglini, L., D'Angelo, S., and Fiorentino, A. (2021). Submarine Landslides: Mapping the Susceptibility in European Seas. Q. J. Eng. Geol. Hydrogeol. 54 (1), qjegh2020–027. doi:10.1144/qjegh2020-027
Johnson, H. P., Gomberg, J. S., Hautala, S. L., and Salmi, M. S. (2017). Sediment Gravity Flows Triggered by Remotely Generated Earthquake Waves. J. Geophys. Res. Solid Earth 122 (6), 4584–4600. doi:10.1002/2016jb013689
Katz, O., Reuven, E., and Aharonov, E. (2015). Submarine Landslides and Fault Scarps along the Eastern Mediterranean Israeli continental-slope. Mar. Geol. 369, 100–115. doi:10.1016/j.margeo.2015.08.006
Keefer, D. K. (1984). Landslides Caused by Earthquakes. Geol. Soc. Am. Bull. 95 (4), 406–421. doi:10.1130/0016-7606(1984)95<406:lcbe>2.0.co;2
Kleinhans, M. G., Markies, H., de Vet, S. J., and in ’t Veld, F. N. (2011). Static and Dynamic Angles of Repose in Loose Granular Materials under Reduced Gravity. J. Geophys. Res. 116 (E11), E11004. doi:10.1029/2011je003865
Kleinhans, M. G. (2004). Sorting in Grain Flows at the lee Side of Dunes. Earth-Sci. Rev. 65 (1–2), 75–102. doi:10.1016/s0012-8252(03)00081-3
Klotz, O. J. (1899). Notes on Glaciers of South-Eastern Alaska and Adjoining Territory. Geograph. J. 14 (5), 523. doi:10.2307/1774540
Koppes, M. N., and Hallet, B. (2002). Influence of Rapid Glacial Retreat on the Rate of Erosion by Tidewater Glaciers. Geology 30 (1), 47–50. doi:10.1130/0091-7613(2002)030<0047:iorgro>2.0.co;2
Kos, A., Amann, F., Strozzi, T., Delaloye, R., Ruette, J., and Springman, S. (2016). Contemporary Glacier Retreat Triggers a Rapid Landslide Response, Great Aletsch Glacier, Switzerland. Geophys. Res. Lett. 43 (24), 12466–12474. doi:10.1002/2016gl071708
Lacelle, D., Brooker, A., Fraser, R. H., and Kokelj, S. V. (2015). Distribution and Growth of Thaw Slumps in the Richardson Mountains-Peel Plateau Region, Northwestern Canada. Geomorphology 235, 40–51. doi:10.1016/j.geomorph.2015.01.024
LaHusen, S. R., Duvall, A. R., Booth, A. M., Grant, A., Mishkin, B. A., Montgomery, D. R., et al. (2020). Rainfall Triggers More Deep-Seated Landslides Than Cascadia Earthquakes in the Oregon Coast Range, USA. Sci. Adv. 6 (38), eaba6790. doi:10.1126/sciadv.aba6790
LaHusen, S. R., Duvall, A. R., Booth, A. M., and Montgomery, D. R. (2016). Surface Roughness Dating of Long-Runout Landslides Near Oso, Washington (USA), Reveals Persistent Postglacial Hillslope Instability. Geology 44 (2), 111–114. doi:10.1130/g37267.1
Larsen, C. F., Motyka, R. J., Freymueller, J. T., Echelmeyer, K. A., and Ivins, E. R. (2004). Rapid Uplift of Southern Alaska Caused by Recent Ice Loss. Geophys. J. Int. 158 (3), 1118–1133. doi:10.1111/j.1365-246x.2004.02356.x
Larsen, C. F., Motyka, R. J., Freymueller, J. T., Echelmeyer, K. A., and Ivins, E. R. (2005). Rapid Viscoelastic Uplift in Southeast Alaska Caused by post-Little Ice Age Glacial Retreat. Earth Planet. Sci. Lett. 237 (3–4), 548–560. doi:10.1016/j.epsl.2005.06.032
Larsen, I. J., Montgomery, D. R., and Korup, O. (2010). Landslide Erosion Controlled by Hillslope Material. Nat. Geosci 3 (4), 247–251. doi:10.1038/ngeo776
Lee, H. J., Kayen, R. E., Gardner, J. V., and Locat, J. (2003). “Characteristics of Several Tsunamigenic Submarine Landslides,” in Submarine Mass Movements and Their Consequences. Editors J. Locat, J. Mienert, and L. Boisvert (Springer Netherlands), 19, 357–366. doi:10.1007/978-94-010-0093-2_39
Lee, H., Ryan, H., Kayen, R. E., Haeussler, P. J., Dartnell, P., and Hampton, M. A. (2006). Varieties of Submarine Failure Morphologies of Seismically-Induced Landslides in Alaskan Fjords. Nor. J. Geol. 86 (3), 221–230.
L’Heureux, J. S., Hansen, L., Longva, O., and Eilertsen, R. S. (2013). “Landslides along Norwegian Fjords: Causes and Hazard Assessment,” in Landslide Science and Practice. Editors C. Margottini, P. Canuti, and K. Sassa (Berlin, Heidelberg: Springer). doi:10.1007/978-3-642-31427-8_10
L’Heureux, J. S., Longva, O., Hansen, L., and Vanneste, M. (2014). “The 1930 Landslide in Orkdalsfjorden: Morphology and Failure Mechanism,” in Submarine Mass Movements and Their Consequences. Editors S. Krastel, J. H. Behrmann, D. Völker, M. Stipp, C. Berndt, and R. Urgeles (Springer International Publishing), 37, 239–247. doi:10.1007/978-3-319-00972-8_21
Locat, J., and Lee, H. J. (2002). Submarine Landslides: Advances and Challenges. Can. Geotech. J. 39 (1), 193–212. doi:10.1139/t01-089
MacKillop, K., Fenton, G., Mosher, D., Latour, V., and Mitchelmore, P. (2018). Assessing Submarine Slope Stability through Deterministic and Probabilistic Approaches: A Case Study on the West-Central Scotia Slope. Geosciences 9 (1), 18. doi:10.3390/geosciences9010018
Malamud, B. D., Turcotte, D. L., Guzzetti, F., and Reichenbach, P. (2004). Landslide Inventories and Their Statistical Properties. Earth Surf. Process. Landf. 29 (6), 687–711. doi:10.1002/esp.1064
Mann, D. H. (1986). “Wisconsin and Holocene Glaciation of Southeast Alaska,” in Glaciation in Alaska. Editors T. D. Hamilton, K. M. Reed, and R. M. Thorson (Anchorage: Alaska Geological Society), 237–265.
Margottini, C., Canuti, P., and Sassa, K. (2013). Landslide Science and Practice: Volume 5: Complex Environment. (Springer Science & Business Media). doi:10.1007/978-3-642-31427-8
Masson, D. G., Harbitz, C. B., Wynn, R. B., Pedersen, G., and Løvholt, F. (20061845). Submarine Landslides: Processes, Triggers and hazard Prediction. Phil. Trans. R. Soc. A. 364, 2009–2039. doi:10.1098/rsta.2006.1810
Mazières, A., Gillet, H., Castelle, B., Mulder, T., Guyot, C., Garlan, T., et al. (2014). High-resolution Morphobathymetric Analysis and Evolution of Capbreton Submarine canyon Head (Southeast Bay of Biscay-French Atlantic Coast) over the Last Decade Using Descriptive and Numerical Modeling. Mar. Geology. 351, 1–12. doi:10.1016/j.margeo.2014.03.001
McAdoo, B. G., Pratson, L. F., and Orange, D. L. (2000). Submarine Landslide Geomorphology, US continental Slope. Mar. Geol. 169 (1–2), 103–136. doi:10.1016/s0025-3227(00)00050-5
McColl, S. T., and Davies, T. R. H. (2013). Large Ice-Contact Slope Movements: Glacial Buttressing, Deformation and Erosion. Earth Surf. Process. Landf. 38 (10), 1102–1115. doi:10.1002/esp.3346
McNabb, R. W., and Hock, R. (2014). Alaska Tidewater Glacier Terminus Positions, 1948-2012. J. Geophys. Res. Earth Surf. 119 (2), 153–167. doi:10.1002/2013jf002915
McPherson, J. G., Shanmugam, G., and Moiola, R. J. (1987). Fan-Deltas and Braid Deltas: Varieties of Coarse-Grained Deltas. Geol. Soc. Am. Bull. 99 (3), 331–340. doi:10.1130/0016-7606(1987)99<331:fabdvo>2.0.co;2
Molnia, B. F., Karpilo, R. D., and Pranger, H. S. (2007). “Documenting More Than a century of Glacier Bay Landscape Evolution with Historical Photography,” in Proceedings of the Fourth Glacier Bay Science Symposium: U.S. Editors J. F. Piatt, and S. M. Gende (Geological Survey Scientific Investigations Report 2007-5047), 60–65.
Molnia, B. F. (2007). Late Nineteenth to Early Twenty-First century Behavior of Alaskan Glaciers as Indicators of Changing Regional Climate. Glob. Planet. Change 56 (1–2), 23–56. doi:10.1016/j.gloplacha.2006.07.011
Morse, F. (1908). The Recession of the Glaciers of Glacier Bay, Alaska. Natl. Geogr. Mag. 19, 76–78.
Mountjoy, J. J., Howarth, J. D., Orpin, A. R., Barnes, P. M., Bowden, D. A., Rowden, A. A., et al. (2018). Earthquakes Drive Large-Scale Submarine canyon Development and Sediment Supply to Deep-Ocean Basins. Sci. Adv. 4, eaar3748. doi:10.1126/sciadv.aar3748
Mueller, C. S., Briggs, R. W., Wesson, R. L., and Petersen, M. D. (2015). Updating the USGS Seismic hazard Maps for Alaska. Quat. Sci. Rev. 113, 39–47. doi:10.1016/j.quascirev.2014.10.006
Murty, T. S. (2003). Tsunami Wave Height Dependence on Landslide Volume. Pure Appl. Geophys. 160 (10–11), 2147–2153. doi:10.1007/978-3-0348-7995-8_17
Niu, F., Luo, J., Lin, Z., Liu, M., and Yin, G. (2014). Thaw-Induced Slope Failures and Susceptibility Mapping in Permafrost Regions of the Qinghai-Tibet Engineering Corridor, China. Nat. Hazards 74 (3), 1667–1682. doi:10.1007/s11069-014-1267-4
Normandeau, A., Campbell, D. C., Piper, D. J. W., and Jenner, K. A. (2019a). Are Submarine Landslides an Underestimated hazard on the Western North Atlantic Passive Margin? Geology 47 (9), 848–852. doi:10.1130/g46201.1
Normandeau, A., Dietrich, P., and Hughes Clarke, J. (2019b). Retreat Pattern of Glaciers Controls the Occurrence of Turbidity Currents on High‐latitude Fjord Deltas (Eastern Bafin Island). J. Geophys. Res. Earth Surf. 124, 1–13. doi:10.1029/2018jf004970
Normandeau, A., Bourgault, D., Neumeier, U., Lajeunesse, P., St‐Onge, G., Gostiaux, L., et al. (2020). Storm‐induced Turbidity Currents on a Sediment‐Starved Shelf: Insight from Direct Monitoring and Repeat Seabed Mapping of Upslope Migrating Bedforms. Sedimentology 67, 1045–1068. doi:10.1111/sed.12673
Normandeau, A., Mackillop, K., Macquarrie, M., Richards, C., Bourgault, D., Campbell, D. C., et al. (2021). Submarine Landslides Triggered by Iceberg Collision with the Seafloor. Nat. Geosci. 14, 599–605. doi:10.1038/s41561-021-00767-4
Okal, E. A., and Synolakis, C. E. (2003). A Theoretical Comparison of Tsunamis from Dislocations and Landslides. Pure Appl. Geophys. 160 (10–11), 2177–2188. doi:10.1007/978-3-0348-7995-8_19
Patton, A. I., Rathburn, S. L., and Capps, D. M. (2019). Landslide Response to Climate Change in Permafrost Regions. Geomorphology 340, 116–128. doi:10.1016/j.geomorph.2019.04.029
Pope, E. L., Talling, P. J., and Carter, L. (2017). Which Earthquakes Trigger Damaging Submarine Mass Movements: Insights from a Global Record of Submarine Cable Breaks? Mar. Geology. 384, 131–146. doi:10.1016/j.margeo.2016.01.009
Powell, R. D. (1980). Holocene Glacimarine Sediment Deposition by Tidewater Glaciers in Glacier Bay, Alaska. Doctoral dissertation. The Ohio State University.
Prancevic, J. P., Lamb, M. P., McArdell, B. W., Rickli, C., and Kirchner, J. W. (2020). Decreasing Landslide Erosion on Steeper Slopes in Soil‐Mantled Landscapes. Geophys. Res. Lett. 47 (10), 9. doi:10.1029/2020gl087505
Reichenbach, P., Rossi, M., Malamud, B. D., Mihir, M., and Guzzetti, F. (2018). A Review of Statistically-Based Landslide Susceptibility Models. Earth-Science Rev. 180, 60–91. doi:10.1016/j.earscirev.2018.03.001
Roering, J. (2012). Landslides Limit Mountain Relief. Nat. Geosci. 5 (7), 446–447. doi:10.1038/ngeo1511
Schlager, U., Jokat, W., Weigelt, E., and Gebhardt, C. (2021). Submarine Landslides along the Siberian Termination of the Lomonosov Ridge, Arctic Ocean. Geomorphology 382, 107679. doi:10.1016/j.geomorph.2021.107679
Schnellmann, M., Anselmetti, F. S., Giardini, D., and Mckenzie, J. A. (2006). 15,000 Years of Mass-Movement History in Lake Lucerne: Implications for Seismic and Tsunami Hazards. Eclogae Geol. Helv. 99 (3), 409–428. doi:10.1007/s00015-006-1196-7
Seramur, K. C., Powell, R. D., and Carlson, P. R. (1997). Evaluation of Conditions along the Grounding Line of Temperate marine Glaciers: an Example from Muir Inlet, Glacier Bay, Alaska. Mar. Geol. 140 (3–4), 307–327. doi:10.1016/s0025-3227(97)00026-1
Smith, D. P., Ruiz, G., Kvitek, R., and Iampietro, P. J. (2005). Semiannual Patterns of Erosion and Deposition in Upper Monterey Canyon from Serial Multibeam Bathymetry. Geol. Soc. Am. Bull. 117, 1123–1133. doi:10.1130/b25510.1
Stacey, C. D., Hill, P. R., Talling, P. J., Enkin, R. J., Hughes Clarke, J., and Lintern, D. G. (2019). How Turbidity Current Frequency and Character Varies Down a Fjord-delta System: Combining Direct Monitoring, Deposits and Seismic Data. Sedimentology 66, 1–31. doi:10.1111/sed.12488
Stacey, C. D., Lintern, D. G., and Enkin, R. J. (2018). Multifaceted Re-analysis of the Enigmatic Kitimat Slide Complex, Canada. Sediment. Geol. 369, 46–59. doi:10.1016/j.sedgeo.2018.01.006
Stark, C. P., and Hovius, N. (2001). The Characterization of Landslide Size Distributions. Geophys. Res. Lett. 28 (6), 1091–1094. doi:10.1029/2000gl008527
Strasser, M., Hilbe, M., and Anselmetti, F. S. (2011). Mapping Basin-Wide Subaquatic Slope Failure Susceptibility as a Tool to Assess Regional Seismic and Tsunami Hazards. Mar. Geophys. Res. 32 (1–2), 331–347. doi:10.1007/s11001-010-9100-2
Strasser, M., Monecke, K., Schnellmann, M., and Anselmetti, F. S. (2013). Lake Sediments as Natural Seismographs: A Compiled Record of Late Quaternary Earthquakes in Central Switzerland and its Implication for Alpine Deformation. Sedimentology 60 (1), 319–341. doi:10.1111/sed.12003
Strasser, M., Stegmann, S., Bussmann, F., Anselmetti, F. S., Rick, B., and Kopf, A. (2007). Quantifying Subaqueous Slope Stability During Seismic Shaking: Lake Lucerne as Model for Ocean Margins. Mar. Geology. 240 (1–4), 77–97. doi:10.1016/j.margeo.2007.02.016
Strupler, M., Anselmetti, F. S., Hilbe, M., and Strasser, M. (2019). Quantitative Characterization of Subaqueous Landslides in Lake Zurich (Switzerland) Based on a High-Resolution Bathymetric Dataset. Geol. Soc. Lond. Spec. Publications 477, 399–412. doi:10.1144/sp477.7
Suleimani, E., Nicolsky, D., and Koehler, R. (20152015). Tsunami Inundation Maps of Elfin Cove, Gustavus, and Hoonah, Alaska. Alaska Division of Geological & Geophysical Surveys Report of Investigations–1.
Svennevig, K., Dahl-Jensen, T., Keiding, M., Merryman Boncori, J. P., Larsen, T. B., Salehi, S., et al. (2020). Evolution of Events before and after the 17 June 2017 Rock Avalanche at Karrat Fjord, West Greenland - a Multidisciplinary Approach to Detecting and Locating Unstable Rock Slopes in a Remote Arctic Area. Earth Surf. Dynam. 8 (4), 1021–1038. doi:10.5194/esurf-8-1021-2020
Syverson, K. M., and Mickelson, D. M. (2009). Origin and Significance of Lateral Meltwater Channels Formed along a Temperate Glacier Margin, Glacier Bay, Alaska. Boreas 38 (1), 132–145. doi:10.1111/j.1502-3885.2008.00042.x
Tanyaş, H., Allstadt, K. E., and van Westen, C. J. (2018). An Updated Method for Estimating Landslide-Event Magnitude: An Updated Method for Estimating Landslide-Event Magnitude. Earth Surf. Process. Landforms 43 (9), 1836–1847. doi:10.1002/esp.4359
Tanyaş, H., Westen, C. J., Allstadt, K. E., and Jibson, R. W. (2019). Factors Controlling Landslide Frequency–Area Distributions. Earth Surf. Process. Landf. 44 (4), 900–917. doi:10.1002/esp.4543
Twichell, D. C., Chaytor, J. D., ten Brink, U. S., and Buczkowski, B. (2009). Morphology of Late Quaternary Submarine Landslides along the U.S. Atlantic Continental Margin. Mar. Geol. 264 (1–2), 4–15. doi:10.1016/j.margeo.2009.01.009
Urgeles, R., and Camerlenghi, A. (2013). Submarine Landslides of the Mediterranean Sea: Trigger Mechanisms, Dynamics, and Frequency-Magnitude Distribution. J. Geophys. Res. Earth Surf. 118 (4), 2600–2618. doi:10.1002/2013jf002720
Van Daele, M., Versteeg, W., Pino, M., Urrutia, R., and De Batist, M. (2013). Widespread Deformation of basin-plain Sediments in Aysén Fjord (Chile) Due to Impact by Earthquake-Triggered, Onshore-Generated Mass Movements. Mar. Geol. 337, 67–79. doi:10.1016/j.margeo.2013.01.006
Van Den Eeckhaut, M., Poesen, J., Govers, G., Verstraeten, G., and Demoulin, A. (2007). Characteristics of the Size Distribution of Recent and Historical Landslides in a Populated Hilly Region. Earth Planet. Sci. Lett. 256 (3–4), 588–603. doi:10.1016/j.epsl.2007.01.040
Van Loon, A. T., and Pisarska-Jamroży, M. (2014). Sedimentological Evidence of Pleistocene Earthquakes in NW Poland Induced by Glacio-Isostatic Rebound. Sediment. Geol. 300, 1–10. doi:10.1016/j.sedgeo.2013.11.006
Vargas, C. A., and Idarraga-García, J. (2014). “Age Estimation of Submarine Landslides in the La Aguja Submarine Canyon, Northwestern Colombia,” in Submarine Mass Movements and Their Consequences. Editors S. Krastel, J. H. Behrmann, D. Völker, M. Stipp, C. Berndt, and R. Urgeles (Springer International Publishing), 37, 629–638. doi:10.1007/978-3-319-00972-8_56
Vieli, A. (2011). “Tidewater Glaciers,” in Encyclopedia of Snow, Ice and Glaciers. Encyclopedia of Earth Sciences Series, 1175-1179. Editors V. P. Singh, P. Singh, and U. K. Haritashya (Dordrecht: Springer). doi:10.1007/978-90-481-2642-2_579
Ward, S. N. (2001). Landslide Tsunami. J. Geophys. Res. 106 (B6), 11201–11215. doi:10.1029/2000jb900450
Wieczorek, G. F., Geist, E. L., Motyka, R. J., and Jakob, M. (2007). Hazard Assessment of the Tidal Inlet Landslide and Potential Subsequent Tsunami, Glacier Bay National Park, Alaska. Landslides 4 (3), 205–215. doi:10.1007/s10346-007-0084-1
Wilson, F. H., Hults, C. P., Mull, C. G., and Karl, S. M. (2015). Geologic Map of Alaska. US Geological Survey Scientific Investigations Map. SIM-3340.
Wright, G. F. (1894). Erosion of the Muir Glacier, Alaska. Nature 50 (1289), 245–246. doi:10.1038/050245c0
Yavari-Ramshe, S., and Ataie-Ashtiani, B. (2016). Numerical Modeling of Subaerial and Submarine Landslide-Generated Tsunami Waves-Recent Advances and Future Challenges. Landslides 13 (6), 1325–1368. doi:10.1007/s10346-016-0734-2
Yokoyama, R., Shirasawa, M., and Pike, R. J. (2002). Visualizing Topography by Openness: A New Application of Image Processing to Digital Elevation Models. Photogramm. Eng. Remote Sens. 68 (3), 257–266.
Keywords: submarine landslide, susceptibility, bathymetry, deglacation, fjord, fan delta, Glacier Bay National Park, Alaska
Citation: Avdievitch NN and Coe JA (2022) Submarine Landslide Susceptibility Mapping in Recently Deglaciated Terrain, Glacier Bay, Alaska. Front. Earth Sci. 10:821188. doi: 10.3389/feart.2022.821188
Received: 23 November 2021; Accepted: 23 February 2022;
Published: 24 March 2022.
Edited by:
Thomas Oommen, Michigan Technological University, United StatesReviewed by:
Barrett Salisbury, Alaska Division of Geological & Geophysical Surveys, United StatesAlexandre Normandeau, Geological Survey of Canada, Canada
Copyright © 2022 Avdievitch and Coe. This is an open-access article distributed under the terms of the Creative Commons Attribution License (CC BY). The use, distribution or reproduction in other forums is permitted, provided the original author(s) and the copyright owner(s) are credited and that the original publication in this journal is cited, in accordance with accepted academic practice. No use, distribution or reproduction is permitted which does not comply with these terms.
*Correspondence: Nikita N. Avdievitch, bmF2ZGlldml0Y2hAdXNncy5nb3Y=