- 1Geophysical Center of the Russian Academy of Sciences, Moscow, Russia
- 2Institute of Earthquake Prediction Theory and Mathematical Geophysics of the Russian Academy of Sciences, Moscow, Russia
- 3Schmidt Institute of Physics of the Earth of the Russian Academy of Sciences, Moscow, Russia
- 4Geophysical Institute of Vladikavkaz Scientific Center RAS, Vladikavkaz, Russia
Early aftershocks contain important information about the physics of earthquake occurrence and postseismic relaxation processes. However, the standard catalogs of early aftershocks are usually incomplete. Many events can be missed in the main shock coda, some of which are strong enough due to the extremely high noise level. Under these conditions, the process of event identification becomes largely stochastic. Due to different network configurations and record processing methods, different agencies may register/miss different events, thus merging catalogs can improve the completeness of the aftershock sequence. When merging catalogs, the problem of identifying duplicates (records related to the same seismic event) arises. The main difficulty is discriminating aftershocks and duplicates, since both are events close in space and time. The problem is analogous to the problem of discriminating aftershocks and independent events. The solution methods are usually similar too. In this paper, we apply the nearest neighbor method modified for our problem. This method has become widespread in recent years in the problem of identifying aftershocks, and a probabilistic metric in the space of network errors in determining the epicenters and times of seismic events. It is applied for automatic identification of duplicates when merging catalogs of aftershocks for the Tohoku earthquake. An analysis of the space-time structure of duplicates and aftershocks shows their significant difference, which makes it possible to successfully solve the problem. In a sample from the global Advanced National Seismic System (ANSS) catalog (
1 Introduction
Strong shallow earthquakes are followed by numerous aftershocks (Narteau et al., 2005). Early aftershocks contain important information about the physical mechanisms that lay behind the occurrence of earthquakes (Peng et al., 2006; Enescu et al., 2007; Peng et al., 2007; Enescu et al., 2009) and postseismic deformation around the fault zone (Freed, 2005; Chang et al., 2007; Freed, 2007; Shebalin et al., 2021). Early aftershocks can also help constrain the geometry of a seismogenic fault (Chang et al., 2007; Peng and Zhao, 2009; Wu et al., 2017; Yin et al., 2018). However, the standard catalogs of early aftershocks are usually incomplete: due to the extremely intense flow of earthquakes and high noise levels, many events, including quite strong ones, can be missed (Kagan, 2004; Helmstetter et al., 2006; Shebalin and Baranov, 2017). To improve the completeness of catalogs of early aftershocks, special techniques for processing station data high-pass filtered seismograms following the main shock (Enescu et al., 2007; Peng et al., 2007); waveform matched-filter technique (Gibbons and Ringdal, 2006; Shelly et al., 2007; Yang et al., 2009; Wu et al., 2017; Yin et al., 2018) are actively developed. These techniques allow to significantly increase the number of registered events. However, only standard earthquake catalogs from various agencies are available for an ordinary user, that as a rule does not have access to station records.
Under high noise conditions immediately after the main shock, the process of event identification becomes largely stochastic. Due to different network configurations and record processing methods, different agencies may register/miss different events. This is especially relevant for the Arctic, which has recently begun to be actively developed, but is still poorly studied from a geophysical point of view. We believe that merging catalogs can improve the completeness of the aftershock sequence.
When merging two or more catalogs, duplicate identification is necessary, which is not an easy task in a very dense earthquake flow. Basically, window methods are used to identify duplicates: catalogs are merged into a single file, then groups of events close in space and time are identified (Zare et al., 2014; Markušić et al., 2016; Sawires et al., 2019). Usually the difference is used within 1 minute in time and on the order of 100 km in distance. Due to the natural clustering of seismic events in space and time, with this approach, aftershocks inevitably fall into the category of potential duplicates: for example, on the first day after the Tohoku earthquake,
The window method for identifying duplicates is similar to the simplest method for detecting aftershocks proposed in (Gardner and Knopoff, 1974) based on the distance between events in time and space. For each earthquake in the catalog with a magnitude M, subsequent shocks are identified as aftershocks if they occur within the specified time intervals
where tij = tj −ti is the interevent time, rij the spatial distance between the epicenters, mi the magnitude of event i, df the fractal dimension of the epicenter distribution and
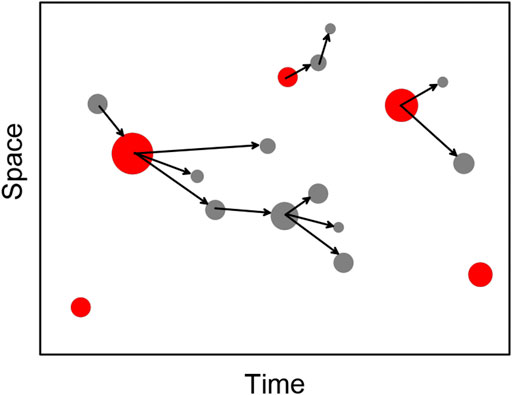
FIGURE 1. Nearest neighbor method for declustering the earthquake catalog. Independent events are highlighted in red.
Some events turn out to be single, if the proximity function for them exceeds a predetermined threshold value. Each event has a single generating earthquake, which is the closest preceding event to it, which reflects the causal relationship of aftershocks with the main shock. One triggering earthquake can have many “offspring.” Thus, a cluster of related events of the “tree” type is formed. The earthquake with the highest magnitude in the cluster is called the main shock. If there are several of them, then the earlier event is considered the main one. All events in the cluster that occurred after the main shock are called aftershocks, before the main one - foreshocks. Single events and main events in each cluster are declared as independent earthquakes.
Despite the common features, the problems of identifying aftershocks and duplicates have a number of significant differences. First of all, duplicates do not have a causal relationship: records of the same earthquake by different networks are independent events. Duplicates do not form a tree, but they do form pairs in which events necessarily belong to different source catalogs (we assume that duplicates in each separate catalog are excluded). In addition, proximity function Eq. 1 reflects the spatio-temporal structure of both aftershocks and unrelated events. The space-time structure of duplicates is different; it reflects the difference in the determination of earthquake parameters by different networks. All this requires, in application to the task of discriminating aftershock and duplicates, a significant modification of the method (Zaliapin and Ben-Zion, 2013; Zaliapin and Ben-Zion, 2016). In this paper, a modified nearest neighbor method and a probabilistic metric in the space of station errors are applied to identify duplicates when merging aftershock catalogs of the Tohoku earthquake. Despite the fact that both duplicates and aftershocks are close events, the analysis of the space-time structure shows their significant difference, which makes it possible to successfully solve the problem. Particular attention is paid to the analysis of the first day after the main shock, when the flow density of aftershocks is maximal.
2 Materials and Methods
2.1 Input Data
Considering the problem of discriminating duplicates and aftershocks, we selected catalogs containing the aftershock sequence of the Tohoku earthquake, 11 March 2011, Mw = 9, as the material for study. We examine samples from the catalog of Japan Meteorological Agency (JMA) (https://www.data.jma.go.jp/svd/eqev/data/bulletin/hypo_e.html) and the Advanced National Seismic System (ANSS) catalog (ANSS Comprehensive Earthquake Catalog (ComCat), _https://earthquake.usgs.gov/earthquakes/search/). Period 1 March 2011–31 December 2011; territory 35N-41N, 140E-146E; JMA magnitudes
The distribution of the JMA and ANSS earthquakes by depth and magnitude is shown in Figure 2.
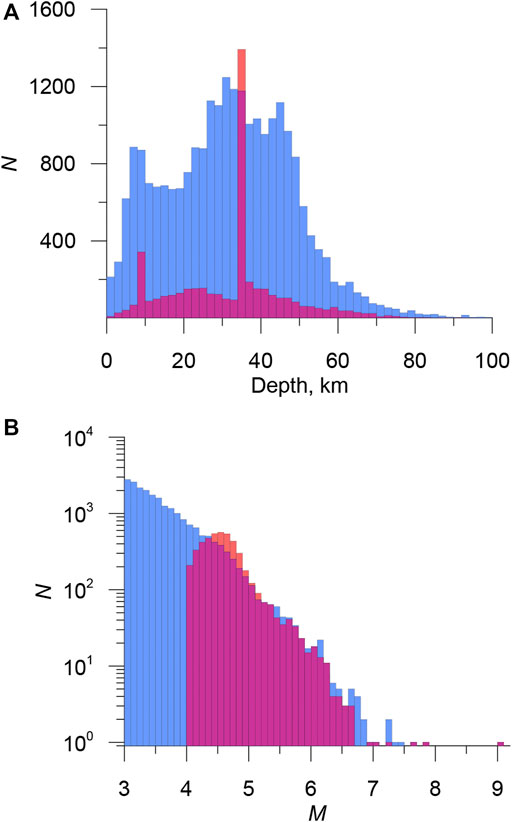
FIGURE 2. Depth (A) and non-cumulative magnitude-frequency (B) distributions in JMA (blue) and ANNS (red) catalogs.
In the JMA catalog, the depths are well distributed, in ANSS about 40% of earthquakes have a standard depth of 35 and 10 km. Magnitude-frequency graphs are significantly different, primarily due to the different completeness of the catalogs.
2.2 Methods
To solve the problem of discrimination aftershocks and duplicates when merging catalogs, we modified the nearest neighbor method used to separate grouped events (Zaliapin and Ben-Zion, 2013; Zaliapin and Ben-Zion, 2016), as well as the neighborhood function used in this method (Baiesi and Paczuski, 2004).
2.2.1 Modification of Nearest Neighbor Method
At the input there are two catalogs, main Catalog 1 and additional Catalog 2. We believe that neither Catalog 1 nor Catalog 2 contains duplicates within themselves. The problem is to find records in Catalog 1 for records in Catalog 2 that will correspond to the same seismic events (duplicates) and divide Catalog 2 into events that have duplicates in Catalog 1 and unique events, including aftershocks. The two-step modification of the nearest neighbor method (Figure 3) is based on the following provisions:
• Duplicates do not have a causal relationship, because records of the same earthquake by different networks are independent events, so the time difference can be either positive or negative.
• Duplicates do not form a tree, but form pairs, in which events necessarily belong to different source catalogs.
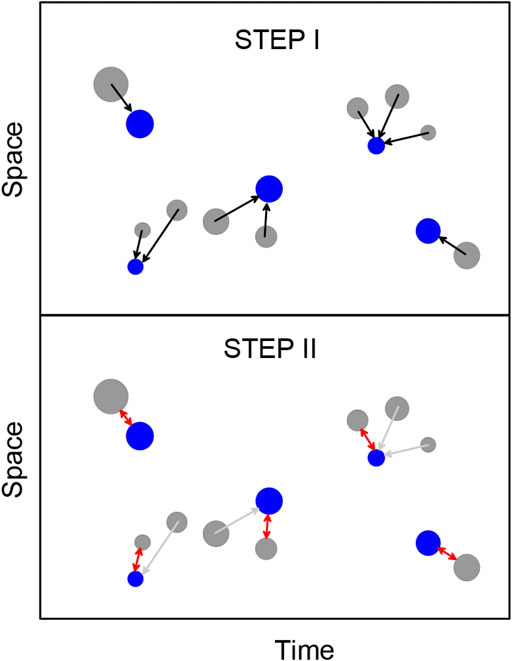
FIGURE 3. Modification of the nearest neighbor method for identifying duplicates in earthquake catalogs. Blue and gray circles are events of the main and additional catalogs, respectively, identified duplicates are shown by red arrows on the Step II panel.
Step I For each event of the additional Catalog 2, we look for the nearest neighbor from the main Catalog 1 in accordance with the chosen metric. This step is similar to the classic nearest neighbor method. Thus, for each event from Catalog 2, a single event from Catalog 1 is determined for which it can be a duplicate.
Step II Some events from the main catalog 1 may occur to be closest for several events from additional catalog 2. This is shown in Figure 3A, where several gray dots (earthquakes from additional catalog) are associated with the same blue dot (earthquake from main catalog). This case the closest of such events is selected as a potential duplicate. This is illustrated in Figure 2B by red arrow. Other events are declared to be non-duplicates, regardless of the metric values.After the second step, the nearest neighbors are not defined for all events, because some events from Catalog 1 were not closest to any event from Catalog 2 and vice versa. However, there may be duplicates among them. We exclude from the analysis the events of the first and second catalogs, which found their pair at the first stage. For the remaining events, we again define pairs. The procedure is repeated until all events from the catalog with a smaller number of events find their pair. At the same time, some of the pairs are not actually duplicates. Therefore, similarly to how it is done in the method of Zaliapin and Ben-Zion (2013) and Zaliapin and Ben-Zion (2016), a threshold value is introduced for the neighborhood function.As a result, we consider the events of additional Catalog 2 with the value of the neighborhood function less than the threshold one as duplicates. The rest of Catalog 2 events are declared unique and added to Catalog 1. Selection of neighborhood function and threshold determination are discussed below. Further, any number of catalogs can be sequentially added. One of the advantages of the described method is the predetermined priority of data sources. The procedure ensures that events with a higher priority are automatically included in the final catalog.
2.2.2 Neighborhood Function for Duplicates in Earthquake Catalogs: A Probabilistic Approach
When declustering the earthquake catalogs, Zaliapin and Ben-Zion (2013) and Zaliapin and Ben-Zion (2016) used the proximity function of Baiesi and Paczuski (2004) (Eq. 1), which reflects the patterns of natural grouping of earthquakes and, in fact, it is the probability of an earthquake occurring within a distance
Here DT, DX, DY, DZ, DT are the difference in time, longitude, latitude, hypocenter depth and magnitude between the nearest events from the main and additional catalogs;
Thus, we naturally arrive at the Euclidean metric.
If the variance of the parameters is correctly determined, the metric can be easily recalculated into the probability of this pair to be a duplicate. It is easy to see that metric Eq. 3 is simply the radius of the ball, measured in standard deviations. The metric allows to take into account the systematic error and variance of each of the parameters. It makes sense to take into account the systematic error if it has a value of the order of variance or more. Any of the parameters can be excluded from the metric if it is poorly defined in one or both catalogs. Depth is often such a parameter. Accounting for magnitude can make sense if the two catalogs of registration levels and magnitude scales are compatible. In this case, the catalogs have similar graphs, including the range of incomplete registration at low magnitudes.
The method for determining the numerical parameters of the metric, the choice of the optimal threshold and the estimation of the percentage of errors will be explained in detail using the example of the analysis of aftershocks of the Tohoku earthquake in two earthquake catalogs.
3 Results
3.1 Case Study: Analysis of Aftershocks of Tohoku Earthquake From Japan Meteorological Agency and Advanced National Seismic System Catalogs
We use the simplest version of the metric (Eq. 3), which takes into account only the difference in time
At the first stage, we need to test the hypothesis of the normal distribution for the parameters of the duplicates
The initial values of the parameters have little effect on the identification of duplicates. However, they affect the value of the probability of a duplicate and the estimate of the percentage of errors.
At the preliminary stage, about 4,000 duplicates were identified. The threshold value was chosen in accordance with the minimum distribution of the metric. For duplicates, we build the distributions
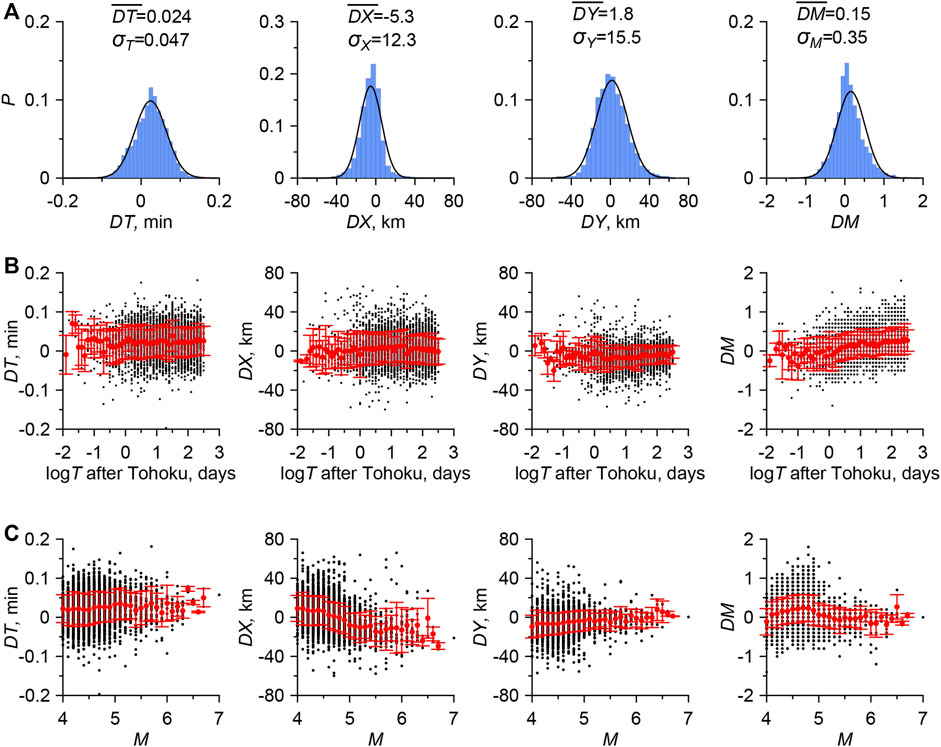
FIGURE 4. (A) Distributions of
The average values of the parameters are assumed to be zero.
Thus, we test the simplest three-parameter metric
The distribution of the basic metric
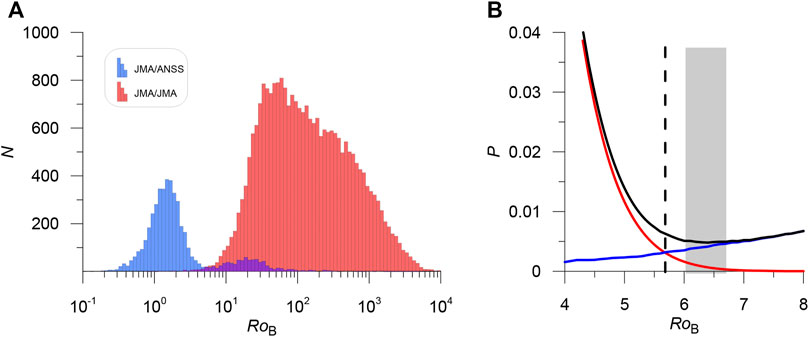
FIGURE 5. (A) Comparison of the distribution of the base metric
In the JMA catalog, only 80 earthquakes have a distance to the nearest neighbor
3.2 Japan Meteorological Agency Catalog Misses
More than 700 earthquakes in the ANSS catalog that were missed in the JMA catalog were found (Figure 6A). Most of the misses occurred at the beginning of the Tohoku aftershock sequence. On the first day, only half of the events reported in ANSS have duplicates in the JMA (Figure 6B). We repeated the identification of the duplicates on the first day after the main shock. There are 660 events in the ANSS, 1,175 events in the JMA (EX 1). The distribution minimum did not shift (Figure 6D). There is no reason to change the metric parameters, since we have shown that the variance of the parameters does not depend on time (see Figure 4). Due to the very high density of earthquakes, the probability of false duplicates on the first day is significantly higher than for the entire studied period. The metric threshold is redefined to ensure that the number of the first and second kind errors is equal. At
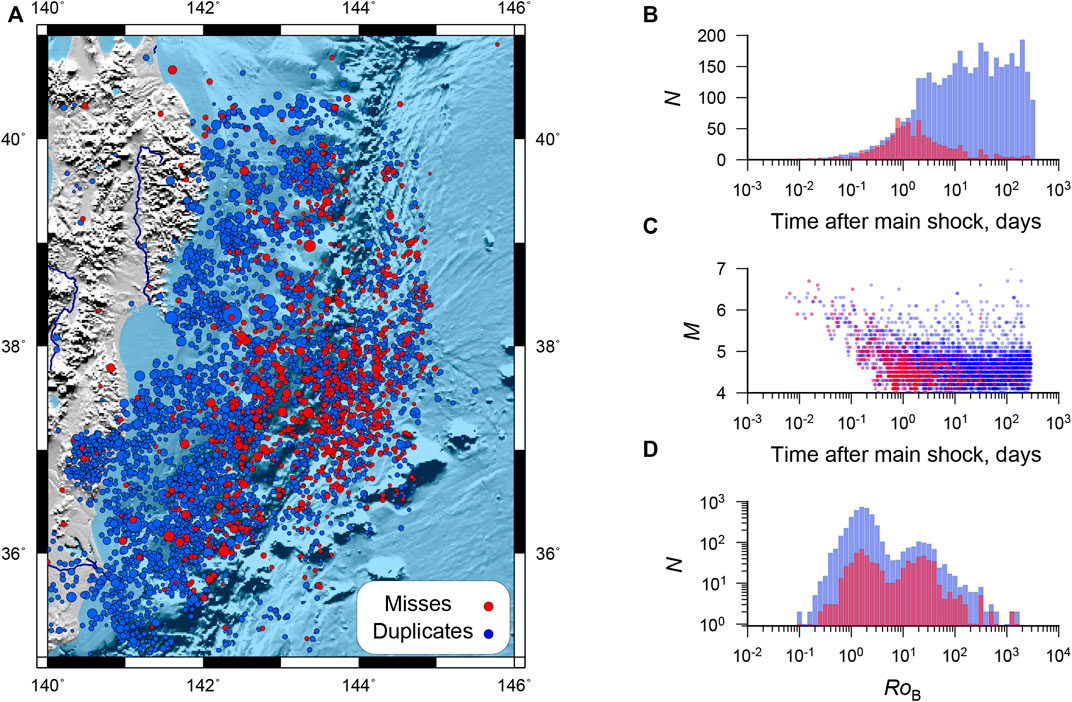
FIGURE 6. JMA misses. (A) Tohoku Aftershock Epicenter Map (ANSS), red dots are JMA missed events. (B) Distribution in time of misses (red) and duplicates (blue). (C) Magnitude distribution of misses (red) and duplicates (blue) in time. (D) Comparison of the
Among the misses, there are 10 earthquakes with magnitude
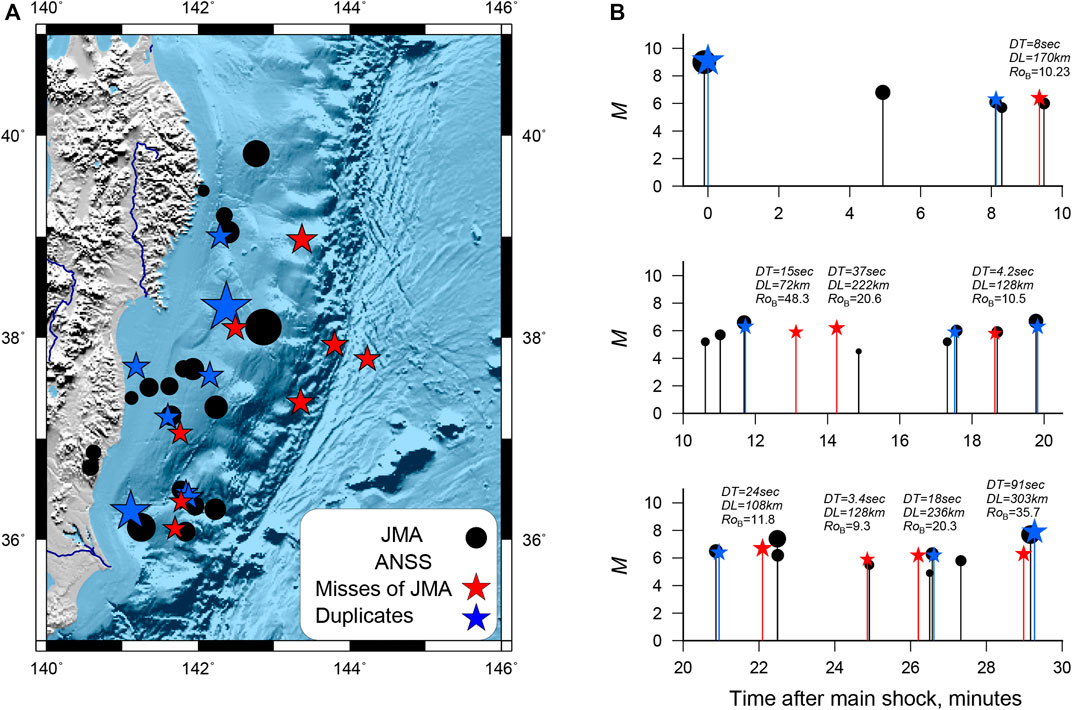
FIGURE 7. Earthquakes registered by JMA and ANSS in the first half hour after the main shock. (A) Epicenter map. (B) Sequence of events JMA (black) and ANSS (red—JMA misses, blue—events with duplicates in JMA) without magnitude limitations. For events from ANSS missed in JMA, the values of the metric, time and distance to the nearest JMA event are given. The designations are the same as in (A).
Among misses, there are pairs with small time differences, but long distances. We check whether spatial discrepancies can be attributed to how locations in the ANSS catalog were estimated. Unfortunately, ANSS provides a location error only after 2014. In the studied area, the average error value is 7 km, and the maximum value is 15 km. We suppose that the location error was not significantly greater until 2014. The value of 7 km is less than DX = 12.3 km and DY = 15.5 km used in our study.
4 Discussion
4.1 Spatial-Temporal Structure of Duplicates and Aftershocks
The distribution of distances and times between the Tohoku aftershocks from the JMA catalog and between the nearest neighbors from the JMA and ANSS catalogs is shown in Figure 8. Duplicates form a dense cluster (Narteau et al., 2000; Widiwijayanti et al., 2003; Narteau et al., 2008; Gvishiani et al., 2016), are well separated from the aftershocks. In an aftershock sequence, quite a few events have small times or small distances to the nearest neighbor, but very few events occur close simultaneously in time and space. Thus, the space-time structure is significantly different for the nearest neighbors from different catalogs and within the aftershock sequence. This allowed us to successfully solve the problem of discriminating duplicates and aftershocks.
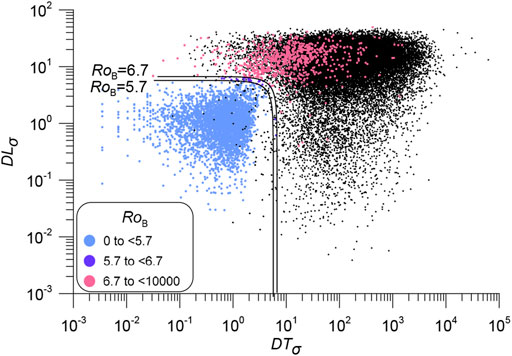
FIGURE 8. Spatio-temporal structure of duplicates and aftershocks. Colored dots are JMA/ANSS pairs, black dots are the distance between aftershocks from the JMA catalog in the basic metric
The distribution of aftershocks and duplicates using the proximity function Eq. 1 is shown in Figure 9. We used the numerical parameters determined for Japan in (Shebalin et al., 2020). The space-time structure of duplicates and aftershocks differs slightly worse than for the Euclidean metric proposed in this paper. This confirms the robustness of result. However, the lines corresponding to thresholds of the proximity function Eq. 1 (straight lines on a logarithmic scale) poorly separate duplicates (Figures 9A,B). The potential number of errors is significant, the probability of choosing a false duplicate is high (compare with Figure 5). The proximity function Eq. 1 is good for distinguishing between aftershocks and background events. To discriminate aftershocks and duplicates, the proximity function should take into account not the probability of a causal relationship between two events, but the probability of divergence of the event parameters in two sources, and therefore rely on the rates of errors in determining the times and epicenters of earthquakes. The level lines of the Euclidean metric Eq. 4 provide a close to optimal separation of duplicates and aftershocks (Figure 8).
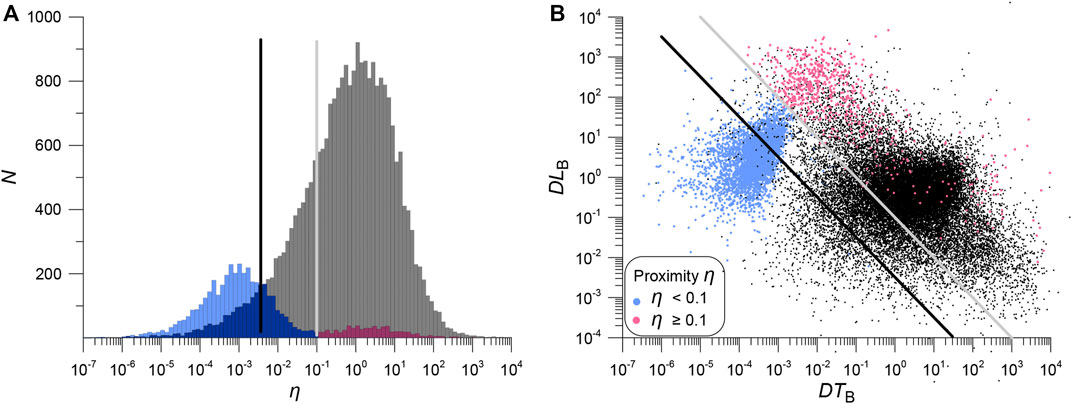
FIGURE 9. Distribution and space-time structure of duplicates and aftershocks for the proximity function η (Eq. 1), parameters as in Shebalin et al. (2020). (A) Distribution of proximity function η for duplicates (colored histogram) and aftershocks (gray histogram). The black and gray lines show possible thresholds for separating duplicates. The gray line corresponds to the minimum distribution for duplicates, the black line corresponds to an equal number of errors of the first and second kind. (B) Distribution of duplicates (colored dots) and aftershocks (black dots) in space and time. The gray and black lines show the proximity function (Eq. 1) level lines (same as in panel (A)).
4.2 Numerical Experiments
4.2.1 EX2. Symmetry Test
In the basic version, we chose JMA data as the main catalog and ANSS as the secondary catalog. We will study changes in duplicate identification results if the main catalog is ANSS and the secondary one is JMA.
In 48 cases, a different pair was chosen by earthquakes, but all these cases were among non-duplicates (pairs with a large metric
4.2.2 EX3, 4. Model With Four Parameters DT, DX, DY, DM
DM is included in the metric, the number of parameters increases to 4.
In total, in six earthquake cases, a different pair was chosen, two among duplicates and four among non-duplicates. The optimal value of the metric threshold is
4.2.3 EX5, 6. Model Taking Into Account the Correlation of Parameters and Bias of the Mean
In the proposed methodology, the most controversial is the assumption of the independence of errors for individual parameters. It is believed that the time difference
In the case of three parameters
where
For Tohoku catalogs
80 events found another pair, but only four among the duplicates. The metric values decreased for the duplicates, while for the non-duplicates they remained approximately the same, which reflects the absence of correlations in the non-duplicates. The depth of the distribution minimum did not change, i.e. the quality of separating duplicates/non-duplicates did not improve (Figure 10).
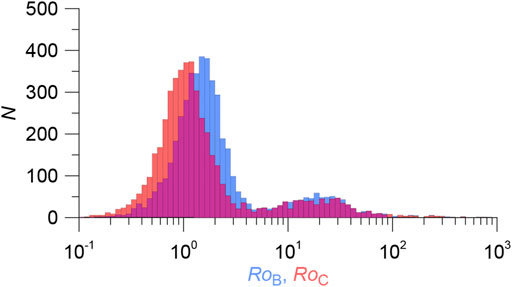
FIGURE 10. Distribution of the metric
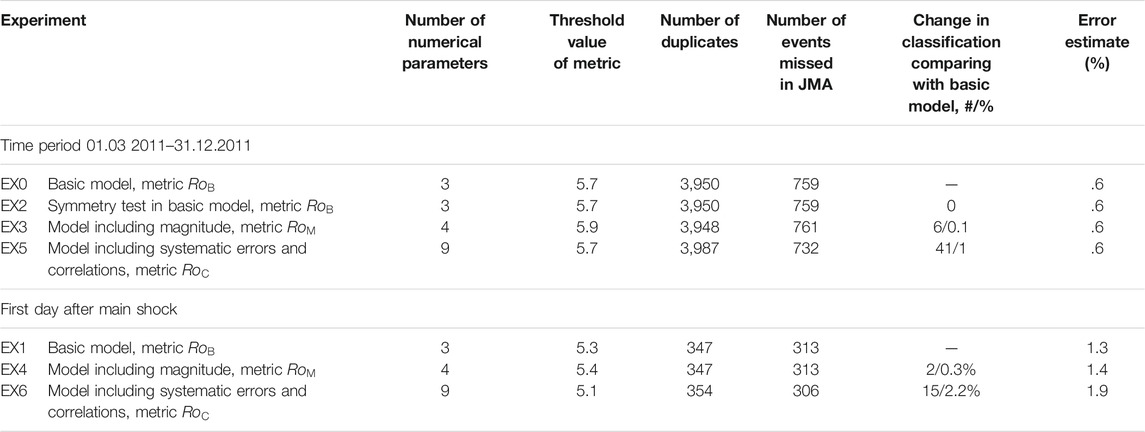
The optimal threshold value
On the first day after the main shock, the optimal metric threshold decreases to 5.1, the estimate of the number of errors increases to 1.9%. The number of identified duplicates increases by 7 and is 354. Among the additional duplicates there is an earthquake with
Thus, there are no significant changes in the classification of events. While there is a significant correlation, in practice, a simple basic model gives nearly the same result.
The statistics of changes in the classification of events in numerical experiments allows to estimate the possible percentage of errors associated with the inaccuracy of the basic model. Over the entire study period, on average, it does not exceed 1%, on the first day after the main shock it is about 2%. Taking into account the estimate of the total number of errors of the first and second kind .6%, the efficiency of the basic model exceeds 98% for the entire period of the study. On the first day, the efficiency drops to 96% (100% −2.2% −1.3%).
5 Conclusion
The difficulty in registration of early aftershocks is associated with extreme seismic activity in the source zone immediately after a strong earthquake. Under conditions of extremely high noise levels, the process of event identification becomes largely stochastic. Due to different network configurations and record processing methods, different agencies may register/miss different events, thus merging catalogs can improve the completeness of the aftershock sequence. This, however, raises the problem of correct discriminating aftershocks and duplicates.
The method proposed in this paper is designed to merge modern instrumental earthquake catalogs. It was developed by analogy with modern methods of declustering earthquake catalogs. It is a modification of the nearest neighbor method (Zaliapin and Ben-Zion, 2013; Zaliapin and Ben-Zion, 2016). We also proposed a Euclidean metric for assessing the proximity of duplicates, which is based on a probabilistic assessment of the divergence of event parameters in different sources. The metric takes into account random and systematic errors in determining the temporal and spatial parameters of events. Magnitude analysis is also possible. Using the example of merging two catalogs of the aftershock sequence of the Tohoku earthquake, 11 March 2011, Mw = 9, it is shown that the proposed method allows efficiently identify duplicates.
The main advantage of the method is the automatic procedure for identifying duplicates, which, unlike the window method, does not require additional manual analysis. The method allows to calculate the probability of missing duplicates and the formation of false duplicates, and thus assess the efficiency of identifying paired events.
Using the example of the aftershock sequence of the Tohoku earthquake, it was shown that the data of one of the best seismic networks in the world, JMA, can be substantially supplemented with data from the global ANSS catalog. We found over 700 events with
For the Tohoku case, the simplest basic metric Eq. 4, which includes only the variances of the difference in the temporal and spatial parameters of earthquakes in ANSS and JMA turned out to be effective. Including the magnitude, taking into account systematic shifts, as well as correlations of individual parameters, almost does not change the result of duplicate identification. A significant complication of the procedure and an increase in the number of metric parameters does not justify possible minor improvements in the result. We believe that for most catalogs, the basic metric will be sufficient to reliably identify duplicates.
The method can be used not only to improve the completeness of aftershock sequences, but also for any merging of earthquake catalog containing data on clustered seismicity, e.g., earthquake swarms, which are an important feature of the seismicity (Ross et al., 2020). The automated procedure eliminates the manual analysis step, in which the result depends on the subjective decision of the researcher. In addition, due to the volume of modern earthquake catalogs, manual analysis becomes extremely laborious and time-consuming, and often simply impossible.
High efficiency and reliable identification of duplicates allows to study the correspondence of magnitudes determined by different agencies. Therefore, the present method is an effective tool for creating merged earthquake catalogs with a uniform magnitude.
In the near future, the authors plan to apply the algorithm developed in this article to merge a number of catalogs in order to create the most complete catalog of earthquakes for the Arctic zone of the Russian Federation.
Data Availability Statement
Publicly available datasets were analyzed in this study. This data can be found here: https://www.data.jma.go.jp/svd/eqev/data/bulletin/hypo_e.html, https://earthquake.usgs.gov/earthquakes/search/.
Author Contributions
IV offered metric, conducted numerical experiments, visualization, and literature analysis, AG overall research management, writing—review and editing, BAD development of a general data analysis scheme, BVD literature analysis and development of a general data analysis scheme, YB and AA data curation.
Funding
This work was funded by the Russian Science Foundation (project No. 21-77-30010).
Conflict of Interest
The authors declare that the research was conducted in the absence of any commercial or financial relationships that could be construed as a potential conflict of interest.
Publisher’s Note
All claims expressed in this article are solely those of the authors and do not necessarily represent those of their affiliated organizations, or those of the publisher, the editors and the reviewers. Any product that may be evaluated in this article, or claim that may be made by its manufacturer, is not guaranteed or endorsed by the publisher.
References
Baiesi, M., and Paczuski, M. (2004). Scale-free Networks of Earthquakes and Aftershocks. Phys. Rev. E 69, 066106. doi:10.1103/PhysRevE.69.066106
Chang, C., Wu, Y., and Wu, F. (2007). Aftershocks of 1999 Chi-Chi, Taiwan, Earthquake: The First Hour. Bull. Seismol. Soc. Am. 97 (4), 1245–1258. doi:10.1785/0120060184
Enescu, B., Mori, J., and Miyazawa, M. (2007). Quantifying Early Aftershock Activity of the 2004 Mid-Niigata Prefecture Earthquake (Mw 6.6). J. Geophys. Res. 112, B04310. doi:10.1029/2006jb004629
Enescu, B., Hainzl, S., and Ben-Zion, Y. (2009). Correlations of Seismicity Patterns in Southern California with Surface Heat Flow Data. Bull. Seismol. Soc. Am. 99 (6), 3114–3123. doi:10.1785/0120080038
Freed, A. M. (2005). Earthquake Triggering by Static, Dynamic, and Postseismic Stress Transfer. Annu. Rev. Earth Planet. Sci. 33, 335–367. doi:10.1146/annurev.earth.33.092203.122505
Freed, A. M. (2007). Afterslip (And Only Afterslip) Following the 2004 Parkfield, California, Earthquake. Geophys. Res. Lett. 34, L06312. doi:10.1029/2006GL029155
Gardner, J. K., and Knopoff, L. (1974). Is the Sequence of Earthquakes in Southern California, with Aftershocks Removed, Poissonian? Bull. Seis. Soc. Am. 64 (5), 1363–1367. doi:10.1785/bssa0640051363
Gibbons, S. J., and Ringdal, F. (2006). The Detection of Low Magnitude Seismic Events Using Array-Based Waveform Correlation. Geophys. J. Int. 165 (1), 149–166. doi:10.1111/j.1365-246X.2006.02865.x
Gvishiani, A. D., Dzeboev, B. A., and Agayan, S. M. (2016). FCAZm Intelligent Recognition System for Locating Areas Prone to strong Earthquakes in the Andean and Caucasian Mountain Belts. Izv., Phys. Solid Earth 52 (4), 461–491. doi:10.1134/S1069351316040017
Helmstetter, A., Kagan, Y. Y., and Jackson, D. D. (2006). Comparison of Short-Term and Time-independent Earthquake Forecast Models for Southern California. Bull. Seismol. Soc. Am. 96 (1), 90–106. doi:10.1785/0120050067
Kagan, Y. Y. (2004). Short-Term Properties of Earthquake Catalogs and Models of Earthquake Source. Bull. Seismol. Soc. Am. 94, 1207–1228. doi:10.1785/012003098
Markušić, S., Gülerce, Z., Kuka, N., Duni, L., Ivančić, I., Radovanović, S., et al. (2016). An Updated and Unified Earthquake Catalogue for the Western Balkan Region. Bull. Earthquake Eng. 14, 321–343. doi:10.1007/s10518-015-9833-z
Molchan, G. M., and Dmitrieva, O. E. (1992). Aftershock Identification: Methods and New Approaches. Geophys. J. Int. 109 (Issue 3), 501–516. doi:10.1111/j.1365-246x.1992.tb00113.x
Narteau, C., Shebalin, P., Holschneider, M., Le Mouèt, J.-L., and Allègre, C. J. (2000). Direct Simulations of the Stress Redistribution in the Scaling Organization of Fracture Tectonics (SOFT) Model. Geophys. J. Int. 141 (1), 115–135. doi:10.1046/j.1365-246X.2000.00063.x
Narteau, C., Shebalin, P., and Holschneider, M. (2005). Onset of Power Law Aftershock Decay Rates in Southern California. Geophys. Res. Lett. 32 (22), 1–5. L22312. doi:10.1029/2005GL023951
Narteau, C., Shebalin, P., and Holschneider, M. (2008). Loading Rates in California Inferred from Aftershocks. Nonlinear Process. Geophys. 15 (2), 245–263. doi:10.5194/npg-15-245-2008
Peng, Z., and Zhao, P. (2009). Migration of Early Aftershocks Following the 2004 Parkfield Earthquake. Nat. Geosci. 2 (12), 877–881. doi:10.1038/ngeo697
Peng, Z., Vidale, J. E., and Houston, H. (2006). Anomalous Early Aftershock Decay Rate of the 2004 Mw6.0 Parkfield, California, Earthquake. Geophys. Res. Lett. 33, L17307. doi:10.1029/2006GL026744
Peng, Z., Vidale, J. E., Ishii, M., and Helmstetter, A. (2007). Seismicity Rate Immediately before and after Main Shock Rupture from High-Frequency Waveforms in Japan. J. Geophys. Res. 112, B03306. doi:10.1029/2006JB004386
Ross, Z. E., Cochran, E. S., Trugman, D. T., and Smith, J. D. (2020). 3D Fault Architecture Controls the Dynamism of Earthquake Swarms. Science 368 (6497), 1357–1361. doi:10.1126/science.abb0779
Sawires, R., Santoyo, M. A., Peláez, J. A., and Corona Fernández, R. D. (2019). An Updated and Unified Earthquake Catalog from 1787 to 2018 for Seismic hazard Assessment Studies in Mexico. Sci. Data 6, 241. doi:10.1038/s41597-019-0234-z
Shebalin, P., and Baranov, S. (2017). Long-Delayed Aftershocks in New Zealand and the 2016 M7.8 Kaikoura Earthquake. Pure Appl. Geophys. 174, 3751–3764. doi:10.1007/s00024-017-1608-9
Shebalin, P. N., Narteau, C., and Baranov, S. V. (2020). Earthquake Productivity Law. Geophys. J. Int. 222, 1264–1269. doi:10.1093/gji/ggaa252
Shebalin, P. N., Vorobieva, I. A., Baranov, S. V., and Mikhailov, V. O. (2021). Deficit of Large Aftershocks as an Indicator of Afterslip at the Sources of Earthquakes in Subduction Zones. Doklady Earth Sci. 498 (1), 423–426. doi:10.1134/S1028334X21050172
Shebalin, P. N. (1987). Compilation of Earthquake Catalogs as a Task of Clustering Analysis with Learning. Doklady Akademii Nauk SSSR 292 (No. 5), 1083–1086.
Shelly, D. R., Beroza, G. C., and Ide, S. (2007). Non-volcanic Tremor and Low Frequency Earthquakes Swarms. Nature 446 (7133), 305–307. doi:10.1038/nature05666
Widiwijayanti, C., Mikhailov, V., Diament, M., Deplus, C., Louat, R., Tikhotsky, S., et al. (2003). Structure and Evolution of the Molucca Sea Area: Constraints Based on Interpretation of a Combined Sea-Surface and Satellite Gravity Dataset. Earth Planet. Sci. Lett. 215, 135–150. doi:10.1016/s0012-821x(03)00416-3
Wu, J., Yao, D., Meng, X., Peng, Z., Su, J., and Long, F. (2017). Spatial-temporal Evolutions of Early Aftershocks Following the 2013 Mw 6.6 Lushan Earthquake in Sichuan, China. J. Geophys. Res. Solid Earth 122, 2873–2889. doi:10.1002/2016JB013706
Yang, H., Zhu, L., and Chu, R. (2009). Fault-plane Determination of the 18 April 2008 Mount Carmel, Illinois, Earthquake by Detecting and Relocating Aftershocks. Bull. Seismol. Soc. Am. 99 (6), 3413–3420. doi:10.1785/0120090038
Yin, X. Z., Chen, J. H., Peng, Z., Meng, X., Liu, Q. Y., Guo, B., et al. (2018). Evolution and Distribution of the Early Aftershocks Following the 2008 Mw 7.9 Wenchuan Earthquake in Sichuan, China. J. Geophys. Res. Solid Earth 123, 7775–7790. doi:10.1029/2018JB015575
Zaliapin, I., and Ben-Zion, Y. (2013). Earthquake Clusters in Southern California. I: Identification and Stability. J. Geophys. Res. 118 (6), 2847–2864. doi:10.1002/jgrb.50179
Zaliapin, I., and Ben-Zion, Y. (2016). A Global Classification and Characterization of Earthquake Clusters. Geophys. J. Int. 207 (1), 608–634. doi:10.1093/gji/ggw300
Keywords: duplicates, aftershocks, merging catalogs, nearest neighbor method, earthquake catalogs
Citation: Vorobieva IA, Gvishiani AD, Dzeboev BA, Dzeranov BV, Barykina YV and Antipova AO (2022) Nearest Neighbor Method for Discriminating Aftershocks and Duplicates When Merging Earthquake Catalogs. Front. Earth Sci. 10:820277. doi: 10.3389/feart.2022.820277
Received: 22 November 2021; Accepted: 11 January 2022;
Published: 03 February 2022.
Edited by:
Vladimir Smirnov, Lomonosov Moscow State University, RussiaReviewed by:
Alexey Ostapchuk, Institute of Geosphere Dynamics (RAS), RussiaRobert Shcherbakov, Western University, Canada
Copyright © 2022 Vorobieva, Gvishiani, Dzeboev, Dzeranov, Barykina and Antipova. This is an open-access article distributed under the terms of the Creative Commons Attribution License (CC BY). The use, distribution or reproduction in other forums is permitted, provided the original author(s) and the copyright owner(s) are credited and that the original publication in this journal is cited, in accordance with accepted academic practice. No use, distribution or reproduction is permitted which does not comply with these terms.
*Correspondence: B. A. Dzeboev, RHplYm9ldmIuZHplYm9ldkBnY3Jhcy5ydQ==
 I. A. Vorobieva
 A. D. Gvishiani
 B. A. Dzeboev
 B. V. Dzeranov
 Y. V. Barykina
 A. O. Antipova1,2