 Yan Zhang
 Zhengcai Zhang
95% of researchers rate our articles as excellent or good
Learn more about the work of our research integrity team to safeguard the quality of each article we publish.
Find out more
ORIGINAL RESEARCH article
Front. Earth Sci. , 03 June 2022
Sec. Quaternary Science, Geomorphology and Paleoenvironment
Volume 10 - 2022 | https://doi.org/10.3389/feart.2022.818338
This article is part of the Research Topic Environmental Change in Drylands: Past, Present, Future View all 21 articles
The middle areas of China’s Hexi Corridor Desert are distributed within or at the edge of oases in continental river basins in Northern China. Recently, researchers found that rivers can provide sediment material for dune formation and development, but the mechanism has not been investigated in detail. In this study, the relationships among the wind environment, spatial distribution of continental rivers, sand availability, and dune field patterns in the middle area of Hexi Corridor Desert were analyzed. In terms of the wind energy environment, the study area can be divided into three regions: high-energy environment in the north, intermediate-energy environment in the middle, and low-energy environment in the south. The results showed that the resultant drift potential is predominantly from the NW quadrant. The directional variability of wind is intermediate in the northern and middle region and low in the southern region. The directions of winds with critical speed are SW in the northern region, NW and WNW in the middle region, and NW in the southern region. The main dune types are barchans, reticulate dunes, star dunes, linear dunes, and coppice dunes, which differ from previous results (mainly barchans and coppice dunes). Dune field patterns are controlled by the wind energy environment. In addition, the spatial distribution of continental rivers and sand availability are important factors affecting dune formation and development. Sand dunes are distributed downwind of continental rivers, which confirms the hypothesis that rivers can provide sediment material for dune formation. The spatial distribution and different dune types in the middle area of Hexi Corridor Desert reveal that their formation and development are controlled by the wind regime and sediment supply.
The wind regime, sediment supply, and surface characteristics (vegetation and topography) of a region are the main factors controlling dune formation and development in the region (Hack, 1941; Thomas, 1997; Zhang et al., 2015a; Lü et al., 2018). In particular, the formation of aeolian geomorphology is driven by energy from wind, which also guides subsequent development. Therefore, wind regime and wind energy environment have both been widely used in studies of aeolian geomorphology, including the classification of this geomorphology (Melton, 1940; Fedorovich, 1948; Wu, 1987; Lancaster, 1995; Thomas, 1997). For example, a narrow unimodal wind regime creates transverse dunes, a bimodal wind regime creates linear dunes, and a complex wind regime creates star dunes (Fryberger and Dean, 1979). Fryberger and Dean studied the wind regime and wind energy environments associated with several classic dune types (crescent, linear, and star dunes), and found that the ratio of the resultant drift potential to the drift potential (RDP/DP) tended to decrease from crescent dunes to star dunes. For crescent and linear dunes, both wind energy and RDP/DP were high. Other researchers have confirmed that the wind regime is strongly related to the dune types that form in a given environment (Wasson and Hyde, 1983; Lancaster, 1994; Livingstone and Warren, 1996). Specifically, persistent winds control dune formation and development, but strong winds control dune orientation (Fitzsimmons et al., 2020).
The formation and development of dunes are undoubtedly affected by sediment supply, geometry of the sediment source and deposition areas, and size of the dune field, but these factors have not been extensively investigated (Beveridge et al., 2006; Ewing et al., 2006; Derickson et al., 2008; Ewing and Kocurek, 2010a, Ewing and Kocurek, 2010b). Lü et al. (2018) suggested that sediment availability has an important effect on dune types and dune formation and development. Recently, aeolian–fluvial interactions in dryland environments have been widely studied worldwide (Bullard and McTainsh, 2003; Nottebaum et al., 2015; Yan et al., 2015; Han et al., 2016; Liu and Coulthard, 2017). However, such interactions in the arid and semiarid region of northwestern China have rarely been studied (Yan et al., 2015; Han et al., 2016). Yan et al. (2015) and Zhang et al. (2021) investigated the interactions between deserts and large rivers in Northern China and confirmed the hypothesis of Bullard and McTainsh (2003), which states that rivers can provide sediment material for dune formation and development. Nevertheless, they also noted that the relationship between smaller rivers and dunes require further investigation.
Surface characteristics, such as vegetation and geomorphology, also control the types, formation, and development processes of dunes. The formation of almost all linear dunes and nebkhas is determined by the presence of an obstacle (Livingstone and Warren, 1996). Nevertheless, different sand dune types can occur in a region with different wind directions (Zhang and Dong, 2015; Lü et al., 2018).
Within the Hexi Corridor in Northern China, desert areas occur in the middle and western parts of Gansu Province (Figure 1). These areas have received little attention owing to their small coverage (approximately 1,100 km2) compared with other Chinese deserts. To fill in some of the missing data, this study investigated the wind energy environment and dune field patterns in these desert areas. To this end, variations of the wind energy environment, sand dune patterns, and controlling factors of dune geomorphology were analyzed. The objectives of the research are as follows: 1) assessing the effect of the wind energy environment on dune pattern variations; 2) considering the implications of sediment supply on dune pattern variations; 3) determining the relationship between continental rivers and sand dunes; 4) comparing the results of this study with those of previous studies in the Hexi Corridor Desert.
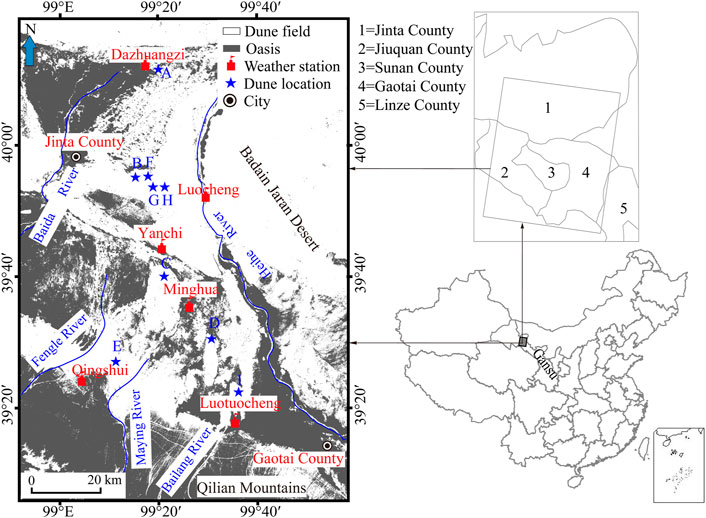
FIGURE 1. Locations of the six weather stations in the present study and location of the study region.
The middle area of Hexi Corridor is located in the temperate zone hungriness taken in the middle latitudes of the northern hemisphere, with arid climate and little rainfall (40–410 mm) and large annual evaporation (1,500–3,311 mm) (Jia, 2012; Luo et al., 2021). The region’s weather is affected by the cold front in the winter seasons, with frequent windy days, and the wind direction is mainly northwest wind, west wind, and southwest wind. In the summer seasons, it is influenced by the monsoon, and the wind speed is low and the east wind increases (Guo, 2015). Also, the region’s weather is characterized by the same period of wind and drought. The study area is sparsely distributed at the edges of the middle and lower reaches of a continental river basin. The study area includes two large continental rivers: the middle reaches of the Heihe River and the lower reaches of the Baida River. From east to west, three small continental rivers run through the study area: the Bailang River, Maying River, and Fengle River. The middle areas of the Hexi Corridor lie between the Baida River and Heihe River and in the lower reaches of the Bailang, Maying, and Fengle rivers. In the lower reaches of these rivers, large amounts of alluvial sediments are deposited, serving as the source areas of sediments for downwind dune formation and development (Nottebaum et al., 2015, Figure 1). Nottebaum et al. (2015) suggested that sand material in the middle area of the Hexi Corridor Desert was derived from the Qilian Mountains and transported by hydrological processes. However, Zhang et al. (2021) suggested that eolian sediments in the middle area of Hexi Corridor Desert were derived from the Qilian Mountains in the southwest and the Beishan Mountains in the north. Upwind sediment sources control dune formation and development in the middle area of the Hexi Corridor Desert. Barchans that formed on the Gobi surface move at an average rate of 8–53 m year−1, and their movement is related to their width (Zhang et al., 2018). Sand grains in this area are mainly very fine sand and fine sand (Zhang and Dong, 2015).
Dunes are mainly distributed in two regions. The first is in the western part of the Jinta County and the lower reaches of the Baida River. This dune area covers approximately 40 km from north to south and 10–20 km from west to east, with a total area of approximately 650 km2. The main dunes were reported to be coppice dunes (Wu, 2009). The second area is in the northwestern part of the Gaotai County, along the middle reaches of the Heihe River. This dune area covers approximately 10–30 km from north to south and 75 km from west to east, with a total area of 450 km2 (Li, 1998). The main dune types are crescent dunes, crescent dune sheets, and sand sheets (Wu, 2009). The weather conditions of the Gaotai and Jinta are shown in Table 1.

TABLE 1. Weather conditions of Gaotai and Jinta.
Vegetation cover influences the development of dune fields and sand seas. Figure 2 shows the vegetation cover in the study region in 2010. The vegetation cover is denser near and in the lower reaches of the rivers, with values of the normalized-difference vegetation index (NDVI) usually larger than 0.3; in some areas, the NDVI is between 0 and 0.1. The land surface is mainly covered by the Gobi (gravel), and dune fields (with NDVI < 0) are discontinuously distributed between rivers and in the northeastern part of the study area.
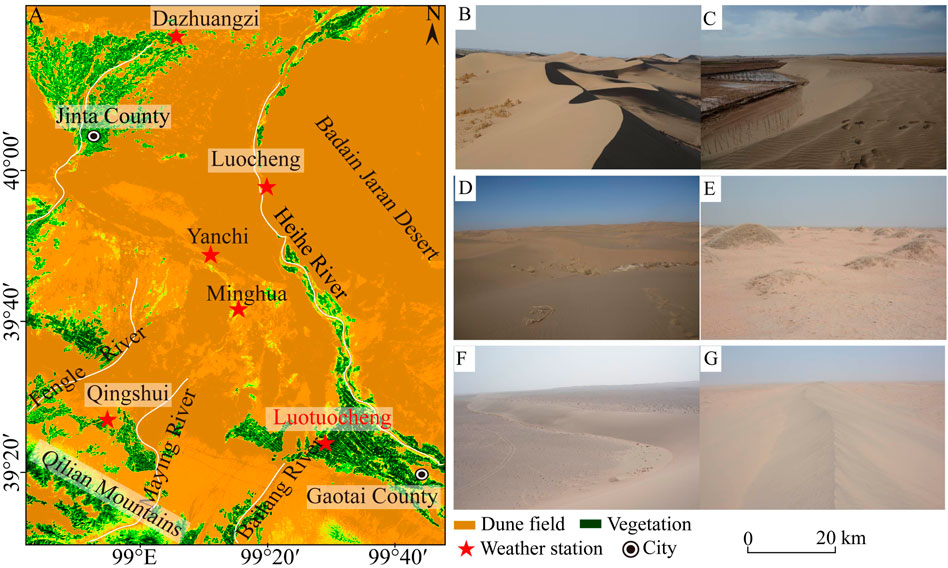
FIGURE 2. (A) Spatial distribution of vegetation cover (based on NDVI values). (B) and (C) crescent dunes and chains; (D) reticulate dunes; (E) coppice dunes; (F) raked linear dunes; (G) reversing linear dunes.
We used automatic weather station data (wind speeds), HJ-1A/B remote-sensing images, and Google Earth high-resolution images to investigate the wind energy environment, wind regimes, and eolian dune geomorphology of the study area. Using these data, we examined the relationships between dune types and wind characteristics to extract information on the regional sand environment.
Wind data were obtained from six automatic weather stations in the study area: Dazhuangzi, Luocheng, Yanchi, Luotuocheng, Minghua, and Qingshui (Figure 1). Wind speed data were acquired at 1-h intervals in 2010, which is the earliest year for which wind data were recorded at these stations. At each station, wind speed and direction sensors were installed in a clear area at a height of 10 m above the land surface. We calculated the following parameters of the wind energy environment using Fryberger and Dean’s (1979) method: drift potential (DP, in vector units), resultant drift potential (RDP), and resultant drift direction (RDD, which represents the direction of sand transportation) and directional variability (RDP/DP).
where u is the wind velocity, in knots; ut is the threshold wind velocity (the velocity required to entrain the sediment), in knots; t is the proportion of time during which the wind velocity is greater than the threshold velocity required to entrain the sediment; θ is the angle measured clockwise from 0° (north); and VU is the drift potential in each orientation class. ut in the study region was estimated to be 12 knots under dry conditions (Fryberger and Dean, 1979), and the mean sediment size is approximately 0.22 mm. Accordingly, the threshold wind velocity was also set as 12 knots.
Livingstone and Warren (1996) classified dune field patterns as transverse dunes, linear dunes, and star dunes. In our study region, the patterns also included crescent dunes and chains, coppice dunes, and sand sheets (Cook et al., 1993). For the desert and oases boundary were not our main research aims, we used HJ-1A/B remote-sensing images with 30 m spatial resolution obtained from the China Center for Resources Satellite Data and Applications (http://www.cresda.com/n16/n92006/n92162/index.html). Data analysis methods were similar to those used by Han et al. (2015).
We determined dune crest orientations through visual interpretation and manual tracking using Google Earth high-resolution images with 1.5 m spatial resolution. The images were extracted using ArcGIS software (Esri, Redlands, CA, United States). We have enlarged every satellite image at a scale of 1:250 before drawing the dune’s contour by hand. The detailed methods can be found in the study by Zhang et al. (2018).
An expectation-maximization (EM) algorithm was applied to fit the distribution of dune and wind orientation using a Gaussian mixture model (Lü et al., 2014). We assumed that the probability distribution function of critical wind and dune orientation may be described by a sum of normal distributions:
where θi is the mean wind or dune orientation; wi is the weight of wind or dune orientation in the θi direction; σi is the standard deviation of wind or dune orientation in the θi direction. Using the wind data set, the dune crest orientation was determined following the gross bedform-normal transport rule (Rubin and Hunter, 1987). According to this rule, dune orientation can be predicted using the transport ratio between primary and secondary winds and the angle between primary and secondary winds, as shown in Eq. 7.
where α is the angle between primary wind and dune crest orientation; R is the transport ratio between primary and secondary winds (R = w2/w1, in this w2>w1); and γ is the angle between primary and secondary winds.
In this study, we calculated sediment availability with the t/P′ ratio, where t is the percentage of the time when the wind is above the threshold velocity for sediment entrainment and P′ is the effective precipitation. Effective precipitation is expressed as P/Etp, where P is the precipitation and Etp is the potential evapotranspiration.
The wind regimes in Chinese deserts are controlled by high-pressure systems and large-scale geomorphology (Wang et al., 2005). In the middle areas of China’s Hexi Corridor Desert, winds associated with the Mongolia–Siberia high-pressure system occur in late spring and early summer, dominantly in the NW, W, and SW directions (Dong et al., 1993; Wang et al., 2005; Zhang et al., 2016).
Considering that only winds above the threshold wind speed (ut) are important for dune formation, we focused on the proportion of winds above this threshold. Wind data from the six weather stations are summarized in Figure 3. In the study region, the directions of winds exceeding the threshold were generally bimodal, except Luocheng, but the primary and secondary wind directions varied in different parts of the study region (Figure 3A).
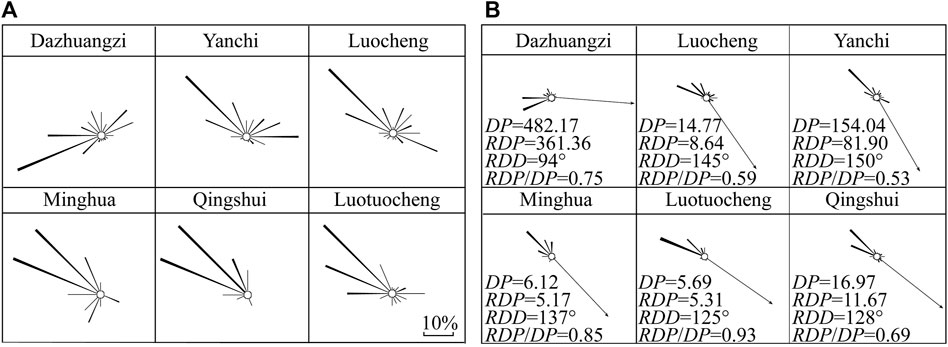
FIGURE 3. (A) Critical wind directions (with wind speeds above the threshold wind velocity required to entrain sediment). (B) Annual wind energy environments.
The threshold wind direction can be divided to three categories: Dazhuangzi, Yanchi, and Luocheng and Minghua, Qingshui, and Luotuocheng. At Dazhuangzi, the primary wind direction was WSW (27.2% of the annual time) and the secondary direction was W (15.6%). At Yanchi and Luocheng, the primary threshold wind direction was from NW (25.7% and 25.8%, respectively of the time) and the secondary direction was from WNW at Yanchi (14.8%) and E at Luocheng (15.2%). At Minghua, Qingshui and Luotuocheng, the primary threshold wind direction was from NW (28.5–34.2%), and the secondary direction was from WNW (21.5–32.9%).
The wind speed and wind energy environments at the six weather stations in 2010 are summarized in Table 2. The mean wind speeds were the highest in the west (3.95 m s−1 at Dazhuangzi) and lowest in the east (1.49 m s−1 at Luotuocheng), with the highest maximum wind speed in the middle of the region (20.5 m s−1 at Yanchi) and the lowest maximum in the south (13.4 m s−1 at Minghua).
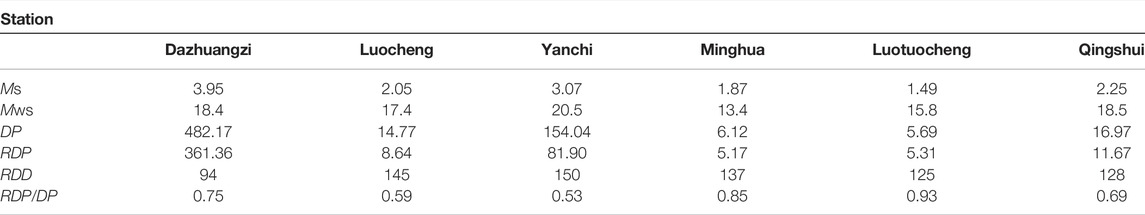
TABLE 2. Wind speed and wind energy environments at the six stations in 2010. Ms, mean speed, m s−1; Mws, maximum wind speed, m s−1; DP, drift potential, VU; RDP, resultant drift potential, VU; RDD, resultant drift direction, °; RDP/DP, directional variability.
Fryberger and Dean’s (1979) parameters of the wind energy environment can be used to identify areas with high (DP > 400) and low (DP < 200) wind energy in 2010 (Table 2; Figure 3B). According to their criteria, high wind energy occurred in the north (Dazhuyangzi) and low wind energy occurred in the middle and south of the region (Luocheng, Yanchi, Minghua, Luotuocheng, and Qingshui). This indicated that potential sand transport was larger in the north region than in the middle and south.
RDD ranged from 274 to 330° and could be divided into three regions: in the north, RDD was about 274° at Dazhuangzi; in the middle of the region (at Luocheng, Yanchi, and Minghua), RDD is between 317 and 330°; and in the south (Luotuocheng and Qingshui), RDD is between 305 and 308°. These results showed that sand transport directions were from northwest to southeast, and sand dunes moved to the southeast.
RDP/DP ranged from 0.53 to 0.93, indicating intermediate (Dazhuangzi, Luocheng, Yanchi, and Qingshui) and low (Minghua and Luotuocheng) directional variability. RDP/DP was the highest in the southeast and lowest in the middle of the study area.
Figures 4, 5 shows the monthly wind energy environment at the six stations. DP reached its maximum in April for most stations, except Dazhuangzi in December, when the RDD was SE (Table 3). The RDD was SE for almost all stations. The directional variability (RDP/DP) was generally low to intermediate.
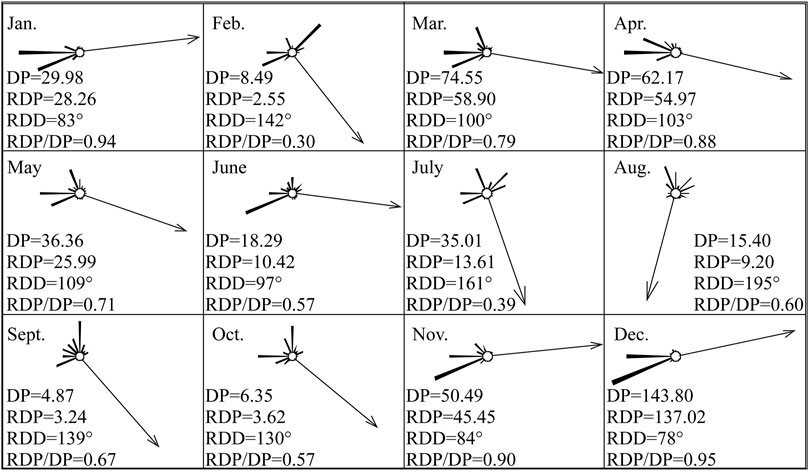
FIGURE 4. Monthly wind energy environment at Dazhuangzi; other sites shown in Supplementary Figures S1–S5.
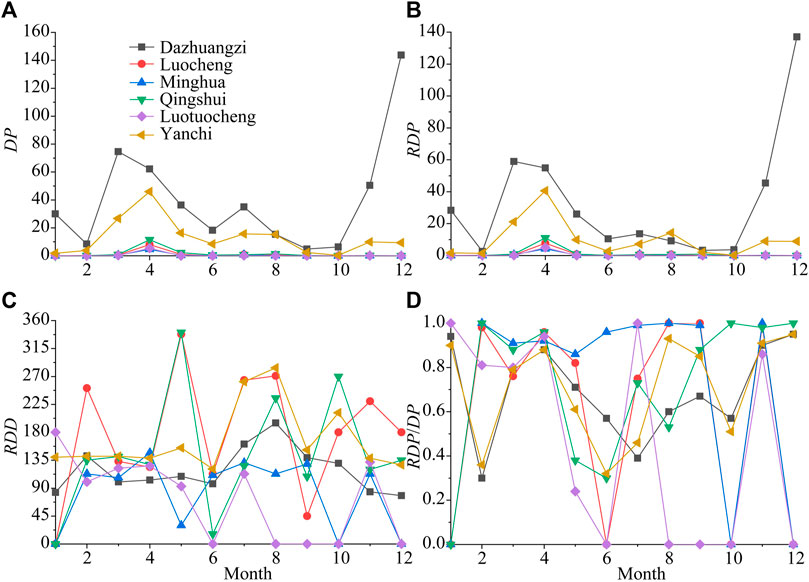
FIGURE 5. Monthly wind energy environment in the study region. (A) DP, drift potential, VU; (B) RDP, resultant drift potential, VU; (C) RDD, resultant drift direction, °; (D) RDP/DP, directional variability.
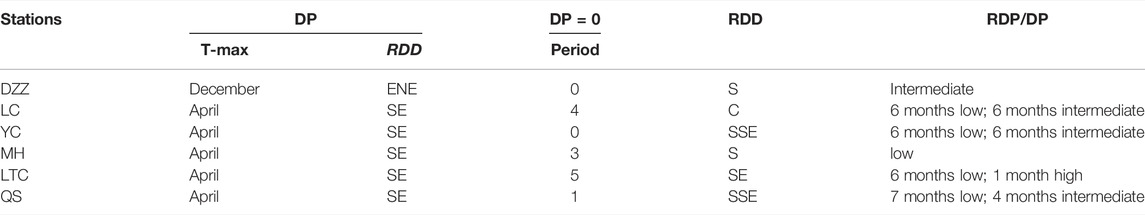
TABLE 3. Monthly wind energy environment characteristics at the six stations. DZZ, Dazhuangzi; LC, Luocheng; YC, Yanchi; MH, Minghua; LTC, Luotuocheng; QS, Qingshui; T-max, maximum DP time; Period, total DP = 0 months; C, complicated.
According to a previous study, the main dune patterns in the study area are crescent dunes, coppice dunes, and sand sheets (Wu, 2009). In the present study, we used HJ-1A/B remote-sensing images, field investigation data, and Google Earth high-resolution images to identify the dune field patterns. Dunes in this desert include crescent dunes, coppice dunes, reticulate dunes, linear dunes, star dunes, and so on. Reticulate dunes are also known as “dune networks,” “dune reticules,” “aklés,” “rhombic waffle patterns,” or “alveolar dunes” (Cook et al., 1993). They develop under a wind regime with a bidirectional wind regime where the dominant wind directions are perpendicular (Cook et al., 1993; Livingstone and Warren, 1996; Hasi et al., 1999; Ewing et al., 2006; Zhang et al., 2015) and are characterized by network patterns (Zhang et al., 2015b, Zhang et al., 2015c). Crescent dunes and chains develop under a unidirectional wind regime or a bidirectional wind regime with dominant winds in opposite directions. Linear dunes develop under bidirectional wind regimes with winds that were not oriented in opposite directions. Star dunes develop under complex wind regimes. Figure 6 shows the main patterns in the study region. The dune patterns included crescent dunes and chains (Figures 6A–E), linear dunes (Figures 6F,G), star dunes (Figure 6H), and reticulate dunes (Figure 6I), coppice dunes (Figure 6A), and sand sheets (Figure 6E). Reticulate and crescent dunes were distributed in most parts of the study region, whereas star and linear dunes were uncommon and found mostly in the eastern and northeastern parts of the study area.
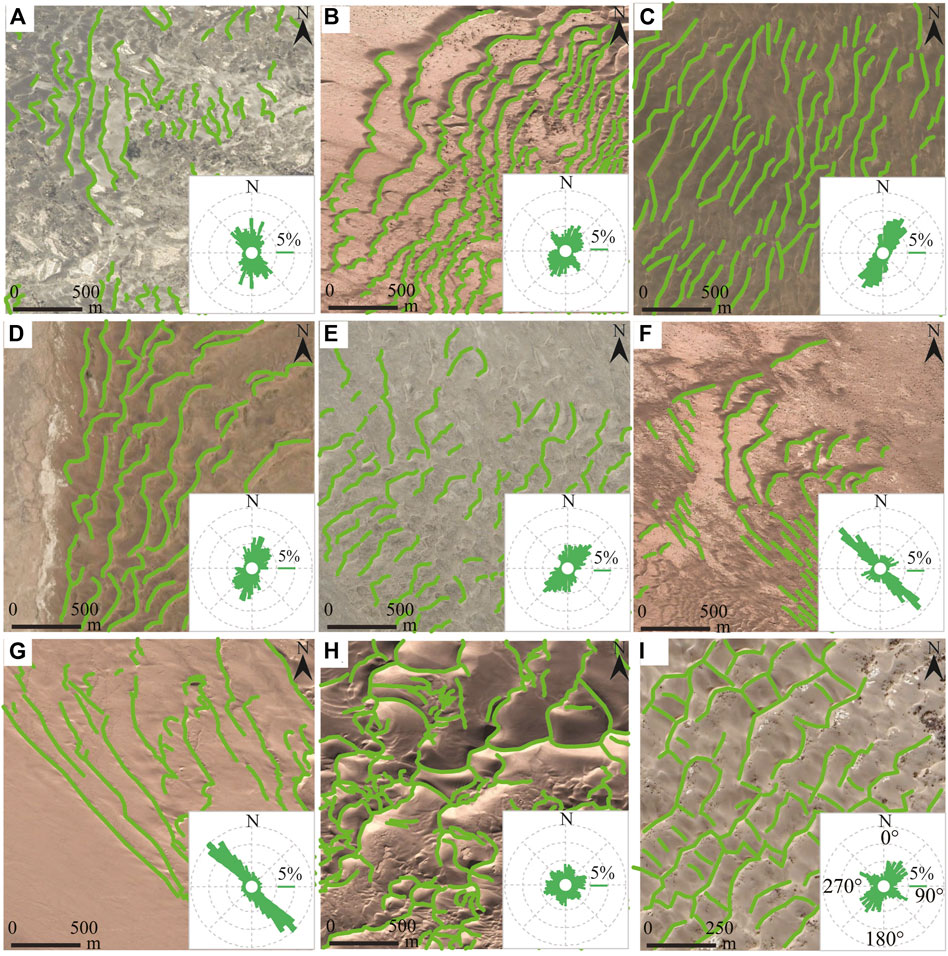
FIGURE 6. Dune field patterns and dune orientation rose plots at nine locations in the study area. (A) Crescent and coppice dunes; (B) crescent dunes and chains; (C) crescent chains; (D) crescent dunes and chains; (E) crescent dunes and chains; (F) crescent chains and linear dunes; (G) linear dunes; (H) star dunes; (I) reticulate dunes.
Crescent dunes are mainly distributed at the edges of the desert or in areas with low vegetation cover (Figure 6A). Coppice dunes are mainly distributed near oases, with some interspersed with crescent dunes (Figure 6A). Linear dunes are mainly distributed in the middle part of the study region, usually at the edges of dune fields (Figures 6F,G). Star dunes are uncommon and distributed in the east of the Jinta County and north of the Gaotai County (Figures 6D,H). Reticulate dunes are relatively common and mostly distributed in the north of the Gaotai County (Figure 6I).
The middle area of Hexi Corridor Desert has a wide range of dune crest orientations (0°–180°) (Table 4; Figure 6). Nevertheless, the dune crest orientations are mainly NE–SW, followed by NW–SE. Moreover, the dune crest orientations in the Hexi Corridor Desert are spatially heterogeneous. In dune fields A, C, D, E, and G, dune crest orientation is unidirectional, with mean orientations of 176°, 26°, 22°, 25°, and 155°, respectively (Table 5). In dune fields B, F, and I, dune crest orientations are bidirectional, with mean primary (secondary) orientations of 44° (158°), 140° (47°), and 41° (128°), respectively. Dune field H has three orientations, with mean orientations of 78° (primary), 154° (secondary), and 16° (tertiary).
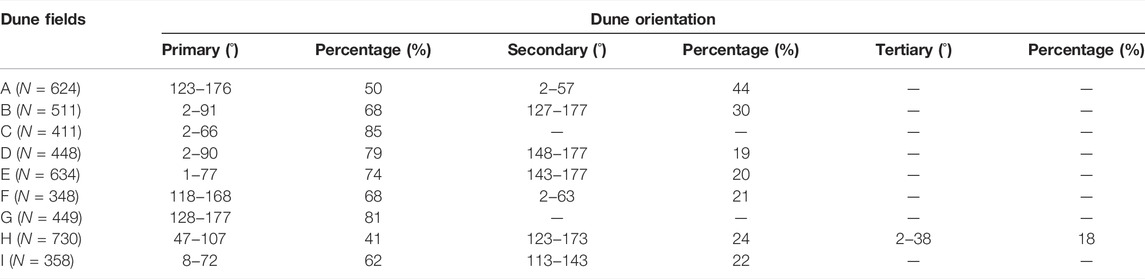
TABLE 4. Dune orientation statistics at nine locations in the study area. A, crescent and coppice dunes; B, crescent dunes and chains; C, crescent chains; D, crescent dunes and chains; E, crescent dunes and chains; F, crescent chains and linear dunes; G, linear dunes; H, star dunes; I, reticulate dunes. N is the analyzed dunes number. Locations are shown in Figure 1.
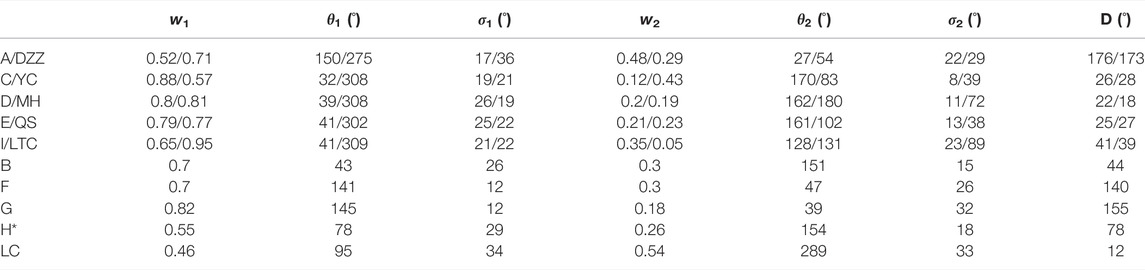
TABLE 5. Results of the Gaussian mixture model fitting the dune crest and wind orientation distribution and the real and predicted values of dune crest orientation. (H* is a star-shaped dune with three directions of crest orientation and the tertiary direction of w3, θ3 and σ3 are 0.19,16, and 10, respectively). DZZ, Dazhuangzi; LC, Luocheng; YC, Yanchi; MH, Minghua; LTC, Luotuocheng; QS, Qingshui. D, Dune orientation. Locations shown in Figure 1.
The wind regime is a very important factor for dune formation and development. In this study, we used wind data from only 1 year (2010) to analyze the relationships between dune types and wind regime because detailed weather station data of the study region before 2010 are lacking. Moreover, detailed weather stations are difficult to acquire and not freely available. We used wind velocity and direction data from 2010 to analyze dune evolution, mainly because wind velocity in Jinta and Gaotai counties has been relatively larger in the recent 28 years (Figure 7). We believe that these data are representative of the wind climatology for linking with dune types. At present, a number of interpretative simplifications and assumptions are applied in the estimation of the wind energy environment (Bullard et al., 1996; Bullard, 1997), such as acquired wind data time-scale (Zhang et al., 2016), wind direction section range, and wind velocity classification values (Pearce and Walker, 2005). However, the wind energy environment is widely used for studying sand dune classification and formation (Bullard et al., 1996; Al-Awadhia et al., 2005; Wang et al., 2005; Saqqa and Saqqa, 2007; Hereher, 2010).
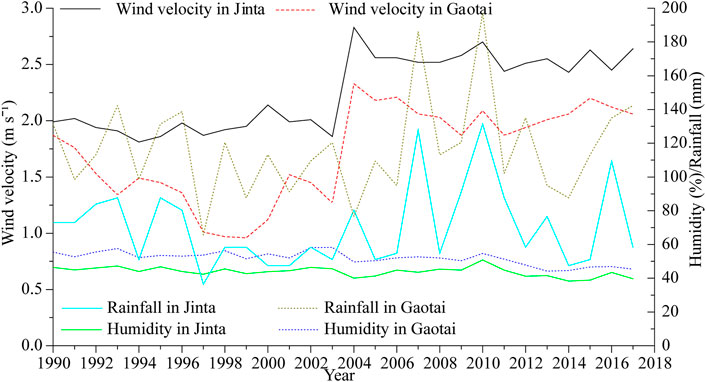
FIGURE 7. Annual wind velocity in the Jinta and Gaotai County from 1990 to 2017.
Spatial variations in the wind regime and sand supply can lead to the formation of different dune patterns. Crescent dunes are mainly distributed at the upwind edge of dune fields but with different crest orientations in different regions. Here, we focus on crescent dunes in the southeast of Dazhuangzi (Figure 6A), the west of Luocheng (Figure 6B), and the northeast of Qingshui (Figure 6E).
Southeast of Dazhuangzi (Figure 6A), the crest orientation (longest extension) was between 175° and 200° and the dunes moved ESE (85–110°). The calculated RDD was 94° (i.e., E), indicating similarities between the actual and predicted dune movement directions. In this region, the primary wind direction changes between SW and NW due to which the southwestern wings of some crescent dunes were elongated, forming asymmetrical crescent dunes. West of Luocheng (Figure 6B), the dune crest orientation is between 195° and 213°, and the dunes move SE (105–123°). The predicted RDD was 145°, indicating differences between the actual and predicted dune movement directions. In this region, the primary wind direction changes between SW and NW due to which the southwestern wings of some crescent dunes were elongated, forming asymmetrical crescent dunes. Northeast of Qingshui (Figure 6E), at the edge of the dune field, there were some single crescent dunes, but the inner dune field was dominated by crescent dunes and dune chains due to changes in the sediment supply. Specifically, sediment supply increased from the edge to the inner part of the dune field. In this region, dune crest orientation also changed from the upwind edge (between 166 and 210°) to the downwind edge (about 225°) of the dune field, and the dunes move ENE or ESE (76–120°) at the upwind edge of the dune field and SE (135°) at the downwind edge, but the calculated RDD was 128°.
The dune spacing of the crescent dunes decreases from 220 m in the northwest (with a maximum of 344 m) to 40 m in the southeast. Linear dunes are mainly distributed northwest of Luocheng and formed by the merger of crescent dunes (Figures 6F,G). In this region, dune spacing ranges from 36 to 81 m (Figure 6F) and from 124 to 156 m (Figure 6G). The dune crest orientation ranges between 145° and 161°, but the calculated RDD was between 145 and 150°. Star dunes are mainly distributed northwest of Luocheng (Figure 6H) and east of Minghua (Figure 6I). In this region, star dunes are common, with spacing between 161 and 540 m. Reticulate dunes are widely distributed in the middle and southern parts of the study region (Figure 6I). The primary crest orientation ranges between 201° and 226°, but it is mostly around 215°; the secondary crest orientation ranges between 114° and 153°, but it is mostly around 114°. The dune spacing is approximately 70 m between primary crests and approximately 40 m between secondary crests.
Spatial variations in wind direction can lead to different dune patterns. Changes in wind direction may cause crescent dunes to evolve into linear dunes or into reticulate and star dunes. In the desert area of Jinta County, dune patterns include crescent dunes (Figures 2B,C), reticulate dunes (Figure 2D), coppice dunes (Figure 2E), and linear dunes (comprising raked linear dunes and reversing linear dunes (Figures 2F,G). According to wind data from the two nearest meteorological stations (Yanchi and Luocheng), wind directions in this region are NW, SE, and NE. The critical wind direction from the NW quadrant (270° ≤ wind direction ≤360°) in Yanchi and Luocheng is 53 and 56%, respectively, and from the NE quadrant (22.5° ≤ wind direction ≤90°) is 26 and 36%, respectively. Crescent dunes and linear dunes are formed under the NW wind direction, whereas linear dunes are mainly distributed in the upwind edge of the dune areas. This implies that these two dune types formed under the same wind regimes (Figure 2 Yanchi and Luocheng). The coexistence of barchan dunes and linear dunes was also found in a previous study, and the linear dunes are mainly caused by the asymmetry of sand sources in the upwind (Lü et al., 2018; Zhang et al., 2018). Reticulate dunes are distributed in the downwind of the dune areas and formed under NW and NE wind directions (Figure 2 Yanchi and Luocheng). In this region, the movement direction of linear dunes was reversed by the action of ES winds (Figure 2 Luocheng) and reversing linear dunes formed (Figure 2G).
In the northwestern part of the desert area of Gaotai County, dune patterns are mainly crescent dunes (Figures 6C–E) and reticulate dunes (Figure 6I). According to wind data from three meteorological stations (Minghua, Qingshui, and Luotuocheng), the wind direction in this region is mainly NW. Qingshui and Luotuocheng receive little wind from the SW quadrant, promoting the formation of reticulate dunes.
Using wind speed data from meteorological stations, the dune crest orientations were predicted according to the gross bedform-normal transport rule and compared with the dune crest orientation of the nearest dune field determined based on visual interpretation and manual tracking. Regarding the dominant dune crest orientation of dune fields, A, C, D, E, and I, the actual values (176°, 26°, 22°, 25°, and 41°) corresponded well to the predicted values (173°, 28°, 18°, 27°, and 39°) with an angular deviation of 3 ± 1°. Dune fields A, C, D, E, and I are consistent with Rubin and Hunters’ theory. In contrast, dune fields B, F, G, and H did not exhibit such correspondence. This suggests that wind direction is the main factor controlling dune crest alignment in dune fields A, C, D, E, and I. Moreover, other factors such as degree of surface relief and sand availability influence dune development in dune fields B, F, G, and H. These areas feature many tall sand hills, which can change the near-surface airflow field, such as the formation of helical vortices, resulting in a deviation of the dune crest orientation from the gross bedform-normal transport rule.
We reanalyzed DP and mean annual wind velocity given by Zhang et al. (2015b), and found that DP is directly related to mean wind velocity (DP = 3.92umean3.39, R2 = 0.87, p < 0.05, Zhang et al., 2015b). Therefore, we calculated DP in Jinta and Gaotai with annual mean wind velocity and found that the wind environment corresponded to a low-energy environment (DP < 200) in the recent 28 years. Nevertheless, DP in Jinta was larger than that in Gaotai (about 1–11 times). The higher DP at the upwind of the study region is conducive to the transport of erodible sediment to the downwind region, supporting the formation of sand dunes. Accordingly, the downwind region includes larger areas of sand dunes than the upwind region (Figure 1).
Aeolian geomorphology reflects the complex external environment within which dune patterns develop, and the key factors responsible for their formation and evolution include the local wind regime, wind energy, sediment supply, source and deposition area geometry, areal limits (deposition area), and antecedent environmental conditions (Ewing and Kocurek, 2010a, Ewing and Kocurek, 2010b; Kocurek et al., 2010; Lü et al., 2018).
Aeolian sediment supply includes sediments with a sufficiently small grain size that can be transported by wind. The generation of aeolian sediment supply involves the accumulation of fluvial, alluvial, lacustrine, or coastal sediments, which may subsequently undergo deflation by wind (Kocurek and Lancaster, 1999). Sediment supply, sediment availability, and transport capacity correspond to the basin-scale sediment state of aeolian dune fields and sand seas (Kocurek and Lancaster, 1999). In sediment supply, the actual transport rate is used as a proxy for sediment availability, and the potential transport rate is used as a measure of the transport capacity of wind (Kocurek and Lancaster, 1999). Although this parameter is difficult to quantify, the dune mobility index is widely used as a measure of sediment mobility (e.g., Muhs and Maat, 1993; Bullard et al., 1997). For this calculation, we used data from 1980 to 2010 obtained from the meteorological stations in each part of the study area (Figure 1). The dune mobility index reached its maximum value in the northern part of the study region (10.19), followed by the middle part (4.92). In contrast, the minimum value (0.19) was observed in the southern part. This phenomenon indicated that dunes formed easily in the north than south.
In the arid regions, rivers are very important for the formation and development of aeolian dunes and sand sea distribution (Bullard and McTainsh, 2003; Yan et al., 2015). Rivers can not only serve as an index of sand sediment supply and sand availability, but they also affect the spatial distribution of aeolian dunes patterns. For instance, rivers can limit the downwind expansion of dune fields, particularly in wide parts of rivers. One such example is the north (Luocheng) and south (Luotuocheng). In the north, sediment materials are not transported across the river, but farther south, where the river is relatively narrow, they are transported across the river.
Crescent dunes form in areas with relatively low sediment availability, under a unimodal wind regime (Cook et al., 1993). Under the same wind conditions, several factors, such as sediment supply, dune formation age, and climate change, could affect variations in dune types. For the same dune formation age under the same wind regime, sediment supply is the key factor because sediment supply increases during the evolution from crescent dunes to reticulate and star dunes. However, under different dune formation ages, climate could be the key factor, such as in the study region (Figures 6G,H). Figure 6H shows high star dunes, which lie adjacent to linear dunes (Figure 6G). At the edges of oases and upwind of dune fields, the limited sediment supply and unimodal wind regime lead to the formation of crescent dunes (Figures 2; Figures 6A,B). With increasing distance downwind of the upwind edge of oases, the sediment supply increases and the dune field pattern changes to reticular dunes and a few star dunes (Figures 6H,I), as is the case southeast of Jinta County. Northwest of Luocheng, small linear dunes formed due to changes in wind direction and the limited sediment supply. The primary wind direction in Dazhuangzi is SW, but it changes to NW in Luocheng. As a result, the southwestern wings of crescent dunes eventually elongate to become linear dunes (Figures 2F, 6G), as Bagnold (1941) hypothesized.
Dune field patterns have been described using many classification systems, such as those by Melton (1940), Bagnold (1941), Fedorovich (1948), McKee (1979), Wu (1987), Cook et al. (1993), Lancaster (1995), Livingstone and Warren (1996), and Thomas (1997). However, no consensus has been reached on the nomenclature of dune patterns. For example, reticulate and star dunes are considered to be different patterns in the Fedorovich (1948) and Cooke et al. (1993) classification systems, whereas McKee (1979), Lancaster (1995), and Thomas (1997) do not include reticulate dunes. Furthermore, Livingstone and Warren (1996) consider reticulate dunes and star dunes to be the same pattern, and Wu (1987) suggested that reticulate dunes are part of the group of transverse dunes, whereas star dunes form under multidirectional wind directions. All these disputes are caused by reticulate dunes located in remote regions. In our study region, there are many reticulate dunes, and based on the local wind regime and sediment supply characteristics, reticulate dunes should belong to the category of star dunes. This is supported by the fact that reticulate dunes are frequently distributed in the same locations as the star dunes, and in some areas, linkages between two or more large reticulate dunes resemble star dunes. This suggests that reticulate dunes belong to the group of star dunes.
In this study, we analyzed the wind regime, wind energy environment, and dune patterns in the middle areas of China’s Hexi Corridor Desert. The results provide information on regional aeolian geomorphology and wind energy environment in a part of northern China that has rarely been studied. The main conclusions are as follows:
In the middle area of Hexi Corridor Desert, the dune patterns include crescent, reticulate, coppice, star, and linear dunes, and sand sheets. In particular, reticulate dunes are distributed in the same areas as star dunes, suggesting that reticulate dunes belong to the group of star dunes.
The region’s wind energy environment ranges from high to low, with the energy decreasing from NW to SE. The RDD is from NW to SE, but there are some differences within the region. The directional variability is low to intermediate and increases from north to south.
Dune crest orientations were calculated according to the gross bedform-normal transport rule. The predicted dominant orientation showed good correspondence with the actual orientation.
The middle areas of Hexi Corridor Desert lie between the middle and lower reaches of two large continental rivers. Along with these rivers, other rivers in the region provide large amounts of alluvial source materials. Therefore, sand dune types in the middle area of Hexi Corridor Desert are controlled by the wind regime, and the spatial distributions of sand coverage are controlled by the spatial distribution of rivers.
Although our study demonstrated that the types and spatial distributions of sand dunes are controlled by the wind regime and sediment supply, the development and migration of dunes require further investigation. It is noteworthy that we analyzed data from only 1 year because wind regime data are not freely available and difficult to obtain. Therefore, additional monitoring will be required to determine whether these results are representative of long-term patterns.
The raw data supporting the conclusion of this article will be made available by the authors, without undue reservation.
All authors listed have made a substantial, direct, and intellectual contribution to the work and approved it for publication.
The authors declare that the research was conducted in the absence of any commercial or financial relationships that could be construed as a potential conflict of interest.
All claims expressed in this article are solely those of the authors and do not necessarily represent those of their affiliated organizations, or those of the publisher, the editors, and the reviewers. Any product that may be evaluated in this article, or claim that may be made by its manufacturer, is not guaranteed or endorsed by the publisher.
We gratefully acknowledge funding from the National Natural Science Foundation of China (Nos. 41971014 and 41771011). We are also indebted to the China Center for Resources Satellite Data and Applications, which provided the HJ-1A/B images.
The Supplementary Material for this article can be found online at: https://www.frontiersin.org/articles/10.3389/feart.2022.818338/full#supplementary-material
Al-Awadhi, J. M., Al-Helal, A., and Al-Enezi, A. (2005). Sand Drift Potential in the Desert of Kuwait. J. Arid Environ. 63, 425–438. doi:10.1016/j.jaridenv.2005.03.011
Beveridge, C., Kocurek, G., Ewing, R. C., Lancaster, N., Morthekai, P., Singhvi, A. K., et al. (2006). Development of Spatially Diverse and Complex Dune-Field Patterns: Gran Desierto Dune Field, Sonora, Mexico. Sedimentology 53, 1391–1409. doi:10.1111/j.1365-3091.2006.00814.x
Bullard, J. E. (1997). A Note on the Use of the "Fryberger Method" for Evaluating Potential Sand Transport by Wind. J. Sediment. Res. 67, 499–501. doi:10.1306/d42685a9-2b26-11d7-8648000102c1865d
Bullard, J. E., and McTainsh, G. H. (2003). Aeolian-fluvial Interactions in Dryland Environments: Examples, Concepts and Australia Case Studyfluvial Interactions in Dryland Environments: Examples, Concepts, and Australia Case Study. Prog. Phys. Geogr. Earth Environ. 27, 471–501. doi:10.1191/0309133303pp386ra
Bullard, J. E., Thomas, D. S. G., Livingstone, I., and Wiggs, G. F. S. (1996). Wind Energy Variations in the Southwestern Kalahari Desert and Implications for Linear Dunefield Activity. Earth Surf. Process. Landforms 21, 263–278. doi:10.1002/(sici)1096-9837(199603)21:3<263::aid-esp627>3.0.co;2-i
Bullard, J. E., Thomas, D. S. G., Livingstone, I., and Wiggs, G. S. F. (1997). Dunefield Activity and Interactions with Climatic Variability in the Southwest Kalahari Desert. Earth Surf. Process. Landforms 22, 165–174. doi:10.1002/(sici)1096-9837(199702)22:2<165::aid-esp687>3.0.co;2-9
Derickson, D., Kocurek, G., Ewing, R. C., and Bristow, C. (2008). Origin of a Complex and Spatially Diverse Dune-Field Pattern, Algodones, Southeastern California. Geomorphology 99, 186–204. doi:10.1016/j.geomorph.2007.10.016
Dong, G. R., Li, B. S., and Wen, X. (1993). “Aeolian Landforms in China,” in Features and Evolution of Landforms in China. Editor J. Yang (Beijing: China Ocean Press), 149–172.
Ewing, R. C., and Kocurek, G. (2010b). Aeolian Dune Interactions and Dune-Field Pattern Formation: White Sands Dune Field, New Mexico. Sedimentology 57, 1199–1219. doi:10.1111/j.1365-3091.2009.01143.x
Ewing, R. C., and Kocurek, G. (2010a). Aeolian Dune-Field Pattern Boundary Conditions. Geomorphology 114 (3), 175–187. doi:10.1016/j.geomorph.2009.06.015
Ewing, R. C., Kocurek, G., and Lake, L. W. (2006). Pattern Analysis of Dune-Field Parametersfield Parameters. Earth Surf. Process. Landforms 31, 1176–1191. doi:10.1002/esp.1312
Fedorovich, B. A. (1948). The Relief of Asian Sands as a Reflection of Atmospheric Circulation Processes. Probl. Fiz. Geogr. 6 (13), 91–109.
Fitzsimmons, K. E., Nowatzki, M. N., Dave, A. K., and HartwigHarder, H. (2020). Intersections between Wind Regimes, Topography and Sediment Supply: Perspectives from Aeolian Landforms in Central Asia. Palaeogeogr. Palaeoclimatol. Palaeoecol. 540 (15), 109531. doi:10.1016/j.palaeo.2019.109531
Fryberger, S. G., and Dean, G. (1979). “Dune Forms and Wind Regime,” in A Study of Global Sand Seas. Editor E. D. McKee (Washington, D.C. Professional Paper: USGS).
Guo, X. L. (2015). Study on Wind Speed Variation Characteristics and Influencing Factors in Hexi Region in Recent 40 Years. Lanzhou: Lanzhou Jiaotong University.
Hack, J. T. (1941). Dunes of the Western Navajo Country. Geogr. Rev. 31, 240–263. doi:10.2307/210206
Han, G., Zhang, G., You, L., Wang, Y., Yang, L., Yang, J., et al. (2016). Deflated Rims along the Xiangshui River on the Xiliaohe Plain, Northeast China: A Case of Active Fluvial-Aeolian Interactionsflated Rims along the Xiangshui River on the Xiliaohe Plain, Northeast China: A Case of Active FLuvial–Aeolian Interactions. Geomorphology 257, 47–56. doi:10.1016/j.geomorph.2015.12.025
Han, L., Zhang, Z., Zhang, Q., and Wan, X. (2015). Desertification Assessments in the Hexi Corridor of Northern China's Gansu Province by Remote Sensing. Nat. Hazards 75, 2715–2731. doi:10.1007/s11069-014-1457-0
Hasi, E., Dong, G. R., and Wang, G. Y. (1999). Morphodynamic study of reticulate dunes at Southeastern fringe of the Tengger Desert. Science. China Series D: Earth Science. 42 (02), 207–215. doi:10.1007/BF02878520
Hereher, M. E. (2018). Geomorphology and Drift Potential of Major Aeolian Sand Deposits in Egypt. Geomorphology 304, 113–120. doi:10.1016/j.geomorph.2017.12.041
Hereher, M. E. (2010). Sand Movement Patterns in the Western Desert of Egypt: an Environmental Concern. Environ. Earth Sci. 59, 1119–1127. doi:10.1007/s12665-009-0102-9
Jia, W. X. (2012). Temporal and Spatial Changes of Precipitation in Qilian Mountain and Hexi Corridor during 1960-2009[J]. Acta Geogr. Sin. 67 (5), 631–644. doi:10.11821/xb201205006
Kocurek, G., Ewing, R. C., and Mohrig, D. (2010). How Do Bedform Patterns Arise? New Views on the Role of Bedform Interactions within a Set of Boundary Conditions. Earth Surf. Process. Landforms 35, 51–63. doi:10.1002/esp.1913
Kocurek, G., and Lancaster, N. (1999). Aeolian System Sediment State: Theory and Mojave Desert Kelso Dune Field Example. Sedimentology 46, 505–515. doi:10.1046/j.1365-3091.1999.00227.x
Lancaster, N. (1994). “Dune Morphology and Dynamics,” in Geomorphology of Desert Environments. Editors A. D. Abrahams, and A. J. Parsons (London: Chapman & Hall). doi:10.1007/978-94-015-8254-4_18
Li, B. C. (1998). An Investigation and Study on the Desertification of the Ancient Oases from Han to Tang Dynamic in the Hexi Corridor. Acta Geogr. Sin. 53, 106–115.
Liu, B., and Coulthard, T. J. (2017). Modelling the Interaction of Aeolian and Fluvial Processes with a Combined Cellular Model of Sand Dunes and River Systemsfluvial Processes with a Combined Cellular Model of Sand Dunes and River Systems. Comput. Geosciences 106, 1–9. doi:10.1016/j.cageo.2017.05.003
Livingstone, I., and Warren, A. (1996). Aeolian Geomorphology: An Introduction. Harlow: Addison Wesley Longman Limited.
Lü, P., Dong, Z. B., and Rozier, O. (2018). The Combined Effect of Sediment Availability and Wind Regime on the Morphology of Aeolian Sand Dunes. J. Geophys. Res. Earth Surf. 123, 2878–2886. doi:10.1029/2017JF004361
Lü, P., Narteau, C., Dong, Z. B., Zhang, Z. C., and Pont, S. C. D. (2014). Emergence of Oblique Dunes in a Landscape-Scale Experiment. Nat. Geosci. 7, 99–103. doi:10.1038/ngeo2047
Luo, X. L., Li, Y. G., and Yan, Z. M. (2021). Evolution Characteristic of Sandstorm and Meteorological Influence Factors in Hexi Corridor in Recent 60 Years. Res. soil water conservation 28 (05), 254–267. doi:10.13869/j.cnki.rswc.2021.05.029
McKee, E. D. (1979). “Introduction to a Study of Global Sand Seas,” in A Study of Global Sand Seas, 3-19. Editor E. D. McKee (Washington, D.C. Professional Paper: USGS).
Melton, F. A. (1940). A Tentative Classification of Sand Dunes its Application to Dune History in the Southern High Plains. J. Geol. 48, 113–174. doi:10.1086/624871
Muhs, D. R., and Maat, P. B. (1993). The Potential Response of Eolian Sands to Greenhouse Warming and Precipitation Reduction on the Great Plains of the U.S.A. J. Arid Environ. 25, 351–361. doi:10.1006/jare.1993.1068
Nottebaum, V., Lehmkuhl, F., Stauch, G., Lu, H., and Yi, S. (2015). Late Quaternary Aeolian Sand Deposition Sustained by Fluvial Reworking and Sediment Supply in the Hexi Corridor - an Example from Northern Chinese Drylands. Geomorphology 250, 113–127. doi:10.1016/j.geomorph.2015.08.014
Pearce, K. I., and Walker, I. J. (2005). Frequency and Magnitude Biases in the 'Fryberger' Model, with Implications for Characterizing Geomorphically Effective Winds. Geomorphology 68, 39–55. doi:10.1016/j.geomorph.2004.09.030
Rubin, D. M., and Hunter, R. E. (1987). Bedform Alignment in Directionally Varying Flows. Science 237, 276–278. doi:10.1126/science.237.4812.276
Saqqa, W. A., and Saqqa, A. W. (2007). A Computer Program (WDTSRP) Designed for Computation of Sand Drift Potential (DP) and Plotting Sand Roses. Earth Surf. Process. Landforms 32, 832–840. doi:10.1002/esp.1451
Thomas, D. S. G. (1997). “Sand Seas and Aeolian Bedforms,” in Arid Zone Geomorphology. Editor D. S. G. Thomas (London: Belhaven Press).
Wang, X., Dong, Z., Yan, P., Zhang, J., and Qian, G. (2005). Wind Energy Environments and Dunefield Activity in the Chinese Deserts. Geomorphology 65, 33–48. doi:10.1016/j.geomorph.2004.06.009
Wasson, R. J., and Hyde, R. (1983). Factors Determining Desert Dune Type. Nature 304, 337–339. doi:10.1038/304337a0
Yan, P., Li, X., Ma, Y., Wu, W., and Qian, Y. (2015). Morphological Characteristics of Interactions between Deserts and Rivers in Northern China. Aeolian Res. 19, 225–233. doi:10.1016/j.aeolia.2015.01.005
Zhang, Z. C., Dong, Z. B., Wen, Q., and Jiang, C. W. (2015c). Wind Regimes and Aeolian Geomorphology in the Western and Southwestern Tengger Desert. Geol. J. 50, 707–719. doi:10.1002/gj.2586
Zhang, Z. C., Dong, Z. B., and Zhao, A. G. (2016b). The Effect of the Time Interval Used to Calculatemean Wind Velocity on the Calculated Drift Potential, Relative Drift Potential, and Resultant Drift Direction for Sands from Three Deserts in Northern China. Theor. Appl. Climatol. 123, 151–160. doi:10.1007/s00704-014-1345-2
Zhang, Z., and Dong, Z. (2015). Grain Size Characteristics in the Hexi Corridor Desert. Aeolian Res. 18, 55–67. doi:10.1016/j.aeolia.2015.05.006
Zhang, Z., Dong, Z., Hu, G., and Parteli, E. (2018). Migration and Morphology of Asymmetric Barchans in the Central Hexi Corridor of Northwest China. Geosciences 8, 204. doi:10.3390/geosciences8060204
Zhang, Z., Dong, Z., and Li, C. (2015a). Wind Regime and Sand Transport in China's Badain Jaran Desert. Aeolian Res. 17, 1–13. doi:10.1016/j.aeolia.2015.01.004
Zhang, Z., Dong, Z., and Li, J. (2015b). Grain‐size Characteristics of Dune Networks in china's Tengger Desert. Geogr. Ann. Ser. A, Phys. Geogr. 97, 681–693. doi:10.1111/geoa.12108
Zhang, Z., Dong, Z., Li, J., Qian, G., and Jiang, C. (2016a). Implications of Surface Properties for Dust Emission from Gravel Deserts (Gobis) in the Hexi Corridor. Geoderma 268, 69–77. doi:10.1016/j.geoderma.2016.01.011
Keywords: Hexi corridor, desert, wind energy environment, dune patterns, factor
Citation: Zhang Y and Zhang Z (2022) Dune Field Patterns and Their Control Factors in the Middle Areas of China’s Hexi Corridor Desert. Front. Earth Sci. 10:818338. doi: 10.3389/feart.2022.818338
Received: 19 November 2021; Accepted: 25 April 2022;
Published: 03 June 2022.
Edited by:
Zhuolun Li, Lanzhou University, ChinaReviewed by:
Jiyan Li, Taiyuan Normal University, ChinaCopyright © 2022 Zhang and Zhang. This is an open-access article distributed under the terms of the Creative Commons Attribution License (CC BY). The use, distribution or reproduction in other forums is permitted, provided the original author(s) and the copyright owner(s) are credited and that the original publication in this journal is cited, in accordance with accepted academic practice. No use, distribution or reproduction is permitted which does not comply with these terms.
*Correspondence: Zhengcai Zhang, emhhbmd6aHNpQHNpbmEuY29t
Disclaimer: All claims expressed in this article are solely those of the authors and do not necessarily represent those of their affiliated organizations, or those of the publisher, the editors and the reviewers. Any product that may be evaluated in this article or claim that may be made by its manufacturer is not guaranteed or endorsed by the publisher.
Research integrity at Frontiers
Learn more about the work of our research integrity team to safeguard the quality of each article we publish.