 Yue Cui
 Chuanqing Zhu
 Nansheng Qiu
 Boning Tang1
95% of researchers rate our articles as excellent or good
Learn more about the work of our research integrity team to safeguard the quality of each article we publish.
Find out more
ORIGINAL RESEARCH article
Front. Earth Sci. , 01 March 2022
Sec. Economic Geology
Volume 10 - 2022 | https://doi.org/10.3389/feart.2022.818129
This article is part of the Research Topic Progress in Exploration, Development and Utilization of Geothermal Energy View all 28 articles
The Xiong’an new area has abundant geothermal resources, and heat source research plays an important role in the geothermal system. Using the logging curve, we calculated the radioactive heat production of sedimentary layers and igneous rocks in non-sample wells; analyzed the influence of igneous rock distribution, residual heat, and its thermal increment on crust; and clarified the heat source origin of hydrothermal geothermal resources in Xiong’an new area. Sedimentary layers data (5,504) of 20 wells were converted to determine the applicable GR-A empirical relationship, and the radioactive heat production of igneous rocks with different lithologies was estimated. Finite element simulations show that igneous rock intrusions in the study area reach thermal equilibrium with the surrounding rock after 0.5 Ma at most. Upon cooling, the difference in thermal physical properties to the surrounding rock only leads to a higher heat flow of about 3.55 mW/m2 in the partial of the Niutuozhen salient. It is known that the development of igneous facies impacts the heat source. Under the geothermal background of “cold crust-hot mantle,” the mantel heat was the primary source, which the Yanshanian intrusions injected into the central salient, increasing the crustal heat by about 12% and the heat source by about 6%. The measured heat flow becomes higher in the salient (raised about 12.04 mW/m2–29.25 mW/m2) where the deep faults developed due to the groundwater convection. Heat conduction from crust-mantle heat flow and heat convection caused by deep faults are responsible for the current geothermal state in Xiong’an new area.
Magmatic activity is closely related to tectonic activity, which is the basis for the study of basin formation, thermal evolution, and present thermal state (Rosa et al., 2015; Liu et al., 2018; Alain et al., 2020). In areas where volcanoes are developed, the temperature field is not only affected by the steady-state temperature field but also related to the heat carried by high-temperature magma. The steady geothermal field mainly occurs in the lithosphere without a high-temperature abnormal body, which is related to mantle heat, the heat produced by radioactive elements, and stratigraphic thermal conductivity (Mundry, 1970; Liu et al., 2018).
The Xiong’an new area is located in the Bohai Bay Basin, which has similar geothermal characteristics and heat flow background. The average geothermal gradient in the Bohai Bay Basin is 34.7°C/km, while that in the Jizhong depression, where the study area is located, is relatively low (32.4°C/km). The average heat flow in the Bohai Bay Basin is 64.4 ± 8.1 mW/m2, which is 2.5 mW/m2 higher than that of Chinese basins (61 mW/m2), where that of Jizhong depression is 61.1 ± 9.4 mW/m2 (Hu et al., 2001; Gong, 2003; Gong et al., 2011; Qiu et al., 2014; Chang et al., 2016). Archaeozoic, multi-stage magmatic activities have developed in the Bohai Bay Basin, and large areas of magmatic rocks were formed during late Mesozoic and Cenozoic mantle-derived volcanism due to the reduction of the lithosphere caused by the subduction of the western Pacific plate. Previous studies on the eruption period and scale of volcanic have been carried out (Zhang and Shi, 1997; Wu et al., 2005; Tang et al., 2013; Gong, 2014), but the residual heat effects of volcanic intrusion in the region have not been studied enough. Although the contribution of igneous rocks to the thermal anomalies in Xiong’an new area is considered to be insufficient, and a “binary heat accumulation” model of crust-mantle production has been proposed, there are insufficient opportunities for quantitative studies (Pang et al., 2015).
Therefore, this paper determined the spatiotemporal distribution of Mesozoic and Cenozoic igneous rocks, simulated the influence of magmatic intrusions on the geothermal field, quantitatively calculated the influence of igneous rocks on current thermal anomalies, and analyzed the heat source origin in a deep stratum of the study area to provide a reference for understanding the mechanism of geothermal resources in Xiong’an new area.
The Xiong’an new area is located in the north of the Jizhong depression in the Bohai Bay Basin of the North China Craton (NCC), containing Rongcheng salient, Niutuozhen salient, Gaoyang low salient, etc., surrounded by Langgu sag, Xushui sag, Baxian sag, Baoding sag, and Raoyang sag (Figure 1). Most of the area is covered by three geothermal fields of Niutuozhen, Rongcheng, and Gaoyang, where there are abundant geothermal resources, most of which are exposed on the surface in the form of hot springs, and underground hot water is also found in drilling wells.
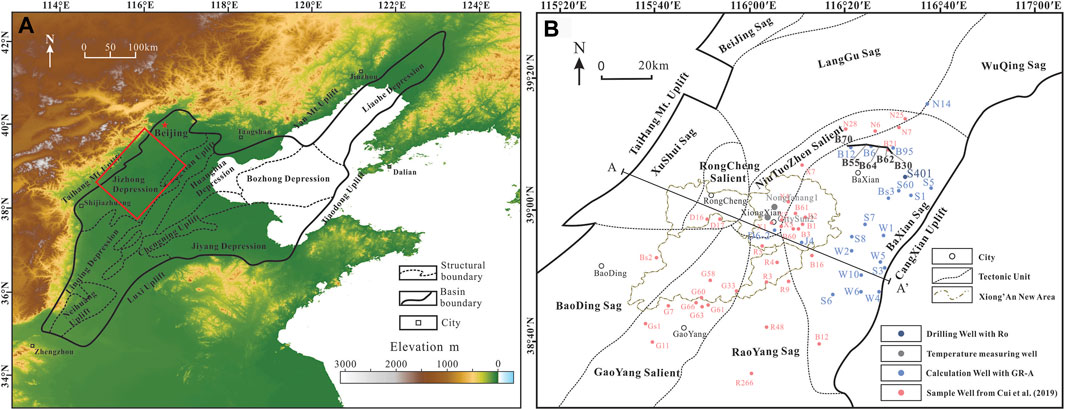
FIGURE 1. Structural location map of (A) Bohai Bay Basin and (B) Xiong’an new area.
The Xiong’an new area is in the Bohai Bay Basin, a Meso-Cenozoic superficial rift basin in the eastern of the NCC which has undergone several tectonic movements since the Archean. From the extension and rift structure formed in the middle and late Proterozoic, the platform was uplifted and eroded as a whole, and a stable marine craton was formed in the early Paleozoic. In the Middle Carboniferous, the plate descended and developed marine continents with alternate deposits. Hercynian movement at the end of the Permian caused the disappearance of the Triassic in the basin. During the Mesozoic Yanshanian movement, strong intracontinental orogeny, basin formation, and magmatic-thermal processes developed, in addition to a series of large faults developed in NE, NNE, and EW directions. Taihang, Yanshan, and Jiaoliao mountains rose and exposed a lot of metamorphism bedrock. The magmatic activity in Mesozoic Yanshanian was the strongest sign of tectonic movement in the Jizhong depression (Li et al., 2017). The Niutuozhen salient in the study area began to develop and continued to uplift during the late Yanshanian movement, exposing the Mesoproterozoic strata, of which the Jurassic was completely denuded. Affected by the Paleogene Himalayan movement, strong fault tectonic movement occurred in the basin, forming a series of faults and uplifts (He and Zheng, 2016; Liang et al., 2016). Meanwhile, the Cenozoic Himalayan period was characterized by extremely extensive basalt eruption (Liu, 1992; Wang et al., 2012). The basin entered the depression stage, changing from stretching to compression and weaking fault activity during the Neogene.
Gravity and magnetic anomalies area combined at different depths, densities, and magnetic geological bodies, including local gravity and magnetic variations caused by deep faults and igneous rocks. Bouguer gravity with high anomaly reflects basement uplift, while low anomaly reflects basin and depression (Li et al., 2017). Magnetic exploration can determine the boundaries of magnetic geological bodies and structures, while local gravity and magnetic anomalies can usually be used to identify deep faults and igneous rock (Wu and Pan, 2005; Pamukcu et al., 2007). According to the statistics of Bouguer gravity anomaly and regional rock magnetism in Hebei Province (Li, 1999; Guo et al., 2001; Li et al., 2017; Yu et al., 2017; Shan, 2018), the positive and negative gravity anomalies correspond well with the shapes of the salient and sag and the orientation of the large faults, and the Archean-Paleoproterozoic deep metamorphic rocks in North China constitute the magnetic basement of this area, along with carbonate rocks and sand-mudstone which are generally non-magnetic and weak magnetism, respectively. The Quaternary strata, on the other hand, are more magnetic due to the local development of clays. And the Yanshanian igneous rock also has strong magnetism. It was found that there are two gently and moniliform rising positive magnetic anomalies in Xiongxian and on the east and west sides of Rongcheng (Yu et al., 2017), respectively, which indicates that igneous rocks are developed here.
Thus, the study area has developed metamorphic rocks of the Archean, marine carbonate rocks of the middle and late Proterozoic (Ch and Jx), to marine carbonate rocks of the middle Ordovician of Paleozoic (Pz), marine continent alternate facies clastic rocks intercalated with carbonate rocks of the Permian of Pz. Mesozoic (Mz) strata are locally developed, mainly mudstone and volcanic eruptive rocks, and Paleogene (E), Neogene (N), and Quaternary (Q) lacustrine and fluvial facies sandstone and mudstone from bottom to top. Among them, the sandstone of Minghuazhen formation and Guantao formation (N), the carbonate rock of the Gaoyuzhuang formation, and Wumishan formation (Jx) are favorable geothermal reservoirs. The karst heat storage in Wumishan formation has the characteristics of wide distribution, shallow burial, high temperature, large reserves, high water quality, and ease to recharge, which is the key development reservoir currently (Kong et al., 2015).
The thermal evolution of the NCC remained stable from the early Paleozoic to Mesozoic which has experienced two heat flow peaks since the Mesozoic (85 mW/m2–88 mW/m2), while the current heat flow is 60 mW/m2–68 mW/m2 (Qiu et al., 2016). The current geothermal gradient at a uniform depth of 0–3000 m is between 20.8°C/km–41.0°C/km, with an average of 31.6°C/km (Chang et al., 2016). The current heat flow is between 48.7–79.7 mW/m2, and the geothermal gradient and heat flow gradually increase from west to east, with a good correspondence between their planar distribution (Qiu et al., 2016).
Up to now, there have been few studies on the heat production of the sedimentary layers in the Jizhong depression of Bohai Bay Basin. Mostly, the heat production of 38 samples from 25 wells measured by Gong (2003) was used. Based on this, the measured heat production of 83 samples from 32 wells was added in a previous study (Cui et al., 2019). However, for the unsampled area, the relationship between natural gamma-ray logging and heat production still needs to be investigated to determine the heat production of the sedimentary layers in the whole study area. In this paper, the logging curves were collected from 20 representative wells in the central of the Jizhong depression, where the Xiong’an new area is located. The measurement interval is 0.125 m.
Natural gamma-ray logging (GR) is one of the common radioactive geophysical logging methods, which records the intensity of the natural gamma-rays along the stratigraphy of the borehole wall. Rocks generally contain different amounts of radioactive elements and release radiation constantly. The principle of natural gamma-ray logging is to place a detector instrument into the well to receive the gamma-ray produced by the decay of radioactive elements (Brich, 1954; Rao et al., 2014). The detector can convert the gamma-ray into an electric pulse signal, and then the electric pulse signal is amplified by the amplifier and transmitted to the ground by a cable. The surface instrument converts the number of electric pulses formed per minute into a proportional potential difference for recording, which usually needs to be shaped by a discriminator to eliminate interference and distortion signals, and then to integrate them. Finally, natural gamma-ray logging data are obtained. The standard unit of natural gamma-ray logging well is API, and the curve is represented by GR. Because the sensitivity of the natural gamma-ray logging tool to U, Th, and K have a similar proportion to heat production coefficient, there must be a simple linear relationship between natural gamma-ray logging count and heat production within a specific borehole depth interval, which constitutes the theoretical basis for directly calculating rock heat production by using natural gamma-ray logging (Li, 2015). The measurement interval of natural gamma-ray logging is only 0.125 m, and the accuracy is guaranteed by the dense measuring points. The conversion accuracy of heat production is also higher, which can be on a decimeter level.
Rybach (1986) first proposed the linear relationship of GR-A based on the comparison between the measured heat production and the natural gamma-ray count, and the calculated equation is as follows:
Bucker and Rybach (1996) made further corrections to the linear relationship of GR-A based on a large number of measured data of borehole cores and fitting by the least square’s method. This is also the most widely used empirical relationship at present (Bucker et al., 2001; Norden and Forster, 2006), and the calculated equation is as follows:
Luo et al. (2008) established a new linear relationship of GR-A based on the correlation analysis of natural radioactivity logging (natural gamma-ray and natural gamma spectroscopy) and measured heat production from the main borehole of China Continental Scientific Drilling (CCSD) at 100–5000 m, and the calculated equation is as following:
Three empirical equations were used to calculate the heat production of these 18 wells. Figure 2 shows the heat production curves of wells B3 and X7 calculated by three methods. It can be seen that the trends of the three calculation results are consistent; the heat production calculated by Bucker and Rybach is higher, and the differences in heat production obtained by the three calculation methods are greater in the stratum with higher GR values. The dolomite stratum with lower GR values and the sandstone and mudstone stratum with higher GR value in well X7 are in good agreement with the calculation results.
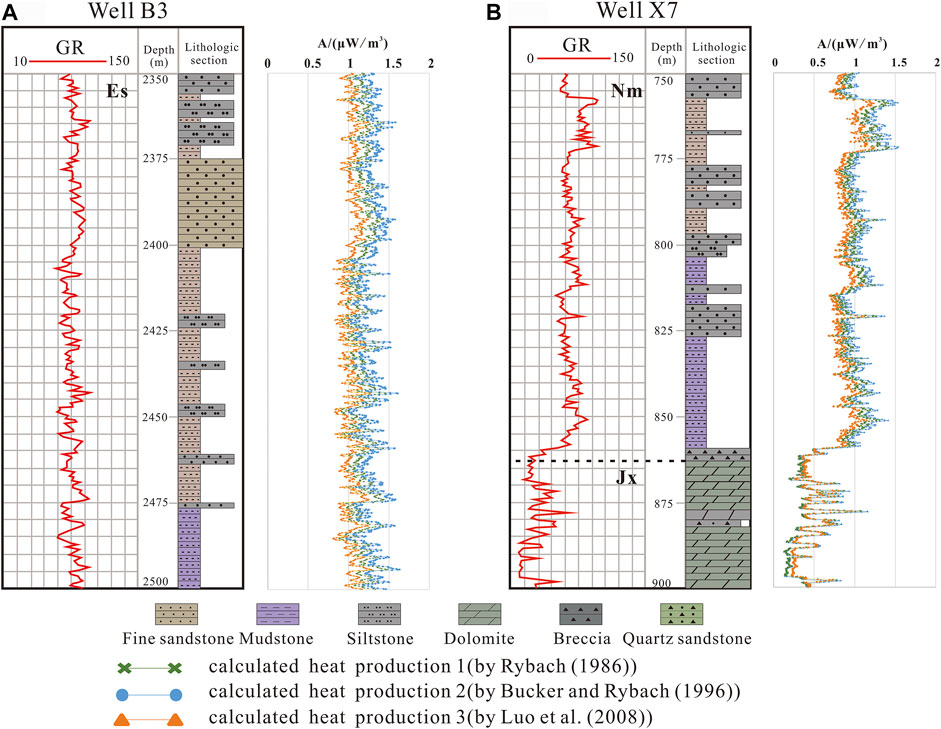
FIGURE 2. The curves of GR logging and calculated heat production of (A) Wells B3 and (B) Well X7. The green line in Figure 2 is the heat production of the sedimentary layer calculated according to Eq. 1 by Rybach (1986); the blue line is the heat production of sedimentary layer calculated according to Eq. 2 by Bucker and Rybach (1996); the orange line is the heat production of sedimentary layer calculated according to Eq. 3 by Luo et al. (2008).
The author extracted 1/40 of the logging curves of these typical wells, that is, one natural gamma-ray logging value was taken every 5 m and recorded as a sedimentary layer. The above empirical relationships were used to calculate, respectively, the heat production of 5,504 sedimentary layers in 20 wells was calculated, and classified according to lithology (Table 1 and Figure 3). It can be seen from the statistical results in Table 1 that the heat production calculated by Eq. 2 is the highest, followed by Eqs. 1 and 3. The heat production of sandstone is generally slightly lower than that of mudstone, and that of dolomite is generally lower than that of limestone. In Eq. 1, mudstone and sandstone are mainly distributed in 0.5–1.5 μW/m3, respectively; limestone and dolomite are mainly distributed in 0–1 μW/m3 and 0–0.5 μW/m3, respectively. In Eq. 2, mudstone and sandstone are mainly distributed in 1–2 μW/m3 and 0.5–1.5 μW/m3, respectively; limestone and dolomite are mainly distributed in 0–1 μW/m3 and 0–0.5 μW/m3, respectively. In Eq. 3, mudstone and sandstone are mainly distributed in 0.5–1.5 μW/m3, respectively; limestone and dolomite are mainly distributed in 0–1 μW/m3 and 0–0.5 μW/m3, respectively.
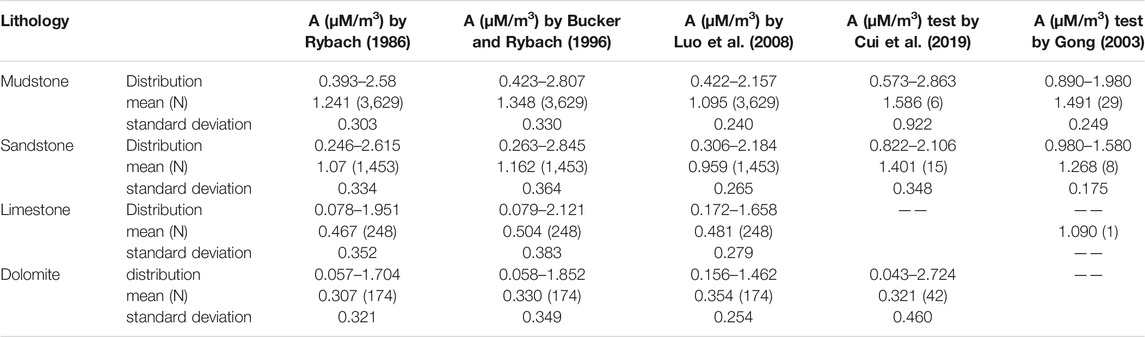
TABLE 1. Comparison and statistics of calculated radioactive heat production of different lithologies using different empirical relationships and measured heat production.
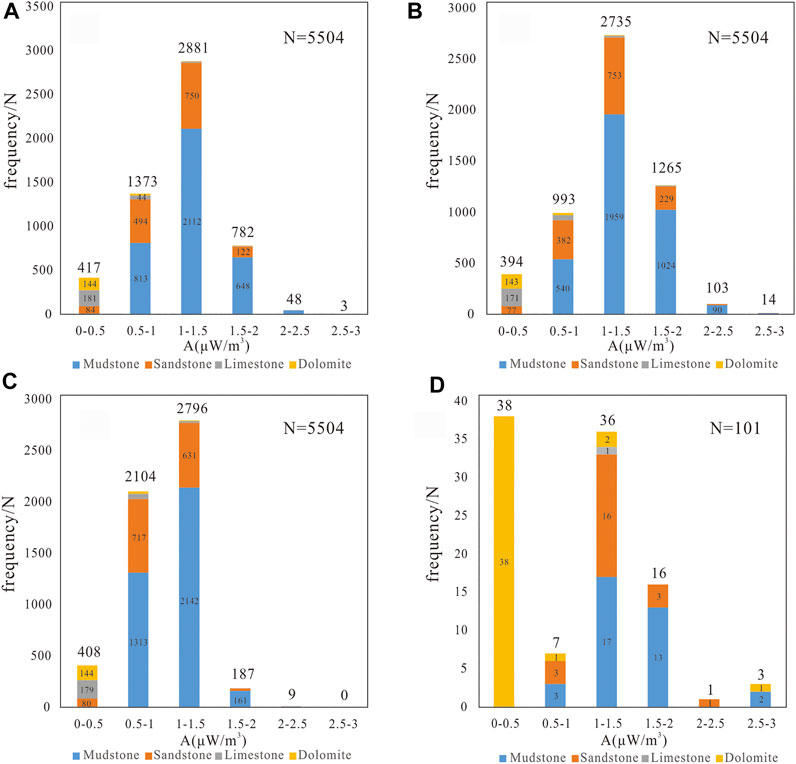
FIGURE 3. Statistic frequency histogram of sedimentary calculated heat production using GR-A empirical relationships and measured heat production in Xiong’an new area. (A) is calculated heat production using empirical relationship by Rybach (1986); (B) is calculated heat production using empirical relationship by Bucker and Rybach (1996); (C) is calculated heat production using empirical relationship by Luo et al. (2008); (D) was measured heat production by Gong (2003) and Cui et al. (2019).
In order to establish a framework for heat production in the sedimentary layers of Xiong’an new area, the GR-A empirical relationship should be used for conversion and statistics for areas and layers with no or less sampling. Comparing the average heat production of different lithology obtained from these three empirical relationships with the measured average value (Table 1) (Gong, 2003; Cui et al., 2019), it is found that the result calculated by Eq. 2 is more consistent with the measured value.
At the same time, these two wells are also the locations where the previously measured heat production samples are. Among them, mudstone samples were taken at 2415 m depth of well B3, and the measured heat production is 1.42 μW/m3, the calculated heat production is 1.25, 1.36, and 1.10 μW/m3 by using the three equations, respectively; mudstone and siltstone samples were taken from 778 to 806 m depths of X7 well, and the measured heat production is 0.65, and 1.32 μW/m3, respectively, the calculated heat production of the two places are 0.62, 0.67, 0.61 μW/m3 and 1.15, 1.24, 1.02 μW/m3, respectively, according to the three equations. It can be seen that Eq. 2 is most suitable for the calculated heat production in Xiong’an new area, and the deviation is also within a reasonable range.
Therefore, for the unsampled igneous rocks, 20 wells that encountered igneous rocks in Langgu sag Baxian sag were selected in this study, and the most applicable Eq. 2 was used to calculate the heat production. Well D6-2, which encountered Yanshanian granite, and Well Bs3, which encountered Cenozoic diabase and basalt, were chosen to plot the natural gamma-ray logging and calculated heat production curves (Figure 4). Also, heat production value was taken at 2 m intervals and heat production scatter plots were drawn for the igneous rocks encountered in these 20 wells (Figure 5). The results showed that the heat production of basalt is between 0.3 and 0.7 μW/m3, the tuff heat production is between 0.3 and 0.6 μW/m3, the diabase heat production is between 0.4 and 0.6 μW/m3, and the granite heat production is between 0.6 and 1.5 μW/m3.
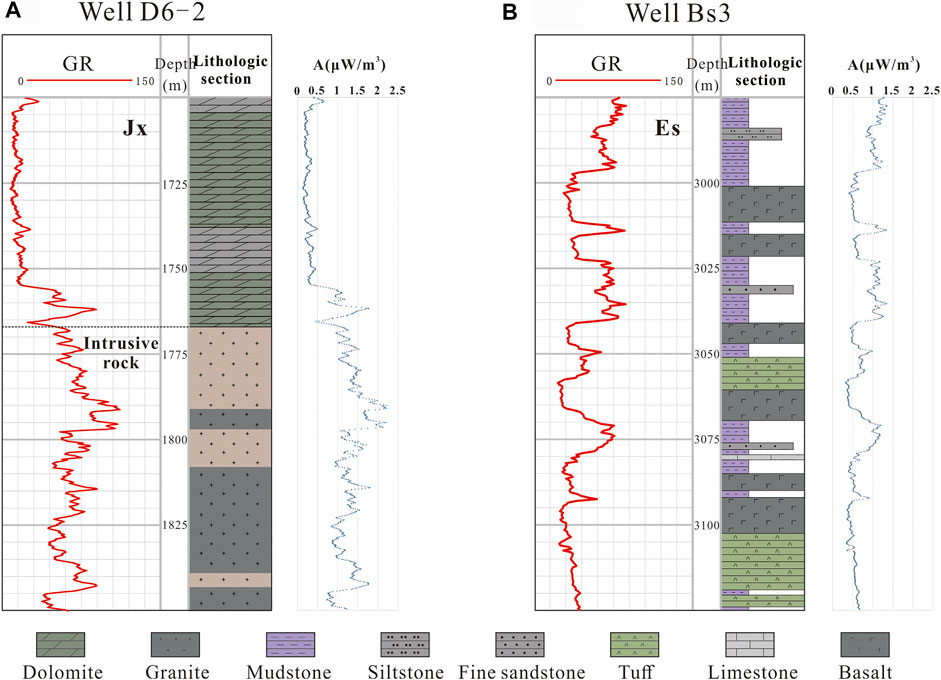
FIGURE 4. The curves of GR logging and calculated heat production rate of (A) Wells D6-2 and (B) Well Bs3.
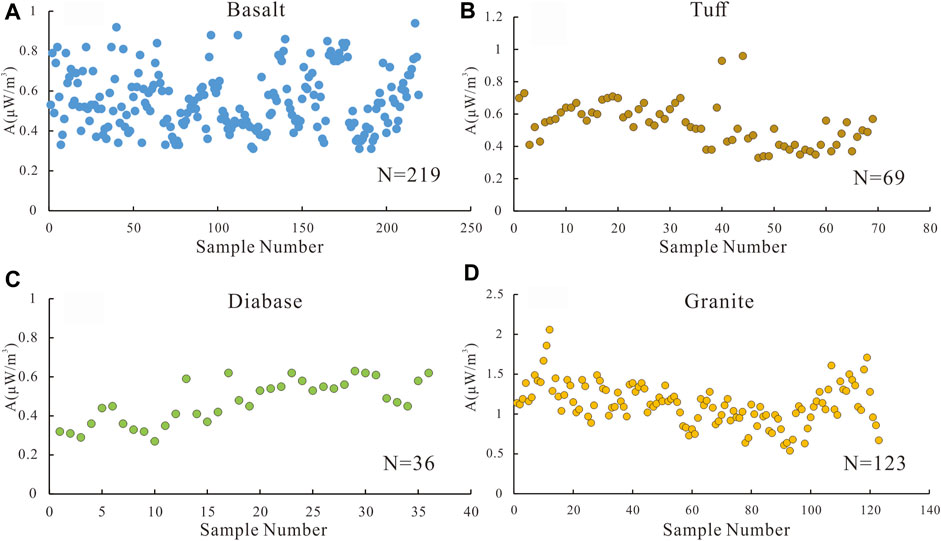
FIGURE 5. Scatter plot of calculated heat production of different kinds of igneous rocks. (A) Basalt; (B) Tuff; (C) Diabase; (D) Granite.
According to the analysis and calculation of the composition of igneous rock in different periods, it is found that the Cenozoic igneous rocks are mainly basic eruption rocks and shallow intrusion rocks. The heat production ranges from to 0.88 μW/m3, with an average value of 0.55 μW/m3. The Yanshanian igneous rocks are mainly intermediate-acid plutonic intrusion rocks, with a heat production ranging from 1.08 to 2.21 μW/m3, with an average value of 1.64 μW/m3. The basalt and orbit samples measured in the previous are inferred to be igneous rock samples developed in the late Lvliang period (during 1.65 to 1.8 Ga) based on previous studies (Cui et al., 2019), with heat production of 0.94 and 1.17 μW/m3, respectively.
Combined with drilling data, it is found that the Mesozoic igneous rocks are mainly developed on Niutuozhen and Rongcheng salients which are mainly moniliform distribution along deep and large faults in this area, which is one of the signs of active movement in Yanshanian. This means that acid intrusive rock granodiorite developed in the south of Niutuozhen salient with a length of 3–13 km and a buried depth of 2.2–3.5 km, moniliform intermediate-acid intrusive rock diorite developed on the west side of Rongcheng salient, and moniliform acid intrusive rock granite developed on the northeast side of Niutuozhen salient and its middle part between Rongcheng salient with all a length of 3–6 km and a buried depth of 3–6 km (Figure 7) (Li et al., 2017).
Cenozoic igneous rocks are mainly distributed in Baxian and Langgu sags. At the beginning of sag formation, the fault activity was strong, and the magmatic activity was roughly dominated by large-scale intrusion along the beds and underwater eruption along the fault. In the profile of northern Baxian sag (well B70, B55, B64, B62, and B30, the profile position shown in Figure 1), it is found that basalt is mainly developed in the lower part of the third stage of Shahejie formation, the upper part of the fourth stage of Shahejie formation, and the bottom of Kongdian formation (Figure 6). The sedimentary rocks contacting the overlying and underlying stratum are mainly mudstone and siltstone. In the connecting well profile, the thickness of basalt in the fourth stage of Shahejie formation is nonuniform, and the thickness is only 13 m in well B55 but 51 m in well B30.
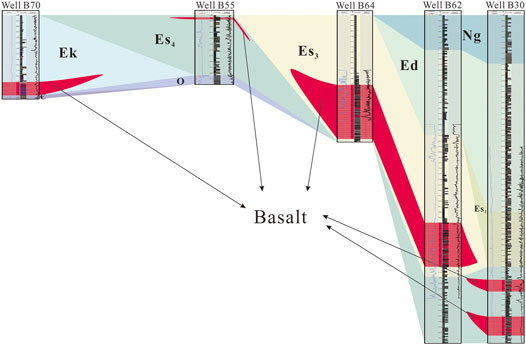
FIGURE 6. The profile of igneous rocks distribution in the northern side of Baxian Sag.
According to the statistics of igneous rock data of 97 wells in Baxian sag, it is found that several stages of magmatic activity occurred in the Cenozoic Paleogene, and the lithologies are mainly basalt, diabase, and tuff, mainly developed in Es3 and Es4. The distribution of igneous rocks is relatively continuous, while the thickness is uneven, and the thickest can be as high as 490 m (Figure 7).
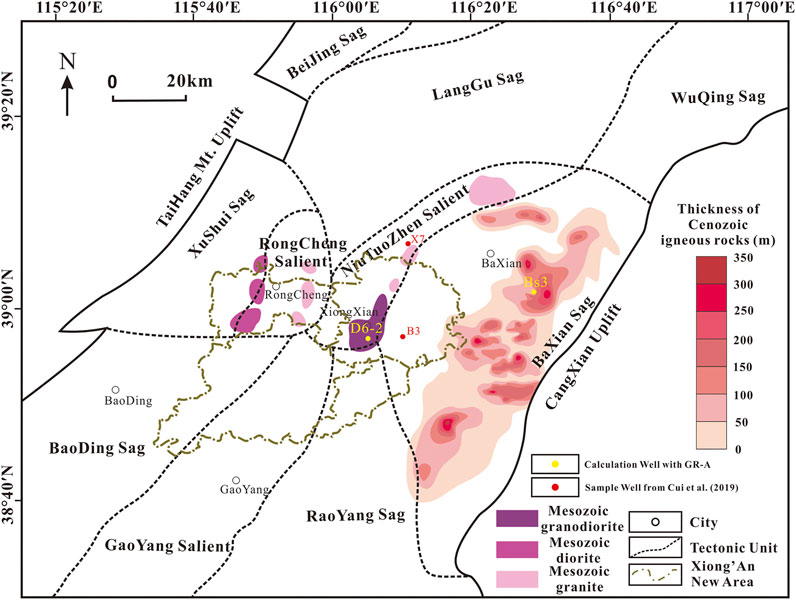
FIGURE 7. Spatiotemporal distribution of igneous rocks in Xiong’an new area and the thickness of igneous rock in Baxian sag.
Magmatic activity is closely related to tectonic activity and is controlled by deep faults. It is of great significance to study the formation, thermal evolution, and current geothermal state of the basin (Jin et al., 2012; Chang and Liu, 2018). In a volcanically active tectonic area, we need to consider the influence of magma pocket on stratigraphy before the onset of the magmatic activity, the influence of magma eruption on the overlying stratum, the influence of magmatic intrusion on the surrounding rock, and the influence of magma cooling on the stratum. The thermal effects of magma intrusion have been studied by different scholars at home and abroad (Mundry, 1970; Liu et al., 2018). It is shown that the degree of influence of magmatic intrusions depends on the time of intrusion, the size and geometry, and the lithology of intrusive bodies. Also, it is related to the physical properties of surrounding rocks.
The high-temperature deep subsurface molten material rises along structurally vulnerable zones to the upper crust or the surface, forming magmatic activity which will provide a local heat source to the sedimentary basin. After magmatic intrusion, the heat transfer mode is mainly heat conduction. The finite element method is one of the commonly used numerical simulation methods to solve the heat conduction equation, and it can be used to evaluate the influence of high-temperature magmatic intrusion on the surface temperature field (Zhang et al., 1982; Bonneville and Capolsini, 1999; Tang et al., 2013). Its essence is to discretize the continuous temperature field in the calculation area into a finite number of temperature points and then solve the value of these temperature points through a given series of conditions to approximate the actual temperature field changes.
Since the actual magmatic intrusion and surrounding rock changes after the intrusion are a series of complex geological processes, this study assumes that the magmatic intrusion occurs instantaneously and the heat transfer method is heat conduction. The heat conduction equation for calculating the influence of the magma intrusion is as follows:
where ρ is rock density kg/m3, Cp is the specific heat capacity of rock under normal pressure J/(kgK), T is temperature °C, t is time s, K is rock thermal conductivity W/(mK), and Q is rock heat production μW/m3.
The upper boundary temperature of this study is the surface temperature of 15°C; the bottom boundary temperature only considers the influence of the intrusive body, ignoring the local high thermal background when the intrusion body is formed; the left and right boundaries are set as adiabatic boundaries.
The establishment of the model is based on the distribution of igneous rocks in different periods as previously mentioned, with a certain degree of simplification. The Yanshanian intrusion rock was mainly distributed in the Niutuozhen and Rongcheng alient in the form of moniliform. The Cenozoic intrusion rock was mainly distributed in the Langgu and Baxian sags in the form of rock covers. And these simplified models were shown in Figure 8.
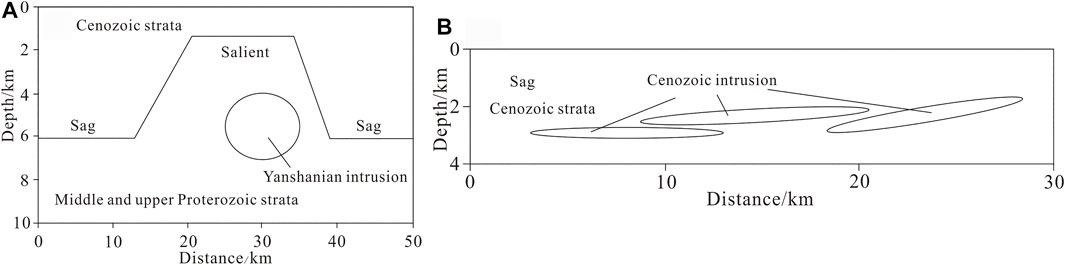
FIGURE 8. Simplified intrusions and strata of (A) Yanshanian and (B) Cenozoic.
The profile of the Mesozoic late Yanshanian intrusion (model a) simplifies the stratigraphic style of Langgu sag, Niutuozhen salient, and Baxian sag, with Cenozoic sandstone strata at the top and middle and upper Proterozoic carbonate stratum at the bottom. The length of the profile is 50 km, with the total stratigraphic thickness of 10 km, the thickness of the Cenozoic stratum in the two sags of 6 km, and the thickness of the Cenozoic stratum in the salient of 1.5 km. The intrusions are defined as granite, which is elliptical in profile, with a major axis length of 5 km and a minor axis length of 1.5 km, that is, the intrusion is 10 km long and 3 km thick (Figure 8A). The profile of the Cenozoic intrusion (model b) simplifies the stratigraphic style of Baxian sag, and the simplified models are all Cenozoic sandstone stratum due to most of the Cenozoic intrusions being bedding intrusion with a large intrusion area but small thickness, and the surrounding rocks being Paleogene sandstone and mudstone. The profile length is 30 km with a total stratigraphic thickness of 4 km. The intrusions are defined as diabase, with lengths of 10, 12, and 10 km on the profile, and thicknesses of 0.4, 0.4, and 0.5 km, respectively (Figure 8B).
Because the temperature of magma varies with its composition, the Yanshanian mainly occurred in granite intrusion, and the Cenozoic mainly occurred in diabase. The parameter settings are shown in Table 2, and some of the parameters are based on previous research (Zhang and Shi, 1997; Gong, 2014).
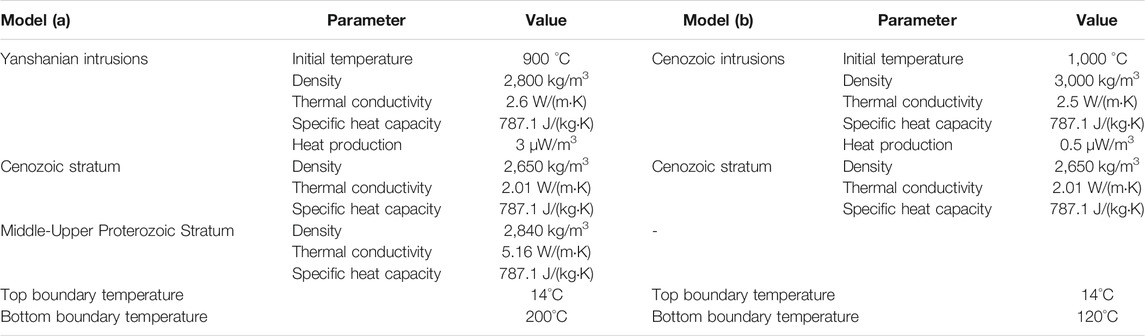
TABLE 2. Simulation parameters.
After the magmatic intrusion, its temperature decreases rapidly without the influence of external heat sources, and the temperature of its surrounding rock changes. At 0.01 Ma after the magmatic intrusion, the temperature of the surrounding rock rises rapidly due to the high-temperature baking effect of magma. With time, by 0.02, 0.05, or even 0.1 Ma, the temperature of the magma decreases rapidly, and the surrounding rock affected by the temperature of the magma also starts to decrease slowly. And the temperature of the surrounding rocks farther away from the intrusion rise and decrease more slowly than that of the surrounding rock closer to the intrusion (Figure 9A). At the time of 0.2 Ma, the residual heat of the intrusion gradually dissipated, and it gradually reaches a state of thermal equilibrium with the surrounding rock, until the 0.5 Ma temperature field finally reached equilibrium. After equilibrium, the temperature of the stratum is affected by various aspects such as structural configuration, thermal conductivity, and the ratio of the different stratum. The thermal conductivity of Cenozoic sandstone stratum is low with a thinner thickness in salient and thicker in sag. The thermal conductivity of the middle and upper Proterozoic carbonate stratum is relatively high with obviously thicker thickness in the salient. Therefore, under this influence, the temperature converges to the high thermal conductivity at the same depth, that is, in the upper part of salient the isotherm is a convex curve, consistent with the base undulation, while the lower part of the salient is a concave curve, opposite to the basement undulation. In the vicinity of the intrusion, the temperature profile changes slightly due to the influence of the intrusion shape and thermophysical properties, and there is a small bump in the temperature profile near the intruder.
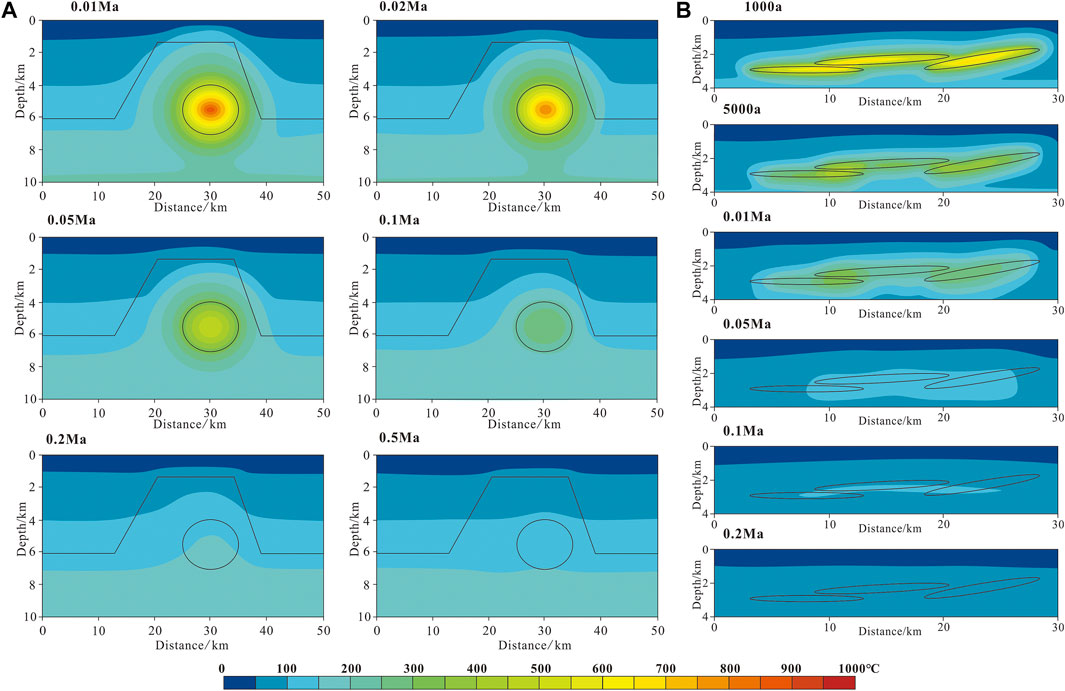
FIGURE 9. Thermal effects of (A) Yanshanian intrusions and (B) Cenozoic intrusions on surrounding rocks.
Compared with Yanshanian, the temperature of the Cenozoic magmatic intrusion drops more rapidly after intruding into the stratum. It reaches the same temperature at 0.1 Ma and reaches a steady-state at 0.2 Ma. The range of temperature change of the surrounding rock is also smaller due to magmatic intrusion (Figure 9B). After reaching the steady-state, the isotherm will also change due to the difference in thermophysical properties between the intrusion and the strata. However, the thickness of the intrusion body is too small, so there is almost no change in the temperature profile.
Summarizing the previous research and combining the experimental results of the thermal simulation, it can be found that the larger the intrusion, the larger the influence range of the residual heat and the longer the time; the closer the intrusion is, the more likely the residual heat effect is on the current temperature field (Mundry, 1970). Based on the results of this paper, it can be concluded that the thermal effect of residual heat on the current temperature is not obvious for either the large granite intrusion in late Yanshanian or a recent Cenozoic diabase intrusion. It is negligible that the residual heat produced by tectonic thermal movement, i.e., magmatism, does not have a significant effect on the current temperature field when discussing the subsequent heat source mechanism.
In addition, the organic maturity Ro is mainly controlled by temperature. According to the collected Ro data, the Ro and depth distribution of Wells C5 and S401 were drawn (Figure 10). The locations of these two wells are shown in Figure 1. It can be seen that after the intrusion of the igneous rock, a peak of Ro appears, which shows that after the intrusion intrudes into the stratum, the scope of the residual thermal influence is relatively small. Combined with the results of the thermal simulation, it can be seen that after Mesozoic and Cenozoic igneous rocks intrude into the stratum, the residual heat is lost extremely quickly, and the influence range is small; the residual heat effect hardly affects the current geothermal field.
FIGURE 10. Relationship between Ro and depth in well S401.
Due to the intrusion and eruption of magma, the stratum thermophysical properties will change in the local area. The influence of the igneous rock on the thermal conductivity after cooling has been discussed earlier, and it has been found that its influence is almost negligible. The influence of rock radioactive heat production is related to the shape and size of the igneous rock and the heat production of the surrounding rock.
The heat production contribution of the sedimentary layer can be obtained according to the following equation:
where qc is crust heat flow, mW/m2; Ai is the radioactive heat production of layer i, μW/m3; and Di is the thickness of layer i, km.
To calculate the thermal effect of igneous facies, we only need to get the difference of thermal contribution between igneous facies and sedimentary layer with the same thickness.
The Yanshanian igneous rocks are mainly distributed in the Niutuozhen and Rongcheng salients, and the intruded stratum are middle and upper Proterozoic carbonate stratum. With a thickness of 3 km, its heat production contribution is about 4.92 mW/m2, while the middle and upper Proterozoic stratum with the same thickness contributes 1.38 mW/m2. It can be seen that the Yanshanian igneous rock intrusions increased the heat flow value of Niutuozhen and Rongcheng salients to a certain extent, about 3.55 mW/m2, which is difficult to ignore (Figure 11A).
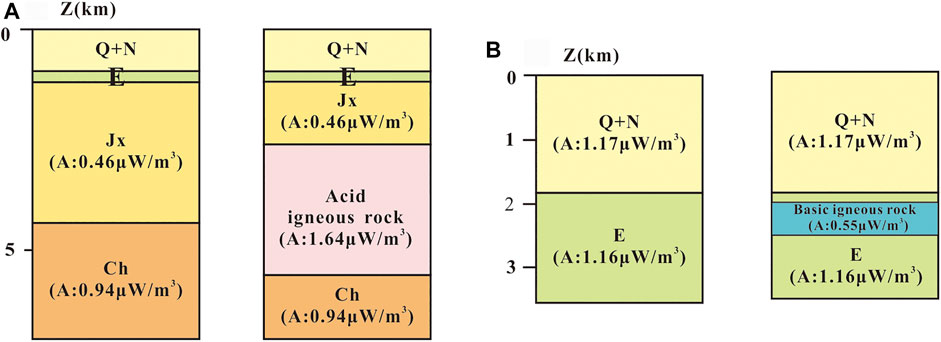
FIGURE 11. Schematic diagram of heat production difference under the influence of igneous facies, the heat production data was after by Cui et al. (2019). (A) Yanshanian intrusions; (B) Cenozoic intrusions.
The Cenozoic igneous rocks are dominated by large area bedding intrusions and overflow eruptions, which are relatively thin and were developed in the Shahejie formation. With a thickness of 0.5 km, its heat production contribution is about 0.275 mW/m2, while that of the Shahejie formation of the same thickness is 0.58 mW/m2. It can be inferred that the Cenozoic igneous rock has reduced the heat flow in the sag to a certain extent by about 0.225 mW/m2, but most of the igneous rocks have a thickness of fewer than 0.5 km, which has a smaller difference in heat production of the Shahejie formation of the same thickness, where the difference is almost negligible (Figure 11B).
The difference in heat production affects the terrestrial heat flow to some extent, while thermal conductivity has almost no effect. Corresponding the distribution of igneous rock to the heat flow, it can be found that the terrestrial heat flow is higher in the areas where Mesozoic igneous rocks are developed, i.e., the southern of Niutuozhen salient and the Rongcheng salient, while the Langgu and Baxian sags in areas where Cenozoic igneous rocks are developed are not caused by igneous rocks, although the values tend to be low.
Previous studies believe that the Bohai Bay Basin experienced five thermal evolution stages during the Mesozoic-Cenozoic, with differences in the thermal evolution of each tectonic unit (Zuo et al., 2013). The thermal evolution history of the Jizhong depression from the Triassic to Jurassic is a stable stage of heat flow upward, starting from 43 to 60 mW/m2, influenced by the subduction of the Pacific plate to the NCC starting at 200 Ma (Windley et al., 2011; Kusky et al., 2014), with convection in the mantle, upwelling of asthenosphere material, and a slow rise in heat flow. From the Early Cretaceous to the Late Cretaceous, the first phase of heat flow peaked at 87 mW/m2, during which strong tectonic deformation movements occurred, the eastern part of the NCC was damaged, the asthenosphere was upwelled, and magmatic activity was significantly enhanced. From the late Cretaceous to the end of Cretaceous, the heat flow declined rapidly to 68 mW/m2, and the basin transitioned from a compressive stress environment to a Paleogene tensile stress environment. Until the Eocene to Oligocene, the heat flow increased again and reached the peak of the second phase of heat flow (80 mW/m2). Under the influence of tension, the lithosphere thinned again and magma erupted upwelling. Since the Neogene, tectonic activities gradually disappeared, the contribution of deep heat sources has decreased, and the paleo heat flow has declined to about 60 mW/m2.
According to previous studies (Hyndman et al., 1968; Lachenbruch, 1970; Lachenbruch and Sass, 1977), the Moho surface temperature of the Australian shield is 420°C and that of the stable area in the eastern United States is 660°C, while the Moho surface temperature in the tectonically active zone of the Cenozoic mountains in the western United States can be as high as 1,000°C or more, and the Moho surface temperature in the Xiongan New Area is 500–600°C (Cui et al., 2020). It can be found that after the Neogene, the Jizhong depression gradually transformed into a tectonic stable area, in which the thermal state also declined from the peak state in the Paleogene, and the paleo heat flow has little impact on the temperature field of the current study area. However, due to the deposition of huge and thick Neogene and Quaternary deposited with low thermal conductivity, the study area is subject to a certain degree of thermal insulation. Since the previous lithosphere thinning, the heat flow can be more easily conducted to the shallow crust, which is also the background of the formation of obvious geothermal anomalies in the study area.
The main contents of heat source origin include the radioactive heat production by the decay of U, Th, 40K, and other radioactive elements in crustal rocks (i.e., crustal heat flow), the heat from the mantle (i.e., mantle heat flow), and the heat generated by tectonic thermal movement cooling (magmatism). The heat generated by tectonic thermal movement cooling has been discussed previously. The contribution of crustal heat flow and mantle heat flow is still the main contributor of terrestrial heat flow in the study area and even the Bohai Bay Basin.
The crustal heat flow is generated by the accumulation of heat production in the sedimentary layer and the upper, middle, and lower crust, the surface of that determined by the distribution of seismic wave velocity. According to the crust-mantle velocity structure diagram of the Jizhong depression (Figure 12A) (Ma et al., 1991), the thickness distribution is found to be different in the horizontal direction, and the range of seismic wave velocity varies in different tectonic zones. The author corresponds the profile to the terrestrial and mantle heat flow in the Bohai Bay Basin calculated previously (Cui et al., 2019) and finds that the heat flow provided by the mantle accounts for a relatively large portion of the terrestrial heat flow (Figure 12A). According to the distribution of the crust-mantle heat flow, Wang et al. (1996) proposed the concepts of “cold crust-hot mantle” and “hot crust-cold mantle” to explain the thermal structure of the basin. When the heat flow in the crust exceeds 50%, the crust is considered to be relatively “hot,” while the mantle is relatively “cold,” which is the “hot crust-cold mantle.” On the contrary, it is a “cold crust-hot mantle.” It is a typical “cold crust-thermal mantle” geothermal background in Bohai Bay Basin, in which the more eastward to Jiyang depression, the more obvious this thermal structure is.
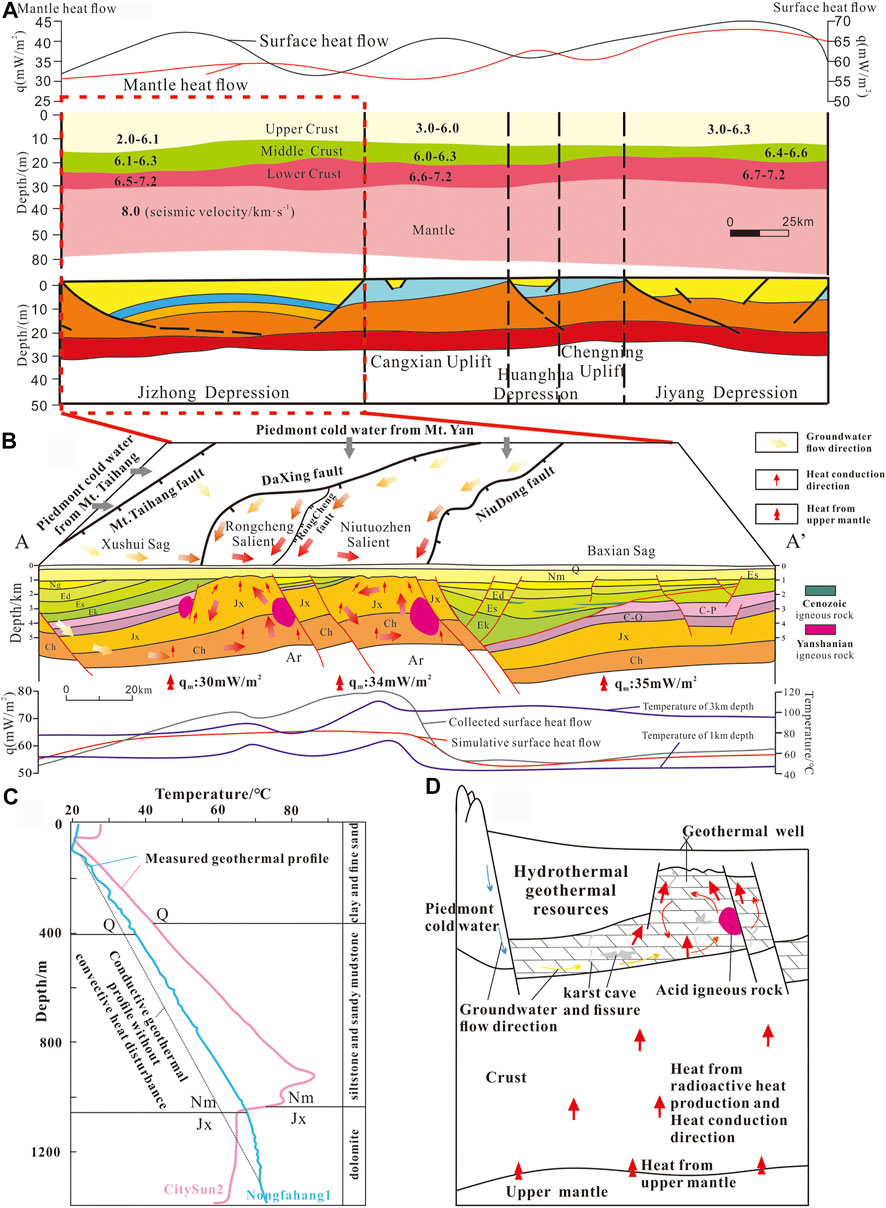
FIGURE 12. Aggregative model of the heat source genesis in Xiong’an new area. (A) Crust mantle velocity structure and mantle terrestrial heat flow through Jizhong depression after Ma et al. (1991) and Xu (2017); (B) Genesis of conduction-convection geothermal resources of AA′ section in Jizhong depression; (C) Well temperature diagram affected by heat convection after by Wang et al. (2019); (D) Genetic model of geothermal resources in Xiong’an new area.
The seismic wave velocity of the upper crust, middle crust, and lower crust in the Jizhong depression ranges from 2.0 to 6.1 km/s, 6.1 to 6.3 km/s, and 6.5 to 7.2 km/s, respectively. The differences in the thickness of the upper, middle, and lower crust in Jizhong depression, laterally, correspond well to the salient and sag in the depression. In the case of small differences in mantle heat flow variation, the terrestrial heat flow in salient is significantly higher than that in sag. Figure 12B shows a schematic diagram of the geothermal resource genesis in the AA section within the Jizhong depression, and the location of that was shown in Figure 1. The gray line indicates the geothermal heat flow collected by literature (Gong, 2003; Jiang et al., 2019), and the red one indicates the simulated geothermal heat flow (Cui et al., 2019), while the remaining two blue lines are the temperature profiles at a depth of 1 and 3 km underground, respectively. The good correspondence between geothermal heat flow and basement relief illustrates the difference in geothermal heat flow caused by the rationing of sediment layer and crustal thickness. The mantle heat flow ranges from 30 to 35 mW/m2, and the terrestrial heat flow ranges from 56 to 60.1 mW/m2, with a calculated crust-mantle heat flow ratio ranging from 0.6 to 0.88, which is a typical “cold crust-hot mantle” type thermal structure. In addition, several deep and large fractures developed in the study area not only control the deposition of the strata but also provide good channels for groundwater transport. Cold piedmont water from Taihang and Yanshan Mountains infiltrates through the surface and migrates along with the pores and fractures in the sedimentary layer, and is gradually heated by the stratum during this process. Heated by the heat from the deep crust rapidly, as the heat carrier, there is groundwater convection with the shallow stratum groundwater along the fracture zone under the influence of deep faults, and is stored in the sandstone reservoir of Paleogene and the carbonate reservoir of Wumishan formation, forming a thermal anomaly area, namely a geothermal field. The difference between the simulated calculation (the red line) and the measured value (the grey line) confirms the influence of groundwater activities on the geothermal field. The influence degree of groundwater activities is consistent with research results from Chen (1998), which aligns well with the fluctuation of 1 and 3 km isotherms groundwater activities (Figure 12B). The change of temperature measurement curves in two geothermal wells (well citysun2 and well nongfahang1) in Niutuozhen salient also confirms the influence of geothermal water disturbance (Figure 12C) (Wang et al., 2019).
Combined with the previous study and Figure 12B (Cui et al., 2019), the study area can be simply divided into western sag, central salient, and eastern sag. And thermal convection mainly affects the western sag and central salient. The measured heat flow from west to east in these three areas ranges from 48.7 to 60.4 mW/m2, with the average of 52.9 mW/m2, 65.7 mW/m2 to 90 mW/m2, with the average of 69.2 mW/m2, 50.6 mW/m2 to 66.2 mW/m2, with the average of 57.9 mW/m2, respectively. The mantel heat flow is 30, 34, and 35 mW/m2, respectively, from west to east, and the crustal heat flow is 26.3, 26.1, and 21 mW/m2, respectively, from west to east. Thermal convection makes it reduced in western sag (reduced about 6.88–7.8 mW/m2) and raised in central salient (raised about 12.04–29.25 mW/m2), with nearly no influence in eastern sag. In addition, the crustal heat flow was refined, and the heat flow contribution of each stratum is 1.1–2 mW/m2, 0.1–2.4 mW/m2, 0–0.6 mW/m2, 0.9–1.2 mW/m2, and 1.9–2.4 mW/m2 in Q + N, E, Mz + Pz, Jx, Ch, respectively. In conclusion, under the background of the extension and thinning of the geothermal lithosphere in the Bohai Bay Basin, the “cold crust-hot mantle” thermal structure has been formed in Xiong’an new area. About 53–62% of heat is produced by mantle and 38–47% of heat is produced by crustal heat flow, which means mantle heat flow is the main source of heat source in the study area. Among them, about 12% heat increment to the crustal heat production is provided by the Yanshanian igneous rocks in the area where it develops, and about 6% to the heat source. The groundwater supplied by the piedmont is gradually heated by the stratum in the process of migration, and convection occurs with the shallow groundwater in the salient, resulting in the high measured terrestrial heat flow. A large number of holes and fractures developed in the carbonate stratum provide good storage space for hot groundwater. The Great Basin in the western United States and the soultz geothermal field in France are similar; faults and inclined sedimentary layers control the circulation of fluid and thus the distribution of heat flow (Kohl et al., 2000; Genter et al., 2010).
The sand mud interbeds developed in the shallow stratum have low thermal conductivity and provide a water barrier, causing less heat dissipation, which together form the genetic model of geothermal resources in Xiong’an new area (Figure 12D).
Calculated by GR-A optimal empirical formula, the radioactive heat production of mudstone ranges from 0.423 to 2.807 μW/m3 (avg. 1.348 μW/m3); that of sandstone ranges from 0.263 to 2.845 μW/m3 (avg. 1.162 μW/m3); that of limestone ranges from 0.079 to 2.121 μW/m3 (avg. 0.504 μW/m3); and that of dolomite ranges from 0.058 to 1.852 μW/m3 (avg. 0.33 μW/m3). Meanwhile, those of basalt, tuff, diabase, and granite are 0.3–0.7 μW/m3, 0.3–0.6 μW/m3, 0.4–0.6 μW/m3, and 0.6–1.5 μW/m3, respectively. All in all, the average radioactive heat production of intermediate-acid plutonic intrusive rock developed in Yanshanian and basic extrusive rock and hypabyssal intrusive rock developed in Cenozoic are 1.64 and 0.55 μW/m3, respectively.
In the late Mesozoic Yanshannian, moniliform intermediate and acid intrusion rock was mainly developed in the salients. In the Cenozoic Paleogene, basalt and diabase were mainly developed along with the bedding in the sags. Thermal simulation results show that the igneous rock intrusion and surrounding rock can reach thermal equilibrium after 0.5 Ma at most, indicating that the residual heat does not affect the current temperature field. After balance, the difference in thermal properties between the intrusion body and the surrounding rock has a limited impact on the distribution of the surface heat flow, which only increases the heat flow in a local area of the salient about 3.55 mW/m2.
Under the thermal background of the typical “cold crust–hot mantle” thermal structure, the mantel heat is the main source, where the Yanshanian igneous rocks developed in the central salient contribute about 12% of the heat increment to the heat generation of the crust and 6% of that to the heat source. And thermal convection makes it improved in the central salient (raised about 12.04–29.25mW/m2). Together with the crust and mantle heat production, they constitute the heat source genesis of the geothermal resources in Xiong’an new area. Under this heat flow background, large-scale carbonate thermal reservoirs, sufficient lateral fluid supply, and certain circulation depth together constitute the hydrothermal geothermal resources in the study area.
The original contributions presented in the study are included in the article/Supplementary Material, and further inquiries can be directed to the corresponding author.
YC was the primary finisher of this paper, CZ provided the source of the sample and funding, NQ provided the funding of this paper, too. And BT, SG, and ZL completed part of data processing work for this paper.
The study was supported by the National Natural Science Foundation of China (Grant Nos. 42172334) and the National Key Research and Development Program of China (Grant Nos. 2021YFA0716003 and Grant Nos. 2018YFC0604302).
The authors declare that the research was conducted in the absence of any commercial or financial relationships that could be construed as a potential conflict of interest.
All claims expressed in this article are solely those of the authors and do not necessarily represent those of their affiliated organizations, or those of the publisher, the editors, and the reviewers. Any product that may be evaluated in this article, or claim that may be made by its manufacturer, is not guaranteed or endorsed by the publisher.
Alain, B., Alexandre, C., and Catherine, A. (2020). Numerical Simulations of Magmatic Enclave Deformation. J. Volcanol. Geotherm. Res., 392. doi:10.1016/j.jvolgeores.2020.106790
Bonneville, A., and Capolsini, P. (1999). THERMIC: A 2-D Finite-Element Tool to Solve Conductive and Advective Heat Transfer Problems in Earth Sciences. Comput. Geosciences 25 (10), 1137–1148. doi:10.1016/s0098-3004(99)00075-8
Bucker, C., Jarrard, R. D., and Wunik, T. (2001). Downhole Temperature, Radiogenic Heat Production, and Heat Flow from the CRP-3 Drillinghole, Victoria Land Basin, Antarctica. Terra Antartica 8 (3), 151–160.
Bücker, C., and Rybach, L. (1996). A Simple Method to Determine Heat Production from Gamma-ray Logs. Mar. Pet. Geology. 13 (4), 373–375. doi:10.1016/0264-8172(95)00089-5
Chang, J., Qiu, N. S., Zhao, X. Z., Xu, W., Xu, Q. C., Jin, F. M., et al. (2016). Present-day Geothermal Regime of the Jizhong Depression in Bohai Bay Basin, East China. Chin. J. Geophysics 59 (3), 1003–1016. (in Chinese with English abstract). doi:10.6038/cjg20160322
Chang, Y. Q., and Liu, J. (2018). Research on Development Characteristics of Magmatic Rock in Qianjiaying Mining Area and Their Influence on Geothermal Anomaly. China Coal 44 (9), 38–42+70. (in Chinese with English abstract). doi:10.19880/j.cnki.ccm.2018.09.007
Cui, Y., Zhu, C., Qiu, N., Tang, B., and Guo, S. (2019). Radioactive Heat Production and Terrestrial Heat Flow in the Xiong'an Area, North China. Energies 12 (24), 4608. doi:10.3390/en12244608
Cui, Y., Zhu, C. Q., Qiu, N. S., Tang, B. N., and Guo, S. S. (2020). Geothermal Lithospheric Thickness in the central Jizhong Depression and its Geothermal Significance. Acta Geologica Sinica 94 (7), 1960–1969. (in Chinese with English abstract). doi:10.19762/j.cnki.dizhixuebao.2020213
Genter, A., Evans, K., Cuenot, N., Fritsch, D., and Sanjuan, B. (2010). Contribution of the Exploration of Deep Crystalline Fractured Reservoir of Soultz to the Knowledge of Enhanced Geothermal Systems(egs). Comptes Rendus Geosciences 342 (7), 502–516. doi:10.1016/j.crte.2010.01.006
Gong, L. (2014). 2D Numerical Simulation of Geothermal Field with Finite Element Method. Hunan: Central South University, 21–27. (in Chinese with English abstract).
Gong, Y.-l., Zhang, H., and Ye, T.-f. (2011). Heat Flow Density in Bohai Bay Basin: Data Set Compilation and Interpretation. Proced. Earth Planet. Sci. 2, 212–216. doi:10.1016/j.proeps.2011.09.034
Gong, Y. L. (2003). Thermal Structure and thermal Evolution of the Bohai Bay Basin in Eastern China. Nanjing: Najing University, 79–100. (in Chinese with English abstract).
Guo, Y. Z., Dong, J., Chen, D., and Lv, S. Y. (2001). Statistical Characteristics of Regional Rock Electrical Properties in Hebei Province. Geophys. Geochemical Exploration 5, 328–336. (in Chinese with English abstract). doi:10.3969/j.issn.1000-8918.2001.05.002
He, B. Z., and Zheng, M. L. (2016). Structural Characteristics and Formation Dynamics: A Review of the Main Sedimentary Basins in the Continent of China. Acta Geologica Sinica 90 (4), 1156–1194. (in Chinese with English abstract). doi:10.1111/1755-6724.13037
Hu, S. B., Sullivan, P. B., Raza, A., and Kohn, B. P. (2001). Thermal History and Tectonic Subsidence of the Bohai Basin, Northern China: a Cenozoic Rifted and Local Pull-Apart basin. Phys. Earth Planet. Interiors 126 (3-4), 221–235. doi:10.1016/s0031-9201(01)00257-6
Hyndman, R. D., Lambert, I. B., Heier, K. S., Jaeger, J. C., and Ringwood, A. E. (1968). Heat Flow and Surface Radioactivity Measurements in the Precambrian Shield of Western Australia. Phys. Earth Planet. Interiors 1 (2), 129–135. doi:10.1016/0031-9201(68)90057-5
Jiang, G., Hu, S., Shi, Y., Zhang, C., Wang, Z., and Hu, D. (2019). Terrestrial Heat Flow of continental China: Updated Dataset and Tectonic Implications. Tectonophysics 753, 36–48. doi:10.1016/j.tecto.2019.01.006
Jin, C. S., Qiao, D. W., and Dan, W. N. (2012). Meso-Cenozoic Volcanic Rock Distribution and Reservoir Characteristics in the Bohai Bay Basin. Oil &Gas Geology. 33 (1), 19–29+36. (in Chinese with English abstract). doi:10.11743/ogg20120103
Kohl, T., Bächler, D., and Rybach, L. (2000). “Steps towards a Comprehensive Thermo-Hydraulic Analysis of the HDR Test Site Soultz-Sous-Forets,” in Proceedings, World Geothermal Congress 2000, Japan, May28–June10, 2000 (Japan: Kyushu-Tohoku).
Kong, Y. L., Pang, Z. H., Wu, C. Y., and Miao, J. (2015). A Comparative Study of Single Factor and Multivariate Statistical Methods for Surface Water Quality Assessment. Water Policy 16 (1), 157–167. doi:10.2166/wp.2013.042
Kusky, T. M., Windley, B. F., Wang, L., Wang, Z., Li, X., and Zhu, P. (2014). Flat Slab Subduction, Trench Suction, and Craton Destruction: Comparison of the North China, Wyoming, and Brazilian Cratons. Tectonophysics 630, 208–221. doi:10.1016/j.tecto.2014.05.028
Lachenbruch, A. H. (1970). Crustal Temperature and Heat Production: Implications of the Linear Heat-Flow Relation. J. Geophys. Res. 75 (17), 3291–3300. doi:10.1029/jb075i017p03291
Lachenbruch, A. H., and Sass, J. H. (1977). “Heat Flow in the United States and the Thermal Regime of the Crust,” in The Earth's Crust. Its Nature and Physical Properties. Editors A. F. Spilhaus, and J. Managing (Washington DC: American Geophysical Union Geophysical Monograph Series), 20, 332–359.
Li, H., Yu, J. B., Lv, H., and Xiao, P. F. (2017). Gravity and Aeromagnetic Responses and Heat-Controlling Structures of Xiongxian Geothermal Area. Geophys. Geochemical Exploration 41 (2), 242–248. (in Chinese with English abstract). doi:10.11720/wtyht.2017.2.08
Li, W. Q. (2015). The Influence of Geothermal Features and Radioactive Heat Production of Rocks to Potential of Geothermal Resources in Eastern Area of Liaoning Province. Ph. D thesis of Jilin University. (in Chinese with English abstract).
Li, Z. C. (1999). Seismic and Geological Interpretation of Magma Intrusions. Coal Geology. China 4, 59–60+65. (in Chinese).
Liang, J., Wang, H., Bai, Y., Ji, X., and Duo, X. (2016). Cenozoic Tectonic Evolution of the Bohai Bay Basin and its Coupling Relationship with Pacific Plate Subduction. J. Asian Earth Sci. 127, 257–266. doi:10.1016/j.jseaes.2016.06.012
Liu, Q. Z. (1992). Distribution and Gas-Bearing Characteristics of the Cenozoic Igneous Rocks in the Jizhong Depression. Exp. Pet. Geology. 2, 188–194. (in Chinese with English abstract).
Liu, Z., Dai, L.-m., Li, S., Guo, L.-l., Hu, M.-y., Ma, F.-f., et al. (2018). Mesozoic Magmatic Activity and Tectonic Evolution in the Southern East China Sea Continental Shelf Basin: Thermo-Mechanical Modelling. Geol. J. 53, 240–251. doi:10.1002/gj.3021
Luo, M., Pan, H. P., Zhao, Y. G., Zhang, H. J., and Zhou, F. (2008). Natural Radioactivity Logs and Interpretation from the CCSD Main Hole. Earth Science-Journal China Univ. Geosciences 5, 661–671. (in Chinese with English abstract). doi:10.3321/j.issn:1000-2383.2008.05.009
Ma, X. Y., Liu, C. Q., and Liu, G. D. (1991). Xiangshui (Jiangsu Province) to Mandal (Nei Monggol) Geoscience Transect. Acta Geologica Sinica 3, 199–215.
Mundry, E. (1970). Mathematical Estimation Concerning the Cooling of a Magnetic Intrusion. Geothermics 2, 662–668. doi:10.1016/0375-6505(70)90067-2
Norden, B., and Forster, A. (2006). Thermal Conductivity and Radiogenic Heat Production of Sedimentary and Magmatic Rocks in the Northeast German Basin. AAPG Bull. 90 (6), 936–962. doi:10.1306/01250605100
Pamukçu, O. A., Akçığ, Z., Demirbaş, Ş., and Zor, E. (2007). Investigation of Crustal Thickness in Eastern Anatolia Using Gravity, Magnetic and Topographic Data. Pure Appl. Geophys. 164, 2345–2358. doi:10.1007/s00024-007-0267-7
Pang, Z. H., Pang, J. M., Kong, Y. L., Luo, L., and Wang, S. F. (2015). Large Karstic Geothermal Reservoirs in Sedimentary Basins in China: Genesis, Energy Potential and Optimal Exploitation. Melbourne, Australia: World Geothermal Congress.
Qiu, N. S., Zuo, Y. H., Chang, J., and Li, W, Z. (2014). Geothermal Evidence of Meso-Cenozoic Lithosphere Thinning in the Jiyang sub-basin, Bohai Bay Basin, Eastern North China Craton. Gondwana Res. 26 (3-4), 1079–1092. doi:10.1016/j.gr.2013.08.011
Qiu, N., Zuo, Y., Xu, W., and Chang, J. (2016). Meso-Cenozoic thermal Structure of the Lithosphere in the Bohai Bay Basin, Eastern North China Craton. Geol. J. 51 (5), 794–804. doi:10.1002/gj.2693
Rao, S., Zhu, C. Q., Liao, Z. B., Jiang, G. Z., Hu, S. B., and Wang, J. Y. (2014). Heat Production Rate and Heat Flow Contribution of the Sedimentary Formation in Junggar Basin, Northwest China. Chin. J. Geophys. 57 (5), 1554–1567. (in Chinese with English abstract). doi:10.6038/cjg20140519
Rosa, D. M., Ester, P., Cecilia, M., and Scandone, R. (2015). Numerical Study of Conductive Heat Losses from a Magmatic Source at Phlegraean Fields. J. Volcanology Geothermal Res. 290, 75–81. doi:10.1016/j.jvolgeores.2014.12.007
Rybach, L. (1986). Amount and Significance of Radioactive Heat Sources in Sediments. Collection Colloques et Seminares 44, 311–322.
Shan, S. Q. (2018). Structural Geometry and Kinematics of the Taihang Mountain piedmont Fault and its Controlling on the Development of the Bohai Bay Basin. Beijing: China University of Geosciences, Beijing, 21–25. (in Chinese with English abstract).
Tang, X. Y., Zhang, G. C., Liang, J. S., Yang, S. C., Rao, S., and Hu, S. B. (2013). Influence of Igneous Intrusions on the Temperature Field and Organic Maturity of the Changchang Sag, Qiongdongnan Basin, south China Sea. Chin. J. Geophys. 56 (1), 159–169. (in Chinese with English abstract). doi:10.6038/cjg20130116
Wang, J. Y., Xiong, L. P., and Huang, S. P. (1996). Heat Transfer and Groundwater Activity in Sedimentary Basins. Quat. Sci. 2, 147–158. (in Chinese with English abstract).
Wang, P. X., Yang, X., and Bian, X. D. (2012). Petrologic and Geochemical Characteristics of Igneous Rock in Jizhong Depression. Geol. Sci. Techn. Inf. 31 (4), 1–10. (in Chinese with English abstract).
Wang, Z., Jiang, G., Zhang, C., Hu, J., Shi, Y., Wang, Y., et al. (2019). Thermal Regime of the Lithosphere and Geothermal Potential in Xiong'an New Area. Energy Exploration & Exploitation 37, 787–810. doi:10.1177/0144598718778163
Windley, B. F., Maruyama, S., and Xiao, W. J. (2011). Delamination/thinning of Sub-continental Lithospheric Mantle under Eastern China: The Role of Water and Multiple Subduction. Am. J. Sci. 310 (10), 1250–1293. doi:10.2475/10.2010.03
Wu, F. Y., Lin, J. Q., Wilde, S. A., Zhang, X. O., and Yang, J. H. (2005). Nature and Significance of the Early Cretaceous Giant Igneous Event in Eastern China. Earth Planet. Sci. Lett. 233 (1-2), 103–119. doi:10.1016/j.epsl.2005.02.019
Wu, X. Y., and Pan, J. T. (2005). Fractal Dimension Calculation of Aeromagnetic Data and its Application to the Deduction of Igneous Rock Distribution. Geophys. Geochemical Exploration 29 (4), 291–294. (in Chinese with English abstract). doi:10.3969/j.issn.1000-8918.2005.04.003
Xu, W. (2017). Meso-Cenozoic thermal Regime and Lithospheric Thinning in the Bohai Bay Basin. Beijing: Ph. D thesis of China University of Petroleum, 49. (in Chinese with English abstract).
Yu, C. C., Qiao, R. X., and Zhang, D. S. (2017). The Basement Tectonic Characteristics from Interpretation of Aeromagnetic Data in Xiong’an Region. Geophys. Geochemical Exploration 41 (3), 385–391. (in Chinese with English abstract). doi:10.11720/wtyht.2017.3.01
Zhang, J. M., Sun, H. W., and Xiong, L. P. (1982). Mathematical Simulating of Regional Geothermal Field and Case Analysis. Chin. J. Geology. 3 (3), 315–321.
Zhang, J., and Shi, Y. L. (1997). The thermal Modeling of Magma Intrusion in Sedimentary Basins. Prog. Geophys. 3, 55–64. (in Chinese with English abstract).
Keywords: Xiong’an new area, igneous rock heat production, GR-A empirical relationship, finite element simulation, heat source origin
Citation: Cui Y, Zhu C, Qiu N, Tang B, Guo S and Lu Z (2022) The Heat Source Origin of Geothermal Resources in Xiong’an New Area, North China, in View of the Influence of Igneous Rocks. Front. Earth Sci. 10:818129. doi: 10.3389/feart.2022.818129
Received: 19 November 2021; Accepted: 11 January 2022;
Published: 01 March 2022.
Edited by:
Yanlong Kong, Institute of Geology and Geophysics (CAS), ChinaCopyright © 2022 Cui, Zhu, Qiu, Tang, Guo and Lu. This is an open-access article distributed under the terms of the Creative Commons Attribution License (CC BY). The use, distribution or reproduction in other forums is permitted, provided the original author(s) and the copyright owner(s) are credited and that the original publication in this journal is cited, in accordance with accepted academic practice. No use, distribution or reproduction is permitted which does not comply with these terms.
*Correspondence: Chuanqing Zhu, emh1Y3FAY3VwLmVkdS5jbg==
Disclaimer: All claims expressed in this article are solely those of the authors and do not necessarily represent those of their affiliated organizations, or those of the publisher, the editors and the reviewers. Any product that may be evaluated in this article or claim that may be made by its manufacturer is not guaranteed or endorsed by the publisher.
Research integrity at Frontiers
Learn more about the work of our research integrity team to safeguard the quality of each article we publish.