 Xu Han
 Kai Zhang1,2*
- 1State Key Laboratory of Geomechanics and Deep Underground Engineering, China University of Mining and Technology, Xuzhou, China
- 2School of Mechanics and Civil Engineering, China University of Mining and Technology, Xuzhou, China
The support of roadways in soft coal seams is a challenge in deep coal mines. For gas-rich coal seams, many methods are developed to drain the gas before mining. The penetrating hydraulic reaming (PHR) is one of the most efficient methods to reduce the gas content and pressure in the coal seams. However, the PHR method will cause many large holes in the coal seam, which brings difficulty to in-seam roadways control. The strength parameters of the coal are essential for roadway stability analysis. However, in soft coal seams, the sampling of the coal is difficult, and the direct evaluation of the coal strength parameters is unfeasible. In the present research, the surrounding rock damage characteristics of the holes induced by PHR are first evaluated by ground-penetrating radar (GPR). Then, the strength parameters of the coal are determined via the back-analysis method. After that, the deformation and failure of the roadway are analyzed, and an optimized support scheme is proposed. According to the monitored displacement and measured damage zone of the roadway, the roadway is well controlled by the proposed support scheme.
Introduction
In deep coal mines with soft coal seams, the control of roadway stability is a challenge due to the high in situ stress and surrounding rock with low strength. (He et al., 2005; Yang et al., 2013; Zong et al., 2014). Although many technologies have been proposed for the roadway support in recent years, the accidents caused by the failure of roadway are still a main threat to the deep coal mines in China (Cai and Kaiser, 2004; Tan et al., 2013; Yang et al., 2013; Felix et al., 2014; Zong et al., 2014). During the excavation of the roadways, the surrounding rock mass will undergo plastic deformation and damage, and an excavation damage zone (EDZ) will arise around the roadway (Melkoumian et al., 2009; Sriapai et al., 2013; Yu et al., 2020). The support structure, such as rockbolt or cable, is used to control the extent of EDZ and prevent the deformation of rock mass. Therefore, the estimate of the extent of EDZ in the surrounding rock mass is essential for the support design of roadway. If the mechanical parameters of the rock mass are determined, the EDZ can be analyzed by theoretical analysis or numerical simulation (Coggan et al., 2012; Du et al., 2019; Qin et al., 2019). However, due to the low strength of the coal and distribution of joints, it is difficult to estimate the mechanical parameters of the rock mass either in situ or laboratory. Alternatively, many researchers attempt to measure the extent of EDZ directly in the field via ground-penetrating radar (GPR) or Goodman jack, et al. However, the in situ tests are quite time-consuming and can only evaluate the EDZ, while the roadway has been supported.
For gas-rich coal seams, penetrating hydraulic reaming (PHR) has been one of the most efficient methods to reduce the gas content and pressure in the coal seams (Gao and Xie, 2009; Spearing et al., 2013; Zhang et al., 2015; Jiang et al., 2019). During the excavation of the roadway in the coal seam, the holes induced by PHR may be revealed. The damage zone around the holes can reflect the mechanical properties of the rock mass. Therefore, in the present research, the surrounding rock damage characteristics of the holes induced by PHR are first determined by GPR. Then, the strength parameters of the rock mass are determined via the back-analysis method. Based on the aforementioned analysis, the deformation and failure of the roadway are analyzed, and an optimized support scheme is proposed.
Detection of Damage Zone Around PHR Induced Holes
Geological Conditions
The coal mine of this research is located in Yuzhou City, Shanxi Province, China. The tests were carried out in the # 32051 preparation roadway, which belongs to 32 working faces in the Liangbei coal mine, and its buried depth was -637 m. The roof of the roadway was made of medium-grained sandstone (4.98 m thick) and mudstone (10.64 m thick), while the coal seam floor was mudstone or siltstone (4.51 m thick). The coal seam was 5 m thick on average, with an average compressive strength of 1.63 MPa. They can therefore be considered as soft coal seam (Table 1). The dip angle of the roadway was 0°–7°. The height of the roadway was 5.3 m, and the width was 5.1 m. In the coal seam, hydraulic reaming with a distance of 6 m was distributed. Before the excavation of the preparation roadway, the reaming hole was drilled in the bottom drainage roadway (Figure 1). In order to determine the damaged zone of the coal seam, three measuring surfaces were chosen before mining.
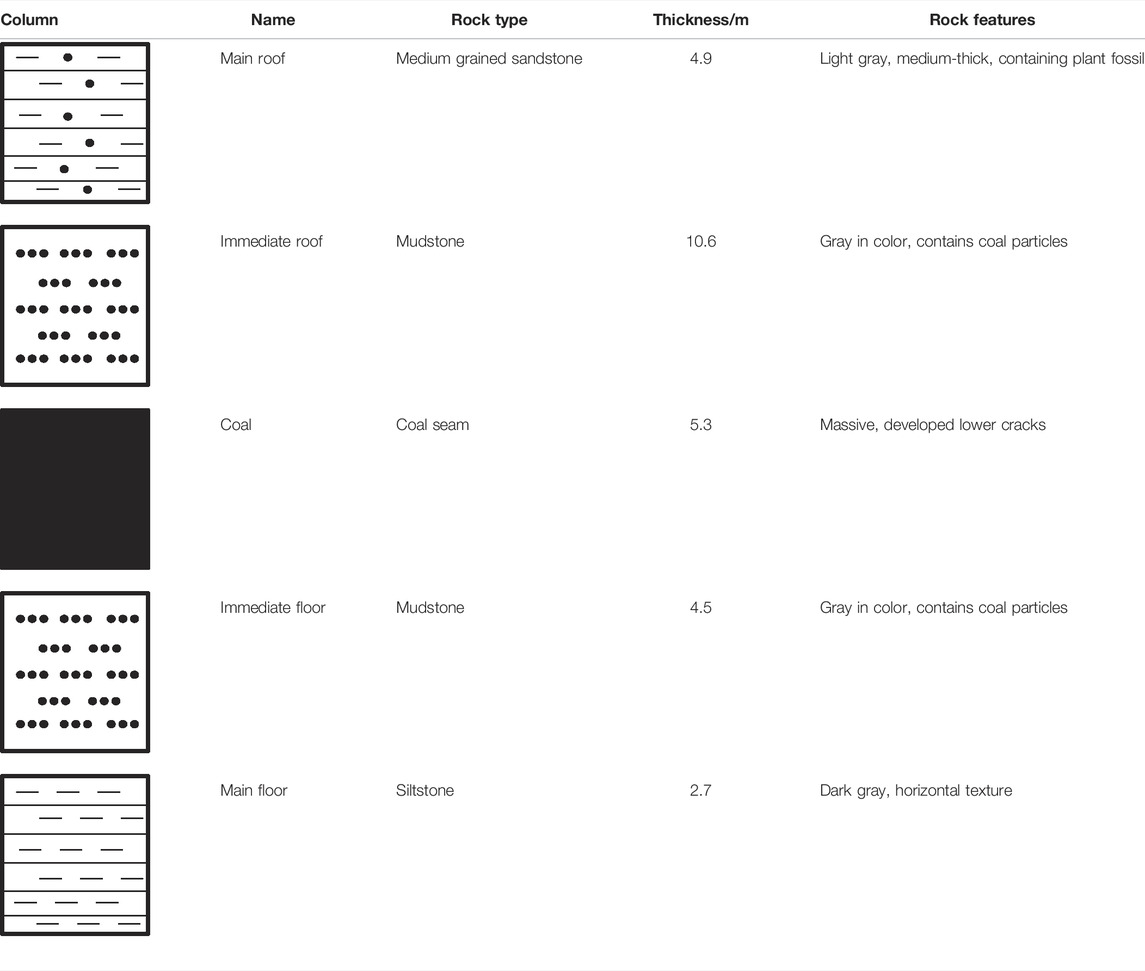
TABLE 1. Condition of coal seam roof and floor.
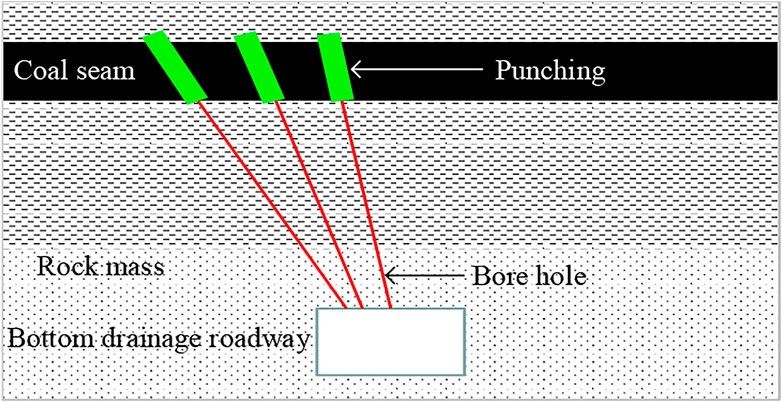
FIGURE 1. Profile map of PHR.
Before the experiment was carried out, the ground stress at the experimental site should be determined. The initial stress was referred to the adjacent Pingdingshan coal mine which has similar geological history and depth. The vertical stress is 2.61 MPa, the maximum and minimum horizontal stresses are 7.86 and 5.21 MPa, respectively. The directions of ground stress are presented (Figure 2).
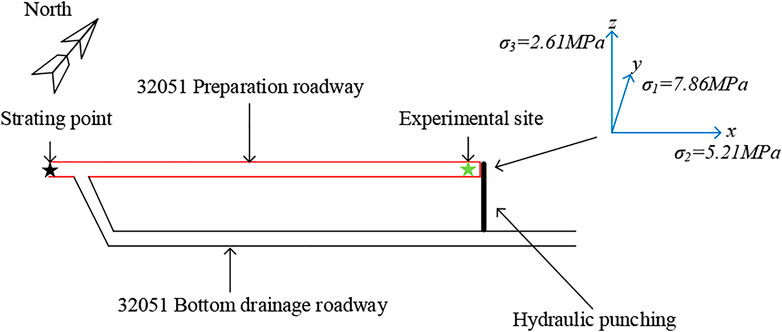
FIGURE 2. Sketch map of experimental site and ground stress.
Experimental Equipment
The Pulse EKKO100 Ground Penetrating Radar (GPR) is used to measure the plastic zone which has an accuracy of 0.01 m. The radar can estimate the EDZ by receipting electromagnetic wave in different mediums. In particular, when electromagnetic waves pass through different mediums, part of them will be reflected. The interfaces among different media can be then analyzed.
Test Scheme and Results
In order to avoid the disturbance caused by the excavation of the roadway, the EDZ was tested immediately once the borehole was finished. Since three points can determine the elliptical extent of the plastic zone, three measuring surfaces were selected at the same borehole for testing, namely, the excavation direction of the roadway and the two directions with an angle of 30° from this axis. During the test, the GPR was slowly moved along the measuring surface from the starting point to the end point (Figure 3).
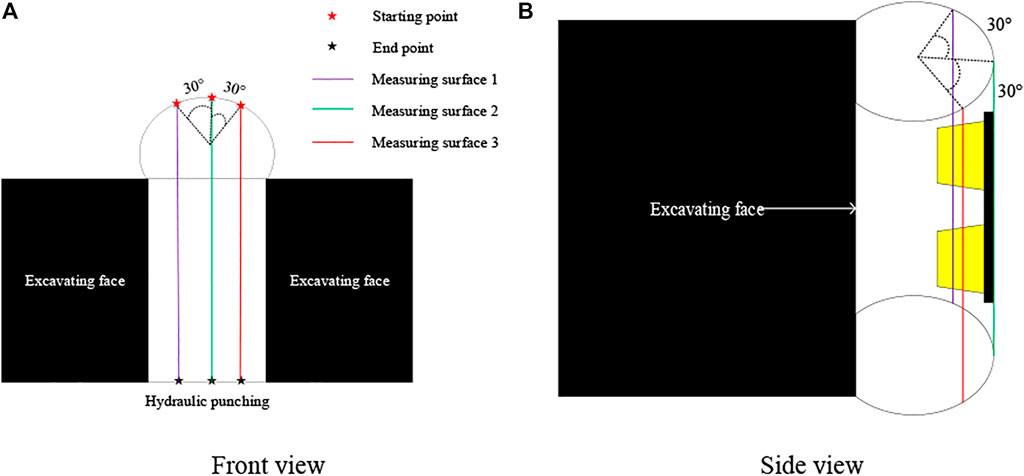
FIGURE 3. Sketch map of the distribution of measuring surfaces. (A) Front view. (B) Side view.
It can be seen from the image that the electromagnetic wave fluctuates significantly within 2.4 m at measuring surface 1. This shows that this is the junction between the EDZ and the total rock mass, and the radius of the EDZ of the reaming is then determined. Similarly, the EDZ radius of measuring surfaces 2 and 3 are 2.6 and 2.4 m, respectively. The test results are shown in Figure 4.
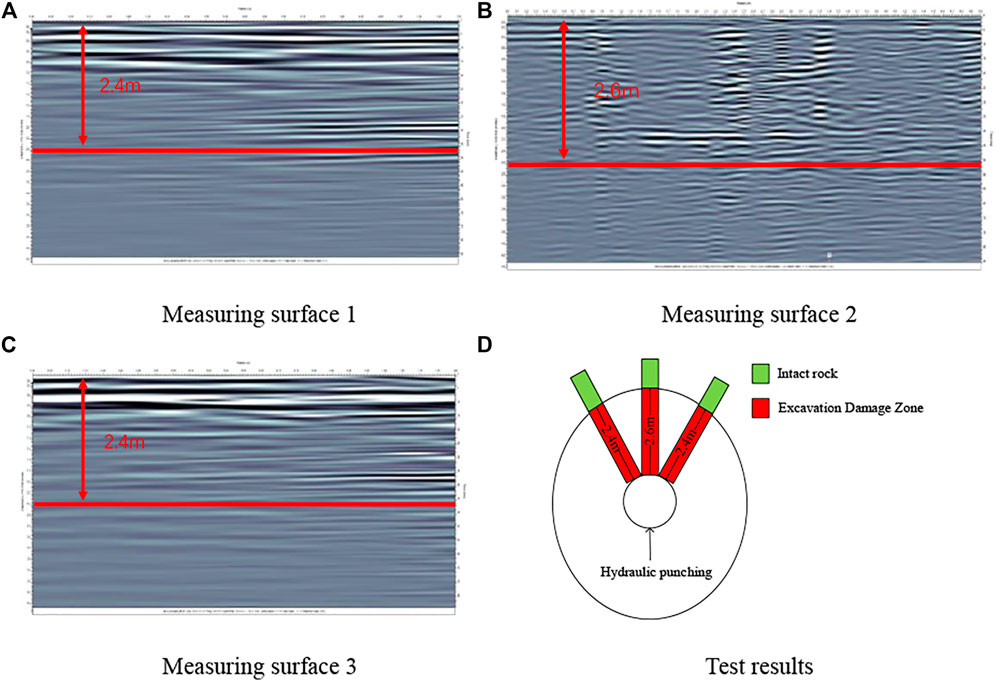
FIGURE 4. Test results. (A) Measuring surface 1. (B) Measuring surface 2. (C) Measuring surface 3. (D) Test results.
Determination of Mechanical Parameters
Since the reaming can be regarded as a long cylinder, the cross section and the constraints parallel to the cross section do not change with the length. Therefore, the analysis of hydraulic reaming can be simplified as a plane strain problem. Due to the unequal horizontal force on the reaming, the side pressure coefficient in the horizontal direction will be considered. Therefore, the function of complex variable is used to reflect the EDZ around the hole. The formulas for calculating the stress and plastic zone of a borehole in the surrounding rock were established by previous scholars.
There are seven parameters in Eq. 1, where σy is the stress along the y-axis, λ is the side pressure coefficient, θ is the angle of the surrounding rock coordinate system, C is the cohesive force, η is the internal friction angle, and r is the radius of the borehole.
In order to calculate the EDZ of the borehole, pass the formula by the analytical solution. It is necessary to explore the size and shape of the EDZ of the borehole under different cohesive forces. According to the geological conditions, the parameter σy is 10 MPa, the λ is 1.2, the parameter r = 0.75 m, and the internal friction angle η = 27.67°. Therefore, the parameter C is the only variable in Eq. 1. According to the characteristics of coal seam, the cohesive force C is determined as 0.1, 0.2, 0.3, 0.4, and 0.5 MPa, respectively. Therefore, the EDZ is calculated under different cohesion forces.
The results from Figure 5 showed that the distribution of the EDZ is elliptical, especially the long axis is along the σy direction where the ground stress is smaller, and the short axis is along the direction where the ground stress is higher. The distribution of values is regular: (0°, 180°) > 45° > both sides (90°, 270°). With the increase in cohesive force, the range of EDZ shrinks gradually. Moreover, the degree of change becomes smaller. When the local cohesion C is higher than 0.2 MPa, the changing trend of the radius is obviously reduced with the increase in cohesion and the distribution of the EDZ can be obtained from the results. Therefore, the long axis of the plastic zone is 5.2 m. The value of the cohesive force C is 0.3 MPa.
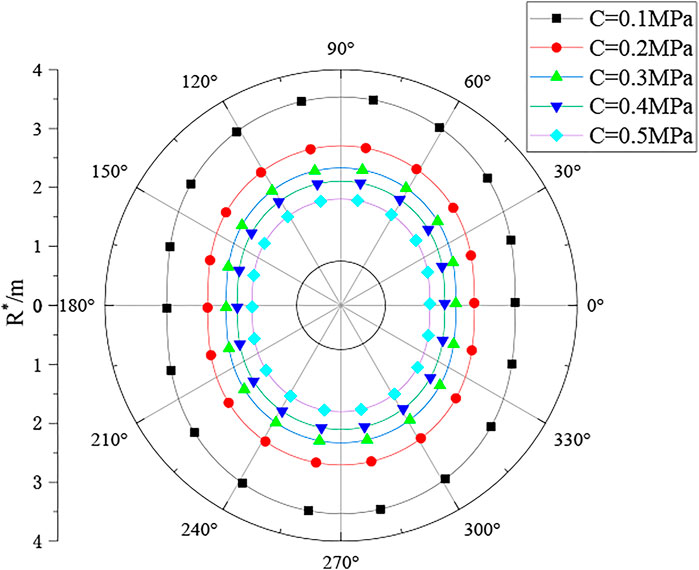
FIGURE 5. Radius distribution of plastic zone around hydraulic reaming.
Surrounding Rock Damage Characteristics of Roadway
In this section, the commercial software FLAC3D was used. The rock mechanics parameters obtained before were used to calculate the EDZ of the roadway.
Model Establishment and Parameter Selection
A numerical simulation model was established based on the geological conditions of Liangbei coal mine, having length, width, and height of 100 m, 70, and 100 m, respectively. The displacement of the model base was 0. Gravity stress was applied on the surface according to the buried depth of the roadway and both the bottom and lateral displacement of the model were fixed. The element mesh model is shown in Figure 6. The Mohr–Coulomb failure criterion was used for calculation. According to the conditions on-site, the excavation distance of each step was 3 m. The excavation was carried out step by step. The supporting diagram is shown in Figure 7.
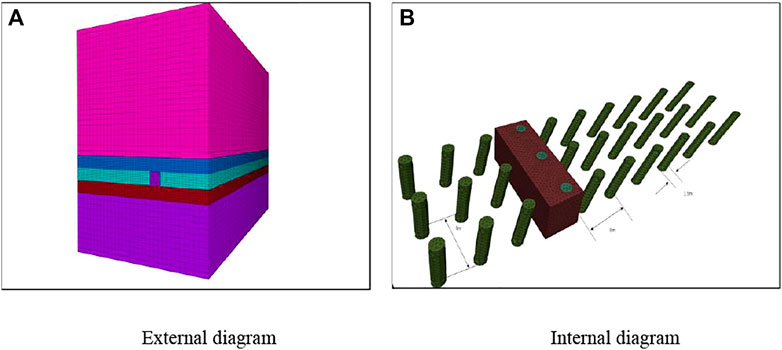
FIGURE 6. Schematic diagram of the model. (A) External diagram. (B) Internal diagram.
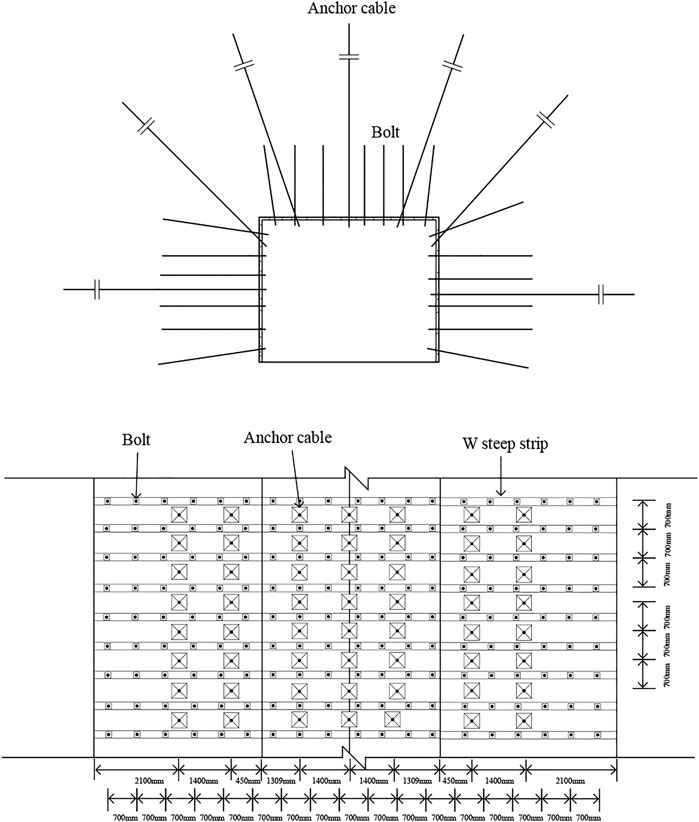
FIGURE 7. Schematic diagram of cross-sectional support.
Numerical Simulation Results and Analysis
The plastic zone and stress cloud diagrams obtained by numerical simulation are sliced along the horizontal direction and shown in. It can be seen that after the excavation of the hydraulic reaming, the stress in a particular range around the reaming was redistributed. The surrounding plastic zone can match the shape of the plastic zone calculated by Eq. 1. The reamed plastic zone under unequal horizontal force presents an approximately elliptical shape. The long and short axes are perpendicular to the direction of maximum principal stress and minimum principal stress, respectively.
Based on the results, the excavation of the roadway will not increase the radius of the plastic zone at the measuring surfaces. In contrast, the roadway without reaming is excavated, and the cloud graph of the plastic zone is shown in Figure 8. It can be seen that the subsequent excavation of the roadway will not affect the range of the plastic zone at the measuring surface.
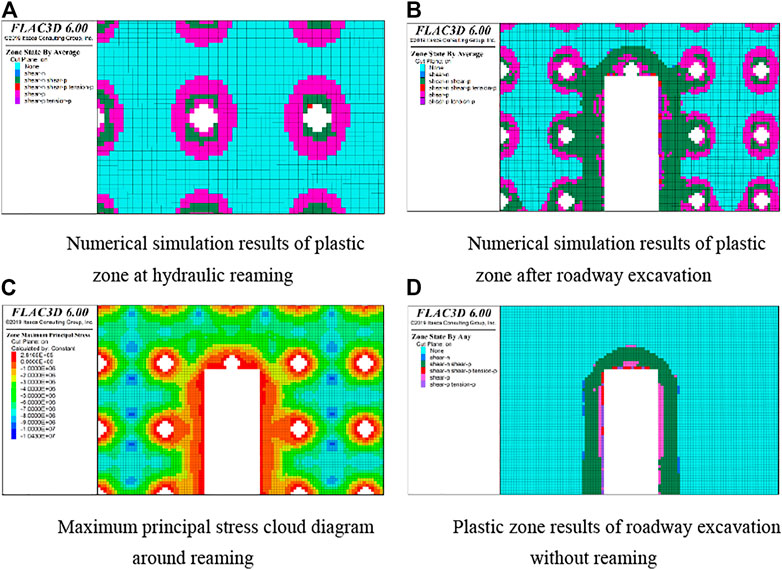
FIGURE 8. Numerical simulation results. (A) Numerical simulation results of plastic zone at hydraulic reaming. (B) Numerical simulation results of plastic zone after roadway excavation. (C) Maximum principal stress cloud diagram around reaming. (D) Plastic zone results of roadway excavation without reaming.
Simulation Result Verification
In order to verify the results obtained by the numerical simulation, the field test was then carried out. The section at the working face of the roadway is used for measurement. The GPR was used on both sides of the roadway, and the schematic diagram is shown in Figure 9. By analyzing the image obtained using the GPR, the plastic zone radius of both sides of the roadway is 2.8 m, which was similar to the results of the numerical simulation.
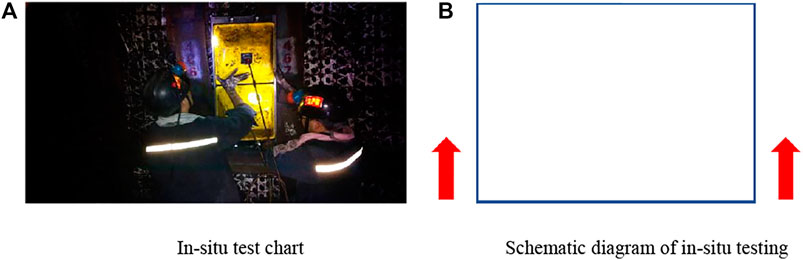
FIGURE 9. Schematic diagram of in situ test. (A) In situ test chart. (B) Schematic diagram of in situ testing.
Results and Discussion
Since the parameters obtained before are close to the rock mass on-site, this method can better reflect the distribution of the plastic zone. In this section, the parameters obtained before will be used for the roadway supporting method and parameters selection. The anchor rod and anchor cable are selected as the primary support tools, and the steel belt joist is the auxiliary support tool.
Mechanism of Anchor Rod and Anchor Cable
1) Mechanism of anchor rod: A large number of studies have shown that the primary function of the bolt is to increase the strength, elastic modulus, internal friction angle, and cohesion of the surrounding rock mass after failure. For the tensile and shear areas of the surrounding rock of the roadway, bolts can improve the stress state of the rock mass. For discontinuous surfaces such as joints and cracks, anchor rods can improve the shear strength of the structural surface. It can also improve the shear strength of the structural surface and improve the overall strength and integrity of the rock mass. For relatively broken rock masses, bolts can restrain the expansion and deformation of the rock masses and improve the overall strength and integrity of the rock mass. It can be seen that the main target of the bolt is the rock mass with lower strength. For the rock mass in the plastic zone and in the elastic zone, the effect of bolts is relatively lower. Therefore, it is necessary to use anchor cables to connect the anchoring areas.
2) Mechanism of anchor cable: The role of the anchor cable is mainly to connect the surrounding rock after the anchor rod is reinforced with the bearing layer of the deep surrounding rock. In this way, the load-bearing capacity of the deep rock mass can be fully improved, and the rock mass in a larger area can be controlled together.
Support Parameter Design
According to the Mining Engineering Design Manual, a mesh reinforcement anchor cable-combined support scheme is carried out in the roadway. The initial support scheme is provided by mesh reinforcement and anchor cable. The roof is supported with a steel mesh, W-type steel belt, thread steel anchor, and anchor cable. A left-handed non-longitudinal rebar normal-strength thread steel anchor is modified to strengthen the support with a diameter of 20 mm and a length of 2600 mm. The anchor cable has a diameter of 21.6 mm and a length of 8000 mm, composed of steel strands. The type of W-type steel belt is BHW-280-4.00 steel belt with a length of 5400 mm. The diameter, length, and width of the steel mesh are 6, 1540, and 840 mm, respectively. The row spacing and column spacing of the thread steel anchor are both 700 mm. The row spacing of the anchor cable is 1400 mm, and the column spacing is 700 mm. The W-type steel belt of two sides adopts the BHW-280-4.00 steel belt with a length of 2500 mm and the BHW-280-4.00 steel belt with a length of 1800 mm. The pre-stressing of anchor cables of two sides is not less than 100 kN, and the pre-stressing of anchor cables of the roof is not less than 300 kN.
Under this support scheme, ground stress balance and excavation are carried out. In order to reduce the influence of boundary conditions on the model, the monitoring section is taken at y = 5 m. The displacement cloud diagrams around the roadway obtained by the numerical simulation are shown in Figure 10. Moreover, the initial support scheme is implemented, and the results are shown in Figure 11.
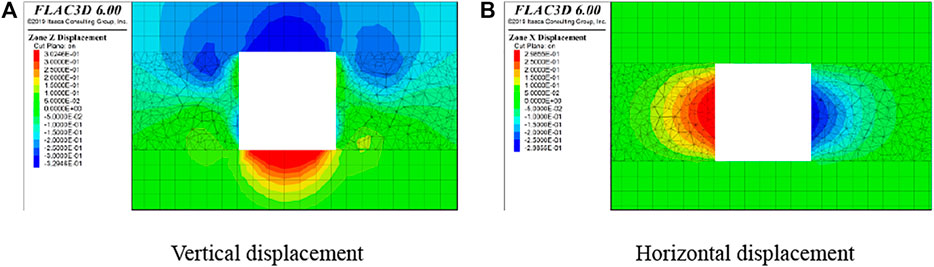
FIGURE 10. Displacement cloud diagram of initial scheme. (A) Vertical displacement. (B) Horizontal displacement.
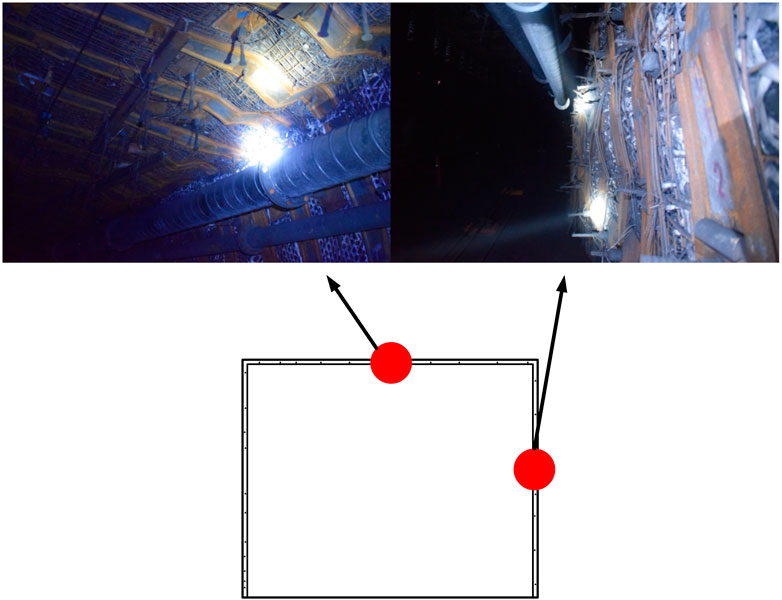
FIGURE 11. Supporting effect of improve scheme.
According to the numerical simulation results and the on-site support schematic diagram, the displacement of the two sides and roof in the first support scheme is large. This is because the anchor cable is located in the middle of the two rows of anchor rods and each tool bears load separately. This means anchor cables and anchor rods are not taken as a whole. The component with lager stiffness can be destructed first, and then other support tools bear loads and damage. This situation will cause the losses of the whole support structure.
The initial scheme only focuses on the support effect of a single element. At the same time, the synergetic effect is ignored. Therefore, in order to improve the outcome of supporting, the bolts strength and density of the anchor are increased blindly. In fact, by appropriately adjusting the acting position of the anchor cable and the connection mode between the anchor cable and the steel anchor, the synergetic support effect can be achieved. It is important to achieve the cooperation between the anchor cable’s and anchor rod’s design strength. This can improve the safety of the roadway and accelerate the construction schedule. In addition, according to the theory of “Anchor cable pull-out force attenuation during group anchoring” proposed by Professor Shan Renliang of China University of Mining and Technology, the short distance of the anchor cables will cause the stress loss of adjacent anchor cables after tensioning. Therefore, the distance between the anchor cables should be reasonably controlled to fully mobilize the performance of anchor cables and the steel anchors and get the synergetic effect.
Based on the drawbacks of the initial support scheme and the aforementioned theoretical basis, the scheme was optimized. The mesh reinforcement and anchor cable are considered as the main element in the support structure. The steel mesh, W-type steel belt, steel anchor, and anchor cable combined support were used in the roadway. Furthermore, the steel joists are used on both sides of the roadway. The steel joist is made of miner steel, with a total length of 2600 mm and a distance between ends of 600 mm. Moreover, the two rows of steel joists are arranged alternately. In addition, the anchor rods in the top and bottom are inclined upward and downward, respectively, by 15°–30°. The diagrams of improved support schemes are shown in Figure 12.
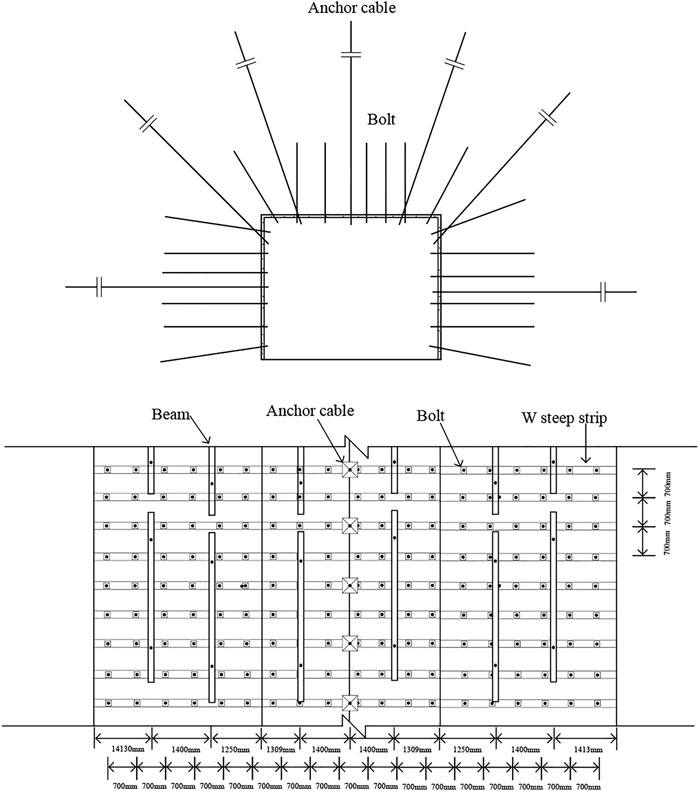
FIGURE 12. Improved support system.
The effect of the improved scheme is shown in Figure 13. The cross-monitoring method is used for displacement monitoring, and infrared displacement monitoring instruments are placed on the roof and side of the roadway. The displacement of roadway by different support schemes is indicated in Figure 14. The top-bottom distance has been reduced by 232 mm, and the two-side distance has been reduced by 208 mm. The improvement is noticeable and the moving amount of the roof and the two sides of the roadway can be limited within 500 mm according to the Mining Engineering Design Manual. The improved scheme can control the excessive deformation of the roadway and maintain the stability of the surrounding rock.
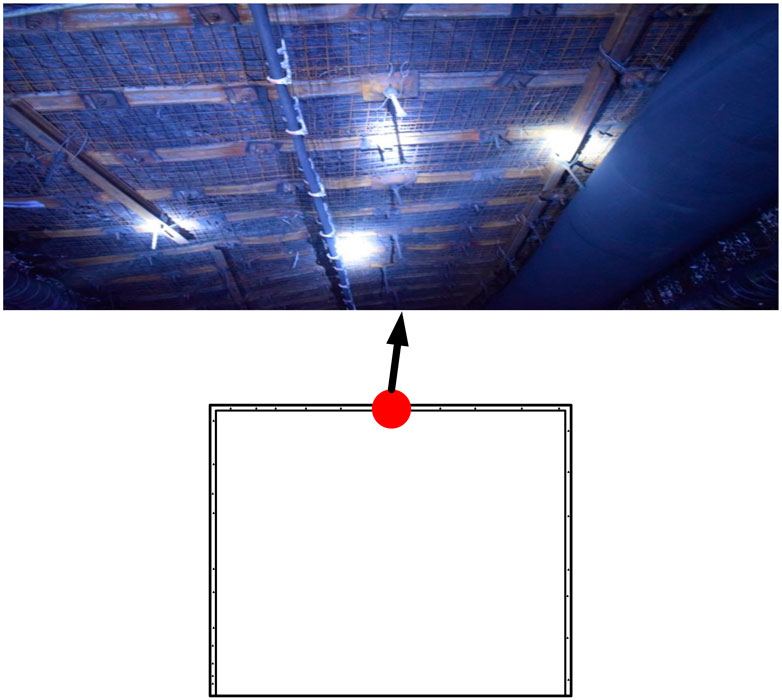
FIGURE 13. Supporting effect diagram of improved scheme.
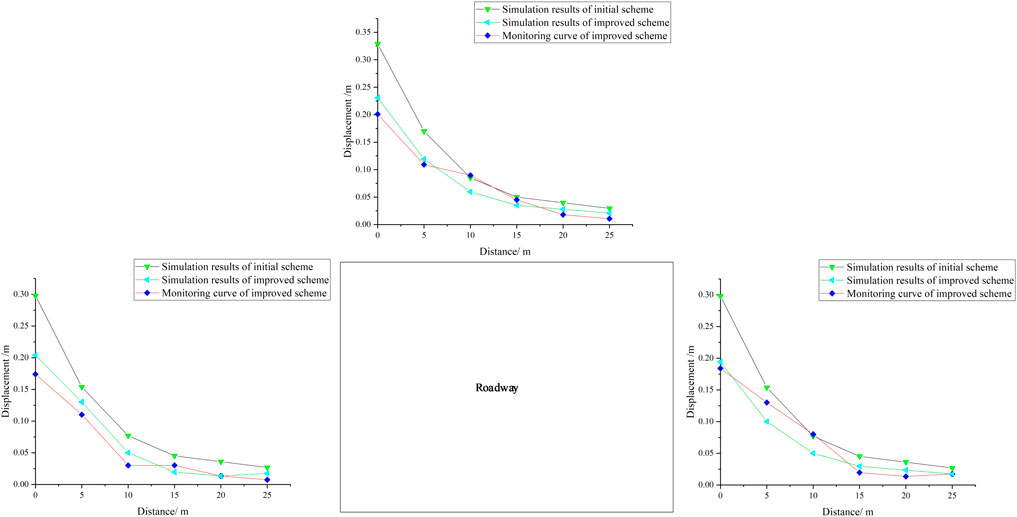
FIGURE 14. Comparison of two support schemes.
Conclusion
1) Based on GPR tests, the range of the EDZ at the measuring surfaces of hydraulic reaming was measured, which can be used to calculate the strength parameters through the plastic zone formula based on the complex variable function. The parameters were verified by field experiments and were consistent with the measurement results.
2) According to the strength parameters, the displacement in surrounding rock under different support schemes was calculated by means of FALC 3D. The results were verified by field experiments and found to be consistent with the field test results.
3) A reasonable joint support scheme and support parameters were designed according to the strength parameters, which can improve bearing performance and ensure the long-term stability of the soft coal seam roadway.
Data Availability Statement
The original contributions presented in the study are included in the article/Supplementary Material, further inquiries can be directed to the corresponding author.
Author Contributions
Conception and design of study: XH, KZ and XX. Drafting of the manuscript: XH, KZ and XX. Analysis and/or interpretation of data: XH, KZ and BM.
Funding
This work was supported by the National Natural Science Foundation of China (No. 52074260).
Conflict of Interest
The authors declare that the research was conducted in the absence of any commercial or financial relationships that could be construed as a potential conflict of interest.
Publisher’s Note
All claims expressed in this article are solely those of the authors and do not necessarily represent those of their affiliated organizations, or those of the publisher, the editors, and the reviewers. Any product that may be evaluated in this article, or claim that may be made by its manufacturer, is not guaranteed or endorsed by the publisher.
References
Cai, M., and Kaiser, P. K. (2004). Assessment of Excavation Damaged Zone Using a Micromechanics Model. Tunnelling Underground Space Technology incorporating Trenchless Technology Res. 20 (4), 301–310. doi:10.1016/j.tust.2004.12.002
Coggan, J., Gao, F., Stead, D., and Elmo, D. (2012). Numerical Modelling of the Effects of Weak Immediate Roof Lithology on Coal Mine Roadway Stability. Int. J. Coal Geology. 90-91, 100–109. doi:10.1016/j.coal.2011.11.003
Du, S., Li, D., and Sun, J. (2019). Stability Control and Support Optimization for a Soft-Rock Roadway in Dipping Layered Strata. Geotech Geol. Eng. 37 (3), 2189–2205. doi:10.1007/s10706-018-0753-y
Felix, K., Rüdiger, G., Catherine, A., and Stefan, B. (2014). Seismic Travel-Time and Attenuation Tomography to Characterize the Excavation Damaged Zone and the Surrounding Rock Mass of a Newly Excavated Ramp and Chamber. INT. J. ROCK MECH. MIN 70, 524–532. doi:10.1016/j.ijrmms.2014.06.010
Gao, F.-Q., and Xie, Y.-S. (2009). Resist-decreasing Effects of Rock Bolts on Strength of Rock Mass Around Roadway-Insight from Numerical Modeling. Mining Sci. Technology (China) 19 (4), 425–429. doi:10.1016/S1674-5264(09)60079-X
He, M. C., Xie, H. P., Peng, S. P., and Jiang, Y. D. (2005). Study on Rock Mechanics in Deep Mining Engineering. Yanshilixue Yu Gongcheng Xuebao/Chinese J. Rock Mech. Eng. 24 (16), 2803–2813.
Jiang, L., Kong, P., Shu, J., and Fan, K. (2019). Numerical Analysis of Support Designs Based on a Case Study of a Longwall Entry. ROCK MECH. ROCK ENG. 52 (9), 3373–3384. doi:10.1007/s00603-018-1728-2
Melkoumian, N., Priest, S. D., and Hunt, S. P. (2009). Further Development of the Three-Dimensional Hoek-Brown Yield Criterion. ROCK MECH. ROCK ENG. 42 (6), 835–847. doi:10.1007/s00603-008-0022-0
Qin, Z., Fu, H., and Chen, X. (2019). A Study on Altered Granite Meso-Damage Mechanisms Due to Water Invasion-Water Loss Cycles. ENVIRON. EARTH SCI. 78 (14), 1–10. doi:10.1007/s12665-019-8426-6
Spearing, A. J. S., Hyett, A. J., Kostecki, T., and Gadde, M. (2013). “New Technology for Measuring the In Situ Performance of Rock Bolts,” Int. J. rock Mech. mining Sci. 57, 153–166. doi:10.1016/j.ijrmms.2012.07.027
Sriapai, T., Walsri, C., and Fuenkajorn, K. (2013). “True-triaxial Compressive Strength of Maha Sarakham Salt,”Int. J. rock Mech. mining Sci. 61, 256–265. doi:10.1016/j.ijrmms.2013.03.010
Tan, Y. L., Yu, F. H., and Chen, L. (2013). A New Approach for Predicting Bedding Separation of Roof Strata in Underground Coalmines. INT. J. ROCK MECH. MIN 61, 183–188. doi:10.1016/j.ijrmms.2013.02.005
Yang, X., Pang, J., Liu, D., Liu, Y., Tian, Y., Ma, J., et al. (2013). Deformation Mechanism of Roadways in Deep Soft Rock at Hegang Xing’an Coal Mine. Int. J. Mining Sci. Technology 23 (02), 307–312. doi:10.1016/j.ijmst.2013.04.002
Yu, K., Ren, F., Puscasu, R., Lin, P., and Meng, Q. (2020). Optimization of Combined Support in Soft-Rock Roadway. Tunnelling Underground Space Technology 103, 103502. doi:10.1016/j.tust.2020.103502
Zhang, K., Zhang, G., Hou, R., Wu, Y., and Zhou, H. (2015). Stress Evolution in Roadway Rock Bolts during Mining in a Fully Mechanized Longwall Face, and an Evaluation of Rock Bolt Support Design. Rock Mech 48 (1), 333–344. doi:10.1007/s00603-014-0546-4
Keywords: soft-rock mass roadway, support optimization, EDZ, ground support, numerical simulation
Citation: Han X, Zhang K, Xue X and Ma B (2022) Surrounding Rock Damage Characteristics and Support Optimization of Roadway in Soft Gas-Rich Coal Seam Under the Condition of Penetrating Hydraulic Reaming. Front. Earth Sci. 10:812687. doi: 10.3389/feart.2022.812687
Received: 10 November 2021; Accepted: 16 March 2022;
Published: 26 April 2022.
Edited by:
Wei Liu, Chongqing University, ChinaReviewed by:
Jun Wang, Shandong University of Science and Technology, ChinaFanzhen Meng, Qingdao University of Technology, China
Copyright © 2022 Han, Zhang, Xue and Ma. This is an open-access article distributed under the terms of the Creative Commons Attribution License (CC BY). The use, distribution or reproduction in other forums is permitted, provided the original author(s) and the copyright owner(s) are credited and that the original publication in this journal is cited, in accordance with accepted academic practice. No use, distribution or reproduction is permitted which does not comply with these terms.
*Correspondence: Kai Zhang, a3poYW5nQGN1bXQuZWR1LmNu