 Changsong Zheng1
 Wen He
- 1School of Resources and Environmental Engineering, Jiangxi University of Science and Technology, Ganzhou, China
- 2Jiangxi Province Key Laboratory of Mining Engineering, Jiangxi University of Science and Technology, Ganzhou, China
- 3Engineering Research Center for High-efficiency Development and Application Technology of Tungsten Resources (Jiangxi University of Science and Technology), Ministry of Education, Ganzhou, China
- 4Jiangxi Zhongliang Blasting Engineering Co. LTD, Pingxiang, China
The guided wave technique is applied to slope stability monitoring to overcome the high attenuation characteristics of acoustic emission propagation in rock and soil materials. The shear tests of “guided wave meter” (GWM) with different deformation rates were carried out, and the effects of the material and particle size of the coupling medium and the diameter of the waveguide rod on the flexural guided wave ring down count were studied, and the relationship between the deformation rate of the slope and the flexural guided wave parameters was analyzed. The results show that the flexural guided wave ring down count rate increases with the increase of deformation in the loading process. The GWM filled with quartz sand particles produces more flexural guided wave ring down counts than those filled with gravel particles. From the twelve groups of GWM shear tests, it can be seen that the GWM with the combination of 16 mm waveguide rod and 4–8 mm quartz sand produces the highest cumulative flexural guided wave ring down counts. The combination is used as an optimized GWM. By applying different deformation rates to the optimized GWM, it was found that the flexural guided wave ring down count rate at different deformation rates tended to increase and was distributed in a fan shape. The cumulative flexural guided wave ring down count has an excellent linear correlation with the deformation. The slope of the cumulative ring down count curves and the deformation curves are obtained separately, which shows that the deformation rate has an excellent linear relationship with the slope of the cumulative ring down count curve, and the slope of the cumulative ring down count curve increases with the increase of the deformation rate. It provides theoretical guidance for quantifying the slope deformation rate using the flexural guided waves.
1 Introduction
Major mining, hydropower, and transportation projects involve excavating rock slopes, which often face different types and scales of slope instability problems. Bedding rock slopes are widely distributed, and the weak structural surface within the slope is the same as the slope tendency (Lu et al., 2011); with the poor mechanical effect of itself (Li et al., 2014), it is prone to cause sudden landslides under strong disturbance from outside. Landslides generated by such slopes have become one of the most frequent geological hazards, seriously threatening people’s lives and property safety and affecting engineering construction and operation (Liao et al., 2014).
Most landslides are progressive and go through three stages from eruption to damage (Chandler, 1984; Petley et al., 2005; Hungr et al., 2014; Hu et al., 2018): primary deformation (AB section), steady deformation (BC section), and accelerating deformation (CD section), as shown in Figure 1. In the accelerating deformation stage, the slope may be suddenly damaged, and the sharp increase of deformation rate may be an apparent early warning indicator of critical sliding. The acoustic emission monitoring technique qualitatively responds to the degree of slope deformation by capturing and measuring the elastic waves generated during the slope deformation. The deformation behavior of geotechnical slopes and the mechanism of acoustic emission generation are different. In soil slopes, acoustic emission is usually caused by particle motion and mutual friction between particles (Koerner et al., 1975; Irfan et al., 2017). In rocks, it is caused by micro-fracture development, expansion, and penetration (Feng and Zhang, 2021). In general, the rock acoustic emission ring down count rate shows a significant increasing trend with an increasing strain rate (Zhao et al., 2021).
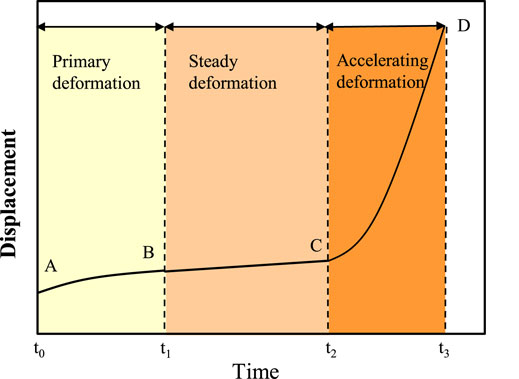
FIGURE 1. Three stages of landslide deformation.
Due to the high attenuation characteristics of acoustic emission during propagation in soil and rock (Pollard, 1977; Koerner et al., 1981; Hardy, 2003), Dixon et al. (2003) in 2003 proposed to use a waveguide rod to provide a low attenuation path for acoustic emission signals and to use a waveguide rod, a coupling medium, and an acoustic emission instrument to form an “active waveguide system” to monitor a coastal slope in northern England. The guided wave signal is mainly generated by the waveguide element’s deformation and the filling medium’s interaction with the waveguide rod. In 2007, Dixon and Spriggs (2007) also performed compression tests on waveguide models by applying different orders of magnitude of displacement rates. This test demonstrated a good correlation between the deformation rate and the acoustic emission rate for the first time. In 2011, Cheon et al. (2011) conducted laboratory shear and bending tests with beam-type specimens cast with cement mortar and waveguide rods. Damage degree evaluation criteria were established based on the trends of acoustic emission parameters, b-values from the indoor tests. Codeglia et al. (2017) conducted a 5-year (2010–2015) guided-wave monitoring of cut slopes in northeastern Italy and found that the internal stress changes in the rock mass caused by the water table were consistent with the trends of acoustic emission. From 2014 to 2015, Codeglia et al. conducted 1.5 years of field monitoring at a pilot project on the Alpine Railway to reduce the risk of damage to tracks and trains due to rockfall or landslides and provide a low-cost alternative to expensive rockfall barriers. Results from both cases suggest that the use of intensive waveguide monitoring can be used to detect and differentiate a range of rock slope deformation mechanisms. In 2017, Smith et al. (2017) developed a shear model consisting of two concrete blocks to examine the early warning potential of an active waveguide system under shear surface formation and accelerated deformation phases and found that the acoustic emission rate increased proportionally with increasing shear displacement of the fill. In 2018, Berg et al. (2018) showed that the measured acoustic emission magnitude was closely related to the displacement rate measured by Shape Accel Array (SAA) in the Peace River region of Canada.
The backfilled granular soil column is also deformed when the monitored geotechnical body is deformed. The acoustic signals, excited from the frictional collision between the particles and the waveguide rod, propagates along the waveguide rod, which provides a low attenuation path for the signal propagation. The guided wave monitoring system is simple and includes waveguide rods, backfill particles, transducers, amplifiers, signal processing and storage, and power supply. These factors will reduce monitoring costs, maintenance costs, and complexity. Fiber optic, laser, and digital image technologies, although more accurate, are expensive and only suitable for specific areas, such as mines, highways, and dangerous hillsides next to important buildings. The guided wave technique presents good monitoring performance, and a more attractive price makes it more universal in some underdeveloped areas.
However, most of the studies only qualitatively describe the acoustic characteristics of the damage process without establishing the quantitative relationship between the guided wave parameters and the slope deformation rate. In this paper, we start from the composition of the “guided wave meter” (GWM), study the influence of the coupling medium material, particle size, and waveguide rod diameter on the flexural guided wave parameters, and optimize the composition of the GWM. Then the dynamic shear test of the GMW is carried out, and the relationship between the slope deformation rate and the flexural guided wave signal parameters is established based on the characteristic analysis of the flexural guided wave signal parameters. Based on the shear test of the GWM, which represents the landslide of bedding rock slopes, the guided wave monitoring of the deformation rate of cascading rocky slopes is realized.
2 Experimental Design and Test Methods
2.1 “Guided Wave Meter” Shear Tests
Guide wave monitoring is a process of burying a waveguide rod inside a cascading rocky slope, which passes through the potential slip surface and then filling the coupling medium between the rod and the rock. Combining a waveguide rod and a coupling medium is defined as a “guided wave meter” (GWM). When the cascade slope slides along the slip surface, the coupling medium in the GWM interacts with the waveguide, and the resulting acoustic emission signals propagate along the waveguide in the form of guided waves. Guided waves are elastic waves that propagate in a specific boundary condition, which can be the surface of natural waveguide structures such as thin plates, rods, tubes, and multilayer materials (Joseph, 2014). The guided waves are reflected back and forth between the surfaces, and each reflection has a mode transition between longitudinal and transverse waves. Longitudinal, Flexural, and Torsional guided wave modes exist in metallic cylindrical rods. The propagation of the longitudinal guided wave will cause the vibration and deformation of the rod end face, and the propagation of the flexural guided wave will cause the vibration and deformation of the rod side, as shown in Figure 2.
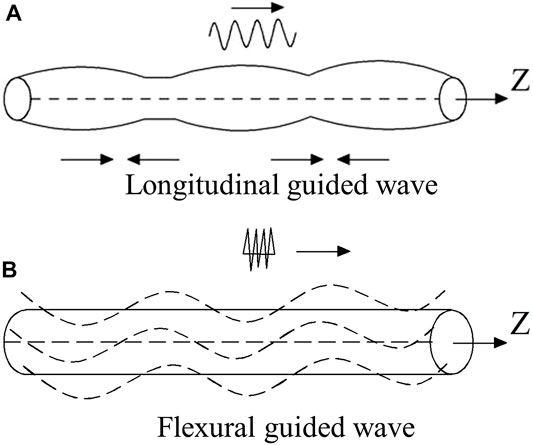
FIGURE 2. Wave propagation modes in a waveguide.
Since the GWM is affected by the shear mechanism during a landslide, an indoor shear model of the GWM was designed. The model consists of two base supports, a shear fixture, and a GWM. In order to fix the probe, the sensor probe is attached to the upper position of the side of the waveguide rod to collect the flexural guided wave signals, and the main view and section of the design scheme are shown in Figure 3.
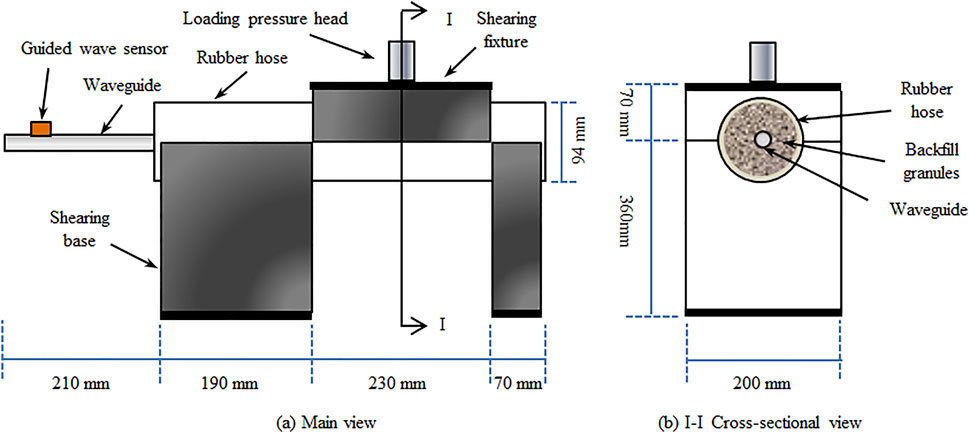
FIGURE 3. Shear test of “guided wave meter”.
2.2 Components of “Guided Wave Meter”
The GWM consists of a waveguide rod and a coupling medium. Studies have shown (Smith et al., 2014) that the material and diameter of the waveguide affect the attenuation of guided waves. The coupling medium is usually sand or gravel, which is used to backfill the gap between the waveguide and the borehole and as a signal “generator”. In the fine-grained soil slope, due to the poor acoustic properties of the matrix material, the amplitude of the generated guided waves is low, and the attenuation is significant, so it is difficult to monitor the guided wave signals without adding a coupling medium, which is easy to generate “noise”. The coupling medium’s material and particle size also affect the guided wave signals.
For the tests, a solid waveguide rod made of 304 steel with a length of 700 mm and diameters of 16 mm, 20 mm, and 24 mm were used. Four materials were selected as the coupling media, including 4–8 mm gravel, 4–8 mm quartz sand, 8–16 mm gravel, and 8–16 mm quartz sand, as shown in Figure 4. The density of the coupling media filled in each test is the same, 1,570 kg/m3. To ensure that coupling media of the GWM are evenly distributed, and in a moderately compacted state, the coupling media are thoroughly mixed when the GWM is filled. The gravel and quartz sand parameters are shown in Table 1 to investigate the effect of different materials and different particle sizes of the coupling medium on the guided wave signals.
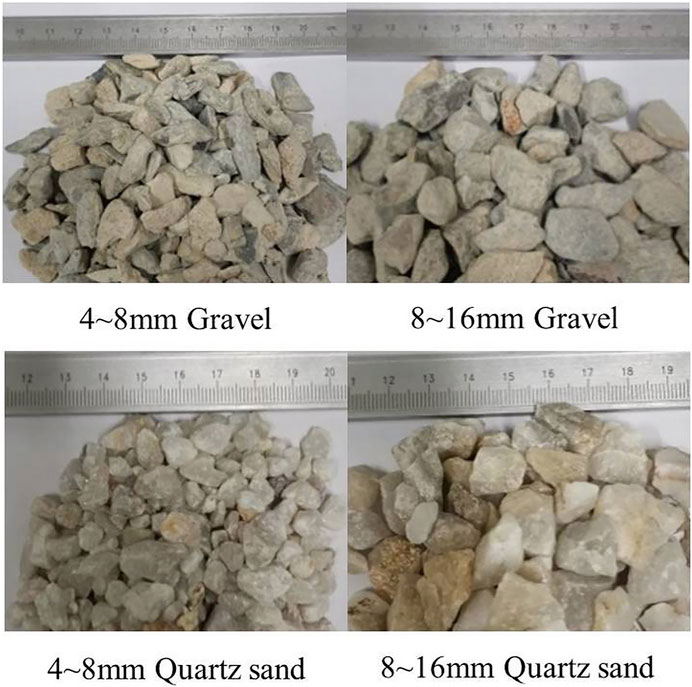
FIGURE 4. Photographs of the backfill materials.
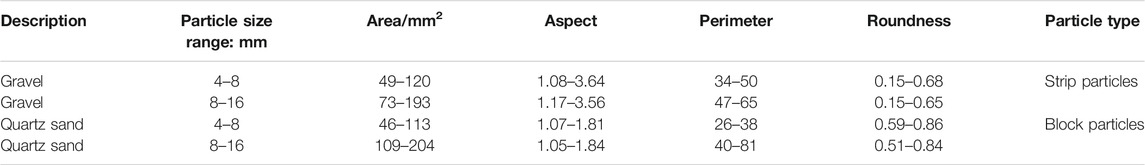
TABLE 1. Physical parameters of the Gravel and Quartz sand.
2.3 Test Equipment and Process
The test loading equipment is the RMT-150C rock mechanics system, with a custom shear fixture and support base designed to fit the loading space of the press. The two bases are made of welded cast steel and have a concave shape to match the cylindrical GWM. The GWM is a 90 mm diameter flexible rubber tube (2 mm thick silicone) that represents the borehole in the slope and supports the waveguide. Steel rings with screw retainers at both ends are used to restrain the backfill material. The assembled GWM is placed horizontally on the support base, and a force to the center of the shear fixture can induce the formation of two shear surfaces. The laboratory test system is shown in Figure 5.
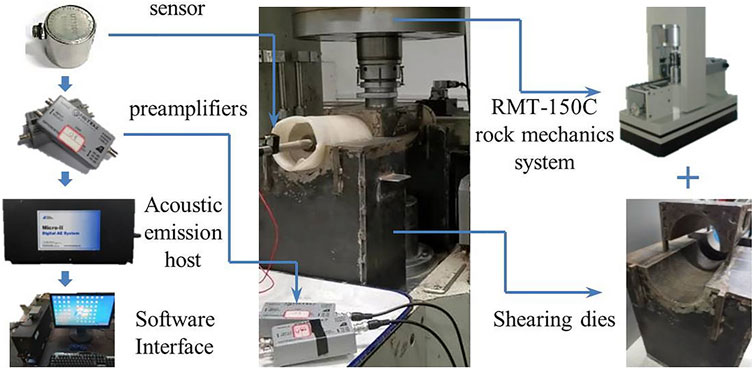
FIGURE 5. Experimental systems and devices.
Signal monitoring is performed using a PCI-2 acoustic emission system manufactured by PAC, which consists of sensors, preamplifiers, A/D converters, a computer, and data processing and analysis software. During the loading process, the coupling medium and the waveguide rod rub against each other to produce a signal source captured by the UT-1000 sensor, and then the signals pass through a 40 dB amplifier to improve the signal-to-noise ratio. After that, the electrical signals are converted to digital signals, and the data is processed and stored by computer and acoustic emission software. The test acquisition threshold is 35 dB, the sampling frequency is 1 M/S, and the sampling length is 1 k.
The loading of the press is controlled by stroke, and the maximum loading displacement is set to 10 mm to avoid damage to the rubber tube caused by excessive loading displacement. Three loading rates of 0.01, 0.02, and 0.05 mm/s were selected to simulate the deformation rate of the slope when instability occurred, and 12 groups of GWMs were loaded at a uniform speed. The loading stroke of the press is used to represent the degree of slope instability deformation, and the guided wave signals and the displacement data of the press were collected during the test.
In this paper, two aspects are studied. The effect of different materials and particle sizes of the coupling medium and different diameter of waveguide rods on the guided wave parameters during the loading process, and optimization of the GWM material; By controlling the deformation rate of the shear model, the relationship between the deformation rate and the guided wave ring down count is analyzed.
3 Results and Analysis
3.1 Effect of Waveguide Rod Diameter, Coupling Medium Material and Particle Size on Flexural Guided Wave Ring Down Count Rate
The previous study (Deng et al., 2019) showed that the amplitude, root-mean-square and average signal level values of the guided wave signals are not closely related to the deformation and velocity during slope instability. At the same time, the ring down count rate is responsive to the evolutionary process of slope instability. Guided wave ring down count is the number of times the guided wave signal’s amplitude crosses the preset threshold voltage in a period. Guided wave ring down count rate is the sum of guided wave ring down count per unit time, and the guided wave ring down count rate can reflect the change characteristics of the guided wave signal source per second.
Figure 6 shows the flexural guided wave ring down count rate obtained from 12 groups of GWMs at a loading rate of 0.01 mm/s. During the test, the flexural guided wave ring down count rate collected from each GWM group shows an increasing trend as the deformation degree gradually increases. Under the force of the press, the loose coupling medium in the GWM is firstly compressed and deformed, and the overall flexural guided wave ring count rate is at a relatively low level in the first 300 s. Then, the concentrated medium particles interact with the waveguide rod in the center of the GWM to generate the flexural guided wave signals, and as the deformation of the GWM increases, the flexural guided wave signals appear more frequently.
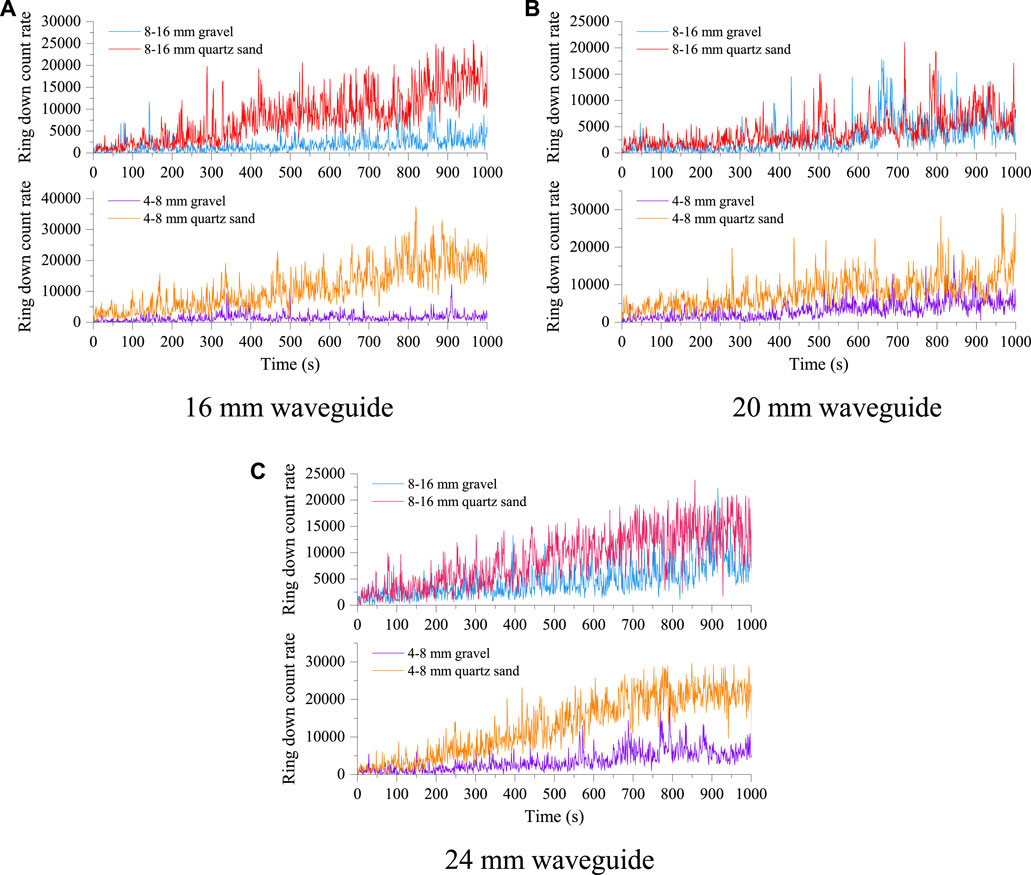
FIGURE 6. Flexural guided wave ring down count rate versus time.
In a GWM with the same diameter of the waveguide rod, quartz sand-filled coupling media particles produce more flexural guided wave ring down count rate and a more significant upward trend than gravel-filled media particles. The conclusions obtained by Kousteni (2002) in 2002 showed that for a given deformation, quartz sand produces more guided wave events. The size of the filled coupling media particles: 4–8 mm and 8–16 mm does not affect the overall trend of the flexural guided wave ring down count rate. However, it will affect the degree of oscillation of the guided wave ring down count rate. The flexural guided wave ring down count rate, obtained from the GWM with particle size variation range of 8–16 mm, is highly variable, and the data is more scattered, with more evident up and down oscillations. This phenomenon is because the relatively large size particles are crushed during the compression process, instantly generating violent bending guided wave signals. And guided wave ring count rate was more concentrated in the GWM with the particle size range of 4–8 mm. Filled with the identical media particles and changing the diameter of the waveguide rod, it was found that the small change effect of rod diameter on the flexural guided wave ring down count rate is not significant.
3.2 Effect of Waveguide Rod Diameter, Coupling Medium Material and Particle Size on the Cumulative Ring Down Count of Flexural Guided Waves
The cumulative ring down count is the accumulative superposition of the ring down count over a period, which reflects the change of the total data of the guided wave signals over a certain period. Figure 7 shows the curves of flexural guided wave ring down count obtained by the GWM at the loading rate of 0.01 mm/s. The cumulative ring down count of flexural guided waves with different rod diameters and coupling media shows an increasing trend, and the curves change smoothly without obvious abrupt change points.
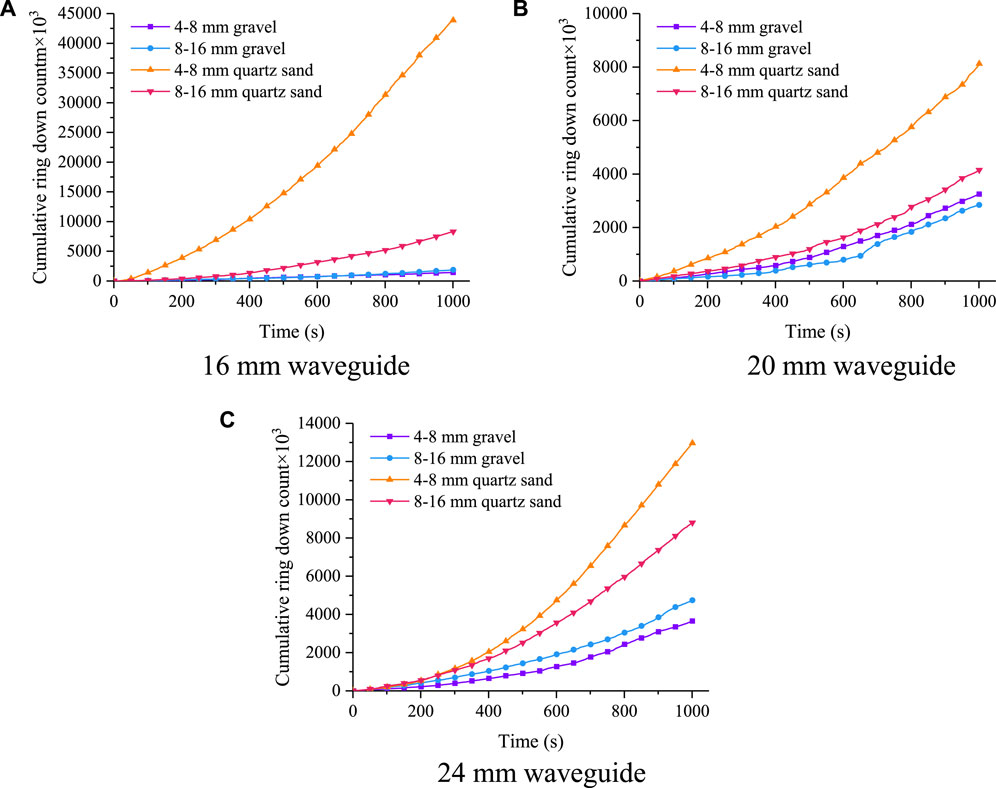
FIGURE 7. Flexural guided wave cumulative ring down count versus time.
In Figure 7, the cumulative ring down count of the 4–8 mm quartz sand-filled GWM increases the most, and the cumulative ring down count collected at the end of the stroke is the highest. The more grains required to fill the same volume of GWM with quartz sand of smaller particle size, the more mediums are in contact with the waveguide rod, and the more cumulative ring down count is generated. At the bottom of the curves is the gravel-filled GWM, where the cumulative ring down count obtained for 4–8 mm and 8–16 mm gravel materials are not significantly different; This is because the ring down count rate of the gravel-filled GWM is at a low level, as shown in Figure 6. Although small gravel particles produce more ring down count than large grains, it is also very limited. In the compression process, the gravel particles of relatively large size are crushed, which instantly produces strong flexural guided wave signals and affects the overall level, resulting in a less differentiated cumulative ring down count curve for gravel particles of different sizes.
With the increase of deformation, the accumulated ring down count, obtained from the GWM composed of 4–8 mm quartz sand and 16 mm waveguide rod, is much larger than those from the GWM composed of other coupling media and waveguide rods, and the fluctuation of the ring down count rate is smaller than others. Therefore, the GWM composed of 4–8 mm quartz sand and 16 mm waveguide rod is used as an optimized combination, and the effect of loading rate on the flexural guided wave signals of the optimized GWM is further discussed.
3.3 Effect of Deformation Rate on Flexural Guided Wave Ring Down Count
Figure 8 shows the variation curves of the ring down count rate of the optimized GWM at different deformation rates. The flexural guided wave ring down count rate obtained for each group of deformation rates shows an increasing trend, and the ring down count rate corresponding to different deformation rates is in the fan shape. When the deformation rate increases from 0.01 mm/s to 0.05 mm/s, the ring down count rate increases significantly. In Figure 8, the ring down count rate with deformation rate 0.01 mm/s is at the bottom of the image, followed by the ring down count rate with deformation rate 0.02 mm/s, which is at the middle of the image; the top curve of the image is the deformation rate of 0.05 mm/s. The ring down count rate at the end of the stroke fluctuates and shows a decreasing trend; this is because the interaction between the particles and the waveguide rod inside the rubber tube requires a certain amount of dislocation space to produce rich guided wave signals. In the process of continuous loading, the internal gap gradually decreases, resulting in a gradual increase in the number of particles interacting with the waveguide rod, and the number of the ring down count per unit of time increases; in the late stage of the stroke, there will also be insufficient dislocation space, and the force between the particles gradually reaches equilibrium, and no longer occurs in the slight misalignment, while the small increase in external loading is not enough to break the mutual “locking” between the particles, resulting in the GWM being bent, and the guided wave signal source no longer increases or even decreases.
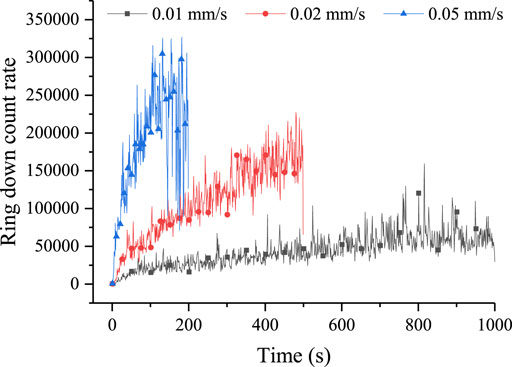
FIGURE 8. Variation curve of flexural guided wave ring down count rate with different deformation rate.
The influence of the deformation rate on the acoustic emission during rock deformation damage depends mainly on the internal friction intensity of the rock, which is determined by the friction area (related to the fracture) and the friction rate (depending on the strain rate) (Gao et al., 2018). In the GWM, the faster the deformation rate, the wider the range of particle displacement, and the more the number of particles rubbing and colliding with the waveguide rod per unit time, resulting in more ring down count crossing a preset threshold.
3.4 The Relationship Between Deformation Rate and Cumulative Flexural Guided Wave Ring Down Count
From Figure 9, it can be seen that there is a significant linear correlation between the cumulative flexural guided wave ring down count and the deformation of the optimized GWM at different deformation rates. According to the characteristics of the curves, the change of cumulative ring down count can be divided into two stages. Before the deformation reaches 3 mm, the growth of the cumulative ring down count curve is small, with an average slope of 2.486 × 10e6, and the correlation coefficient reaches more than 0.97; when the deformation reaches the end of 10 mm, the slope of the fitted curve increases significantly, with an average slope of 5.561 × 10e6. During the whole deformation process, the guided wave ring down count generated by the interaction between the particles and the waveguide rod become more and more intense as the deformation increases, so the cumulative ring down count of the GWM increases with the increase of deformation.
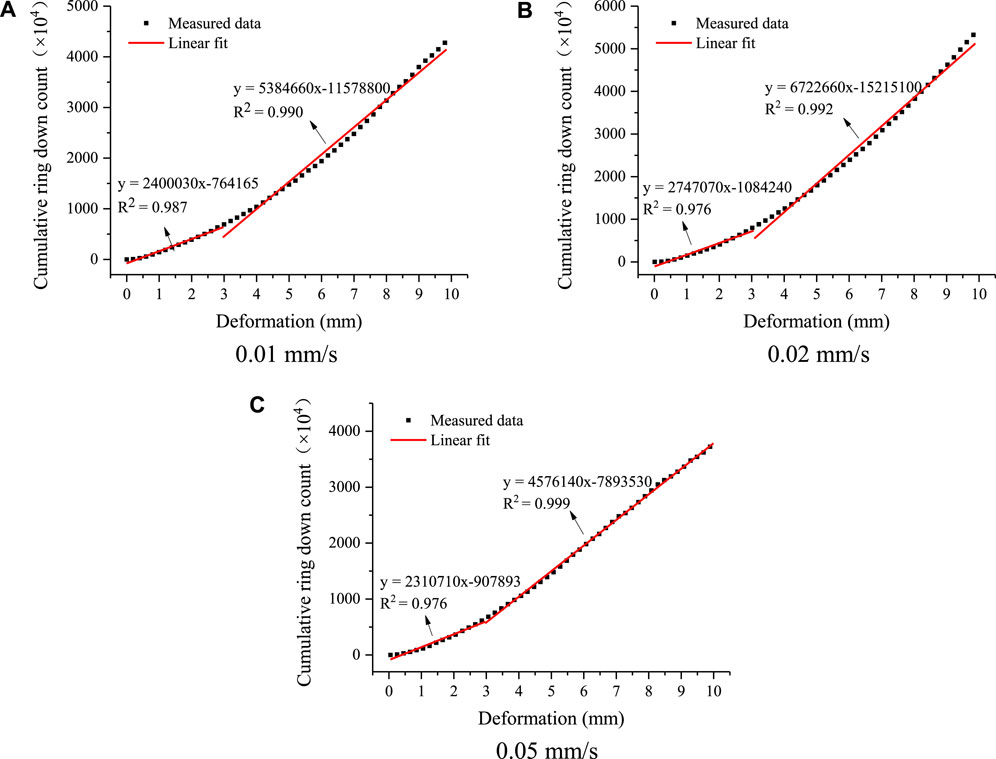
FIGURE 9. Linear relationship between cumulative ring down count and deformation of “guided wave meter” with different deformation rates.
As shown in Figure 10, there is a significant difference in the temporal characteristics of the cumulative ring down count obtained at different deformation rates. The slope of the fitted curve is approximated as the slope of the cumulative ring down count curve by linear fitting of the cumulative ring down count curve with time. With the deformation rate of 0.05 mm/s, the slope of the curve was the largest, and the average slope for the three tests is 2.13 × 10e5. There is a significantly reduced average slope of 1.07 × 10e5 with the deformation rate 0.02 mm/s, and the slightest average slope of 0.53 × 10e5 is for the deformation rate of 0.01 mm/s. There was an apparent correspondence between the deformation rate and the cumulative ring down count curve slope. Previous studies (Deng et al., 2019) also showed a good correlation between the rate and the acoustic emission rate.
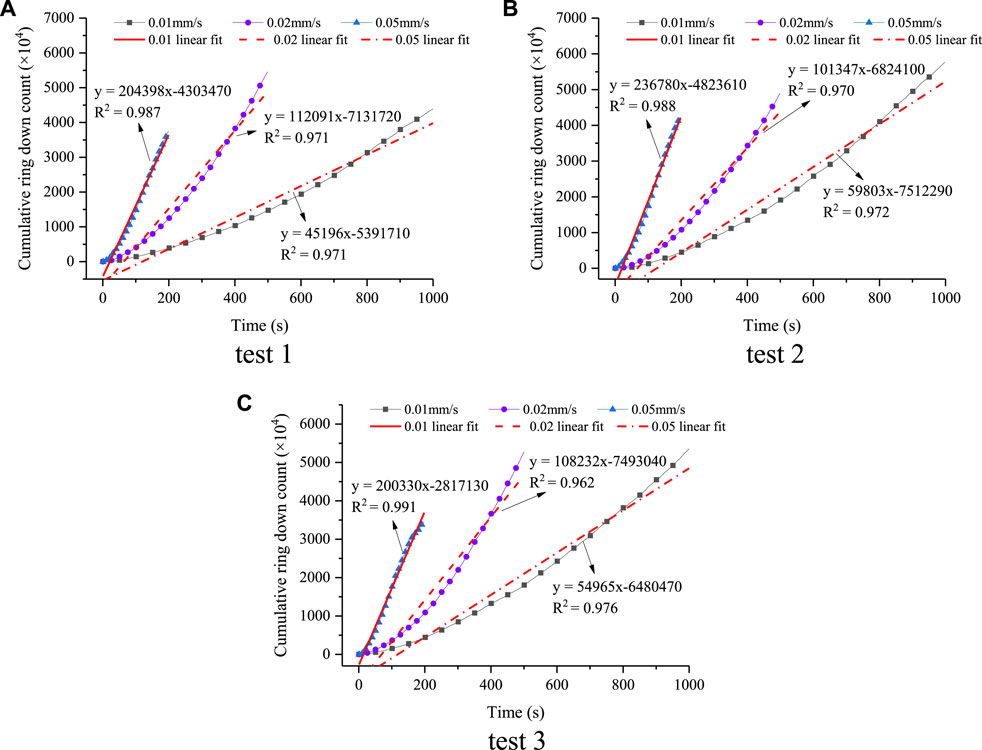
FIGURE 10. Cumulative flexural guided wave ring down count versus time with different deformation rates.
With the deformation rate as the horizontal coordinate and the slope of the cumulative ring down count curve as the vertical coordinate, the slopes of the cumulative ring down count curves obtained from different deformation rates correspond one by one, and the positions of several test data points are marked, as shown in Figure 11. The slope of the cumulative ring down count curve obtained from the same deformation rate is concentrated, and the deviation is slight, and the scattered points of these data are fitted. From Figure 11, it can be seen that there is an excellent linear correlation between the deformation rates and the slope of the cumulative ring down count curve, with the correlation coefficient reaching 0.977. The slope of the cumulative ring down count curve increases with the increase of the deformation rate, and this is consistent with the previous study (Smith and Dixon, 2015). The change in the slope of the cumulative ring down count curve can quantify the deformation rate of continuous landslides, which provides theoretical guidance for flexural guided wave monitoring of slope deformation rates.
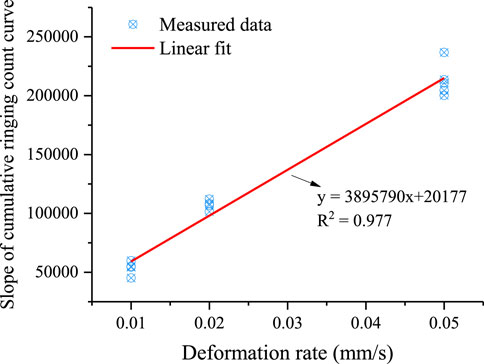
FIGURE 11. Linear relationship between deformation rate and slope of cumulative ring down count.
4 Conclusion
In this study, the relationship between the deformation rate of a slope and the flexural guided wave ring down count is investigated by controlling the deformation rate of a shear model of the GWM and collecting the flexural guided wave signals. The main findings are as follows.
(1) In the process of deformation loading, the flexural guided wave ring down count rate of GWM increases with the increase of deformation. The flexural guided wave ring down count rate generated by quartz sand-filled media particles is more than that of gravel-filled media particles, and the magnitude of the rising trend is also greater.
(2) The cumulative ring down count of the flexural guided wave can further distinguish the effect of the composition of the GWMs on the signals. The cumulative ring down count from the twelve sets of tests shows that the combination of 16 mm waveguide rod and 4–8 mm quartz sand coupling material as the optimized GWM can collect the strong guided wave signals.
(3) The flexural guided wave ring down count rate collected by the optimized GWM shows an increasing trend at different deformation rates, and the ring down count rate obtained at different deformation rates is distributed in the fan shape. The slope of the cumulative ring down count curve is approximated by linear fitting of the cumulative ring down count curve with time to quantify the deformation rate of the rocky slope. The results show an excellent linear relationship between different deformation rates and the slope of the cumulative ring down count curve, and the slope of the cumulative ring down count curve increases with the increase of deformation rates.
Data Availability Statement
The original contributions presented in the study are included in the article/supplementary material, further inquiries can be directed to the corresponding author.
Author Contributions
WH: Investigation, methodology, writing—review and; editing. CZ: Investigation, methodology, writing—original draft, writing—review and; editing. CH: Writing—original draft. HC: Methodology, data curation. CX: Formal analysis.
Funding
This research was supported by the National Natural Science Foundation of China (No. 51604127 and No. 51874268), the China Postdoctoral Science Foundation (No. 2019M650156), the Jiangxi Province Postdoctoral Fund (No. 2018KY41), and the Science and Technology Innovation Talent Project of Ganzhou City.
Conflict of Interest
Author CX was employed by the company Jiangxi Zhongliang Blasting Engineering Co. LTD.
The remaining authors declare that the research was conducted in the absence of any commercial or financial relationships that could be construed as a potential conflict of interest.
Publisher’s Note
All claims expressed in this article are solely those of the authors and do not necessarily represent those of their affiliated organizations, or those of the publisher, the editors and the reviewers. Any product that may be evaluated in this article, or claim that may be made by its manufacturer, is not guaranteed or endorsed by the publisher.
Acknowledgments
The authors would like to express their gratitude to all the research support. And finally, the authors would like to thank the reviewers and the handing editor for their valuable comments and suggestions.
References
Berg, N., Smith, A., Russell, S., Dixon, N., Proudfoot, D., and Take, W. A. (2018). Correlation of Acoustic Emissions with Patterns of Movement in an Extremely Slow-Moving Landslide at Peace River, Alberta, Canada. Can. Geotech. J. 55, 1475–1488. doi:10.1139/cgj-2016-0668
Chandler, R. J. (1984). Recent European Experience of Landslides in Over-consolidated Clays and Soft Rocks. Proc 4th Int Symp Landslides. 1, 61–81.
Cheon, D.-S., Jung, Y.-B., Park, E.-S., Song, W.-K., and Jang, H.-I. (2011). Evaluation of Damage Level for Rock Slopes Using Acoustic Emission Technique with Waveguides. Eng. Geology. 121, 75–88. doi:10.1016/j.enggeo.2011.04.015
Codeglia, D., Dixon, N., Fowmes, G. J., and Marcato, G. (2017). Analysis of Acoustic Emission Patterns for Monitoring of Rock Slope Deformation Mechanisms. Eng. Geology. 219, 21–31. doi:10.1016/j.enggeo.2016.11.021
Deng, L., Yuan, H., Chen, J., Sun, Z., Fu, M., Zhou, Y., et al. (2019). Experimental Investigation on Progressive Deformation of Soil Slope Using Acoustic Emission Monitoring. Eng. Geology. 261, 105295. doi:10.1016/j.enggeo.2019.105295
Dixon, N., Hill, R., and Kavanagh, J. (2003). Acoustic Emission Monitoring of Slope Instability: Development of an Active Waveguide System. Proc. Inst. Civil Eng. - Geotechnical Eng. 156, 83–95. doi:10.1680/geng.156.2.83.3752510.1680/geng.2003.156.2.83
Dixon, N., and Spriggs, M. (2007). Quantification of Slope Displacement Rates Using Acoustic Emission Monitoring. Can. Geotech. J. 44, 966–976. doi:10.1139/T07-046
Feng, X. J., and Zhang, R. Z. (2021). Influence of Loading Rate on Macro and Micro Formation Mechanism of Acoustic Emission Events in sandstone and Granite. Saf. Coal Mines 52 (5), 47–53. (in Chinese). doi:10.13347/j.cnki.mkaq.2021.05.009
Gao, X., Liu, S. J., Huang, J. W., Yang, Z. C., Mao, W. F., and Wu, L. X. (2018). The Influence of Strain Rate on AE Characteristics during Rock Deformation[J]. Chin. J. Rock Mech. Eng. 37 (04), 887–897. (in Chinese). doi:10.13722/j.cnki.jrme.2017.0939
Hardy, H. (2003). Acoustic Emission/Microseismic Activity. Principles, Tech. Geotechnical Appl. 1, 55–58. doi:10.1201/9780203971109
Hu, W., Scaringi, G., Xu, Q., Van Asch, T. W. J., Huang, R., and Han, W. (2018). Suction and Rate-dependent Behaviour of a Shear-Zone Soil from a Landslide in a Gently-Inclined Mudstone-sandstone Sequence in the Sichuan basin, China. Eng. Geology. 237, 1–11. doi:10.1016/j.enggeo.2018.02.005
Hungr, O., Leroueil, S., and Picarelli, L. (2014). The Varnes Classification of Landslide Types, an Update. Landslides 11, 167–194. doi:10.1007/s10346-013-0436-y
Irfan, M., Uchimura, T., and Chen, Y. (2017). Effects of Soil Deformation and Saturation on Elastic Wave Velocities in Relation to Prediction of Rain-Induced Landslides. Eng. Geology. 230, 84–94. doi:10.1016/j.enggeo.2017.09.024
Koerner, R., McCabe, W., and Lord, A. (1975). “Acoustic Emission Studies of Soil Masses in the Laboratory and Field,” in Proceedings of the 1st Conference on Acoustic Emission/Microseismic Activity in Geological Structures and Materials (Claustha, Germany: The Pennsylvania State University; Trans Tech Publications), 243–256.
Koerner, R. M., McCabe, W. M., and Lord, A. E. (1981). Overview of Acoustic Emission Monitoring of Rock Structures. Rock Mech. 14, 27–35. doi:10.1007/BF01239775
Kousteni, A. (2002). Investigation of Acoustic Emission Waveguide Systems for Detecting Slope Instability. Ph.D. thesis. Nottingham, UK: Department of Civil and Structural Engineering, The Nottingham Trent University.
Li, X. L., Tang, H. M., and Wang, L. C. (2014). Centrifuge Modelling Tests on Dynamic Failure of Bedding Rock Slopes. Chin. J. Rock Mech. Eng. 33 (4), 729–736. (in Chinese). doi:10.13722/j.cnki.jrme.2014.04.008
Liao, J., Li, J. T., Hao, R. Q., and Liu, B. (2014). Stability of Consequent Rock Slopes and Analysis of Prestressed Anchors Reinforcement. J. Cent. South Univ. (Science Technology) 45 (1), 231–234. (in Chinese).
Lu, W., Bai, B., and Chen, C. X. (2011). Analysis of Mechanism of Plane Sliding Failure for Bedded Rock Slopes. Rock Soil Mech. 32 (S2), 204–207. (in Chinese). doi:10.16285/j.rsm.2011.s2.020
Petley, D. N., Higuchi, T., Petley, D. J., Bulmer, M. H., and Carey, J. (2005). Development of Progressive Landslide Failure in Cohesive Materials. Geol 33, 201–204. doi:10.1130/g21147.1
Smith, A., Dixon, N., and Fowmes, G. J. (2017). Early Detection of First-Time Slope Failures Using Acoustic Emission Measurements: Large-Scale Physical Modelling. Géotechnique 67 (2), 138–152. doi:10.1680/geot./15-P-20010.1680/jgeot.15.p.200
Smith, A., Dixon, N., Meldrum, P., Haslam, E., and Chambers, J. (2014). Acoustic Emission Monitoring of a Soil Slope: Comparisons with Continuous Deformation Measurements. Géotechnique Lett. 4, 255–261. doi:10.1680/geolett.14.00053
Smith, A., and Dixon, N. (2015). Quantification of Landslide Velocity from Active Waveguide-Generated Acoustic Emission. Can. Geotech. J. 52, 413–425. doi:10.1139/cgj-2014-0226
Keywords: bedding slope, guided wave meter, flexural guided wave, ring down count, deformation rate
Citation: Zheng C, He W, Huang C, Chen H and Xiao C (2022) Quantification of Bedding Rock Slope Deformation Rate Using Guided Wave Monitoring. Front. Earth Sci. 10:809421. doi: 10.3389/feart.2022.809421
Received: 05 November 2021; Accepted: 03 January 2022;
Published: 21 January 2022.
Edited by:
Faming Huang, Nanchang University, ChinaReviewed by:
Yun Zheng, Institute of Rock and Soil Mechanics (CAS), ChinaJi Wang, Ningbo University, China
Copyright © 2022 Zheng, He, Huang, Chen and Xiao. This is an open-access article distributed under the terms of the Creative Commons Attribution License (CC BY). The use, distribution or reproduction in other forums is permitted, provided the original author(s) and the copyright owner(s) are credited and that the original publication in this journal is cited, in accordance with accepted academic practice. No use, distribution or reproduction is permitted which does not comply with these terms.
*Correspondence: Wen He, aGV3ZW5Aanh1c3QuZWR1LmNu